geomechanics of hydraulic fracturing microseismicity...
TRANSCRIPT

Geomechanics of hydraulicfracturing microseismicity:Part 2. Stress statedeterminationSeth Busetti and Ze’ev Reches
ABSTRACT
We investigate the hydraulic fracturing process by analysis of theassociated microseismicity. In part 1, we recognized double-couple and hybrid microseismic events and their fault plane orien-tations. Critical stress (instability) and stress inversion techniqueswere used to assess fracture activation conditions. In part 2, weapply results from the tensile source model to investigate howactivated faults relate to the stress state and geologic setting. Weassess potential mechanisms for induced microseismicity includ-ing leakoff and diffuse pressurized fracture network flow, stressshadowing adjacent to large parent hydraulic fractures, and cracktip stress perturbations. Data are from the Mississippian BarnettShale, Texas, and include microseismic events from sequentialpumping stages in two adjacent horizontal wells that wererecorded in two downhole monitor wells, as well as operations,wellbore-derived stress, and natural fracture data.
Results point to activation of inclined faults whose orientationis dominantly northeast–southwest and vertical north–southfaults. The activation stress states for a range of modeling scenar-ios show stress rotation, decreased mean stress, and increaseddeviatoric stress. This stress state cannot be explained by sidewallleakoff in the stress shadow region adjacent to hydrofractures, butis consistent with hybrid and shear activation obliquely ahead ofpressurized fractures. Information about hydrofracture evolutionand operationally related dynamic stress change is obscured bygeomechanical heterogeneity that is likely geologic in nature.The most compelling observation is that the most highly misor-iented microseismic faults occur in the same vicinity as acarbonate-dominated submarine fan feature that was previouslyexpected to act as a minor fracture barrier.
Copyright ©2014. The American Association of Petroleum Geologists. All rights reserved.
Manuscript received July 15, 2013; provisional acceptance January 16, 2014; revised manuscript receivedFebruary 03, 2014; final acceptance May 14, 2014.DOI: 10.1306/05141413124
AUTHORS
Seth Busetti ∼ ConocoPhillips, 600 N.Dairy Ashford, Houston, Texas 77079;[email protected]
Seth Busetti received a B.S. degree ingeological engineering from the ColoradoSchool of Mines and an M.S. degree andPh.D. in structural geology from theUniversity of Oklahoma. Busetti is currentlyemployed by ConocoPhillips and works in asubsurface technology position focusing onapplied structural geology andgeomechanics problems worldwide. He isinvolved in projects involving fracture andfault mechanics, fluid flow in fracturedreservoirs, and geomechanics innonconventional reservoirs.
Ze’ev Reches ∼ ConocoPhillips School ofGeology and Geophysics, University ofOklahoma, 100 East Boyd Street Suite 710,Norman, Oklahoma 73019; [email protected]
Ze’ev Reches received B.S. and M.S. degreesin geology from Hebrew University, Israel,and a Ph.D. in structural geology fromStanford University. Reches serves asprofessor of structural geology at theUniversity of Oklahoma. His prior workincludes positions at Arizona StateUniversity, Stanford University, and USGeological Survey at Menlo Park, California,and Hebrew University, Israel. Researchinterests include earthquake and faultprocesses and rock mechanics.
ACKNOWLEDGEMENTS
We thank ConocoPhillips Technology andConocoPhillips Mid-Continent Business Unitfor permission to publish the data and ourfindings. Brad Bankhead and his teamdeveloped the Stocker geophysical researchprogram and encouraged thisgeomechanical effort. We thank TedDohmen, Mark Willis, Samik Sil, Joe Zhou,Ray Reid, Pijush Paul, Peter Hennings, RaoulTreverton, Anastasia Mironova, Bruce Hart,and the many other technical contributors tothe project. We appreciate the thoughtfulfeedback on technical framing and analysisfrom ConocoPhillips’ Seismic Analysis groupthat helped substantiate continuation of the
AAPG Bulletin, v. 98, no. 11 (November 2014), pp. 2459–2476 2459

INTRODUCTION
Microseismic monitoring is a widely used tool to map hydraulicfractures for optimizing borehole position, stimulated rock vol-ume, and production parameters, as well as for real-time monitor-ing of hydraulic fracture growth. The activation mechanisms ofthe microseismic events are difficult to determine and still poorlyunderstood. Thus, only a few tools exist for objectively discerningthe mechanisms of microseismicity, and analysis of microseismicpatterns is commonly based on idealized models of hydraulic frac-turing. Hydraulic fracture experiments indicate that nearly alldetected acoustic emissions events are in immediate proximity tothe large, induced hydraulic fractures (e.g., Byerlee and Lockner,1977; Ishida et al., 2004; Athavale and Miskimins, 2008;Chitrala et al., 2011). Following this experimental finding for fielddata, one might ignore sparse or detached microseismic events orevents that are inconsistent with the expected linear trend of thehydraulic fracture. Further, fault and fracture interactions in thefield and complex reservoir behavior are not represented inthe small-scale laboratory setting. Other approaches, whichinclude fractal analysis of microseismicity or magnitude distribu-tion (Vermylen and Zoback, 2011; Grob and van der Baan,2011; Sil et al., 2012), provide rational hypotheses about the insitu stress regime that are likely to be oversimplified.
Our present objective is to improve the interpretation of thehydraulic fracturing process by determination of fault orientationsof microseismic events, calculation of the activating stress, andrelating this activation to the hydraulic fracture. We assume thatthe microseismic events reflect activation of critically stressednatural fractures and faults in the reservoirs, but we make noassumptions about the expected shape and evolution of thehydraulic fracture. By solving for focal mechanisms and activa-tion stresses of field data, we anticipate to minimize the bias inthe microseismic interpretation.
We envision that microseismic events occur in three generalregions relative to the induced hydraulic fracture(s) (Figure 1):
1. Events that are adjacent to the parent hydraulic fracture, arelikely to be related to leakoff of pressurized fluid from the frac-ture side-wall, and may occur in the zone of compressive stressshadowing (e.g., Pearson, 1981; Barree and Mukherjee, 1996;Ramurthy et al., 2007; Zoback et al., 2012) (Figure 1A).
2. Events caused by pervasive diffuse fluid flow in a criticallystressed natural fracture network (Hennings et al., 2012).These events may indicate shear mechanisms regardless ofthe parent fracture origin that may be tensile (Figure 1B). Thepressurization of the natural fracture network can generate
research. Microseismic processing andmoment tensor inversion (MTI) wasperformed by Magnitude, Baker Hughes.Most of the calculations and advanced plotswere completed using Matlab. We also usedfracture plotting tools in FracMan (GolderAssociates). Lastly, thanks to Alan Morris,David Haddad, and an anonymous reviewerfor reviewing the manuscript and providingvery helpful comments and edits.The AAPG Editor and special issue editorDavid A. Ferrill thank the following reviewersfor their work on this paper: David E.Haddad, Alan P. Morris, and an anonymousreviewer.
2460 Geomechanics of Hydraulic Fracturing Microseismicity Part 2

structural permeability and fluid redistributionwithin the network (e.g., Sibson, 1996).
3. Events close to the hydraulic fracture tip, which isa zone of amplified stress field due the hydraulicfracture propagation (Figure 1C). The expectedtensile, shear, and hybrid fractures (part 1, Busettiet al., 2014, this issue) facilitate the hydrofracturegrowth by linking the stress-induced fractures.This mechanism is akin to process zone mechanicsduring fault propagation (Reches and Lockner,1994), brittle fracturing preceding fluidized pres-sure pulses in dikes (Baer, 1991), and tensile dam-age fracturing (Busetti et al., 2012).
We apply the approach previously described inthis paper to a microseismic data set from theMississippian Barnett Shale, Fort Worth Basin,which is a large unconventional gas field that requireshydraulic fracture stimulation to produce (Figure 2).It is widely recognized that the local structure, naturalfractures, and the stress state affect the hydrofracturepattern in the Barnett Shale (e.g., Fischer et al.,2005; Daniels et al., 2007; Roth and Thompson,
2009). Gale et al. (2007) studied natural fractures incores of Barnett Shale and concluded that preferentialreactivation of the pre-existing fracture networkcould affect hydrofracture stimulations by redirectingfluid flow, a concept further investigated by Busettiand Reches (2007), Gale and Holder (2008), Busetti(2009, 2010), Kassis and Sondergeld (2010), Sil et al.(2012), and Zoback et al. (2012).
GEOLOGIC SETTING
Regional and Local Structures
The Fort Worth Basin is a north–south elongatedforeland basin that formed in front of the Ouachitathrust belt during the late Paleozoic (Walper, 1982).The basin is bound by gentle arches (Figure 2), themost dominant being the Bend arch to the west, abroad north-plunging flexure and structural highthought to have formed as a hinge-line during LateMississipian subsidence and when the basin tiltedwestward during the late Paleozoic (Pollastro et al.,2007). The northeast gently dipping (2–3°) regionalstructure coincides with the thickening of theBarnett Shale from 30 to 50 ft (9 to 15 m) thick atLlano uplift to ∼1000 ft (∼305 m) at Muenster arch.The reservoir consists of Mississippian sequences ofheterogeneous mudstone (Singh, 2008) with low(hundreds of nanodarcys) matrix permeability(Mayerhofer et al., 2006). It lies below thePennsylvanian Marble Falls Limestone and uncom-fortably sits above heavily karsted Ordovician car-bonates in the Viola Group in the northeast and thewater-bearing Ellenberger Group to the southwest.The field includes minor northeast–southwest-striking high-angle normal faults and graben struc-tures, and north–south striking faults associated withthe Mineral Wells fault system in the northeast andthe Ouachita structural front to the east (Figure 2)(Simon, 2005; Pollastro et al., 2007). Some of thesefaults were periodically reactivated and may be base-ment related (Montgomery et al., 2005). The domi-nant structural features in the field are the smallflexures, faults, and fracture corridors related to karstcollapse in the underlying Ordovician EllenbergerGroup that pervade the Mississippian to MiddleOrdovician strata (Hardage et al., 1996).
Figure 1. Concept model for microseismic activation. (Top)three-dimensional finite element stress model for an idealizedplanar, elliptical hydrofracture. Color contours indicate relativestress magnitude: warm colors are more tensile and cool colorsare more compressive. Insets reflect prospective activation zones(A) adjacent to the hydrofracture (HF) walls in the stress shadow(SS), (B) diffusely spread around the hydrofracture in a naturalfracture network, and (C) in the crack tip perturbation region(CTP).
BUSETTI AND RECHES 2461

Local Control of the Structural Heterogeneity
The structural features (fractures, faults, folds) andcurrent stress field in Barnett Shale were attributedto the following agents:
1. Collapse-related flexures, faults, and fracture cor-ridors. For example, seismic interpretation in thesouthwestern part of the basin (Baruch, 2009)
indicated the presence of two dominant sets of lin-eaments (north–northwest and north–northeast)spaced 100–1000 ft (30.48–304.8 m) that originatefrom the underlying carbonate units, and locallyextend upward past the overlying MarbleFalls unit. The subvertical corridors form a coales-cent rectilinear network of synformal sags, inter-preted as collapsed paleocaves (Loucks, 1999;McDonnell et al., 2007; Baruch, 2009), some of
Figure 2. Map showing locationof the Barnett Shale play and majorstructural features. Contour lines(interval = 1000 ft [305 m]) are forthe top of the OrdovicianEllenberger group (Montgomeryet al., 2005, used with permissionof AAPG). The present study areain Denton County is indicated.
2462 Geomechanics of Hydraulic Fracturing Microseismicity Part 2
which may be related to basement-fault reactiva-tion (Elibiju, 2009).
2. Lithologic variations that induce stress changesresulting from stiffness contrasts. At least nine dis-tinct lithofacies have been identified from BarnettShale cores (Singh, 2008), and four main subdivi-sions of the lower Barnett were described fromlog data for the study wells (Roy et al., 2014).Analyses of cores, borehole image logs, andgamma-ray logs indicated that the typical layerthickness is less than 1 m (<3 ft). Roy et al.(2014) suggested that carbonate fan bodies locatednear the present study area acted like a local frac-ture barrier.
3. Over-pressurization and pore-pressure variations.Estimates of the pore pressure based on the initialformation pressure during pump-in tests for ahandful of wells studied by Busetti (2009) indi-cated a range of 0.489–0.524 psi/ft, which is
consistent with the value of 0.52 psi∕ft reportedfor the Barnett Shale in Montgomery et al. (2005).
Study Area
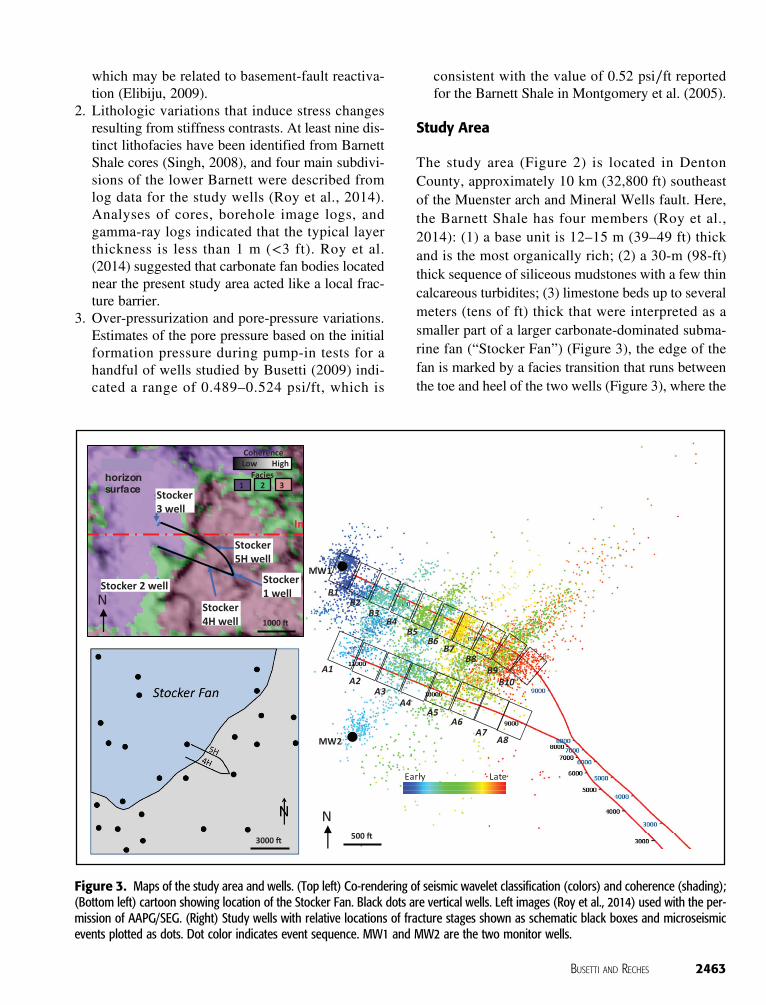
The study area (Figure 2) is located in DentonCounty, approximately 10 km (32,800 ft) southeastof the Muenster arch and Mineral Wells fault. Here,the Barnett Shale has four members (Roy et al.,2014): (1) a base unit is 12–15 m (39–49 ft) thickand is the most organically rich; (2) a 30-m (98-ft)thick sequence of siliceous mudstones with a few thincalcareous turbidites; (3) limestone beds up to severalmeters (tens of ft) thick that were interpreted as asmaller part of a larger carbonate-dominated subma-rine fan (“Stocker Fan”) (Figure 3), the edge of thefan is marked by a facies transition that runs betweenthe toe and heel of the two wells (Figure 3), where the
Figure 3. Maps of the study area and wells. (Top left) Co-rendering of seismic wavelet classification (colors) and coherence (shading);(Bottom left) cartoon showing location of the Stocker Fan. Black dots are vertical wells. Left images (Roy et al., 2014) used with the per-mission of AAPG/SEG. (Right) Study wells with relative locations of fracture stages shown as schematic black boxes and microseismicevents plotted as dots. Dot color indicates event sequence. MW1 and MW2 are the two monitor wells.
BUSETTI AND RECHES 2463

fan and more calcareous beds are near the toes of thewells; and (4) the top unit is 120–130 m (393–427 ft)of interbedded limestones and siliceous mudstones,and was interpreted as a series of stacked carbonatesubmarine fan complexes (Roy et al., 2014).
We analyze the hydraulic fracturing in twohorizontal wells, Stocker 4H and 5H (Roy et al.,2014, Sil et al., 2012, also insets in Figure 3), thatare termed here as wells A and B, respectively.Image logs in the vertical, build, and lateral sectionsof well A were interpreted in detail for natural frac-tures by ConocoPhillips (R. Reid, 2010, personalcommunication). A total of 1246 fractures werepicked in the Barnett interval, revealing a primarysubvertical northeast–southwest set (n = 541, meanorientation = 036°∕58.4° in right-hand rule strike/dip format), which was more clearly imaged in thehorizontal section, whereas the more gently dippingfractures were picked in the build sections of the well(n = 663, mean orientation = 028°∕64°). A secon-dary north–south fracture set was also imaged, con-sisting of about 100 nearly vertical fractures withstrike between 150 and 180°.
Initial in Situ Stress for the Study Area
The preoperational in situ reservoir stress state wasdetermined using drilling data (mud weight) anddrilling-induced fractures (P. Paul, ConocoPhillipsinternal report). The analysis was based on 54 drilling-induced tensile fractures observed on image logs,and stress magnitudes were determined using thestress polygon technique (Zoback, 2007). Rockmechanics data were not collected on the study wells,and we used uniaxial strength data from core labora-tory testing from an offset well. The calculated trendof the axis of maximum horizontal compression,SHmax, is 043°, and stress magnitudes are Sv =1.05 psi∕ft, SHmax = 1.0 psi∕ft, SHmin = 0.7 psi∕ft,and Pp = 0.5 psi∕ft, in which Sv is the vertical, over-burden gradient, which here is the maximum stress,σ1; SHmax ≈ σ2; SHmin is the minimum horizontalstress gradient ≈ σ3; and Pp is the normal pore pres-sure gradient. Thus, the in situ stress state indicatesnormal faulting conditions with expected hydraulicfracture propagation toward azimuth 043°.
ANALYSIS APPROACH
The present analysis is based on 7444 microseismicevents that were induced by hydraulic fracturing intwo horizontal wells in the Barnett Shale (Figures 3, 4).In part 1, (Busetti et al., 2014, this issue) we used thesource parameters and focal planes of these events toidentify and separate shear, tensile, and hybrid sourcemechanisms based on two different source models(part 1, Busetti et al., 2014, this issue, Appendix 1),and to conduct stress inversion on the entire micro-seismic population (part 1, Busetti et al., 2014, thisissue, Appendix 2). Here, we make a major changeto the analysis and only the tensile source model thatcorrects fault plane orientation for tensile/compres-sive events is used for fault plane derivation follow-ing Vavrycuk (2001, 2011). It is expected that thefluid injection associated with hydraulic fracturingwould activate shear fractures and hybrid events withmixed opening or closing modes (see part 1, Busettiet al., 2014, this issue).
The calculations are presented in the followingscenarios:
1. Events activated by preoperational in situ stress2. Events activated by stress inversion stress state
a. Complete microseismic population (7444events)
b. Events stage-by-stage3. Additional computations (Appendix)
a. Detailed investigation of Stage B8subpopulationi. Events as a function of distance from the
wellboreii. Events as a function of time/sequence of
injection
b. Activation stress as a function of friction
The first scenario ignores the stress inversionconcept and instead considers the preoperational insitu reservoir stress state, assuming that regardless ofstress perturbations induced by the hydrofracture,the preoperational in situ stress controls microseismicactivation. In this case, the injected hydrofracturefluid (leaked-off) activates only fractures and faultsthat (1) are critically loaded by the tectonic stressstate; and (2) intersect the hydrofracture (Barree and
2464 Geomechanics of Hydraulic Fracturing Microseismicity Part 2

Mukherjee, 1996; Ramurthy et al., 2007; Zoback et al.2012). For this case, we assume that the stress state isspatially uniform and equal to the preoperational insitu stress; the pore pressure may locally increaseand activate the most critically stressed fracturescaused by in situ stresses.
Scenarios 2a and 2b invoke the stress inversion ofthe microseismic events without assuming any con-trolling stress state. Instead, the fault activation isassumed to reflect the local stress state of a generalstress field (Gephart and Forsyth, 1984; Leclere andFabbri, 2013). To select the slipping fault plane ofeach pair of focal planes for a given microseismicevent, we follow the procedure of part 1 and selectthe fault plane with the higher stress in the computed,
initial stress inversion; this selection is based onthe critical pore fluid pressure, Pcritical, (part 1, Busettiet al., 2014, this issue). Here, Pcritical indicates thepore pressure required for shear failure to occur.A second stress inversion is then run on the selectedfaults to determine the activation stress state.
If the results of stress inversion calculations aresimilar to the preoperational in situ stress state, sce-nario 1 is supported, and preferential leakoff fromthe hydrofracture plane is the main activation mecha-nism. However, if the stress inversion results signifi-cantly differ from the in situ state, other mechanismsare required. Scenario 2a uses all of the microseismicevents in the stress inversion, whereas in scenario 2b,the stress inversion is performed independently for
Figure 4. Map and three-dimensional views of stage B8 with microseismic events colored by event sequence. Grid spacing is 500 ft(152.4 m).
BUSETTI AND RECHES 2465

subsets of microseismic events grouped by eachinjection stage. If activation stress results for the indi-vidual hydraulic fracture stages (Figure 2) are similarto each other and to the stress state of all events (sce-nario 1b), then the results support geomechanical uni-formity throughout the stimulation area, and viceversa if the stress results differ by subpopulation.
The additional scenarios (3a–3b) are provided inAppendix.
RESULTS
Solution Displays
The computation results are presented in a series ofdisplays (Figures 5–8, A1) and in Table 1:
1. Mohr diagrams for scenarios 1 and 2a (Figure 5)using friction of μ = 0.6 and cohesion C = 0.
2. The three-dimensional (3-D) mean stress p 0 anddeviatoric stress q for each case and as a functionof friction (Figure 6), in which
p 0 = 1∕3ðσ1 + σ2 + σ3Þ (1)
q= ð1∕2½σ1 − σ3�2 + 1∕2½σ2 − σ3�2 + 1∕2½σ1 − σ2�2Þ1∕2(2)
3. Stereonets of the critical stress, Pcritical, (Figures 7, 8)(Part I for definition).
4. Map of microseismic fault misorientation(Figure 9).
5. Computed stress as a function of distance from thewellbore and sequence for hydraulic fracture stageB8 (Figure 4 and A1).
Note that the calculations and Table 1use the continuum mechanics convention ofcompression = negative; however for plotting pur-poses the Mohr diagrams and stereonets dis-play compression = positive.
Stress Tensor Results
Stress Magnitude and OrientationThe magnitude of the primary stresses for the preop-erational in situ stress state (scenario 1) and the acti-vation stress state from inversion of all events(scenario 2a) are listed in Table 1 and displayed onMohr diagrams in Figure 5A, B, respectively. Theselected fault planes are plotted for each case. Allfaults are colored by the deviation angle α, theamount the slip vector deviates from pure in-planemotion (see Busetti et al., 2014, this issue). FromBusetti et al. (2014, this issue), the faults with jαj >60° generally correspond to vertical north–south ori-ented faults, whereas jαj < 60° corresponds toinclined northeast–southwest faults. For both scenar-ios, faults cluster toward the failure line. We expectedthe dilatant events (red) to cluster to the lower left.However, the opening, closing (blue), and pure shear(green) events occur in many orientations. For stressinversion case 2a (Figure 5B), there is a cluster ofhigh jαj faults (normal stress of 20 to 25 MPa [2900to 3626 psi]) that are misoriented in the stress field.
The orientations of the primary stresses are givenby the eigenvectors of the stress tensor, Table 1, andvary depending on the fault population used in the
(A)
(B)
Figure 5. Mohr diagrams for model configurations 1 and 2awith selected fault planes plotted. Blue dots indicate closingevents α approaching -90°; green dots are jαj approaching 0°;and red dots are dilatant events α approaching 90°. The inclina-tion angle α indicates the angle between the slip direction andthe fault plane (see Busetti et al., 2014, this issue). Shear failureline is shown in red with coefficient of friction μ = 0.6 and cohe-sion C = 0. (A) is the preoperational in situ stress state and(B) displays the computed stress state from stress inversion.
2466 Geomechanics of Hydraulic Fracturing Microseismicity Part 2

stress inversion. Whereas the wellbore-derivedpreoperational in situ stress field assumes a verticalprimary stress axis and indicates maximum horizontalstress of 043°, the computed stress fields are rotatedin three-dimensions, with SHmax azimuth rangingfrom 014 to 178° stage-by-stage, or 065° for stressinversion using all events. The computed maximumprimary stress, σ1, for all cases indicates a normalfaulting regime and is similar to the in situ state,but σ1 deviates from vertical for nearly all of theinversion scenarios (Table 1) (i.e., the z-componentof the eigenvector corresponding to σ1 is less than1). We interpret the deviation from the preoperationalin situ state to indicate that the microseismic eventsactivated under stress-perturbed conditions.
Stress Path Variables p 0 and qStress results in terms of mean and deviatoric stress,p 0 and q, are displayed in Figure 6. Parameters p 0
and q are similar to shear and normal stress on aMohr diagram (Figure 5), but include dependency ofthe intermediate stress. Points upward and to the leftindicate relative proximity to fail in shear; pointslower and to the left indicate relative proximity to failin tension. Figure 6 shows the results for each
scenario, in which the preoperational in situ stressstate of case 1 is plotted as the red square, case 2a isthe large blue circle, and the yellow triangles are thestage-by-stage results of scenario 2b. The small bluedots are for scenario 2a as a function of friction,which is discussed in Appendix. The preoperationalin situ stress state of case 1 and the full-populationstress inversion stress field of case 2a have verysimilar results in p 0-q space (Figure 6), for example,similar propensity to fail, but the stress orientationand magnitudes differ (Table 1, Figure 5). Scenarios1 and 2a have high mean stress and low deviatoricstress and are the most stable fields, along withstages A4, A5, A7, B6, and B7, which form a grouplocated near the center of both wells that have similaractivation stress states (Table 1 and Figure 7). Theremaining stages form a nearly linear trend in p 0-qspace (e.g., A8b, B8, B9… A8a; Figure 6) that gener-ally coincides with the prescribed Mohr failure line(dashed red line in Figure 6; the relationship betweenthe failure line in Mohr and p 0-q space is given as
q = ½6 sinðatanðμÞÞ∕ð3 − sinðatanðμÞ�p+ ½6 cosðatanðμÞÞ∕ð3 − sinðatanðμÞ�; (3)
Figure 6. (Left) mean stress p 0 versus deviatoric stress q and (right) SHmax aximuth versus the ratio q∕p 0. The red square is the insitu preoperational stress state of Case 1a and the large blue circle is from stress inversion of all events in Case 1b. The yellow trianglesare the stage-by-stage results for Case 2a with stage numbers labeled. The small blue circles are for Case 1b as a function of friction.The equivalent Mohr failure friction lines are plotted in dashed red lines for μ = 0.6 and μ = 0.8, in whichq = ½6 sinðatanðμÞÞ∕ð3 − sinðatanðμÞ�p + ð6 cosðatanðμÞÞ∕ð3 − sinðatanðμÞÞ.
BUSETTI AND RECHES 2467

in which μ and C are the friction coefficient and cohe-sion in Mohr space).
Regional Stress Heterogeneity
Activation Stress Stage-by-StageWe applied stress-inversion calculations on all 18 hydro-fracture stages, A2–A8 and B1–B10 (scenario 2a).
The results (Table 1) are graphically presentedby the calculated the stress tensor, p 0 and q,(Figure 6), and the critical pore pressure Pcritical ster-eoplots (Figures 7, 8). Table 1 and the p 0-q plot inFigure 6 capture the range in stress magnitudes foreach injection stage, marked as the yellow trianglesin Figure 6. Calculated pressure stress p 0 ranges from−15.2 to −26.5 MPa; deviatoric stress q ranges from
Figure 7. Microseismic map with overlay of Pcritical stereonet plots for each stage. Fluid pressure required for shear failure is plotted,using the configuration of Case 4 stress inversion on a stage-by-stage basis.
2468 Geomechanics of Hydraulic Fracturing Microseismicity Part 2

to 10.9 to 31.8 MPa (1580.9 to 4612.1 psi) (note stageA1 gives anomalous stress results).
We present the Pcritical results on stress stereonets(e.g., Zoback, 2007) for each stage in map view(Figure 7), as well as Pcritical and fault orientationsfor stages B1, A7, and B8 (Figure 8). The Pcritical
value is the pore pressure that is required to allow slipon a given fracture subjected to a given stress state.Here, Pcritical was solved for all possible fault orienta-tions from 0°≤ strike≤ 360° and 0°≤ dip≤ 90°, plot-ted as poles to planes in stereonet view (Figures 7, 8).Red shading indicates orientations of unstable faultswhereby the activation stress state is near or, in somecases, exceeds the shear failure criteria. Blue colorsindicate orientations of stable faults that requirereduced σ3 to slip. Computed stress for each stage dif-fers and the only systematic trend is that for moststages, σ1 is inclined from vertical and σ2 lies in thenortheast–southwest quadrants. Stress fields fromstages B1, B2, B3, B4, and B5 are oriented similarlyand they indicate a considerable part of the potentialrange of fault orientations to be critically stressed byas much as 20–30 MPa (2900 to 4351 psi) (orange-red zones, Figure 7). Stages A2 and A3 also indicatecritical state of 10 MPa (1450 psi) (yellow zones,Figure 7). An abrupt change in pattern appearsbetween stages B5 and B6 and A3 and A4, andbetween stages A7 and A8 and B7 and B8. The stagesclosest to the heels of the wells also have a similarstress field, with more north–south oriented σ2, andare more critically stressed (yellow-orange zones,Figure 7).
Fault MisorientationWe plotted interpolated critical stress results for eachstage in map view in Figure 9 to view domains offault misorientation. The technique was adopted fromLeclere and Fabbri (2013) who used focal mecha-nisms, stress inversion, and critical stress conceptsto investigate fault reactivation associated with the2011 Tohoku-Oki earthquake, Japan. The procedureinvolves plotting each microseismic event on themap, colored by instability parameter, Pcritical, andthen interpolating the points. Whereas critical stressstereonets (Figures 7, 8) highlight differences in thecomputed stress field, the map in Figure 9 showswhich faults in the field are optimally oriented and
Figure 8. Pcritical stereonet plots for stages B1 (top), A7(middle), and B8 (bottom), with overlays of fault populationsfor each stage.
BUSETTI AND RECHES 2469

Table 1. Results Summary by Stage (μ = 0.6, C = 0)
Stress Tensor (MPa) Stress Direction (Eigenvector) Stress Path Variable
StageNumber ofEvents σi1 σi2 σi3 σ1-vec σ2-vec σ3-vec AZ SHmax p 0 q
N/A (Case 1a) N/Apreoperationalin situ stress
−18.2 −8.2 0.0 0.00 0.68 −0.73 43.0 −22.4 12.7−8.2 −19.3 0.0 0.00 0.73 0.680.0 0.0 −29.6 1.00 0.00 0.00
ALL (Case 1b) 7444 −13.8 −2.8 3.5 −0.07 0.38 −0.92 64.5 −23.1 13.3−2.8 −25.6 −5.2 0.53 0.80 0.293.5 −5.2 −30.0 0.85 −0.46 −0.26
A1 (Case 2a) 13 −6.2 −10.9 186.1 −0.68 0.04 −0.73 87.6 −21.8 229.1−10.9 −29.0 −7.9 −0.01 1.00 0.07186.1 −7.9 −30.1 0.73 0.05 −0.68
B1 (Case 2a) 754 −8.1 −15.1 −5.3 −0.30 0.47 0.83 39.7 −21.4 25.8−15.1 −26.1 7.1 −0.78 0.39 −0.50−5.3 7.1 −30.0 0.55 0.80 −0.24
B2 (Case 2a) 297 −0.1 −6.1 0.3 0.10 0.21 0.97 75.2 −18.4 21.7−6.1 −25.3 −4.3 0.56 0.80 −0.230.3 −4.3 −29.8 0.82 −0.57 0.04
A2 (Case 2a) 619 −10.3 −3.5 3.5 −0.01 0.55 0.84 49.2 −22.3 21.8−3.5 −26.6 −13.5 0.66 0.63 −0.403.5 −13.5 −30.0 0.75 −0.55 0.37
A3 (Case 2a) 278 −3.2 −1.2 −1.6 0.05 −0.01 1.00 90.8 −20.4 22.8−1.2 −28.0 −10.9 0.67 0.74 −0.03−1.6 −10.9 −29.9 0.74 −0.67 −0.05
B3 (Case 2a) 686 −4.7 −12.1 5.3 0.18 −0.42 −0.89 46.0 −22.8 28.1−12.1 −33.9 −10.0 0.82 −0.43 0.375.3 −10.0 −29.9 0.54 0.80 −0.26
B4 (Case 2a) 251 −2.1 −4.7 7.2 −0.02 −0.32 −0.95 61.8 −21.7 24.8−4.7 −33.2 −6.8 0.78 −0.60 0.187.2 −6.8 −29.8 0.63 0.73 −0.26
A4 (Case 2a) 467 −10.9 −3.1 3.2 0.03 −0.29 −0.96 70.0 −22.8 15.0−3.1 −27.4 −4.6 −0.58 −0.79 0.213.2 −4.6 −30.2 −0.81 0.55 −0.19
A5 (Case 2a) 712 −14.6 −0.5 2.7 −0.13 0.18 0.97 78.9 −22.7 10.9−0.5 −23.6 −3.4 0.37 0.92 −0.122.7 −3.4 −30.0 0.92 −0.35 0.19
B5 (Case 2a) 534 −1.6 −0.5 4.6 −0.10 0.14 0.99 79.7 −19.9 21.3−0.5 −28.1 −5.6 0.62 0.78 −0.054.6 −5.6 −29.9 0.78 −0.61 0.16
B6 (Case 2a) 331 −12.4 −0.8 0.6 −0.01 0.18 0.98 77.9 −21.2 13.9−0.8 −21.2 −7.1 0.48 0.86 −0.160.6 −7.1 −30.0 0.87 −0.48 0.10
A6 (Case 2a) 344 −16.7 −6.4 4.3 0.07 0.68 0.73 33.5 −26.5 21.9−6.4 −32.8 −13.6 0.75 0.45 −0.484.3 −13.6 −30.1 0.66 −0.58 0.48
2470 Geomechanics of Hydraulic Fracturing Microseismicity Part 2

Table 1. Continued
Stress Tensor (MPa) Stress Direction (Eigenvector) Stress Path Variable
StageNumber ofEvents σi1 σi2 σi3 σ1-vec σ2-vec σ3-vec AZ SHmax p 0 q
A7 (Case 2a) 107 −17.2 −2.1 7.7 −0.40 0.23 −0.88 76.5 −24.6 13.0−2.1 −26.5 −2.0 0.13 0.97 0.207.7 −2.0 −30.2 0.91 −0.03 −0.42
B7 (Case 2a) 743 −12.7 −1.6 0.9 −0.01 0.44 0.90 62.0 −20.5 13.8−1.6 −18.7 −6.7 0.42 0.82 −0.390.9 −6.7 −30.0 0.91 −0.38 0.19
B8 (Case 2a) 698 −15.7 4.5 3.2 −0.21 0.92 −0.32 160.4 −16.5 17.74.5 −3.6 0.6 0.01 −0.33 −0.943.2 0.6 −30.2 0.98 0.20 −0.06
A8-a (Case 2a) 7 −17.7 2.8 −6.0 −0.17 0.97 0.17 13.7 −24.9 31.82.8 −27.9 24.3 0.68 0.24 −0.69−6.0 24.3 −29.0 −0.71 0.00 −0.70
B9 (Case 2a) 480 −15.3 0.9 0.6 −0.05 1.00 0.06 177.5 −16.9 18.10.9 −5.2 −7.7 0.27 −0.04 0.960.6 −7.7 −30.1 0.96 0.06 −0.27
B10 (Case 2a) 103 −19.6 1.0 7.2 −0.22 0.95 −0.20 17.3 −22.6 28.41.0 −18.1 −21.0 0.57 0.30 0.767.2 −21.0 −30.1 0.79 0.06 −0.61
A8-b (Case 2a) 20 −12.8 −5.1 3.0 −0.24 0.86 0.45 25.9 −15.2 15.6−5.1 −5.7 2.8 −0.17 0.42 −0.893.0 2.8 −27.2 0.95 0.29 −0.05
20
18
16
14
12
10
8
6
4
2
0
Figure 9. Interpolated map of instabilityparameter Pcritical for every microseismicevent, for the configurations in Case 2a ofstress inversion stage-by-stage. Blue zonesreflect faults that are misoriented in theactivation stress field, whereas red zonesare optimally oriented.
BUSETTI AND RECHES 2471

more easily activated (orange zones in Figure 9),compared to those that are subcritically stressed andmisoriented in the stress field (blue zones inFigure 9). For example, the more red colored stereo-net (unstable) of stage B1 relative to the blue stereo-net (stable) of stage A7 in Figure 8 is because ofstage B1’s higher deviatoric stress (25.8 vs.13.0 MPa [3741.9 vs. 1885.4 psi] for A7). On themisorientation map (Figure 9) B1 is in a blue subcriti-cal zone and A7 in a red zone. Because faults in B1are misoriented (blue in Figure 9), they required amore critical stress state to activate (yellow-red zonesof the stereonet in Figure 8), whereas faults in A7 aremore optimally oriented (red in Figure 9) and wereable to activate under a more weakly stressed condi-tion (green-blue in Figure 8). Stage B8 reflects amixed case (faults lie in both yellow and blue zonesin Figure 8). The zonation displayed in Figures 7, 9appears to agree with the local geology: (1) the car-bonate fan geometry (Stocker Fan, Figure 3) coin-cides with the blue zones of misorientation at thetoes of the wells (Figure 9) and (2) the green seismicwavelet classification-based facies (top inset,Figure 3) bounded by the low seismic coherencetrend (gray shaded area of Figure 3) is approximatelyin the same location as the sharp change in activationstress character between stages A3 and A4 and B5and B6 (Figure 7).
DISCUSSION: LOCATION OF THEMICROSEISMIC EVENTS RELATIVETO HYDROFRACTURES
In part 1 (Busetti et al., 2014, this issue), we inter-preted two activated fault sets: inclined northeast–southwest fault planes with low jαj and verticalnorth–south planes with high jαj. These orientationsare consistent with local wellbore natural fracture ori-entations and with regional structural trends. For thisdata set, it was not possible to directly link microseis-mic patterns to local structural features such asseismic-interpreted faults or fracture corridors due tothe seismic resolution. Direct correlation of microseis-mic events to the fractures observed in wellbore imagedata (for example, by projecting microseismic eventdensity back to the wellbore for comparison againstwellbore fracture count) is also highly problematic,
as it is unlikely that many natural fractures extendcontinuously along strike for the full length of themicroseismic events cloud. Nonetheless, we believethe similarity in the orientation of the focal planes tothe observed local and regional fracture and fault datato be compelling evidence for the microseismic eventssignaling activation of pre-existing discontinuities.
There also appears to be a reasonable correlationof the microseismic behavior with geological facieschanges and activation stress domains (Figures 3, 7, 8).Additional investigations on the data set (Roy et al.,2014), which include a range of ConocoPhillips inter-nal reports, identify positive correlation betweenlateral changes in microseismic event distributionand density with seismic coherence and curvatureattributes, distributed temperature sensing, produc-tion log data, and time-lapse seismic anomalies(A. Mironova, 2013, personal communication).For example, using a geocellular model (Petrel,Schlumberger) with 3-D carbonate facies interpretedfrom seismic acoustic impedance and log-derivedgamma ray cutoffs, the interpreted Stocker Fan andother potential carbonate lobes were found to separatezones of upwardly decreasing microseismic eventcount (assumed to act as minor impediments to frac-ture growth) (R. Treverton, 2012, personal communi-cation). Though the relationship between interpretedlocal geological heterogeneity, microseismicity, andgeomechanical behavior is complicated and still notfully understood, it appears that more thorough rec-onciliation with the other available geologic, geo-physical, and operational data (pressure history, rockmechanical properties, etc.) is possible. Synthesis ofall the available data is outside of the present scope,and thus we return the discussion to investigation ofwhere microseismic activation occurs relative to thehydrofractures.
Three general settings were assumed for themicroseismic activation (Figure 1): (1) adjacent to amajor hydraulic fracture in the stress-shadowingregion, (2) far away from the fracture but in some areaof weak mechanical disturbance, and (3) ahead of ahydraulic fracture, near the crack tip region (note thatalthough the figure depicts an idealized symmetric bi-wing fracture, fracture mapping of the events in real-time and 3-D suggests more irregular patterns: wedo not suggest the idealized geometry to reflect the
2472 Geomechanics of Hydraulic Fracturing Microseismicity Part 2

actual hydraulic fractures in this data set). We sum-marize our findings below.
The computed activation states from stress inver-sion indicate increase in deviatoric stress, anddecrease in mean stress and stress rotation. We under-stand the activation stress state to be the combinedeffect of both the in situ stress and the perturbed stressfield caused by hydraulic fracturing. Thus, the micro-seismicity of the present data is interpreted as pre-dominantly induced instead of triggered, such thatevents were caused by significant disturbance to thein situ stress state. This finding also requires that themicroseismicity was not induced from pore pressurechange alone. The concept of fluid leakoff becauseof shifting in situ stress circles on a Mohr diagramto the left with increasing injection pressure but with-out changing the size of the circles is an unlikelycause of the microseismicity. Instead, a hydro-mechanical mechanism that explains hybrid (mixedtensile, compressive, and shear mode) events in thepresence of a perturbed stress field is required. It isalso unlikely that the microseismic events occurredin the stress shadowing region adjacent to the hydro-fracture walls, an area of stress rotation and elevatedcompressive stress (Sneddon, 1946; Roussel andSharma, 2011, 2012), because nearly all of the stressinversion results indicate a reduction in mean stress.We conclude that locations 1 and 2 previouslydescribed in this paper (Figure 1A, 1B) are unlikelylocations for the microseismic activity.
Fault activation near the crack tip (Figure 1C) iscompatible with the stress inversion results. Hybridand shear failure in the tensile stress perturbationzone ahead of propagating crack tips were describedin detail (e.g., Pollard and Segall, 1987; Baer, 1991;Reches and Lockner, 1994; Healy et al., 2006) andinvolves stress rotation, reduction of mean stress,and increased deviatoric stress. In finite element sim-ulations of hydraulic fracture segment propagation,Busetti et al. (2012) found that regions of rockslightly off-plane to the propagating crack path expe-rience up and leftward directed stress paths in p 0-qspace, similar to the activation stress paths that canbe inferred from Figure 6. Healy et al. (2006) studiedstress perturbations around penny shape cracks andrecognized a domain of enhanced shear activationthat extends some distance ahead of propagating
crack tips and at an angle oblique to the far-fieldSHmax axis. The sequence of induced damage,coupled with fracture growth and sustained flow,could cause complex sequence dynamic pressurepulses resulting in both opening and closing events(see discussion in part 1, Busetti et al., 2014, thisissue). Dynamic hydromechanical behavior occurringahead of the crack tip explains microseismic faultactivation and hydraulic fracture growth, but impliesthat the hydraulic fracture propagates into a locallydisturbed region containing microseismicity, insteadof the other way around. A mechanism in whichhydromechanical pressure pulses ahead of the hydro-fracture tip activate oblique faults, and natural frac-tures may allow proppant emplacement into fractureorientations that would otherwise remain closedunder usual leakoff conditions (e.g., at the fracturewalls). This mechanism supports the notion that sus-tained permeability enhancement is possible for frac-tures activated in shear, which are generallyaccepted to be the primary elements of the stimulatedrock volume.
CONCLUSIONS
A method was developed to find the activation stressconditions during hydraulic fracturing based onmicroseismic events data. The approach involvesdetermining earthquake focal mechanisms and poten-tial fault planes, and then applying geomechanicaltechniques of critical stress (instability) and stressinversion. A product is the full activation stress tensorfor any microseismic subpopulation of the stimulatedrock volume. The present approach depends on multi-ple monitor wells and advanced microseismicprocessing techniques.
The main findings are (1) derived microseismicfault orientations indicate the microseismic eventscorrespond to one of two fault sets that are consistentwith other observed structural trends in the Barnett;(2) activation stresses indicate significant mechanicalperturbations that are consistent with locationsobliquely ahead of hydrofracture tips; (3) activationstresses are incompatible with the stress shadowregion adjacent to hydrofractures: for example,sidewall leakoff does not appear to be a viable
BUSETTI AND RECHES 2473

mechanism for the microseisms; (4) significant geo-mechanical heterogeneity occurs stage-by-stage;(5) the most highly misoriented microseismic faults(those that require more energy to activate) occurnear the toes of the wells in the same vicinity as thecarbonate-dominated Stocker Fan feature.
APPENDIX: ADDITIONAL CALCULATIONS
Fault Population Subsets
In addition to the two main scenarios previously described in thispaper (1, 2A, 2B), we investigated a third case of subpopulations(3a) that sort stage B8 events (Figure 4) into 10 smaller subsets.Scenario 3ai addresses whether the activation stress state respon-sible for near wellbore events is different from that of the distantevents, for instance, caused by more pressure interference nearthe wellbore. Next, scenario 3aii groups the events by time-sequence to determine whether early events reflect different stressconditions than later events, for example, early fracture extensionversus late in-filling events. For comparison, we also grouped theevents into 10 subsets sorted randomly. To answer these subsetquestions, we calculated activation stress using fault subpopula-tions for stage B8. We selected the B8 hydraulic fracture stagebecause it formed the longest microseismic cloud (Figures 3, 4).Events were grouped into 10 subsets giving 30 independent stressinversions. The first category is by distance from the wellbore,measured from the middle of the stage B8 perforation clusters(green triangles, Figure 10, top), the second by event sequenceor time (red squares, Figure 10, top), and for comparison a thirdsubset comprises all the stage B8 events sorted randomly and thenis divided into 10 subsets (blue diamond, Figure 10, top). Resultsshow no clear trend between distance or event sequence andSHmax azimuth, or mean or deviatoric stress, p 0 or q. Distanceand sequence yield no better trend than the randomized data set.Variability in activation stresses relating to fracture in-filling ver-sus spreading events or changes in the pumping cycle is not evi-dent from the present analysis. However, plotting the sequenceand distance subsets against each other (e.g., SHaz for the nearest10% of events vs. SHaz for the earliest 10%) shows a nearly 1∶1relationship (Figure 10, bottom), indicating that despite a hetero-geneous (or noisy) activation stress state, stage B8 events gener-ally spread outward with time.
Effects of Material Properties
The stress inversion technique used in this study is based on solv-ing the inverse problem for the Coulomb failure criteria, and thusdepends on friction angle. Up to this point, we assumed a frictioncoefficient of 0.6. We repeated the stress inversion for all 7444events of scenario 2a, for the range 0.01 ≤ μ ≤ 1.0. Results indi-cate that lowering friction results in σ1 being more inclined fromvertical and σ2 and σ3 also rotate clockwise (increasing SHmax azi-muth) (Figure 6, right). In p 0-q space (Figure 6, small blue dots),
the effect of decreasing friction is to raise the mean stress andlower deviatoric stress. The ratio of q∕p 0 decreases linearly withreduced friction. We view the dependency of stress orientationand magnitude on friction as an intrinsic uncertainty of the prob-lem that should occur because of lithologic variations. For exam-ple, μ = 0.4–0.8 reflects measured values of friction for differentBarnett Shale samples (Zoback et al., 2012). We also calculatedthe misfit angle as a function of friction angle, in which the misfitangle αmisfit = cos−1ðτ · SÞ is the angle between the unit shearstress direction τ and the unit slip direction S, and · indicates thedot product. Misfit for scenario 1a, in which faults were pickeda priori from the preoperational in situ stress state, has littledependency on friction. When stress inversion is used, misfitdecreases to zero as friction approaches zero. These findingsagree with the conclusions of Reches (1987) that misfit minimiza-tion methods imply μ = 0. It was recognized that minimizedmisfit may not represent actual fault motion. For example,the method of Angelier (2002, p. 589) appeals to numericalsimulations by Dupin et al. (1993) and explains that “slip occurson some faults despite a large angle between the slip vector and
Figure 10. (Top) Computed maximum horizontal stress direc-tion, SHaz, as a function of well B8 microseismic event subpopu-lations. By sequence (red squares), early events are to the leftand late events are to the right. By distance (green triangles),events near the wellbore are to the left and distant events areto the right. Random subsets (blue diamonds) reflect 10 ran-domly sorted event subsets. (Bottom) Maximum horizontalstress direction, SHaz, by sequence versus SHaz by distance, inwhich 1 indicates the subsets earliest and nearest to the well-bore. The dashed black line indicates a 1:1 correlation.
2474 Geomechanics of Hydraulic Fracturing Microseismicity Part 2

the shear stress as a consequence of geometrical requirements inthe faulted blocks.” Using the methods of this study, a largerdegree of misfit must be tolerated if high friction values areassumed.
REFERENCES CITED
Angelier, J., 2002, Inversion of earthquake focal mechanisms toobtain the seismotectonic stress IV—a new method free ofchoice among nodal planes: Geophysical JournalInternational, v. 150, no. 3, p. 588–609.
Athavale, A. S., and J. L. Miskimins, 2008, Laboratoryhydraulic fracturing tests on small homogeneous andlaminated blocks: American Rock Mechanics Association2008 Symposium, ARMA 08-067, the 42nd US RockMechanics Symposium and 2nd US-Canada rockMechanics Symposium, San Francisco, California, June29–July 2, 2008, 9 p.
Baer, G., 1991, Mechanisms of dike propagation in layered rocksand in massive porous sedimentary rocks: Journal ofGeophysical Research, v. 96, no. B7, p. 11911–11929.
Barree, R. D., and H. Mukherjee, 1996, Determination of pres-sure dependent leakoff and its effect on fracture geometry:Society of Petroleum Engineers, SPE 36424, SPE AnnualTechnical Conference and Exhibition, October 6–9, 1996,10 p.
Baruch, E., 2009, Seismic sequence stratigraphy of the BarnettShale, southwestern part of Fort Worth Basin, Texas:Master’s thesis, University of Oklahoma, Norman,Oklahoma, 105 p.
Busetti, S., 2009, Fracturing of layered reservoir rocks: Ph.D. dis-sertation, University of Oklahoma, Norman, Oklahoma,256 p.
Busetti, S., 2010, Effects of natural fracture reactivation duringhydraulic fracturing of the Barnett Shale, Fort Worth Basin,TX: Geological Society of America Abstracts withPrograms, v. 42, no. 5, p. 673.
Busetti, S., and Z. Reches, 2007, Formation of network fracturesduring hydraulic fracturing of the Barnett Shale, a tight gasshale with preexisting fractures (abs.): Eos Transactions ofthe American Geophysical Union, Fall MeetingSupplement T42C-04, v. 88, no. 52, p. 330.
Busetti, S., W. Jiao, and Z. Reches, Geomechanics of hydraulicfracturing microseismicty: Part 1. Shear, hybrid, andtensile events: AAPG Bulletin, v. 98, p. 2439–2457, doi:10.1306/05141413123.
Busetti, S., K. Mish, P. Hennings, and Z. Reches, 2012, Damageand plastic deformation of reservoir rocks: Part 2.Propagation of a hydraulic fracture: AAPG Bulletin, v. 96,no. 9, p. 1711–1732.
Byerlee, J. D., and D. Lockner, 1977, Acoustic emission duringfluid injection: Proceedings First Conference on AcousticEmission/microseismic Activity in Geologic Structures andMaterials, Pennsylvania State University, Trans TechPublications, Clausthal, Germany, p. 87–98.
Chitrala, Y., C. Moreno, C. Sondergeld, and C. Rai, 2011,Microseismic and microscopic analysis of laboratoryinduced hydraulic fractures: Society of Petroleum
Engineers, SPE 147321, Canadian UnconventionalResources Conference, November 15–17, 2011, Alberta,Canada, 19 p.
Daniels, J., K. DeLay, G. Waters, L. LeCalvez, J. Lassek, and D.Bentley, 2007, Contacting more of the Barnett Shale throughan integration of real-time microseismic monitoring, petro-physics and hydraulic fracturing design: Society ofPetroleum Engineers, SPE 110562, SPE ATCE, Anaheim,California, October 12–14, 2007, 12 p.
Dupin, J. M., W. Sassi, and J. Angelier, 1993, Homogeneousstress hypotheses and actual fault slip: a distinct elementanalysis: Journal of Structural Geology, v. 15, no. 8,p. 1033–1043.
Elebiju, O., 2009, Integrated geophysical investigations of link-ages between Precambrian basement and sedimentary struc-tures in the Ucayali Basin, Peru; Fort Worth Basin, Texas;and Osage County, Oklahoma: Ph.D. dissertation,University of Oklahoma, Norman, Oklahoma, 350 p.
Fisher, M. K., C. A. Wright, B. M. Davidson, A. K. Goodwin,E. O. Fielder, W. S. Buckler, and N. P. Steinberger, 2005,Integrating fracture-mapping technologies to improve stimu-lations in the Barnett Shale: Society of Petroleum EngineersProduction and Facilities 77441, p. 85–93.
Gale, J. F. W., and J. Holder, 2008, Natural fractures in theBarnett Shale: Constraints on spatial organization and tensilestrength with implications for hydraulic fracture treatment inshale-gas reservoirs, in: Proceedings of the 42nd US RockMechanics Symposium. Paper no. ARMA-08-096, 9 p.
Gale, J. F. W., R. M. Reed, and J. Holder, 2007, Natural fracturesin the Barnett Shale and their importance for hydraulic frac-ture treatmetns: AAPG Bulletin, v. 91, no. 4, p. 603–622.
Gephart, J. W., and D. W. Forsyth, 1984, An improved methodfor determining the regional stress tensor using earthquakefocal mechanisms data: an application to the San Fernandoearthquake sequence: Journal of Geophysical Research,v. B, v. 89, p. 9305–9320.
Grob, M., and M. van der Baan, 2011, Inferring in situ stresschanges by statistical analysis of microseismic event charac-teristics: The Leading Edge, v. 30, no. 11, p. 1296–1302.
Hardage, B. A., D. L. Carr, D. E. Lancaster, J. L. Simmons, R. Y.Elphick, V. M. Pendleton, and R. A. Johns, 1996, 3-D seis-mic evidence of the effects of carbonate karst collapse onoverlying clastic stratigraphy and reservoir compartmentali-zation: Geophysics, v. 61, no. 5, p. 1336–1350.
Healy, D., R. R. Jones, and R. E. Holdsworth, 2006, Three-dimensional brittle shear fracturing by tensile crack interac-tion: Nature, v. 439, no. 7072, p. 64–67.
Hennings, P., P. Allwardt, P. Paul, C. Zahm, R. Reid, Jr.,H. Alley, R. Kirschner, B. Lee, and E. Hough, 2012,Relationship between fractures, fault zones, stress, and reser-voir productivity in the Suban gas field, Sumatra, Indonesia:AAPG Bulletin, v. 96, no. 4, p. 753–772.
Ishida, T., Q. Chen, M. Yoshiaki, and J. C. Roegiers, 2004,Influence of viscosity on the hydraulic fracturing mecha-nism: Journal of Energy Resources Technology, v. 126,p. 190–200.
Kassis, S., and C. H. Sondergeld, 2010, Gas shale permeability:effects of roughness, proppant, fracture offset, and confiningpressure: Society of Petroleum Engineers, SPE 131376,
BUSETTI AND RECHES 2475

International Oil and Gas Conference and Exhibition inChina, Beijing, China, June 8–10, 2010, 17 p.
Leclere, H., and O. Fabbri, 2013, A new three-dimensionalmethod of fault reactivation analysis: Journal of StructuralGeology, v. 48, p. 153–161.
Loucks, R. G., 1999, Paleocave carbonate reservoirs: origins,burial-depth modifications, spatial complexity, and reservoirimplications: AAPG Bulletin, v. 83, p. 1795–1834.
Mayerhofer, M. J., E. P. Lolon, J. E. Youngblood, and J. R.Heinze, 2006, Integration of microseismic fracture mappingresults with numerical fracture network production modelingin the Barnett Shale. Society of Petroleum Engineers, SPE102103, SPE ATCE, San Antonio, September 24–27, 2006,8 p.
McDonnell, A., R. G. Loucks, and T. Dooley, 2007, Quantifyingthe origin and geometry of circular sag structures in northernFort Worth Basin, Texas: paleocave collapse, pull-apart faultsystems, or hydrothermal alteration?: AAPG Bulletin, v. 91,no. 9, p. 1295–1318.
Montgomery, S. L., D. M. Jarvie, K. A. Bowker, and R. M.Pollastro, 2005, Mississippian Barnett Shale, Fort WorthBasin, north-central Texas: gas-shale play with multi-trillioncubic foot potential: AAPG Bulletin, v. 89, no. 2, p. 155–175.
Pearson, C., 1981, The relationship between microseismicity andhigh pore pressures during hydraulic stimulation experi-ments in low permeability granitic rocks: Journal ofGeophysical Research, v. 86, p. 7855–7864.
Pollard, D. D., and P. Segall, 1987, Theoretical displacement andstresses near fractures in rock with application to faults,joints, veins, dikes, and solution surfaces, in B. K.Atkinson, ed., Fracture Mechancis of Rock, AcademicPress, Inc., p. 277–349.
Pollastro, R. M., D. M. Jarvie, R. J. Hill, and C. W. Adams, 2007,Geologic framework of the Mississippian Barnett Shale,Barnett-Paleozoic total petroleum system, Bend arch-Fort Worth Basin, Texas: AAPG Bulletin, v. 91, no. 4,p. 405–436.
Ramurthy, M., W. Lyons, R. B. Hendrickson, R. D. Barree, andD. P. Magill, 2007, Effects of high pressure dependent leak-off and high process zone stress in coal stimulation treat-ments: Society of Petroleum Engineers, SPE 107971, SPERocky Mountain Oil and Gas Technology Symposium,April 16–18, Denver, Colorado, 8 p.
Reches, Z., 1987, Determination of the tectonic stress tensor fromslip analysis along faults that obey the coulomb yield condi-tion: Tectonics, v. 6, no. 6, p. 849–861.
Reches, Z., and D. Lockner, 1994, Nucleation and growth offaults in brittle rocks: Journal of Geophysical Research:Solid Earth, v. 99, no. B9, p. 18159–18173.
Roth, M., and A. Thompson, 2009, Fracture interpretation in theBarnett Shale using macro- and microseismic data: FirstBreak, v. 27, no. 4, p. 83–88.
Roussel, N. P., and M. M. Sharma, 2011, Strategies to minimizefrac spacing and stimulate natural fractures in horizontalcompletions: Society of Petroleum Engineers, SPE 146104,
SPE Annual Technical Conference and Exhibition, Denver,Colorado, October 30—November 2, 2011, 17 p.
Roussel, N. P., and M. M. Sharma, 2012, Role of stress reorienta-tion in the success of refracture treatments in tight gas sands:Society of Petroleum Engineers, SPE 134491, SPE Journal,v. 27, no. 4, p. 346–355.
Roy, B., B. Hart, A. Mironova, C. Zhou, and U. Zimmer, 2014,Integrated characterization of hydraulic fracture treatmentsin the Barnett Shale: the Stocker geophysical experiment,Interpretation, v. 2, no. 2, p. T111–T127, doi:10.1190/INT-2013-0071.1.
Sibson, R. H., 1996, Structural permeability of fluid-driven fault-fracture meshes: Journal of Structural Geology, v. 18, no. 8,p. 1031–1042.
Sil, S., B. Bankhead, C. Zhou, and A. Sena, 2012, Analysis of Bvalue from Barnett Shale microseismic data: 74th EAGEConference & Exhibition incorporating SPE EUROPEC2012, Copenhagen, Denmark, June 4–7, 2012, p. 1225–1229.
Simon, Y., 2005, Stress and fracture characterization in a shalereservoir, North Texas, using correlation between new seis-mic attributes and well data: Master’s thesis, University ofOklahoma, Norman, Oklahoma, 84 p.
Singh, P., 2008, Lithofacies and sequence stratigraphicframework of the Barnett Shale, Northeast Texas: Ph.D. dis-sertation, University of Oklahoma, Norman, Oklahoma,181 p.
Sneddon, I. N., 1946, The distribution of stress in the neighbor-hood of a crack in an elastic solid: Proceedings of theRoyal Society of London, v. A187, no. 1009, p. 229–260.
Vavryčuk, V., 2001, Inversion for parameters of tensile earth-quakes: Journal of Geophysical Research, v. 106, no. B8,p. 16,339–16,355.
Vavryčuk, V., 2011, Tensile earthquakes: theory, modeling, andinversion: Journal of Geophysical Research, v. 116,no. B12, 320, p. 1–14.
Vermylen, J., and M. D. Zoback, 2011, Hydraulic fracturing,microseismic magnitudes, and stress evolution in theBarnett Shale, Texas, USA: Society of PetroleumEngineers, SPE 140507, SPE Hydraulic FracturingTechnology Conference and Exhibition, January 24–26,2011, The Woodlands, Texas, 15 p.
Walper, J. L., 1982, Plate tectonic evolution of the Fort Worthbasin, in C. A. Martin, ed., Petroleum Geology of the FortWorth basin and Bend arch area, Dallas GeologicalSociety, p. 237–351.
Zoback, M. D., 2007, Reservoir Geomechanics: New York,Cambridge University Press, 449 p.
Zoback, M. D., A. Kohli, I. Das, and M. McClure, 2012, Theimportance of slow slip on faults during hydraulic fracturingstimulation of shale gas reservoirs: Society of PetroleumEngineers, SPE 155476, SPE Americas UnconventionalResources Conference, June 5–7 2012, Pittsburgh,Pennsylvania, 9 p.
2476 Geomechanics of Hydraulic Fracturing Microseismicity Part 2