geophysical journal international - intrepid geophysics · 2 d. schreiber et al. southwestern alps...
TRANSCRIPT

Geophys. J. Int. (2010) doi: 10.1111/j.1365-246X.2009.04486.x
GJI
Geo
dyna
mic
san
dte
cton
ics
3-D modelling of Alpine Mohos in Southwestern Alps
Dimitri Schreiber,1 Jean-Marc Lardeaux,1 Guillaume Martelet,2 Gabriel Courrioux2
and Antonio Guillen2
1Universite Nice Sophia-Antipolis, UMR Geosciences Azur, Parc Valrose, 06108 Nice cedex 02, France. E-mail: [email protected], 3, Avenue Claude Guillemin, 45060 Orleans cedex 02, France
Accepted 2009 December 15. Received 2009 November 27; in original form 2008 July 10
S U M M A R YWe present and discuss a 3-D geometrical model of the Moho topography in the SouthwesternAlps. To achieve this objective, we used the potential of 3-D modelling software (i.e. a 3-DGeoModeller) to combine gravity, seismic and seismological constraints in a same and coherent3-D space.
A new regional Bouguer gravity anomaly map of the Southwestern Alps was calculatedand filtered to isolate the Moho signature in the Southwestern Alps. Then, two alternative3-D models were computed with data from the literature based on seismic and seismologicalconstraints. The first one represents an European lithospheric mantle decoupled from theEuropean orogenic crust which is back-thrusted by the Ivrea body whereas the second 3-Dmodel illustrates the subduction of a 20-km-thick piece of lower continental crust, coupled withthe European upper mantle, beneath the Ivrea body. According to the geological knowledgeof these units we then assigned a density value to each modelled layer and we computedtheir gravity effects to compare them with the filtered Moho map of the Southwestern Alps.First of all, the significant discrepancies of the Moho gravity signature generated by thesetwo geometrical models reveal that subduction of continental crust is no more active in thepresent-day configuration of the Southwestern Alps. Therefore, the first 3-D model was refinedby a stochastic 3-D gravity inversion.
Based on this processing, our investigations confirm the presence of three superposed Mohosin the Southwestern Alps and underline that:
(i) The crust/mantle European boundary is localized around 50 km depth beneath theArgentera-Mercantour massif,
(ii) The European lithospheric mantle is decoupled from the European orogenic crust,(iii) The Adriatic mantle (Ivrea body) is split into two distinct units; the upper unit is located
at 10 km depth beneath the Dora-Maıra massif, and the lower unit extends from 20 to 45 kmdepth.
(iv) These two mantle indenters affect differently the European crust and are responsiblefor the localization of crustal deformation and for strain partitioning in the Southwestern Alps.
Key words: Probability distributions; Gravity anomalies and Earth structure; Mantle pro-cesses; Seismicity and tectonics; Dynamics of lithosphere and mantle; Crustal structure.
1 I N T RO D U C T I O N
In the Alps, the lithosphere as well as the Moho topography wereimaged by geophysical experiments since the fifties (see discus-sions in Schmid & Kissling 2000 with references therein). Accord-ing to these investigations, the crustal scale geometry shows thatthe European Moho deeps progressively eastward and underthruststhe south dipping Adriatic Moho which remains subhorizontal atshallower depth (Roure et al. 1996; Waldhauser et al. 1998). Thisshallow depth piece of Adriatic mantle imaged for the first timein the 1960s is classically described as the Ivrea body or anomaly
(Closs & Labrouste 1963; Menard & Thouvenot 1984). The pre-cise geometry of this Moho topography was well documented in thenorthern part of the western Alps and particularly along the ECORS-CROP profile (Roure et al. 1990, 1996; Pfiffner et al. 1997). Re-cently, reliable geophysical data, including local earthquake tomog-raphy, gravity modelling and explosion-seismology experiments,were released in the Southwestern Alps, improving the EuropeanMoho image and the Ivrea body shape (Masson et al. 1999; Paulet al. 2001; Vernant et al. 2002; Bethoux et al. 2007; Thouvenotet al. 2007). In spite of these recent geophysical investigations, thecrustal scale 3-D geometry of Alpine Mohos topography in the
C© 2010 The Authors 1Journal compilation C© 2010 RAS
Geophysical Journal International

2 D. Schreiber et al.
Southwestern Alps is still a matter of debate (Paul et al. 2001;Bethoux et al. 2007). Improving the knowledge of this 3-D com-plexity is crucial for understanding lithosphere dynamics and earth-quake location in the Southwestern Alps.
In the last decades, significant progress has been achieved in 3-Dnumerical modelling of complex geological structures by the devel-opment of 3-D modelling software (i.e. 3-D GeoModeller) capableat once of elaborating a 3-D geometrical model from geophysicaland geological constraints and of refining it by inversion processes(Martelet et al. 2004; Calcagno et al. 2008; Guillen et al. 2008).Therefore, according to this 3-D modelling technique, we proposein this paper to combine all the available geophysical data in South-western Alps in order to constrain the Moho topography and tointegrate geologic cross sections and earthquakes locations in a 3-Dcrustal scale model.
To gain a better knowledge of the Moho topography.
(1) We prepared a new Bouguer gravity map of the SouthwesternAlps and filtered it to isolate the Moho signature.
(2) We compiled a Moho model based on seismic reflection andrefraction data as well as seismologic data (i.e. local earthquaketomography) available in the literature.
(3) Using 3-D GeoModeller, we computed the gravity fit for thecrust–mantle geometries from this model.
(4) We inverted gravity data to further improve the gravity fitstarting from the 3-D model.
Finally, we discuss the tectonic evolution and the earthquakedistribution of the Southwestern Alps in light of our 3-D refinedmodel.
2 G E O L O G I C A L C O N T E X T
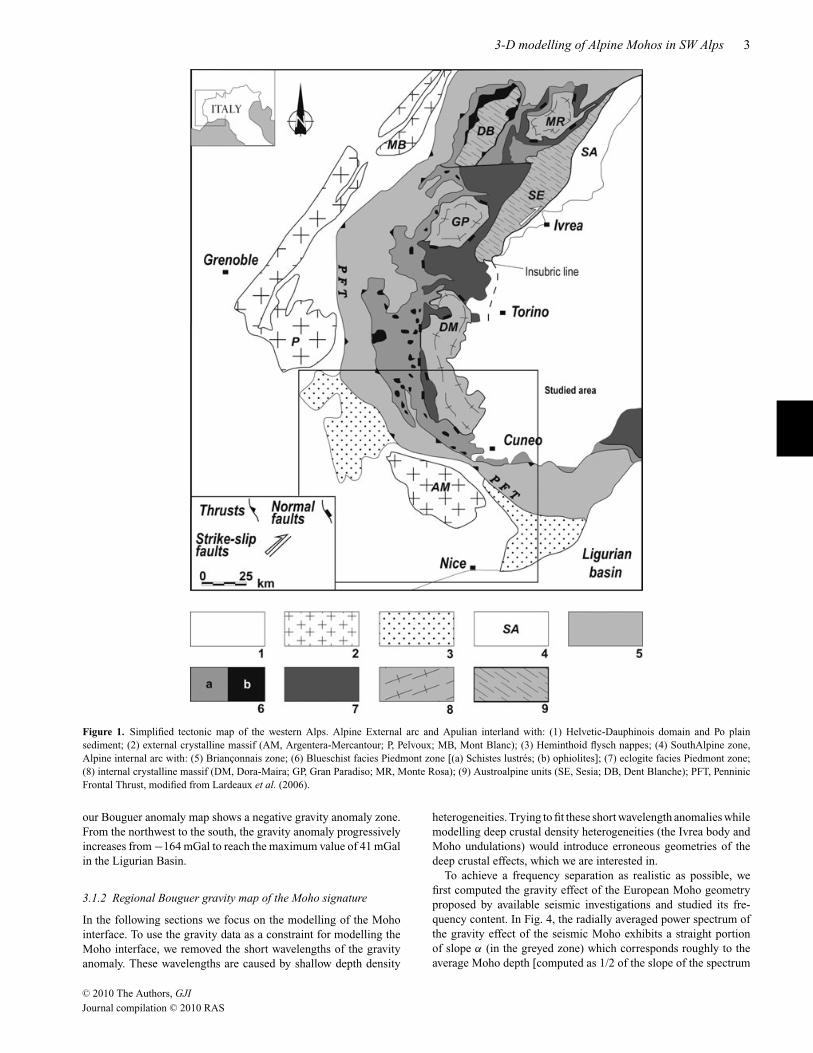
The Alpine belt, located along the plate boundary betweenEurasia and Adria (Apulia), results from the subduction of aJurassic–Cretaceous ocean followed by the continental collisionbetween two continental margins (see review in Coward & Dietrich(1989)). We focus on the Southern part of the Western Alpine Arc:Fig. 1 represents the simplified tectonic map of the study area. In thisarea, the west-verging structure derives from the European marginand an oceanic accretionary wedge deformed during the Tertiary. Amajor thrust zone, the ‘Penninic Frontal Thrust’ (PFT), separates anExternal Arc from an Internal Arc whereas eastward, the InternalArc is bounded by a subvertical strike-slip system correspondingto the Insubric Line (Fig. 1) and separating the Internal Alpine Arcfrom the Adriatic continental margin (Southern Alps).
The deep structures of the western Alps were defined at theend of the 1970s by compiling all the seismic profiles available atthat time (Sapin & Hirn 1974; Thouvenot & Perrier 1980). AfterMenard (1979), Fig. 2(a) the Ivrea body represents a mantle flakedisconnected from the autochthonous European Moho. Grellet et al.(1993) (Fig. 2b), characterized the area between the Pelvoux mas-sif and the Mediterranean coast as a banana-shaped, 47-km-deepcrustal root. Later, using 2-D derived controlled-source seismicreflector data, Waldhauser et al. (1998) obtained structural infor-mation of the crust–mantle boundary (see Fig. 2c). This led themto a revised 3-D topography of the Moho and lateral continuityof seismic interfaces. Due to the lack of seismic data coverage inthe SouthWestern Alps, the Waldhauser et al. (1998) Moho modelresults rather from an extrapolation than an interpolation of theseismic data. However, they proposed to distinguish an European,an Adriatic and a Ligurian Moho, with the European Moho sub-
ducting below the Adriatic Moho (Ivrea body in our study area)and with the Adriatic Moho underthrusting the Ligurian Moho. In2000, broadband receiver functions analysis were also used to eval-uate the fine-scale P-velocity structure of the lithosphere (Bertrand& Deschamps 2000) from 30 selected teleseismic events recordedat three seismological stations of the French TGRS network in thesouthernmost part of the French Alps. This method provided a punc-tual Moho depth value below the STET, CALF and SAOF stationsrespectively, 30, 20 and 23 km (see Fig. 2a). These values are com-patible with the Moho maps of Menard (1979) and Grellet et al.(1993) excepted at the CALF station where the Moho depth value isshallower than proposed by Menard (1979) and Grellet et al. (1993).
The last investigation (explosion seismology experiment) wascarried out in the framework of GeoFrance 3-D program(1998–2003) in an area between the Pelvoux, Dora-Maira andArgentera-Mercantour massifs (Thouvenot et al. 2007; Fig. 2d).This produced the most reliable information on the European Mohodepth in the Southwestern Alps. Moreover, local earthquakes to-mography studies have significantly improved our knowledge of thecrustal structure of the belt and particularly the shape of the Ivreabody (Paul et al. 2001; Bethoux et al. 2007). These recent seismicand seismologic data were selected to restore the 3-D geometry ofthe Moho topography in the Southwestern Alps.
3 G E O P H Y S I C A L DATA O NT H E S O U T H W E S T E R N A L P S
3.1 Gravity data
3.1.1 Regional Bouguer gravity anomaly map
For the computation of our Bouguer gravity map, we mainly usedground gravity data from the French gravity database (Grandjeanet al. 1998; Martelet et al. 2002) and particularly from the gravitysurveys performed in the western Alps (Masson et al. 1999). Italiangravity data are provided by the BGI (Bureau Gravimetrique Inter-national). Both data sets are tied to the international IGSN71 gravityreference and reduced to complete Bouguer anomalies (includingterrain corrections within a radius of 167 km), with a reductiondensity of 2670 kg m−3. The topography used in the computa-tion process of our Bouguer gravity map is provided by a 1000-mresolution DEM. This DEM was derived from the Shuttle RadarTopography Mission (SRTM, NASA) for the French part and froma DTM provided by the Centro di Sudi sulla Geodinamica delleCatene Collisionali (CNR, Italy; Bigi et al. 1990) for the Italianzone. Taking into account the original repartition of the gravity data(Fig. 3) and the scale of the geological objects, which are addressedin this study, we build a 2 × 2 km grid using standard minimumcurvature algorithm.
The resulting regional Bouguer gravity map presented as Fig. 3reflects the complexity of the Moho topography in the studied zone.In first order, we recognized a large positive anomaly zone in theeastern and southern part of the studied area whereas the northwest-ern part represents a vast negative anomaly domain. In the details,we observe behind the trace of the PFT a positive gravity anomalyzone corresponding to the so-called Ivrea body. This latter inter-preted as a mantle slice wedged into the European crust (Schmid &Kissling 2000) is precisely located beneath the Dora Maıra massif(Figs 1 and 3). The Eastern part of the studied area is also char-acterized by a positive anomaly domain, which goes on southwardto the Ligurian basin. On the other hand, the northwestern part of
C© 2010 The Authors, GJI
Journal compilation C© 2010 RAS
3-D modelling of Alpine Mohos in SW Alps 3
Figure 1. Simplified tectonic map of the western Alps. Alpine External arc and Apulian interland with: (1) Helvetic-Dauphinois domain and Po plainsediment; (2) external crystalline massif (AM, Argentera-Mercantour; P, Pelvoux; MB, Mont Blanc); (3) Heminthoid flysch nappes; (4) SouthAlpine zone,Alpine internal arc with: (5) Brianconnais zone; (6) Blueschist facies Piedmont zone [(a) Schistes lustres; (b) ophiolites]; (7) eclogite facies Piedmont zone;(8) internal crystalline massif (DM, Dora-Maira; GP, Gran Paradiso; MR, Monte Rosa); (9) Austroalpine units (SE, Sesia; DB, Dent Blanche); PFT, PenninicFrontal Thrust, modified from Lardeaux et al. (2006).
our Bouguer anomaly map shows a negative gravity anomaly zone.From the northwest to the south, the gravity anomaly progressivelyincreases from −164 mGal to reach the maximum value of 41 mGalin the Ligurian Basin.
3.1.2 Regional Bouguer gravity map of the Moho signature
In the following sections we focus on the modelling of the Mohointerface. To use the gravity data as a constraint for modelling theMoho interface, we removed the short wavelengths of the gravityanomaly. These wavelengths are caused by shallow depth density
heterogeneities. Trying to fit these short wavelength anomalies whilemodelling deep crustal density heterogeneities (the Ivrea body andMoho undulations) would introduce erroneous geometries of thedeep crustal effects, which we are interested in.
To achieve a frequency separation as realistic as possible, wefirst computed the gravity effect of the European Moho geometryproposed by available seismic investigations and studied its fre-quency content. In Fig. 4, the radially averaged power spectrum ofthe gravity effect of the seismic Moho exhibits a straight portionof slope α (in the greyed zone) which corresponds roughly to theaverage Moho depth [computed as 1/2 of the slope of the spectrum
C© 2010 The Authors, GJI
Journal compilation C© 2010 RAS

4 D. Schreiber et al.
Figure 2. Comparison between four Moho maps in the Southwestern Alps modified after Thouvenot et al. (2007): (a) from Menard (1979) with Bertrand &Deschamps (2000) punctual Moho depth, (b) from Grellet et al. (1993), (c) from Waldhauser et al. (1998) and (d) from Thouvenot et al. (2007). On eachMoho map, the curves represent the Moho depth values. The mantle thrusts are symbolised by thin lines and white triangle. Cities: Gr, Grenoble; Ni, Nice; Tu,Turin. Geological units: Be, Belledonne; Pe, Pelvoux; AM, Argentera-Mercantour; DM, Dora-Maira massif; GP, Gran Paradiso; PFT, Penninic Frontal Thrust;T, Tanneron. Studied area is represented by dashed lines. Projection latitude/longitude coordinates are according the WGS84 grid.
(Spector & Grant 1970)]. Therefore, this part of the spectrum re-flects the characteristic spectral signature of the Moho. To derivethe amount of filtering that is necessary to apply to the Bougueranomaly to recover a comparable spectral signature, we low-passfiltered the Bouguer anomaly with cut-off wavelengths of 30, 65 and100 km and computed their power spectrum (Fig. 4). Edge effects inlow-pass filtering have been avoided performing the standard win-dowing, tapering and regional trend removing prior to the Fouriertransform.
Spectra derived from progressive filtering of surface Bougueranomalies show that in the range of wavelengths greyed in Fig. 4,a frequency content roughly equivalent to the one of the Moho ef-fect can be achieved when filtering the gravity anomalies around
65 km. Indeed, the slope and lower inflection point of the spectraof the Moho gravity effect and 65-km-low-pass filtered Bougueranomaly map are comparable. We therefore applied such filteringto the original Bouguer anomaly map and obtain the long wave-lengths gravity anomaly map of the Southwestern Alps presented inFig. 5. Compared to the original Bouguer map, this filtered gravitymap does not contain local variations, whereas the average too longwavelengths of the original map are preserved; that is effects ofintermediate to deep crustal density heterogeneities. Even if the topof the Ivrea body is relatively shallow, around 10 km depth, its hor-izontal extension is large enough to generate a middle-wavelengthgravity anomaly which is preserved by the low-pass filtering of theBouguer anomaly (compare NE part of Figs 3 and 5).
C© 2010 The Authors, GJI
Journal compilation C© 2010 RAS

3-D modelling of Alpine Mohos in SW Alps 5
Figure 3. Regional Bouguer gravity map of the studied zone computed by interpolation of gravity data. Geological units: AM, Argentera-Mercantour massif;DM, Dora-Maıra massif; PFT, Penninic Frontal Thrust. Grey dots represent the location of gravity data collection. Projection latitude/longitude coordinatesare according the Lambert II extended system.
3.2 Seismic and seismological data
The deep seismic structures of the Southwestern Alps were estab-lished by Thouvenot et al. (2007). This latter study represents theonly direct and thus reliable measurements of the European Mohodepth (Fig. 2d). Crustal thickening is imaged from Nice hinterland(Moho depth of 27 km) to the orogenic root zone (Moho depth at55 km). The zone just south of the Pelvoux massif is characterizedby a rather flat, 40-km-deep Moho, which distorts the isobaths inthickening the crust along the Durance valley. Beneath the Argen-tera massif and just north of it, the Moho map evidences a strongdeepening of the Moho down to 51 km (Fig. 2d). The resultingMoho map, drawn integrating depth data measured at ∼300 reflec-tion midpoints, shows a better definition of the European Mohotopography than those previously published.
In the Southwestern Alps, local earthquakes tomography studiessignificantly improved our knowledge of the crustal structure ofthe belt and particularly the shape of the Ivrea body (Paul et al.2001; Bethoux et al. 2007). In these works, The Ivrea body appearsas a 10–30 km thick north–south elongated high-velocity anomalybeneath the Dora Maıra massif and extending to the south beneaththe northern border of the Argentera-Mercantour massif with aslight eastward plunge.
Both seismic and seismologic data set constitute the geometricalconstraints of the 3-D modelling process. The applied methodology
used in data integration and the 3-D modelling process are describedin the following section.
4 3 - D M O D E L O F A L P I N E M O H O S
4.1 3-D geological modelling principles
Our 3-D analyses were performed using the ‘3-D GeoModeller’software developed conjointly by the French Geological Survey(BRGM) and Intrepid Geophysics Company. This software was de-veloped specifically for geological applications in order to combinegeological and geophysical data available in a single 3-D space. Ithas recently been used successfully to produce 3-D geological mod-els of complex tectonic structures (Martelet et al. 2004; Calcagnoet al. 2008).
4.2 3-D building process
To build our 3-D model, we used the Moho map proposed byThouvenot et al. (2007) (Fig. 2d) and the local earthquake tomog-raphy computed by Paul et al. (2001). First of all, we started themodelling process with geo-referencing the Moho map (Fig. 2d) inthe 3-D GeoModeller. The isobaths curves traces [from 28 km deepto 51 km deep in the studied zone (Fig. 2d)] were digitalized in
C© 2010 The Authors, GJI
Journal compilation C© 2010 RAS

6 D. Schreiber et al.
Figure 4. Comparison of spectra derived from progressive filtering of sur-face Bouguer anomalies. The grey portion of the spectrum corresponds tosources at the Moho depth following the work by Spector & Grant (1970).The bold line represents the gravity effect of a realistic Moho geometry andα the slope of the spectrum. The 65-km-low-pass filtered Bouguer anomalyspectrum is comparable to the spectrum of the Moho gravity effect in termof slope and lower inflection point.
horizontal cross-sections generated at the depth corresponding tothe Moho depth defined by each curve. Therefore, this prelimi-nary 3-D model represents the topography of the European Moho.However, the Thouvenot et al. (2007) Moho map being incompletein the eastern part of the area of interest and particularly in theLigurian Moho realm, we implemented our previous 3-D modelwith the Waldhauser et al. (1998) Moho depth values.
Regarding the integration of the local earthquake tomographyconstraints and the 3-D modelling of the Ivrea body shape, weimported in the 3-D GeoModeller a 3-D seismological tomographygrid (Vp values) provided by Paul et al. (2001) with a maximalresolution until 30 km depth. The Ivrea body being characterizedby a strong Vp velocity gradient corresponding to the Vp isovalueequal to 7.0 km s−1, we therefore calculated the 3-D geometry ofthe Ivrea body using this Vp isovalue.
Finally, the 3-D geometrical model combining the available geo-physical data from Waldhauser et al. (1998), Paul et al. (2001) andThouvenot et al. (2007), is presented in Fig. 6. The latter is the first3-D representation of the superposed Mohos in the SouthwesternAlps composed by three modelled layers: The Ivrea body, the uppermantle and the orogenic crust.
In this model, the Ivrea body appears split into two distinct units.The first one is localized beneath the Dora Maıra massif at around10 km depth and stops abruptly at around 17 km depth. The secondunit expands between around 20–21 km and 30 km depth. The Ivreabody remains separated in two pieces even if we calculate the modelwith Vp values of 6.9 and 6.8 km s−1.
Taking into account the complex collisional setting of the South-western Alps, an alternative, more complex, model involving a
Figure 5. Long wavelength gravity anomaly map of the Southern Alps computed with the 65-km-low-pass filtering. This gravity map represents the gravitysignature of the Moho in the studied zone. The Projection is according the Lambert II extended system.
C© 2010 The Authors, GJI
Journal compilation C© 2010 RAS
3-D modelling of Alpine Mohos in SW Alps 7
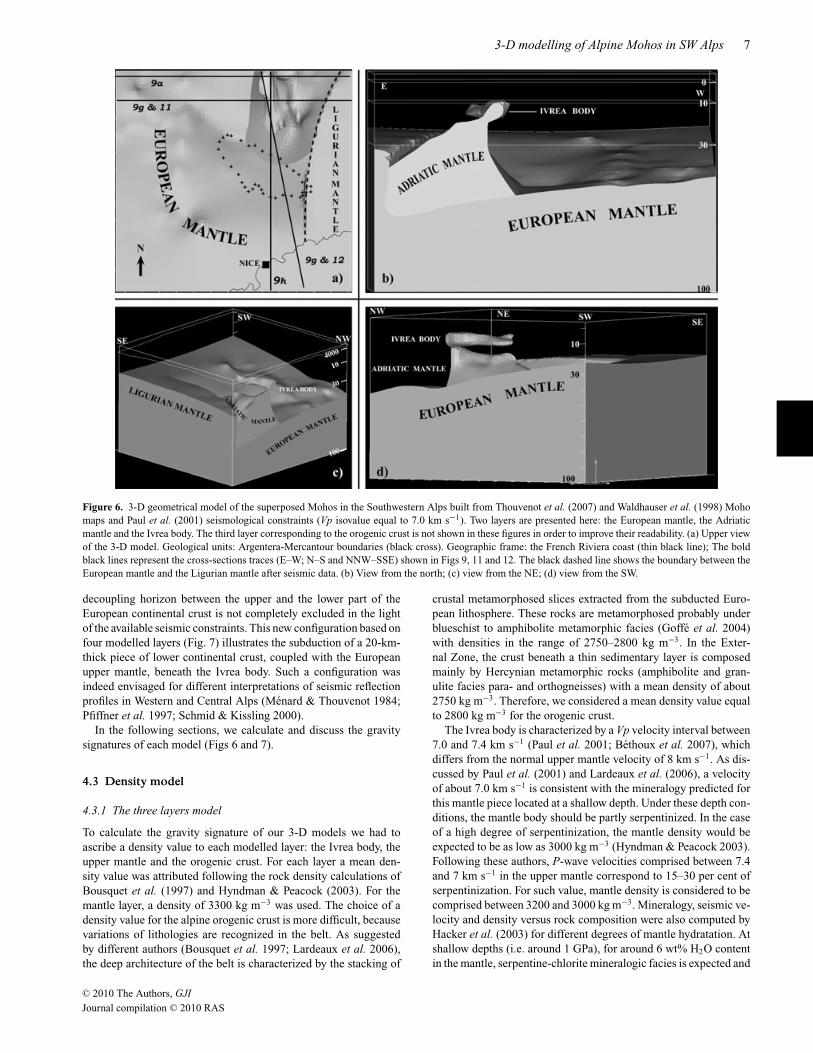
Figure 6. 3-D geometrical model of the superposed Mohos in the Southwestern Alps built from Thouvenot et al. (2007) and Waldhauser et al. (1998) Mohomaps and Paul et al. (2001) seismological constraints (Vp isovalue equal to 7.0 km s−1). Two layers are presented here: the European mantle, the Adriaticmantle and the Ivrea body. The third layer corresponding to the orogenic crust is not shown in these figures in order to improve their readability. (a) Upper viewof the 3-D model. Geological units: Argentera-Mercantour boundaries (black cross). Geographic frame: the French Riviera coast (thin black line); The boldblack lines represent the cross-sections traces (E–W; N–S and NNW–SSE) shown in Figs 9, 11 and 12. The black dashed line shows the boundary between theEuropean mantle and the Ligurian mantle after seismic data. (b) View from the north; (c) view from the NE; (d) view from the SW.
decoupling horizon between the upper and the lower part of theEuropean continental crust is not completely excluded in the lightof the available seismic constraints. This new configuration based onfour modelled layers (Fig. 7) illustrates the subduction of a 20-km-thick piece of lower continental crust, coupled with the Europeanupper mantle, beneath the Ivrea body. Such a configuration wasindeed envisaged for different interpretations of seismic reflectionprofiles in Western and Central Alps (Menard & Thouvenot 1984;Pfiffner et al. 1997; Schmid & Kissling 2000).
In the following sections, we calculate and discuss the gravitysignatures of each model (Figs 6 and 7).
4.3 Density model
4.3.1 The three layers model
To calculate the gravity signature of our 3-D models we had toascribe a density value to each modelled layer: the Ivrea body, theupper mantle and the orogenic crust. For each layer a mean den-sity value was attributed following the rock density calculations ofBousquet et al. (1997) and Hyndman & Peacock (2003). For themantle layer, a density of 3300 kg m−3 was used. The choice of adensity value for the alpine orogenic crust is more difficult, becausevariations of lithologies are recognized in the belt. As suggestedby different authors (Bousquet et al. 1997; Lardeaux et al. 2006),the deep architecture of the belt is characterized by the stacking of
crustal metamorphosed slices extracted from the subducted Euro-pean lithosphere. These rocks are metamorphosed probably underblueschist to amphibolite metamorphic facies (Goffe et al. 2004)with densities in the range of 2750–2800 kg m−3. In the Exter-nal Zone, the crust beneath a thin sedimentary layer is composedmainly by Hercynian metamorphic rocks (amphibolite and gran-ulite facies para- and orthogneisses) with a mean density of about2750 kg m−3. Therefore, we considered a mean density value equalto 2800 kg m−3 for the orogenic crust.
The Ivrea body is characterized by a Vp velocity interval between7.0 and 7.4 km s−1 (Paul et al. 2001; Bethoux et al. 2007), whichdiffers from the normal upper mantle velocity of 8 km s−1. As dis-cussed by Paul et al. (2001) and Lardeaux et al. (2006), a velocityof about 7.0 km s−1 is consistent with the mineralogy predicted forthis mantle piece located at a shallow depth. Under these depth con-ditions, the mantle body should be partly serpentinized. In the caseof a high degree of serpentinization, the mantle density would beexpected to be as low as 3000 kg m−3 (Hyndman & Peacock 2003).Following these authors, P-wave velocities comprised between 7.4and 7 km s−1 in the upper mantle correspond to 15–30 per cent ofserpentinization. For such value, mantle density is considered to becomprised between 3200 and 3000 kg m−3. Mineralogy, seismic ve-locity and density versus rock composition were also computed byHacker et al. (2003) for different degrees of mantle hydratation. Atshallow depths (i.e. around 1 GPa), for around 6 wt% H2O contentin the mantle, serpentine-chlorite mineralogic facies is expected and
C© 2010 The Authors, GJI
Journal compilation C© 2010 RAS

8 D. Schreiber et al.
Figure 7. 3-D geometrical model built from Thouvenot et al. (2007) and Waldhauser et al. (1998) Moho maps and Paul et al. (2001) seismological constraints(Vp isovalue equal to 7.0 km/s) with a additional layer of subducted continental crust beneath the Ivrea body. Three layers are presented here: the Europeanmantle, the orogenic lower crust, the Adriatic mantle and the Ivrea body. The fourth layer corresponding to the upper orogenic crust is not shown in thesefigures in order to improve their readability. (a) Upper view of the 3-D model. Geological units: Argentera-Mercantour boundaries (black cross). Geographicframe: the French Riviera coast (thin black line); The black dashed line shows the boundary between the European mantle and the Ligurian mantle after seismicdata; (b) View from the north; (c) view from the NE; (d) view from the SW.
mantle densities around 3200 kg m−3 are calculated. We have there-fore calculated the gravity effect of our model with a density valueof the Ivrea body comprised between 3300 and 3000 kg m−3. In ourexperiences, it appears that a density value of 3230 kg m−3 producesthe best fit between measured and observed gravity anomalies. Thisdensity value was also proposed for the Ivrea body by previousauthors in their interpretations of deep seismic reflection profiles inthe western Alps (see Marchant & Stampfli (1997) for example).
4.3.2 The four layers model
With respect to the previously presented model we had to ascribe adensity value to the new layer of subducted continental crust beneaththe Ivrea body. Following the mineralogical models proposed byBousquet et al. (1997), we considered a density range between2800 and 3000 kg m−3 for this piece of underthursted continentalcrust and the gravity effect was then computed using this densityrange.
4.4 Gravity signature of our 3-D models
The results of our modelling are presented in Fig. 8. The gravityeffects of both three and four layers models were computed and themisfits between the measured and the computed gravity anomalieswere calculated (Figs 8a and b).
The first-order gravity shape of the gravity effect of the three lay-ers model (Fig. 8a) is in reasonable agreement with the shape of theobserved anomaly. Indeed, the misfit values are comprised between−38 and 67 mGal. Such moderate discrepancies between the ob-served and calculated gravity anomalies suggest that the proposedMoho geometry is compatible with gravity data.
On the other hand, considering the four layers model (Fig. 7),the misfit of the gravity effect of this model and the available datais significantly degraded whatever the considered density range(Fig. 8b). For a density value from 2800 to 3000 kg m−3 the gravityeffect generated by the Ivrea body is considerably weakened. Thissuggests that subduction of continental crust is no more active inthe present-day configuration of the Southwestern Alps.
In the following section, we propose thus to invert gravity datato further improved the gravity fit starting from the three layers 3-Dmodel.
5 R E F I N E M E N T O F T H E M O D E LB Y 3 - D G R AV I T Y I N V E R S I O N
5.1 Inversion methodology
Having produced a 3-D model of the superposed alpine Mohos,inversion can be used to test the validity of that model with respectto independent data sets. We will discuss how we can statistically
C© 2010 The Authors, GJI
Journal compilation C© 2010 RAS

3-D modelling of Alpine Mohos in SW Alps 9
Figure 8. (a) Gravity effect of the 3-D geometrical model presented in Fig. 6 and calculated with density values equal to 3300 kg m−3 for the mantlelayer, 3230 kg m−3 for the Adriatic mantle and 2800 kg m−3 for the orogenic crust. The misfit is calculated in comparison with the long wavelenght (the65-km-low-pass-filtering) gravity anomaly map. (b) Gravity effect of the 3-D geometrical model presented in Fig. 7 and calculated with density values equalto 3300 kg m−3 for the mantle layer, 3230 kg m−3 for the Adriatic mantle 3000 kg m−3 for the orogenic lower crust and 2800 kg m−3 for the upper orogeniccrust. The misfit is calculated in comparison with the long wavelenght (the 65-km-low-pass-filtering) gravity anomaly map.
estimate the robustness of such 3-D model taking into account vari-ation of gravity data. This estimation can be computed by usingcomplementary data sets, provided that: (i) the data are a functionof the 3-D distribution of a gravity source, (ii) the response of agiven 3-D source distribution can be calculated and (iii) the sourcedistribution shows some degree of correlation with the litho-regions.Gravity data generally satisfy these criteria, and a 3-D gravity inver-sion is possible using a probabilistic formulation of the inverse prob-lem (Bosch 1999; Guillen et al. 2000, 2008; Bosch & McGaughey2001). Unfortunately, gravity data do not allow source geometry tobe uniquely resolved through inversion, nor is the source geometrylikely to be perfectly correlated with the litho-regions (i.e. densi-ties of the different units). Even allowing for these limitations, wecan see through the expression for the posterior probability densityfunction (PPD) for a Bayesian inversion procedure how uncertainty
in prior geological knowledge is modified by investigating the fit toobserved potential field data for various models;
P(m | do) = kρ(m)L(do | m), (1)
where k is a normalizing constant, ρ(m) is the prior probability forthe property model m based on geological knowledge, and L(do | m)is the likelihood function that reflects the agreement between theobserved potential field response and the predicted response of themodel. In eq. (1), the prior probability is a measure of the variabilityin model properties that we allow based on geological/seismologicalknowledge. Litho-models that have reasonable probability based onprior knowledge are downgraded if the likelihood deduced from theassociated potential field response is very low.
C© 2010 The Authors, GJI
Journal compilation C© 2010 RAS

10 D. Schreiber et al.
Figure 9. Results of the probalistic inversion process from crustal-scale cross-sections (E–W, N–S and NNW–SSE) extracted and calculated from the 3-Dmodel (Fig. 6). The cross-sections, (a, b, g and h) represent the topology of the starting model shown in Fig. 6. The topology of the starting model is alsoidentified in the other cross sections by red and white lines. Cross-sections (c, d, i and j) calculated from the litho-inversion model show the probability to findthe Ivrea body and the European lithospheric mantle whereas (e, f, k and l) cross sections present the distribution of the initial density values within the 95 percent confidence limits.
C© 2010 The Authors, GJI
Journal compilation C© 2010 RAS
3-D modelling of Alpine Mohos in SW Alps 11
5.2 Practical procedure
The geological model is discretized into a 3-D matrix of voxels,to produce an initial rock unit (‘lithology’) model. Lithology is theprimary model parameter. The lithology associated with subsur-face voxels information is free to vary, subject to the condition thatthe topology of the initial model remains unchanged; i.e. no newgeological objects are generated or segmented. The inversion ex-plores variations to the initial model, which reproduces the suppliedgravity within a desired tolerance level. The adopted strategy is torandomly walk around the space of possible models for a given setof a priori information. This approach was proposed by Mosegaard& Tarantola (1995) and developed in 2-D by Bosch & McGaughey(2001).
Many transient models are derived from the initial model usingan iterative procedure. At each iteration, occurs one of two possiblechanges. The physical property (density) for a randomly selectedvoxel that is separated from the boundary of that unit may be mod-ified. Alternately, the lithology of a voxel that lies on the interfacebetween two or more units may be modified and a new physical prop-erty assigned to that voxel according to a random selection from theprobability function of the relevant physical property distributionfor the new lithology.
The change in the misfit between the observed gravity field dataand the responses calculated for the modified model is determined.This change is examined in a probabilistic framework to determinewhether the modification to the model is accepted.
During the initial part of the inversion, the data misfit for eachfield of the current model follows a generally decreasing trend. Atsome point, the data misfit reaches an asymptotic value, definedor set in function of the measurement errors and start to begin
stored. These models are an exploration of the probability spaceof acceptable models and several millions of such models can beiterated end stored.
Once inversion finished, the set of stored model allows comput-ing, for each voxel, the probability of finding each unit, the mostprobable lithology and the mean value of the petrophysical prop-erties (see Guillen et al. (2008) for a thorough description of theinversion scheme).
5.3 Inversion processing results
The initial alpine Moho model of Fig. 6 was discretized in voxelsof 1000 m ×1000 m × 2000 m. The gravity effect of the model wascomputed using the initial mean density values of 3300 kg m−3 forthe mantle layer, 2800 kg m−3 for the crust and 3230 kg m−3 forthe Ivrea body, and a standard deviation of 50 kg m−3. This devia-tion value of the density is used stochastically during the inversionprocess to modify the density properties of each layer in order to fitwith the measured gravity anomaly map along the iterations.
The results of the inversion process are presented in the Figs 9and 10. The first results (Fig. 9) are provided in terms of probabilityto find the different lithologies in cross sections (E–W, NNW–SSEand N–S) extracted from the probabilistic inversion 3-D space. Thelatter allow for small fluctuations in density to exist within eachgeological unit, as expected in a complex geological system.
The Figs 9(a), (b), (g) and (h) represent two E–W, one NNW–SSE,and one N–S cross-sections located in Fig. 6. The NNW–SSE andN–S cross-sections (Figs 9g and h) enhance the shape of the Ivreabody. The Figs 9(c), (d), (i) and (j) show the probability of findingthe Ivrea mantle and the European mantle. In each section, the black
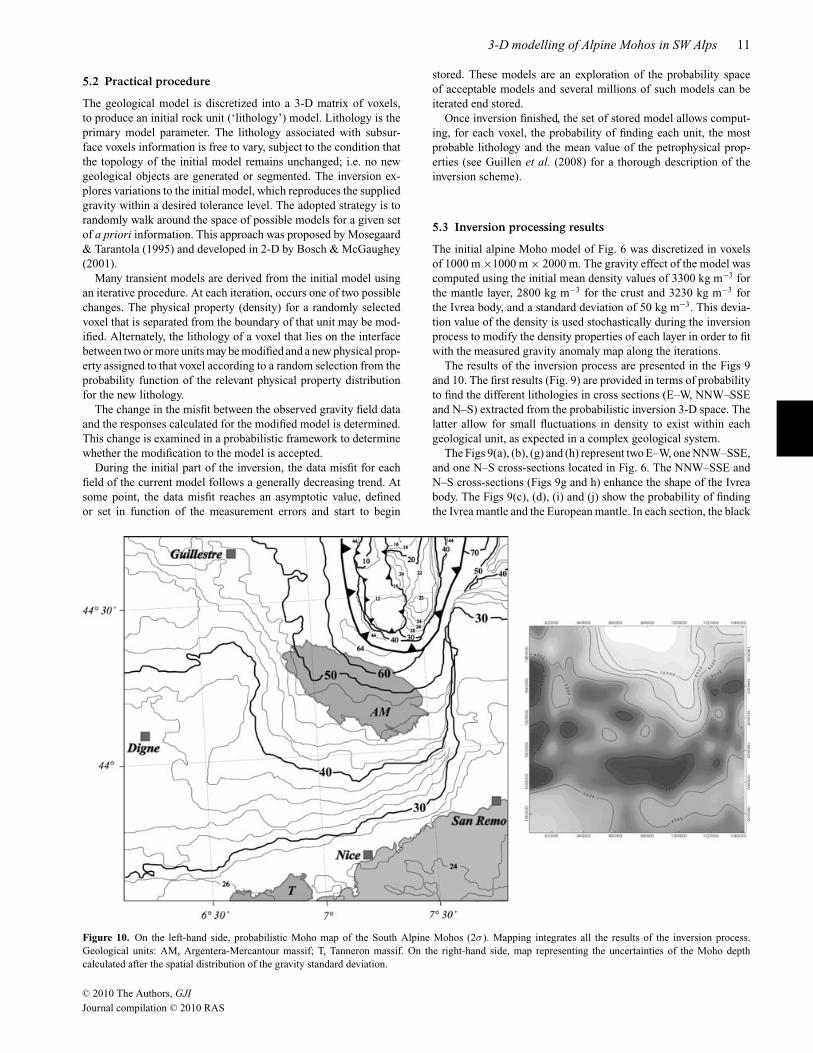
Figure 10. On the left-hand side, probabilistic Moho map of the South Alpine Mohos (2σ ). Mapping integrates all the results of the inversion process.Geological units: AM, Argentera-Mercantour massif; T, Tanneron massif. On the right-hand side, map representing the uncertainties of the Moho depthcalculated after the spatial distribution of the gravity standard deviation.
C© 2010 The Authors, GJI
Journal compilation C© 2010 RAS

12 D. Schreiber et al.
area corresponds to a zero probability whilst white area represents aprobability of one. Thin red lines represent the lithological bound-aries as defined in the starting model of Fig. 6. On Figs 9(e), (f), (k)and (l) the most probable location of the lithological boundaries isshown: black areas correspond to the domains where the probabilityof occurrence of the lithology is less than 0.95 (2σ ). The thin whitelines underline the starting geological model.
The results of the inversion process were also used to producea Moho map (Fig. 10), showing the most probable geometry ofAlpine Mohos and the distribution of the uncertainties on the Mohodepth. The results of this probalistic inversion are consistent withthe crustal 3-D geometry derived in Fig. 6 from seismic and seis-mological data. The European mantle topography as well as thegeometry of the Ivrea body are globally weakly modified during theinversion. In Fig. 9, a continuous Ivrea body can be conclusivelydistinguished from a discontinuous one. However the best fit model,with 100–95% of probability, supports a discontinuous Ivrea bodypartly split into two distinct units, the upper unit located at 10 kmdepth beneath the Dora-Maıra massif, south and west-verging andthe lower unit spreading from 20 to 45 km depth. Moreover, theseismological constraints shows that the shape of the Ivrea bodyremains separated in two pieces in a range Vp values from 6.8 to7.0 km s−1 (Paul et al. 2001; Bethoux et al. 2007). According toThouvenot et al. (2007) the Ivrea body rests upon the Europeanmantle. The latter plunges deeper towards the North beneath the
Argentera massif down to 50–60 km depth. Consistent with theconclusions of Waldhauser et al. (1998) our probabilistic inversionreveals a sharp boundary between the European and the Ligurianmantle East of Argentera massif (Fig. 10). This variation of theMoho topography reaches a maximum of 20 km east of Argenteramassif, and seems to disappear towards the south in the Ligurianbasin.
6 D I S C U S S I O N A N D C O N C LU S I O N S
6.1 Consistency of the proposed 3-D model
The 3-D model of Alpine Mohos in the Southwestern Alps proposedas Fig. 6 is the result of the fusion, in a single and coherent 3-D space,of all the available geophysical constraints (seismic and gravimetricdatabases) obtained in the last 10 yr.
As shown in Fig. 10, the final most probable model derived fromgravity inversion validates the 3-D model presented in Fig. 6 andparticularly the followings.
(1) The partial splitting of the Ivrea Body into two distinct units.(2) The thickness of about 50 km for the European continental
crust beneath the Argentera-Mercantour massif.(3) The decoupling of the European upper mantle from the Eu-
ropean continental crust at the Alpine root.
Figure 11. Interpretative crustal-scale cross-sections of the Southwestern Alps (see Fig. 6a for location) drawn from E–W cross-sections extracted from the3-D probalistic model (Fig. 10). On these cross-sections are show the kinematic indicators and the localization of earthquake hypocentres (dots; Geofrance3-D (1997) recorded seismicity) with respect to the main geological and tectonic boundaries.
C© 2010 The Authors, GJI
Journal compilation C© 2010 RAS

3-D modelling of Alpine Mohos in SW Alps 13
(4) The presence of a boundary between the European and theLigurian mantle East of Argentera massif previously described byWaldhauser et al. (1998).
This new image of the geometry of Alpine Mohos is thereforethe 3-D structure, which offers, at the moment, the best consistencybetween all the geophysical data.
To illustrate the geometry of the Alpine Mohos after refinementby 3-D gravity inversion, we propose a probabilistic Moho mapwith calculated uncertainties on the Moho depth values accordingto the gravity standard deviation (Fig. 10).
6.2 Crustal scale structure of the Southwestern Alpsand earthquake locations
To precise the 3-D crustal-scale structure of the Southwestern Alps,the main geological units and their tectonic boundaries were ex-tracted from the 1/250 000 maps of Gap and Nice (Rouire et al.1980) and imported in our 3-D model (Fig. 10). Two, subperpen-dicular (E–W and NNW–SSE), crustal scale cross-sections (see lo-calization on Fig. 6) were constructed and are presented in Figs 11and 12.
A subdivision of the Ivrea Body into two distinct pieces is highlyprobable and constitutes a prominent result of our 3-D model. Thetwo rigid pieces of Apulian mantle play a significant role in the
development and localisation of crustal strain in the area of in-terest. In our cross-sections, the lowermost piece of the Apulianmantle acts as a mantle identer which tranfers the compression to-wards the external Alpine Zone. Therefore, it corresponds to the‘mantle backstop’ (Fig. 11) of the Oligocene Alpine collision (seeVialon et al. 1989; Ford et al. 2006 for discussion). On the otherhand, the uppermost piece of the Apulian mantle (Ivrea Body) rep-resents a second mechanical heterogeneity still pushing the crustsouthward, leading to the localization of thrusts and folds systemsduring the Mio-Pliocene to current NNW–SSE crustal shorten-ing described in the Southwestern Alps (Giannerini et al. 1977;Campredon & Giannerini 1982; Ritz 1991; Bigot-Cormier et al.2004).
In the NNW–SSE crustal scale cross-sections (Fig. 12), wealso localized, the predictive Moho depth obtained by Bertrand &Deschamps (2000) (Fig. 2a) after receiver function modelling atthe SAOF station. Their prediction appears under-estimated com-pared to the Moho map presented on Fig. 12. As the Bertrand &Deschamps (2000) conclusions relies on synthetics seismogramscomputed for a flat layered crustal model, which is clearly not thecase in the area of interest we consider that their Moho depth es-timate is insufficiently constrained. Nevertheless, it is possible tointerpret the significant change in the P-wave velocity structure ofthe lithosphere observed at 20 km by Bertrand & Deschamps (2000)as an intracrustal decoupling horizon instead of the Moho.
Figure 12. Interpretative crustal-scale cross-sections of the Southwestern Alps (see Fig. 6a for location) drawn from NNW-SSE cross-sections extracted fromthe 3-D probalistic model (Fig. 10). On these cross-sections are shown the kinematic indicators and the localization of earthquake hypocentres (dots; Geofrance3-D (1997) recorded sismicity) with respect to the main geological and tectonic boundaries.
C© 2010 The Authors, GJI
Journal compilation C© 2010 RAS

14 D. Schreiber et al.
The seismological database (see Bethoux et al. (2007)) estab-lished in the framework of the GeoFrance 3-D research program(1998–2003) were also integrated in the 3-D model and earthquakeshypocentres were located with respect to the crustal scale struc-tures. The earthquakes hypocentres were then projected in these twocross sections taking into account a data projected radius equal to10 km.
In the E–W cross-section (Fig. 11), in the Dauphinois zone,earthquake hypocentres are localized on the thrust zones or inversefaults, which accommodate the crustal shortening of the Europeanforeland. Earthquake hypocentres are localized mainly on the Pen-ninic Frontal Thrust (PFT) and/or on its reactivated segments duringpresent-day extension tectonics (Sue & Tricart 1999; Sue & Tricart2003; Tricart et al. 2004, 2006). Another seismic zone correspondsclearly to the Brianconnais backthrust structure Brianconnais back-folds and backthrusts, (Tricart 1984; Sanchez et al. in press) re-activated today by strike-slip tectonics. In the Piedmont zone, theseismicity is clearly controlled by the position of the upper rigidmantle piece, the earthquake hypocentres being mainly observed atthe front of the Apulian mantle indenter. In the Southalpine zone,a restricted number of hypocentres are associated to the Insubricstrike-slip system (see also Bethoux et al. 2007).
In the NNW–SSE cross-section (Fig. 12), the distribution ofearthquake hypocentres is, in a spectacular way, controlled by theposition of the uppermost rigid mantle unit. Indeed, a majorityof hypocentres are localized on the subvertical tectonic structuresdeveloped at the front mantle identer, while a restricted number ofhypocentres underline the main Southverging basal thrust, beneaththe Argentera-Mercantour massif, considered by several authors(Bethoux et al. 1988; Chaumillon et al. 1994; Bigot-Cormier et al.2004) as the tectonic structure accommodating the inversion of theLigurian margin.
We can therefore conclude that in the Southwestern Alps the seis-micity is strongly controlled by tectonic crustal scale structures andparticularly the position of the Apulian upper mantle. The seismic-ity is located in the brittle upper part of the orogenic crust boundedby the main basal shear plane (Alpine sole thrust) still active today(Figs 11 and 12).
A C K N OW L E D G M E N T S
We gratefully acknowledge two anonymous reviewers and SaskiaGoes for their helpful comments. We wish to thank P. Ledru,P. Calcagno, N. Bethoux, E, Tric, Y. Rolland, G. Sanchez and G.Giannerini for constructive discussions. Finally, we acknowledgeA. Paul for exchange of ideas and for the tomographic database.
R E F E R E N C E S
Bertrand, E. & Deschamps, A., 2000. Lithospheric structure of the southernFrench Alps inferred from broadband analysis, Phys. Earth planet. Inter.,122, 79–102.
Bethoux, N., Cattaneo, M., Delpech, P.-Y., Eva, C. & Rehault, J.-P., 1988.Mecanismes au foyer de seismes en Mer Ligure et dans le sud des Alpesoccidentals: resultats et interpretations, C. R. Acad. Sci. Paris, 307(11),71–77.
Bethoux, N., Sue, C., Paul, A., Virieux, J., Frechet, J., Thouvenot, F. &Cattaneo, M., 2007. Local tomography and focal mechanisms in theSouthwestern Alps: comparison of methods and tectonic implications,Tectonophysics, 432, 1–19.
Bigi, G., Castellarin, A., Coli, M., Dal Piaz, G.V., Sartori, R., Scandone,P. & Vai, G.-B., 1990. Structural model of Italy, in Progetto FinalizzatoGeodinamica, C.N.R., Firenze.
Bigot-Cormier, F., Sage, F., Sosson, M., Deverchere, J., Ferrandini, M.,Guennoc, P., Popoff, M. & Stephan, J.-F., 2004. Pliocene deformationof the north-Ligurian margin (France): consequences of a south-Alpinecrustal thrust, Bull. Soc. Geol. Fr., 175, 197–211.
Bosch, M., 1999. Lithologic tomography: from plural geophysical data tolithology estimation, J. geophys. Res., 104, 749–766.
Bosch, M. & McGaughey, J., 2001. Joint inversion of gravity and magneticdata under lithologic constraints, Leading Edge, 20, 877–881.
Bousquet, R., Goffe, B., Henry, P. & Chopin, C., 1997. Kinematic, thermaland petrological model of the Central Alps: Lepontine metamorphism inthe upper crust and eclogitisation of the lower crust, Tectonophysics, 273,105–127.
Calcagno, P., Chiles, J.P., Courrioux, G. & Guillen, A., 2008. Geologicalmodelling from field data and geological knowledge. Part I: modellingmethod coupling 3-D potential-field interpolation and geological rules,Phys. Earth planet. Inter., 171, 147–157.
Campredon, R. & Giannerini, G., 1982. Le synclinal de Saint Antonin (arcde Castellane, chaınes subalpines meridionales). Un exemple de bassinsoumis a une deformation compressive permanente depuis l’Eocenesuperieur, Geologie Alpine, 58, 15–20.
Chaumillon, E., Deverchere, J., Rehault, J.-P. & Gueguen, E., 1994.Reactivation tectonique et flexure de la marge continentale ligure(Mediterranee occidentale), C. R. Acad. Sci. Paris, 319, 675–682.
Closs, H. & Labrouste, Y., 1963. Recherces seismologiques dans les Alpesoccidentales au moyen de grandes explosions en 1956, 1958 et 1960,Mem. Coll. Ann. Geophys. Int., 12, 241pp., CNRS, Paris.
Coward, M.P. & Dietrich, D., 1989. Alpine tectonics; an overview, Geolog-ical Soc. Special Pub., 45, 1–29.
Ford, M., Duchene, S., Gasquet, D. & Vanderhaeghe, O., 2006. Two-phaseorogenic convergence in the external and internal SW alps, J. Geol. Soc.,Lond., 163, 815–826.
Giannerini, G., Gigot, P. & Campredon, R., 1977. Le tertiaire de la Roque-Esclapon (front sud de l’arc de Castellane): la superposition de deuxdeformations synsedimentaires Oligocene et Miocene et des basinssedimentaires associes, Bull. BRGM, Fr. (2), Section 1, no. 3, 179–188.
Goffe, B., Schwartz, S., Lardeaux, J.M. & Bousquet, R., 2004. Metamorphicstructures of the western and Ligurian Alps, Mitt. Osterr. Mineral. Ges.,149, 125–144.
Grandjean, G., Mennechet, C., Debeglia, N. & Bonijoly, D., 1998. Insuringthe quality of gravity data, EOS, Trans.–Am. geophys. Un., 79, 217–221.
Grellet, B., Combes, P., Granier, T. & Philip, H., 1993. Sismotectonique dela France metropolitaine dans son cadre geologique et geophysique, Vol.164, Mem. Hors-Ser. Soc. geol.
Groupe de recherche GeoFrance 3-D, 1997. GeoFrance 3-D: l’imageriegeologique et geophysique du sous-sol de la France, Mem. Soc. geol. Fr,172, 53–71.
Guillen, A., Calcagno, P., Courrioux, G., Joly, A. & Ledru, P., 2008. Ge-ological modelling from field data and geological knowledge. Part II:modelling validation using gravity and magnetic data inversion, Phys.Earth planet. Inter., 171, 158–169.
Guillen, A., Delos, V. & Ledru, P., 2000. A new method to determine lithol-ogy and geometry in depth: 3-D litho-inversion of potential fields. in 25thGeneral Assembly, pp. abstract, ed. Society, E.G., Katlenburg-Lindau,Federal Republic of Germany (DEU).
Hacker, B.R., Abers, G.A. & Peacock, S.M., 2003. Subduction factory 1.Theoretical mineralogy, densities, seismic wave speeds, and H2O con-tents, J. geophys. Res., 108, doi:10.1029/2001JB001127.
Hyndman, R.D. & Peacock, S.M., 2003. Serpentinization of the forearcmantle, Earth planet. Sci. Lett., 212, 417–432.
Lardeaux, J.M., Schwartz, S., Tricart, P., Paul, A., Guillot, S., Bethoux, N.& Masson, F., 2006. A crustal-scale cross-section of the southwesternAlps combining geophysical and geological imagery, Terra Nova, 18(6),412–422.
Marchant, R.H. & Stampfli, S.M., 1997. Crustal and lithospheric structure ofthe Western Alps. in Deep Structure of the Swiss Alps: Results of NFP20,pp. 326–337, ed. Pfiffner, O.A. et al., Birkhauser, Basel.
C© 2010 The Authors, GJI
Journal compilation C© 2010 RAS

3-D modelling of Alpine Mohos in SW Alps 15
Martelet, G., Calcagno, P., Gumiaux, C., Truffert, C., Bitri, A., Gapais, D.& Brun, J.P., 2004. Integrated 3-D geophysical and geological modellingof the Hercynian Suture Zone in the Champtoceaux area (south Brittany,France), Tectonophysics, 382, 117–128.
Martelet, G., Debeglia, N. & Truffert, C., 2002. Homogeneisation et val-idation des corrections de terrain gravimetriques jusqu’a la distance de167 km sur l’ensemble de la France, Comptes Rendus Geoscience, 334,449–454.
Masson, F., Verdun, J., Bayer, R. & Debeglia, N., 1999. Une nouvelle cartegravimetrique des Alpes occidentales et ses consequences structurales ettectoniques, C. R. Acad. Sci. Paris, 329, 865–871.
Menard, G., 1979. Relations entre structures profondes et structures su-perficielles dans le Sud-Est de la France. Essai d’utilisation de donneesgeophysiques, These de 3e Cycle, Grenoble.
Menard, G. & Thouvenot, P., 1984. Ecaillage de la lithosphere europeennesous les Alpes Occidentales; arguments gravimetriques et sismiques liesa l’anomalie d’Ivrea, Bulletin de la Societe Geologique de France, 26,875–884.
Mosegaard, K. & Tarantola, A., 1995. Monte Carlo sampling of solutionsto inverse problems, J. geophys. Res., 100(B7), 12 431–12 477.
Paul, A., Cattaneo, M., Thouvenot, F., Spallarossa, D., Bethoux, N. &Frechet, J., 2001. A three-dimensional crustal velocity model of the south-western Alps from local earthquake tomography, J. geophys. Res, 106,19 367–19 389.
Pfiffner, O.A., Lehner, P., Heitzmann, P., Mueller, S. & Steck, A., 1997.Deep Structure of the Swiss Alps: Results of NRP 20, pp. 380, Birkhauser,Basle.
Ritz, J.F., 1991. Evolution du champ de contraintes dans les Alpes du Suddepuis la fin de l’Oligocene: implications sismotectoniques, 3e Cycle,PhD thesis. University of Monpellier II, France.
Rouire, J., Autran, A., Prost, A., Rossi, P. & Rousset, C., 1980. Noticeexplicative de la feuille Nice au 1/250 000 eBureau de RecherchesGeologiques et Minieres, Orleans.
Roure, R., Polino, R. & Nicolich, R., 1990. Early Neogene deformationbeneath the Po Plain: constraints on the post-collisional Alpine evolution,Mem. Soc. Geol. Fr., 156, 309–321.
Roure, F., Choukroune, P. & Polino, R., 1996. Deep seismic reflection dataand new insights on the bulk geometry of mountain ranges, C. R. Acad.Sci. Paris, 322(2a), 345–359.
Sanchez, G., Rolland, Y., Schreiber, D., Giannerini, G., Corsini, M. &Lardeaux, J.-M., The active fault system in of SW Alps, J. Geodyn.,doi:10.1013/j.jog.2009.11.009.
Sapin, M. & Hirn, A., 1974. Results of explosion seismology in the southernRhone valley, Ann. Geophys., 30, 181–202.
Schmid, S.M. & Kissling, E., 2000. The arc of the western Alps in thelight of geophysical data on deep crustal structure, Tectonics, 19, 62–85.
Spector, A. & Grant, F.S., 1970. Statistical models for interpreting aeromag-netic data, Geophysics, 35(2), 293–302.
Sue, C. & Tricart, P., 1999. Late Alpine brittle extension above the FrontalPennine Thrust near Briancon, Western Alps, Eclogae Geol Helvet, 92,171–181.
Sue, C. & Tricart, P., 2003. Neogene to ongoing normal faulting in the innerwestern Alps: a major evolution of the late alpine tectonics, Tectonics, 5,1–25.
Thouvenot, F. & Perrier, G., 1980. Seismic evidence of a crustal overthrustin the western Alps, Pageoph, 119, 163–184.
Thouvenot, F., Paul, A., Frechet, J., Bethoux, N., Jenatton, L. & Guiguet,R., 2007. Are there really superposed Mohos in the southwestern Alps?New seismic data from fan profiling reflections, Geophys. J. Int., 170,1180–1194.
Tricart, P., 1984. From passive margin to continental collision: a tectonicscenario for the western Alps, Am. J. Sci., 284, 97–120.
Tricart, P., Schwartz, S., Sue, C. & Lardeaux, J. M., 2004. Evidence ofsynextension tilting and doming during final exhumation from multistagefaults (Queyras, Schistes lustres, western Alps), J. Struct. Geol, 26, 1633–1645.
Tricart, P., Lardeaux, J.M., Schwartz, S. & Sue, C., 2006. The late extensionin the inner western Alps: a synthesis along the south-Pelvoux transect,Bulletin de la Societe Geologique de France, 177, 299–310.
Vernant, P., Masson, F., Bayer, R. & Paul, A., 2002. Sequential inversionof local earthquake traveltimes and gravity anomaly—the example of thewestern Alps, Geophys. J. Int., 150, 79–90.
Vialon, P., Rochette, P. & Menard, G., 1989. Indentation and rotation in thewestern Alpine arc, Spec. Publ. Geol. Soc. Lond., 45, 329–338.
Waldhauser, F., Kissling, E., Ansorge, J. & Mueller, S., 1998. Three-dimensional interface modelling with two-dimensional seismic data: theAlpine crust-mantle boundary, Geophys. J. Int., 135, 264–278.
C© 2010 The Authors, GJI
Journal compilation C© 2010 RAS