geophysical survey for groundwater resource appraissal … · ado ekiti with a view to determining...
TRANSCRIPT

© 2014. Oladimeji Lawrence Ademilua, Olufemi Felix Ojo, Akinola Bolaji Eluwole & Oladipupo Babatunde Ademilua. This is a research/review paper, distributed under the terms of the Creative Commons Attribution-Noncommercial 3.0 Unported License http://creativecommons.org/licenses/by-nc/3.0/), permitting all non commercial use, distribution, and reproduction in any medium, provided the original work is properly cited.
Global Journal of Science Frontier Research: H Environment & Earth Science Volume 14 Issue 5 Version 1.0 Year 2014 Type : Double Blind Peer Reviewed International Research Journal Publisher: Global Journals Inc. (USA) Online ISSN: 2249-4626 & Print ISSN: 0975-5896
Geophysical Survey for Groundwater Resource Appraissal in a basement Complex Terrain for Agricultural Purposes; Case Study of ABUAD Teaching and Research Farm, Ado Ekiti, Southwest Nigeria
By Oladimeji Lawrence Ademilua, Olufemi Felix Ojo, Akinola Bolaji Eluwole & Oladipupo Babatunde Ademilua
Ekiti State University, Ado Ekiti, Nigeria Abstract- A combined geophysical survey involving the Very Low Frequency Electromagnetic and the Electrical resistivity survey has been carried out in the Teaching and Research Farm of the Afe Babalola University along Ado – Ikare road, Ado Ekiti with a view to determining the subsurface layers and thickness of the overburden as a means to appraising the ground water potential in the study area. Seventeen (17) west east traverses were established from which VLF –Electromagnetic data were acquired at a station interval of 5m each, the modeling and interpretation results from these were used to delimit the farm area into a total of 29 points from where vertical electrical soundings were carried out for further detailed survey using the Schlumberger electrode array configuration. The sounding data was processed and interpreted using WINRESIST interpretation software.
Keywords: aquifer, VLF-EM, vertical electrical sounding.
GJSFR-H Classification : FOR Code: 260501
GeophysicalSurveyforGroundwaterResourceAppraissalinabasementComplexTerrainforAgriculturalPurposesCaseStudyofABUADTeachingandResearchFarmAdoEkitiSouthwestNigeria
Strictly as per the compliance and regulations of :

Geophysical Survey for Groundwater Resource Appraissal in a basement Complex Terrain for Agricultural Purposes; Case Study of ABUAD
Teaching and Research Farm, Ado Ekiti, Southwest Nigeria
Oladimeji Lawrence Ademilua α, Olufemi Felix Ojo σ, Akinola Bolaji Eluwole ρ & Oladipupo Babatunde Ademilua Ѡ
Abstract- A combined geophysical survey involving the Very Low Frequency Electromagnetic and the Electrical resistivity survey has been carried out in the Teaching and Research Farm of the Afe Babalola University along Ado – Ikare road, Ado Ekiti with a view to determining the subsurface layers and thickness of the overburden as a means to appraising the ground water potential in the study area. Seventeen (17) west east traverses were established from which VLF –Electromagnetic data were acquired at a station interval of 5m each, the modeling and interpretation results from these were used to delimit the farm area into a total of 29 points from where vertical electrical soundings were carried out for further detailed survey using the Schlumberger electrode array configuration. The sounding data was processed and interpreted using WINRESIST interpretation software. The resistivities and thicknesses of the layers at the VES points were revealed. The results showed the presence of four geoelectric layers from the top soil / laterite, the clay / clayey sand, the weathered/partly fractured basement and the presumably fresh bedrock. The KH type curve represents the most frequent of the type curves obtained, this is followed by other curves; QH, HA, H and the AA types. Two types of aquifers, which are the weathered and fractured basement aquifers, have been delineated in this study. From the syntheses of the isopach maps of the weathered layer and overburden thicknesses as well as the curve type and parametric data analyses, four positions have exhibited promising characteristics for possible groundwater development. These positions arranged in order of hydrogeologic significance are VES V5, V17, V23 and V10, while other positions including V7, V11, V14, V19, V20, ,V27, V28 exhibited low prospects. Two boreholes RB1 and RB2 located at VES points V5 and V17 have therefore been proposed for the study area from within the High prospect positions.. These points are located within the coordinates N070 36.942’ E0050 18.046’ for V5 and N070 36.9991’ E0050
18.079’ for V17. Keywords: aquifer, VLF-EM, vertical electrical sounding,
Author α
σ
ρ:
Department of Geology, Ekiti State University,Ado Ekiti, Nigeria. e-mails: [email protected];
Author Ѡ:
Department of Geology, Obafemi Awolowo University,
Ile Ife, Nigeria.
I.
Introduction
fe Babalola University, Ado-Ekiti
(ABUAD) is a fast
growing private University in Nigeria. The continuous increase in progressive infrastructural
development within the University resulting in the establishment of a University Teaching and Research Farm necessitated the development of a sustainable water supply network for irrigation and other domestic uses. Water is an essential commodity for the survival of every living thing (plants and animals). Most human beings generally require about 2.5 liters of water everyday for direct consumption. The average amount of water used domestically each day by every person is around 200 liters (Hamil and Bell, 1986). Normally the easiest and most convenient way to meet the public demand for water is to utilize surface water resources. Unfortunately, fresh water rivers and lakes are less plentiful than may at first be imagined. In addition, they are irregularly distributed across the globe. To complicate matters further, these resources are often polluted where available. The groundwater on the contrary is significantly protected from surface pollutants as the earth media (composed of different subsurface layers) act as a natural filter to infiltrated water. Groundwater development is relatively cheap and therefore constitutes a viable option or supplement to the expensive earth and concrete dam systems of surface water supply, where potential groundwater is good. This makes the evaluation of groundwater potential in the study area an important research. Groundwater occurs in geological formations, which depends on the geology of the area. Some of the geological formations that hold groundwater can either be described as: aquifers, aquicludes or aquitards. Electrical and electromagnetic techniques are used in groundwater geophysical investigations because of the correlations that often exist betwee
electrical properties,
A
1
Globa
lJo
urna
lof
Scienc
eFr
ontie
rResea
rch
V
olum
eXIV
X Iss
VYe
a r20
14
)
)
© 2014 Global Journals Inc. (US)
ue Ver
sion
IH
top soil, weathered basement, fresh bedrock.
geologic formations and their fluid content (Flathe, 1970; Zohdy et al.,1974). The direct current electrical resistivity

method for conducting a vertical electrical sounding (VES) has proved very popular with groundwater studies due to the simplicity of the technique and the ruggedness of the instrumentation. The use of geophysical techniques for groundwater studies has been necessitated by a desire to reduce the risk of drilling dry
holes and also a desire to offset costs associated with poor groundwater production.
In the present study, the Very Low Frequency Electromagnetic (VLF-EM) method has been used for reconnaissance and delineation of the Farm area into positions with relatively average to high conductivities which are diagnostic of appreciable thicknesses or fracture. A total of 17 VLF-EM Traverses were established for the purpose.
The positions so delinated were there
after followed up with the secondary but more detailed
electrical resistivity method using Schlumberger array to determine the nature of the superficial material and the subsurface rocks underlying it with a view of determining appropriate points for the location and drilling of productive groundwater boreholes for irrigation,
associated agricultural and domestic purposes in the University Teaching and Research farm .
II.
Site
Location
And
Geology
The University Teaching and Research farm is
situated at the Southwestern part of the main campus of Afe Babalola
University, Ado-Ekiti (ABUAD) which could be found within latitudes 70
36′
53’’N and 70
37’ 12’’ N and longitudes 50
17′45’’ E and 50
18’ 10’’E, Southwest, Nigeria on a vast area of low-land cultivated in part and comprising of several agricultural plants like mango, gmelina and teak trees, palm trees, a fish pond and other ancilliary infrastructures. (Fig. 1). A fairly thick overburden covers the area with varying thicknesses. Underlying the overburden are crystalline rocks consisting of granitic rock, which is equally exposed along the course of the river that flows across the area (Rahaman,1988; Ajibade and Umeji 1989). The geologic setting of the area is typical of the migmatite gneiss complex rocks of the Precambrian Basement Complex of southwestern Nigeria (Rahaman, 1988), comprising of undifferentiated granite, charnockitic rocks, medium to coarse granite and migmatite gneiss rocks. The River Ogbese which is situated at the southern part of the farm and which flows eastward in the area constitute the major drainage network as well as the veritable source of recharge in the area (Figure 1). The vegetation in the area is of rainforest type, characterized by short dry season and long wet season, with high annual rainfall of about 1,300 mm. Annual mean
temperature is between 180 C and 330 C with relatively high humidity (NIMET, 2007.
establishment
of 17 Traverses were used for reconnaissance and delineation of the Farm area into positions with relatively average to high conductivities which are diagnostic of appreciable overburden thicknesses or fracture. The positions so delinated were thereafter followed up with the secondary and more detailed electrical resistivity method using the vertical electrical sounding (VES) to determine the nature of the superficial material and the subsurface rocks underlying the points. The Schlumberger configuration was employed throughout the work. Ojelabi et’ al
(2002) and Ayolabi et’al
(2009) have shown that this configuration has a high penetrating depth per unit current electrode spacing and that it is more suitable for subsurface delineation and groundwater exploration in a basement complex region. A total of 27 VES points that were delineated from the VLF-EM results were occupied and sampled. Also two other points,
VES 28 and 29 were occupied for the purpose of obtaining parametric data (layer thicknesses and resistivities) beside already drilled boreholes in the study area which have not been performing satisfactorily. The OMEGA Terrameter was used for the fieldwork, with the maximum current electrode separation (AB) of 200m. The apparent resistivity data are presented as sounding curves. The VES data represented as sounding curves were quantitatively and qualitatively interpreted to determine the number of subsurface layers, their resistivities as well as thicknesses. The two basic approaches to the interpretation of the curves are the manual partial curve matching method using two layer model curves,while the initial model parameters resulting from the curve matching procedures were then fed into the computer for iteration processing using the software WINRESIST to obtain the final curves as well as the final model parameters as
shown in Figures 2. The curve types obtained are the KH, H, HA, and QH. The Summary of the analysis is as shown in Table 1. The obtained final parameters from the curve in terms of the layer thicknesses and resistivities are then analysed to obtain the thicknesses of the overburden i.e the depth to the fresh bedrock at each VES point as well as the thickness of weathered/partly fractured layer at each VES point. These data were then posted on the base map using the software ARCGIS and then contoured to produce the overburden thickness and the weathered layer thicknesses maps (Figs. 4 and 5).
© 2014 Global Journals Inc. (US)
2
Year
2014
Globa
lJo
urna
lof
Scienc
eFr
ontie
rResea
rch
V
olum
eXIV
X Iss
V)
)
ue Ver
sion
IH
III. Research Methodology
In the first approach, the Very Low Frequency Electromagnetic (VLF-EM) method involving the
Geophysical Survey for Groundwater Resource Appraissal in a basement Complex Terrain for Agricultural Purposes; Case Study of ABUAD Teaching and Research Farm, Ado Ekiti, Southwest Nigeria

Figure 1 :
Base Map of Afe Babalola
University Teaching and Research Farm Showing VLF-EM Traverse
lines and the delineated VES points
Table 1
:
Summary of VES Analysis
VES NO
Layers
Thickness (m)
Resistivity (Ωm)
Curves Type
1
Topsoil/laterite
Clay/clayey sand
Weathered basement
Fresh bedrock
0.9
2.6
5.2
??
313.3
891.1
576
8916.8
KH
3
Globa
lJo
urna
lof
Scienc
eFr
ontie
rResea
rch
V
olum
eXIV
X Iss
VYe
a r20
14
)
)
© 2014 Global Journals Inc. (US)
ue Ver
sion
IH
Geophysical Survey for Groundwater Resource Appraissal in a basement Complex Terrain for Agricultural Purposes; Case Study of ABUAD Teaching and Research Farm, Ado Ekiti, Southwest Nigeria

2
Topsoil/laterite
Clay/clayey sand
Weathered basement
Fresh bedrock
0.7
0.6
2.4
??
64.7
40.8
29.2
1322.1
QH
3
Topsoil/laterite
Clay/clayey sand
Weathered basement
Fresh bedrock
0.6
0.3
7.1
??
454.1
430.4
132
2538.6
HK
4
Topsoil/laterite
Clay/clayey sand
Weathered basement
Fresh bedrock
0.8
1.0
3.0
??
81
79
37.7
7536.7
KH
5
Topsoil/laterite
Clay/clayey sand
Weathered basement
Fresh bedrock
0.8
5.7
12.9
??
98.5
342.8
63.24
2580.3
KH
6
Topsoil/laterite
Clay/clayey sand
Weathered basement
Fresh bedrock
0.4
0.5
2.5
??
22.52
71.69
507
23387.3
AA
7
Topsoil/laterite
Clay/clayey sand
Weathered basement
Fresh bedrock
0.8
0.2
0.8
??
383.3
862.8
11.1
6826.3
QH
8
Topsoil/laterite
Weathered basement
Fresh basement
1.4
2.3
??
247.4
174.5
1787.9
H
9
Topsoil/laterite
Clay/clayey sand
Weathered basement
Basement
1.1
3.5
3.3
??
229.9
79.9
104.1
878.7
HA
10
Topsoil/laterite
Clay/clayey sand
Weathered basement
Fresh bedrock
3.2
6.5
6.7
??
641.8
1117.3
180.0
2515.9
KH
11
Topsoil/laterite
Clay/clayey sand
Weathered basement
Fresh bedrock
0.6
1.3
2.9
??
159.5
317.7
35.5
2080.3
KH
12
Topsoil/laterite
Clay/clayey sand
Weathered basement
Fresh bedrock
0.5
1.3
3.5
??
550.5
1334
40.8
1796.9
KH
13
Topsoil/laterite
Clay/clayey sand
Weathered basement
1.0
0.5
8.9
414.7
394.4
131.7
QH
© 2014 Global Journals Inc. (US)
4
Year
2014
Globa
lJo
urna
lof
Scienc
eFr
ontie
rResea
rch
V
olum
eXIV
X Iss
V)
)
ue Ver
sion
IH
Geophysical Survey for Groundwater Resource Appraissal in a basement Complex Terrain for Agricultural Purposes; Case Study of ABUAD Teaching and Research Farm, Ado Ekiti, Southwest Nigeria

Fresh bedrock
??
2346.8
14
Topsoil/laterite
Clay/clayey sand
Weathered basement
Fresh bedrock
0.4
0.7
3.6
??
158.2
1069.8
43.3
1601.2
KH
15
Topsoil/laterite
Clay/clayey sand
Weathered basement
Fresh bedrock
0.4
0.9
4.5
??
132.4
1038.2
27.5
9442.8
KH
16
Topsoil/laterite
Clay/clayey sand
Weathered basement
Fresh bedrock
0.5
0.8
11.3
??
225.4
760.3
87.6
10603.3
KH
17
Topsoil/laterite
Clay/clayey sand
Weathered basement
Fresh bedrock
0.8
3.7
15.3
??
165.9
513.5
228.9
35007.5
KH
18
Topsoil/laterite
Clay/clayey sand
Weathered basement
Fresh bedrock
0.6
0.4
10.3
??
875.8
1583.3
76.5
8778.9
KH
19
Topsoil/laterite
Clay/clayey sand
Weathered basement
Fresh bedrock
0.6
0.8
5.3
??
173.4
426.3
32.8
24604.2
KH
20
Topsoil/laterite
Clay/clayey sand
Weathered basement
Fresh bedrock
0.9
0.4
3.9
??
1238.7
1733.5
124.5
2428.2
KH
21
Topsoil/laterite
Clay/clayey sand
Weathered basement
Fresh bedrock
0.7
1.3
8.1
??
361.9
546.1
76.4
10218.9
KH
22
Topsoil/laterite
Clay/clayey sand
Weathered basement
Fresh bedrock
0.6
0.5
6.5
??
358.6
573.5
69.3
1203.9
KH
23
Topsoil/laterite
Clay/clayey sand
Weathered basement
Fresh bedrock
0.8
1.0
13.5
??
219.1
242.4
53.3
3995.7
KH
24
Topsoil/laterite
Clay/clayey sand
Weathered basement
Fresh bedrock
1.1
0.6
9.3
??
388.5
506.4
46.8
6399.3
KH
5
Globa
lJo
urna
lof
Scienc
eFr
ontie
rResea
rch
V
olum
eXIV
X Iss
VYe
a r20
14
)
)
© 2014 Global Journals Inc. (US)
ue Ver
sion
IH
Geophysical Survey for Groundwater Resource Appraissal in a basement Complex Terrain for Agricultural Purposes; Case Study of ABUAD Teaching and Research Farm, Ado Ekiti, Southwest Nigeria
25
Topsoil/laterite
Clay/clayey sand
Weathered basement
Fresh bedrock
0.9
0.6
7.8
??
363.9
245.6
42.7
3278.6
QH
26 Topsoil/laterite
Clay/clayey sand
Weathered basement
Fresh bedrock
0.8
0.6
8.4
??
408.5
398.8
41.1
6238.7
QH
27 Topsoil/laterite
Clay/clayey sand
Weathered basement
Fresh bedrock
0.7
2.5
1.2
??
490.5
138.5
7.1
20663.9
QH
28 Topsoil/laterite
Clay/clayey sand
Weathered basement
Fresh bedrock
0.4
0.7
2.4
??
39.3
175.0
17.6
37704.1
KH
29
Topsoil/laterite
Clay/clayey sand Weathered basement
Fresh bedrock
0.4
0.7 3.2 ??
66.1
317.1 27.1
6782.8
KH
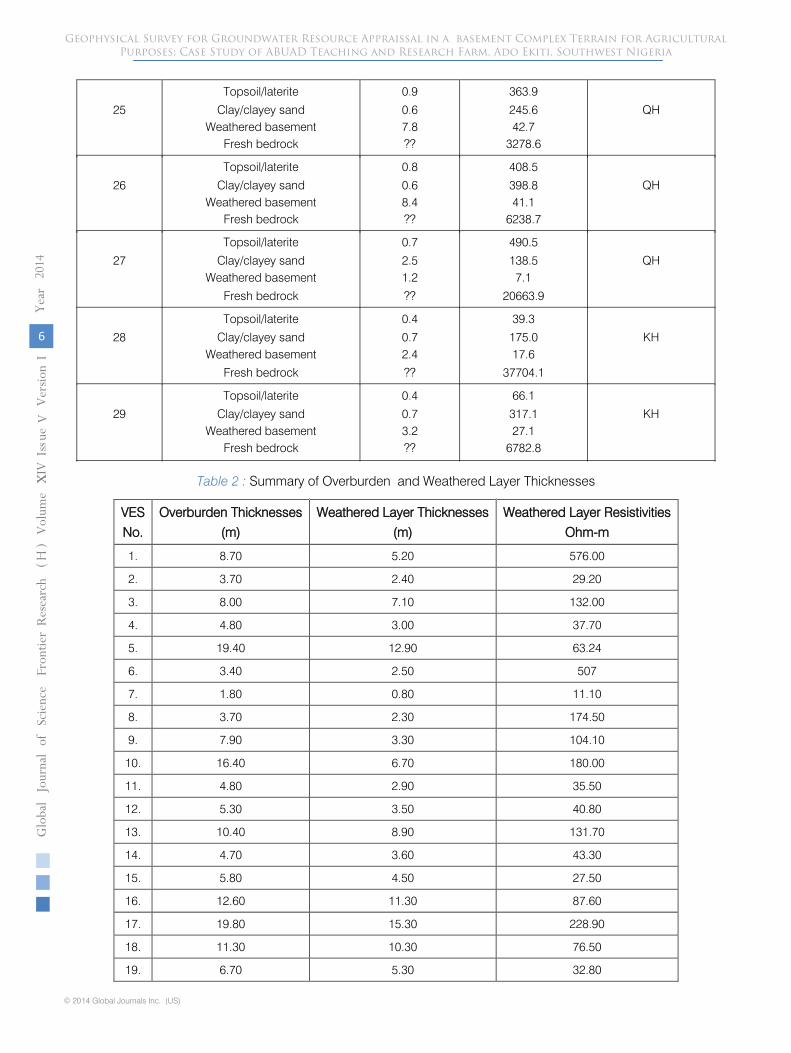
Table 2 : Summary of Overburden and Weathered Layer Thicknesses
VES
No. Overburden Thicknesses
(m) Weathered Layer Thicknesses
(m) Weathered Layer Resistivities
Ohm-m
1. 8.70 5.20 576.00
2. 3.70 2.40 29.20
3. 8.00 7.10 132.00
4. 4.80 3.00 37.70
5. 19.40 12.90 63.24
6. 3.40 2.50 507
7. 1.80 0.80 11.10
8. 3.70 2.30 174.50
9. 7.90 3.30 104.10
10. 16.40 6.70 180.00
11. 4.80 2.90 35.50
12. 5.30 3.50 40.80
13. 10.40 8.90 131.70
14. 4.70 3.60 43.30
15. 5.80 4.50 27.50
16. 12.60 11.30 87.60
17. 19.80 15.30 228.90
18. 11.30 10.30 76.50
19. 6.70 5.30 32.80
© 2014 Global Journals Inc. (US)
6
Year
2014
Globa
lJo
urna
lof
Scienc
eFr
ontie
rResea
rch
V
olum
eXIV
X Iss
V)
)
ue Ver
sion
IH
Geophysical Survey for Groundwater Resource Appraissal in a basement Complex Terrain for Agricultural Purposes; Case Study of ABUAD Teaching and Research Farm, Ado Ekiti, Southwest Nigeria

20.
5.20
3.90
124.50
21.
10.10
8.10
76.40
22.
7.60
6.50
69.30
23.
15.3
13.50
53.30
24.
11.00
9.30
46.80
25.
9.30
7.80
42.70
26.
9.80
8.40
41.10
27.
4.40
1.20
7.10
28.
3.50
2.40
17.60
29.
4.30
3.20
27.10
IV. Results And Discussion
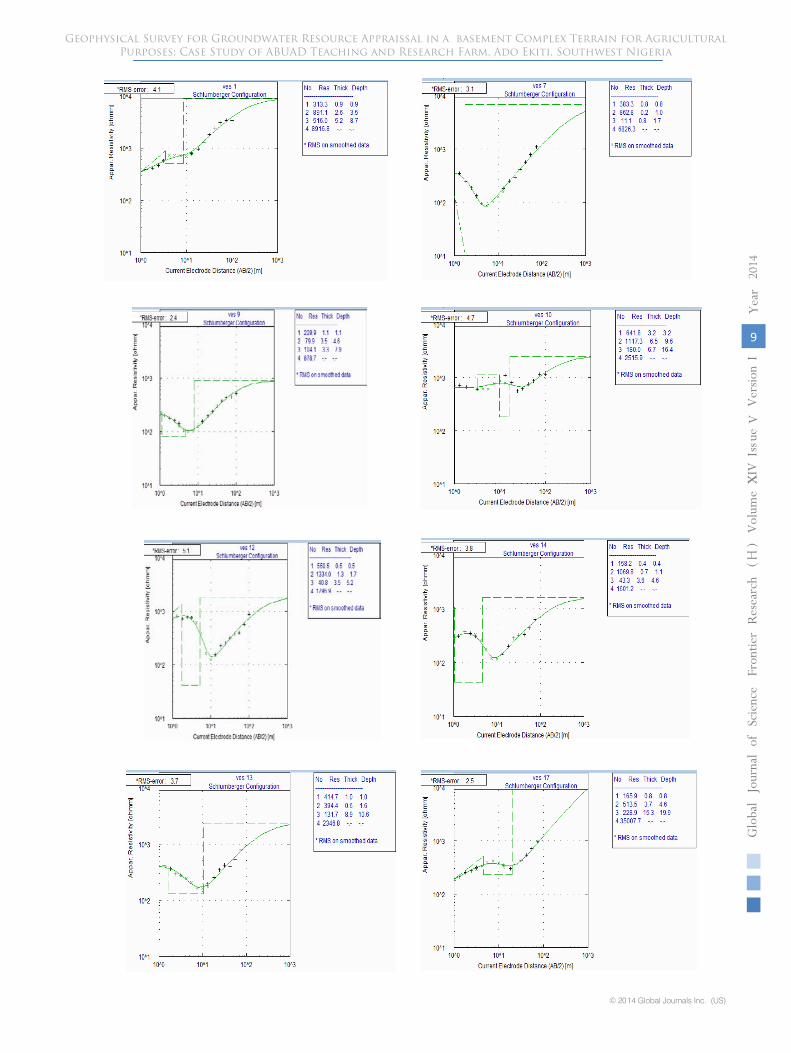
From the 1D-layered model generated, the resistivities associated with each layer were derived together with corresponding thicknesses. The representatives of the twenty nine (29) curves as obtained from the computer iteration processes are as shown in Figures 2. The sounding curves show three layer and four layer earth models. The three layer earth are characterized by H curve type which represents about 3% of the curve types in the study area. This curve type is usually diagnostic of weathered layer aquifer existing as a single unit, where the thickness is appreciable, the aquifer could be expected to yield appreciably, otherwise it could not be relied upon. The four layer models are characterized by KH,QH, HK, HA and the AA curve types which altogether covers over 97% of the study area ( see Figure 3). Both the QH, KH and HK types are diagnostic of the weathered and fractured layer (confined) aquifer systems, while the HA type is diagnostic of weathered/fractured layer (unconfined) aquifer systems (Olorunfemi and Fasuyi 1993; Ademilua 1997; Ademilua and Olorunfemi 2000). These combined aquifer systems are noteworthy for enhanced groundwater yields when delineated, especially when occasioned with appreciable thicknesses of both or either of the units. Therefore and going by the high frequencies of these curves, especially the KH- which accounts for 66 % it is anticipated that optimum yield would be derivable from the recommended positions within the area. The observed geo-electric layers as correlated from the driller’s records of the existing borehole in the study area include the top soil / laterite, clay / clayey sand, weathered/partly fractured basement and the fresh basement. The resistivities of the first geoelectric layer range from 39.3Ωm to 1238.0Ωm and its thicknesses from 0.4m to 3.2m. The second geoelectric layer has resistivities ranging from 40.8Ωm to 1733.5Ωm and thicknesses from 0.3m to 6.5m. The resistivities of the third geoelectric layer range from 7.1Ωm to 576Ωm and
its thicknesses range from 0.8m to 15.3m. The resistivities of the fourth geoelectric layer which is the presumably fresh bedrock range from 878.7Ωm to 37704.1Ωm with infinite thickness. Olayinka et’al., (1997) recommended the value of overburden thicknesses ranging between 20m and 30m for a productive well, Olorunfemi and Okhue (1992) and Oladapo, et’al (2004) also prescribed an overburden thickness of 25m for viable groundwater abstraction. It has been reported that in the basement areas of Zimbabwe between 20m and 25 m of overburden is the minimum required before siting a borehole (Wright, 1992). The overburden thicknesses nearing these ranges or approximate values were obtained in VES stations V17 with 19.8m; V5 with 19.4m; V10 with 16.4m;V23 with15.3m in the study area
which are supportive of groundwater development at the points where they are located.
a) Isopach Map of Weathered Basement
The thicknesses of the weathered/partly fractured basement layer were obtained from the VES interpretation results and plotted against the VES stations and contoured as shown in Figure 4 using the ARCGIS software, a 1m contour interval was used. The map shows variation in thickness of overburden closures across . Peak and high contour closures depicting possible areas of attention were revealed and these could be found in VES positions V5 in the SWpart,V17 in the eastern part, V23 in the north central and, V27 in the north eastern parts.The corresponding resistivity curve types are the KH-. The low closures are obtainable at VES positions V20 V18 . It is noteworthy that low closures characterized the parametric VES positions V28 and V29, which is symptomatic of low yield. This finding is corroborative of the actual current yield performance and rating of the well which has been adjudged low.
b) Isopach Map of Overburden
The thicknesses of the overburden as well as the weathered layer obtained from the interpretation results were summarized as shown in Table 2 . Again,
7
Globa
lJo
urna
lof
Scienc
eFr
ontie
rResea
rch
V
olum
eXIV
X Iss
VYe
a r20
14
)
)
© 2014 Global Journals Inc. (US)
ue Ver
sion
IH
Geophysical Survey for Groundwater Resource Appraissal in a basement Complex Terrain for Agricultural Purposes; Case Study of ABUAD Teaching and Research Farm, Ado Ekiti, Southwest Nigeria

the values for the overburden were plotted against the VES stations and contoured using the ARCGIS software as shown in Figure 5, a 1m contour interval was used. The map displayed the variation in overburden thickness closures across the study area .Furthermore, high contour closures depicting possible areas of priority attention were delineated and as was the case with the previous isopach map of the weathered layer, these could be found in VES positions V5 in the South western part, V17 in the eastern part, V23 in the north central and, V27 in the north eastern parts. The corresponding resistivity curve types are the KH-. The low closures are obtainable at VES positions V20 and V18. It is noteworthy to discover that low closures characterized the parametric VES positions V28 and V29, which is symptomatic of low yield. This finding is corroborative of the actual current yield performance rating of the well which has been adjudged low.
c) Groundwater Potential Evaluation The groundwater potential evaluation of the
area was derived from the syntheses of the curve type analyses, as well as the composite maps of the isopach maps of the weathered layer and the overburden thicknesses (Tables 1and 2; Figures 3,4, and 5). Comparing Figures 4 and 5, there exist a strong relationship between the high closure areas delineated by each of these maps as the both of them highlight the VES positions V5, V17, V23 and V27 as good groundwater potential zones, while there is good coincidence with each other in areas characterised by low contour closures. The tables and maps were synthesized and integrated for the identification and designation of the good groundwater potential VES positions which are points characterized by high contour closures, while points with low closures or non closures are regarded as low prospect zones. From the syntheses of the isopach maps of the weathered layer and overburden thicknesses as well as the curve type and parametric data analyses, Four positions have exhibited promising characteristics for possible groundwater development, these positions arranged in order of hydrogeologic significance are VES 5, 17, 23 and 27, while other positions including V7, V11, V14, V19, V20, ,V27, V28 exhibited low prospects. Two boreholes RB1 and RB2 located at VES positions V5 and V17 have therefore been proposed for the study area. These points are located within the coordinates N070 36.942’ E0050 18.046’ for V5, and N070 36.9991’ E0050 18.079’ for V17. The other VES positions outside
hydrogeologic
relevance, gathered from the VES interpretation were used to generate maps (weathered/fractured layer thickness map and the overburden thickness map). The maps were initially examined individually by identifying VES positions with high closures of the geoelectric parameters favourable to groundwater occurrence, Groundwater exploration in the basement is based on weathered and or fractured basement aquifers. The groundwater potential of the aquifer may be significantly enhanced if the thickness of the layers are high. However, relatively low values of this parameter can also indicate poor groundwater potential. The fairly low bedrock resistivity confirms the presence of fractures and hence water contained within the fissures (Beeson and Jones, 1988, and Olayinka and Olorunfemi, 1992, Lateef 2012, Adeoti et’al 2012). The high frequencies of the good groundwater diagnostic VES curves, especially the KH-
which accounts for 66 % is symptomatic that optimum yield would be derivable from the recommended positions within the area. Based on all the findings made in the interpretation of the VES data, 4 VES stations have been chosen as the most viable locations for the development of groundwater resources in the study area. These include VES 5, 17, 23 and 27, However, other positions including V7, V11, V14, V19, V20, ,V27, V28 exhibited low prospects. Two boreholes RB1 and RB2 located at VES positions V5 and V17 have therefore been proposed for the study area. These points are located within the coordinates N070 36.942’ E0050 18.046’ for V5 and N070 36.9991’ E0050 18.079’ for V17. The two boreholes RB1 and RB2 have been recommended for drilling at these points not only because of the foregoing arguments in support of the decision, but furthermore considering other relevant and hydrogeophysically significant factors in terms of the geoelectric parameters (thicknesses and resistivities) at the points which are equally indicative of good groundwater potential that can be considered for groundwater development at ABUAD teaching and research farm.
© 2014 Global Journals Inc. (US)
8
Year
2014
Globa
lJo
urna
lof
Scienc
eFr
ontie
rResea
rch
V
olum
eXIV
X Iss
V)
)
ue Ver
sion
IH
these four positions within the the study area could therefore be regarded as poor and has no appeal for groundwater development.
V. Conclusion
The geoelectric parameters (layer resistivities and thicknesses) which are known to be of
Geophysical Survey for Groundwater Resource Appraissal in a basement Complex Terrain for Agricultural Purposes; Case Study of ABUAD Teaching and Research Farm, Ado Ekiti, Southwest Nigeria
9
Globa
lJo
urna
lof
Scienc
eFr
ontie
rResea
rch
V
olum
eXIV
X Iss
VYe
a r20
14
)
)
© 2014 Global Journals Inc. (US)
ue Ver
sion
IH
Geophysical Survey for Groundwater Resource Appraissal in a basement Complex Terrain for Agricultural Purposes; Case Study of ABUAD Teaching and Research Farm, Ado Ekiti, Southwest Nigeria

Current Electrode (AB/2 ) [m]
© 2014 Global Journals Inc. (US)
10
Year
2014
Globa
lJo
urna
lof
Scienc
eFr
ontie
rResea
rch
V
olum
eXIV
X Iss
V)
)
ue Ver
sion
IH
Figures 2 : Representative VES Interpretation Model Results using the WINRESIST Software
Geophysical Survey for Groundwater Resource Appraissal in a basement Complex Terrain for Agricultural Purposes; Case Study of ABUAD Teaching and Research Farm, Ado Ekiti, Southwest Nigeria

Figure 3
:
Pie chart showing the frequency of curve types obtained from the study area
H4%
QH21%
HK3%
KH66%
AA3%
HA3%
H
QH
HK
KH
AA
HA
11
Globa
lJo
urna
lof
Scienc
eFr
ontie
rResea
rch
V
olum
eXIV
X Iss
VYe
a r20
14
)
)
© 2014 Global Journals Inc. (US)
ue Ver
sion
IH
Geophysical Survey for Groundwater Resource Appraissal in a basement Complex Terrain for Agricultural Purposes; Case Study of ABUAD Teaching and Research Farm, Ado Ekiti, Southwest Nigeria

Figure 4 : Isopach Map of Weathered Layer Thickness of the study area
© 2014 Global Journals Inc. (US)
12
Year
2014
Globa
lJo
urna
lof
Scienc
eFr
ontie
rResea
rch
V
olum
eXIV
X Iss
V)
)
ue Ver
sion
IH
Geophysical Survey for Groundwater Resource Appraissal in a basement Complex Terrain for Agricultural Purposes; Case Study of ABUAD Teaching and Research Farm, Ado Ekiti, Southwest Nigeria

Figure 5
:
Isopach map of Overburden Thickness of the study area
References Références Referencias
1.
Ademilua, O.L. (1997). A Geoelectric and Geologic Evaluation of Groundwater potential of Ekiti and Ondo States, Southwestern, Nigeria. Unpublished M.Sc.Thesis, Dept. of Geology, Obafemi Awolowo University, Ile-Ife, Nigeria. pp. 1-
67.
2.
Ademilua, L.O. and Olorunfemi, M.O. (2000). “A Geoelectric/Geologic Estimation of the Groundwater Potential of the Basement Complex area of Ekiti and
13
Globa
lJo
urna
lof
Scienc
eFr
ontie
rResea
rch
V
olum
eXIV
X Iss
VYe
a r20
14
)
)
© 2014 Global Journals Inc. (US)
ue Ver
sion
IH
Ondo States of Nigeria”. The Journal of Technoscience. 4:4-18.
3. Adeoti, L., Alile, O.M., Uchegbulam O. and Adegbola, R. B.,(2012). Geoelectrical Investigation
Geophysical Survey for Groundwater Resource Appraissal in a basement Complex Terrain for Agricultural Purposes; Case Study of ABUAD Teaching and Research Farm, Ado Ekiti, Southwest Nigeria

of Groundwater Potential in Mowe, Ogun State, Nigeria. British Journal of Applied Science and Technology 2(1) : 58 –
71.
4.
Ajibade, A.C and Umeji, A.C. (1989). Precambrian Geology of Nigeria, Geology Survey of Nigeria, pp.11-41
5.
Ayolabi, E. A., Olatinsu, O. B. and Badmus, B. S., (2009). Groundwater Potential Evaluation using Electrical Resistivity method in a typical Basement Complex area of Nigeria. Journal of Science and Technology, 29(1) pp 52 –
65.
6.
Hamill, L. and Bell, F. G., (1986). Groundwater resources development. Butterworths, London. Pp344.
7.
Lateef, T. A., (2012). Geophysical Investigation for Groundwater using Electrical Resistivity method –
A case study of Annunciation Grammar School, Ikere Ekiti, Ekiti State, Nigeria. IOSR Journal of Applied Physics 2(1) pp
1 –
6.
8.
Beason,S and Jones, C.R.C. (1988). The Combined EMT/VES Geophysical Method for Sitting Boreholes. Groundwater, 2: 56 –
63.
9.
Flathe, H. (1970). Interpretation of Geoelectrical Resistivity measurements for solving Hydrogeological Problems. Minning and Groundwater Geophysics : Geological Survey of Canada. Economic Geological Report,
26:580 –
597.
10.
Nigeria Meteorological Agency, (NIMET), 2007.Daily weather
forecast on the Nigerian Television Authority. Nigerian
Metrological Agency, Oshodi,
Lagos.
11.
Ojelabi, E.A., Badmus, B.S., and Salau, A.A. (2002). Comparative analysis of Wenner and Schlumberger Methods of Geoelectrical soundings in subsurface delineation and groundwater exploration-
A case study. Journal of Geological Society of India. 60: 623 -
628.
12.
Oladapo, M.I, Mohammed, M.Z, Adeoye, O.O and Adetola, B.A. (2004). Geoelectrical Investigation of the Ondo State Housing Corporation Estate, Ijapo Akure, Southwestern Nigeria. Journal of Mining and Geology, Vol.40(1) 2004, pp 41-48
13.
Olayinka, A.I., Akpan, E.J. and Magbagbeola, O.A. (1997). Geoelectric sounding for estimating aquifer potential in the crystalline basement area around Shaki, Southwest Nigeria,Water Resources, 8, Nos 1 & 2, 71 –
81.
14.
Olayinka, A.I and Olorunfemi, M.O, (1992). Determination of Geoelectric Characteristics in Okene Area and Implications for Borehole Siting. Journal of Mining and Geology, 28 (2): 403 -
411.
15.
Olorunfemi, M.O and Okhue, E.J,(1992). Hyrogeologic and Geologic significance of a Geoelectric Survey at Ile –
Ife, Nigeria. Journal of Mining and Geology, Vol. 28, pp: 242 –
350.
16.
Olorunfemi, M.O. and Fasuyi, S.A. (1993). Aquifer Types and the geoelectric/Hydrogeologic
Characteristics of Part of the Central Basement Terrain of Nigeria (Niger State). Journal of African Earth Sciences, Vol. 16, No. 3, pp. 309 –
317.
17.
Rahaman, M.A. (1988). Recent advances in the study of the Basement Complex of Nigeria. In Oluyide et.al. (eds) Precambrian Geology of Nigeria, Publication. Geological Survey of Nigeria, Kaduna, pp. 157-163.
18.
Wright, C. P. (1992). The hydrogeology of crystalline basement aquifers in Africa. In: C . P. Wright and W. C. Burgess (eds). Hydrogeology of Crystalline Basement aquifer in Africa. Geological Society of London Special Publication No. 66 Pp. 1 –
27.
19.
Zohdy, A.A.R., Eaton, G.P. and Mabey, D.R. (1974). Application of surface geophysics to groundwater investigation. U.S. Geol. Survey
Bk 2 Chapter D 1 pp. 47-55.
© 2014 Global Journals Inc. (US)
14
Year
2014
Globa
lJo
urna
lof
Scienc
eFr
ontie
rResea
rch
V
olum
eXIV
X Iss
V)
)
ue Ver
sion
IH
Geophysical Survey for Groundwater Resource Appraissal in a basement Complex Terrain for Agricultural Purposes; Case Study of ABUAD Teaching and Research Farm, Ado Ekiti, Southwest Nigeria