georgia standards of excellence frameworks...
TRANSCRIPT

Mathematics GSE Algebra I Unit 5: Comparing and Contrasting Functions
Richard Woods, State School Superintendent
July 2015 Page 1 of 68
All Rights Reserved
Georgia
Standards of Excellence Frameworks
Accelerated GSE Algebra I/Geometry A Unit 3: Modeling and Analyzing Quadratic Functions
Mathematics

Georgia Department of Education Georgia Standards of Excellence Framework
GSE Algebra I Unit 3
Mathematics GSE Algebra I Unit 3: Modeling and Analyzing Quadratic Functions
Richard Woods, State School Superintendent
July 2015 Page 2 of 68
All Rights Reserved
Unit 3
Modeling and Analyzing Quadratic Functions
Table of Contents OVERVIEW ..................................................................................... Error! Bookmark not defined.
STANDARDS ADDRESSED IN THIS UNIT ................................................................................. 3
ENDURING UNDERSTANDINGS ................................................................................................. 5
ESSENTIAL QUESTIONS ............................................................................................................... 5
CONCEPTS/SKILLS TO MAINTAIN ............................................................................................. 6
SELECTED TERMS AND SYMBOLS ............................................................................................ 6
EVIDENCE OF LEARNING ............................................................................................................ 8
FORMATIVE ASSESSMENT LESSONS (FAL) ........................... Error! Bookmark not defined.
SPOTLIGHT TASKS ....................................................................... Error! Bookmark not defined.
TASKS .............................................................................................. Error! Bookmark not defined.
What’s the Pattern? (Spotlight Task) .................................................................................................... 8
Generalizing Patterns: Table Tiles (Formative Assessment Lesson) . Error! Bookmark not defined.
Skeleton Tower (Short Cycle Task) .................................................... Error! Bookmark not defined.
Sorting Functions (Short Cycle Task) – Extension Task .................... Error! Bookmark not defined.
Graphing Transformations (Discovery Task) ..................................... Error! Bookmark not defined.
Paula’s Peaches (Learning Task) ........................................................ Error! Bookmark not defined.
Henley’s Chocolates (Learning Task) ................................................ Error! Bookmark not defined.
Completing the Square & Deriving the Quadratic Formula (Spotlight Task) ... Error! Bookmark not
defined.
Standard to Vertex Form (Spotlight Task).......................................... Error! Bookmark not defined.
Protein Bar Toss (Learning Task) ....................................................... Error! Bookmark not defined.
Protein Bar Toss, Part 2 (Learning Task) ........................................... Error! Bookmark not defined.
Just The Right Border (Learning Task) .............................................. Error! Bookmark not defined.
Representing Quadratic Functions Graphically (Formative Assessment Lesson)Error! Bookmark not
defined.
Characteristics of Quadratic Functions (Performance Task) .............. Error! Bookmark not defined.
Seeing Structure in Expressions (Short Cycle Task) .......................... Error! Bookmark not defined.
Sorting Equations & Identities (Formative Assessment Lesson) ....... Error! Bookmark not defined.
Acme Fireworks (Culminating Task) ................................................. Error! Bookmark not defined.
Quadratic Fanatic and the Case of the Foolish Function (Culminating Task) .................................... 64
*Revised standards indicated in bold red font.
Georgia Department of Education Georgia Standards of Excellence Framework
GSE Algebra I Unit 3
Mathematics GSE Algebra I Unit 3: Modeling and Analyzing Quadratic Functions
Richard Woods, State School Superintendent
July 2015 Page 3 of 68
All Rights Reserved
STANDARDS ADDRESSED IN THIS UNIT
Interpret structure of expressions
MGSE9‐12.A.SSE.2 Use the structure of an expression to rewrite it in different equivalent forms.
For example, see x4 – y4 as (x2)2 – (y2)2, thus recognizing it as a difference of squares that can be
factored as (x2 – y2) (x2 + y2).
Write expressions in equivalent forms to solve problems
MGSE9–12.A.SSE.3 Choose and produce an equivalent form of an expression to reveal and explain
properties of the quantity represented by the expression.
MGSE9–12.A.SSE.3a Factor any quadratic expression to reveal the zeros of the function defined by
the expression.
MGSE9–12.A.SSE.3b Complete the square in a quadratic expression to reveal the maximum and
minimum value of the function defined by the expression.
Create equations that describe numbers or relationships
MGSE9–12.A.CED.1 Create equations and inequalities in one variable and use them to solve
problems. Include equations arising from linear, quadratic, simple rational, and exponential
functions (integer inputs only).
MGSE9-12.A.CED.2 Create linear, quadratic, and exponential equations in two or more variables
to represent relationships between quantities; graph equations on coordinate axes with labels and
scales. (The phrase “in two or more variables” refers to formulas like the compound interest
formula, in which A = P(1 + r/n)nt has multiple variables.)
MGSE9–12.A.CED.4 Rearrange formulas to highlight a quantity of interest using the same
reasoning as in solving equations. Examples: Rearrange Ohm’s law V = IR to highlight resistance R;
Rearrange area of a circle formula A = π r2 to highlight the radius r.
Solve equations and inequalities in one variable
MGSE9‐12.A.REI.4 Solve quadratic equations in one variable.
MGSE9–12.A.REI.4a Use the method of completing the square to transform any quadratic equation
in x into an equation of the form (x – p)2 = q that has the same solutions. Derive the quadratic
formula from ax2 + bx + c = 0.
MGSE9–12.A.REI.4b Solve quadratic equations by inspection (e.g., for x2 = 49), taking square
roots, factoring, completing the square, and the quadratic formula, as appropriate to the initial
form of the equation (limit to real number solutions).
Build a function that models a relationship between two quantities.

Georgia Department of Education Georgia Standards of Excellence Framework
GSE Algebra I Unit 3
Mathematics GSE Algebra I Unit 3: Modeling and Analyzing Quadratic Functions
Richard Woods, State School Superintendent
July 2015 Page 4 of 68
All Rights Reserved
MGSE9–12.F.BF.1 Write a function that describes a relationship between two quantities.
Build new functions from existing functions.
MGSE9–12.F.BF.3 Identify the effect on the graph of replacing f(x) by f(x) + k, k f(x), f(kx), and
f(x + k) for specific values of k(both positive and negative); find the value of k given the graphs.
Experiment with cases and illustrate an explanation of the effects on the graph using technology. Include
recognizing even and odd functions from their graphs and algebraic expressions for them.
Understand the concept of a function and use function notation.
MGSE9–12.F.IF.1 Understand that a function from one set (the input, called the domain) to another
set (the output, called the range) assigns to each element of the domain exactly one element of the
range, i.e. each input value maps to exactly one output value. If f is a function, x is the input (an
element of the domain), and f(x) is the output (an element of the range). Graphically, the graph is
y = f(x).
MGSE9–12.F.IF.2 Use function notation, evaluate functions for inputs in their domains, and interpret
statements that use function notation in terms of a context.
Interpret functions that arise in applications in terms of the context.
MGSE9–12.F.IF.4 Using tables, graphs, and verbal descriptions, interpret the key characteristics
of a function which models the relationship between two quantities. Sketch a graph showing key
features including: intercepts; interval where the function is increasing, decreasing, positive, or
negative; relative maximums and minimums; symmetries; end behavior; and periodicity.
MGSE9–12.F.IF.5 Relate the domain of a function to its graph and, where applicable, to the quantitative
relationship it describes. For example, if the function h(n) gives the number of person–hours it takes to
assemble n engines in a factory, then the positive integers would be an appropriate domain for the
function.
MGSE9–12.F.IF.6 Calculate and interpret the average rate of change of a function (presented
symbolically or as a table) over a specified interval. Estimate the rate of change from a graph.
Analyze functions using different representations.
MGSE9–12.F.IF.7 Graph functions expressed algebraically and show key features of the graph both
by hand and by using technology.
MGSE9–12.F.IF.7a Graph linear and quadratic functions and show intercepts, maxima, and
minima (as determined by the function or by context).
MGSE9–12.F.IF.8 Write a function defined by an expression in different but equivalent forms to reveal
and explain different properties of the function.
MGSE9–12.F.IF.8a Use the process of factoring and completing the square in a quadratic function
to show zeros, extreme values, and symmetry of the graph, and interpret these in terms of a context.
For example, compare and contrast quadratic functions in standard, vertex, and intercept forms.

Georgia Department of Education Georgia Standards of Excellence Framework
GSE Algebra I Unit 3
Mathematics GSE Algebra I Unit 3: Modeling and Analyzing Quadratic Functions
Richard Woods, State School Superintendent
July 2015 Page 5 of 68
All Rights Reserved
MGSE9–12.F.IF.9 Compare properties of two functions each represented in a different way
(algebraically, graphically, numerically in tables, or by verbal descriptions). For example, given a
graph of one function and an algebraic expression for another, say which has the larger maximum.
STANDARDS FOR MATHEMATICAL PRACTICE Refer to the Comprehensive Course Overview for more detailed information about the Standards for Mathematical Practice. 1. Make sense of problems and persevere in solving them. 2. Reason abstractly and quantitatively. 3. Construct viable arguments and critique the reasoning of others. 4. Model with mathematics. 5. Use appropriate tools strategically. 6. Attend to precision. 7. Look for and make use of structure. 8. Look for and express regularity in repeated reasoning.
SMP = Standards for Mathematical Practice
ENDURING UNDERSTANDINGS
The graph of any quadratic function is a vertical and/or horizontal shift of a vertical stretch or
shrink of the basic quadratic function f (x) = x2.
The vertex of a quadratic function provides the maximum or minimum output value of the
function and the input at which it occurs.
Every quadratic equation can be solved using the Quadratic Formula.
ESSENTIAL QUESTIONS
1. How is a relation determined to be quadratic?
2. How do I choose the most efficient method of solving quadratic equations?
3. How do the factors of a quadratic functions yield the zeros for that function?
4. Where is the maximum or minimum value of a quadratic equation located?
5. How is the quadratic formula developed by completing the square?
6. How can the quadratic formula be used to find the zeros of a quadratic function?
7. What information can be gleaned from the table of values and the graph of a relation?
8. Under what circumstances can one take the square root of both sides of the equation?
9. What does the domain of a function tell about the quantitative relationship of the given data?
10. How is the rate of change for a quadratic function different from the rate of change for a linear
function?
11. How can the graph of f(x) = x2 move left, right, up, down, stretch, or compress?
12. What are the relative advantages and disadvantages of solving a quadratic function by factoring,
completing the square, quadratic formula, or taking the square root of both sides?

Georgia Department of Education Georgia Standards of Excellence Framework
GSE Algebra I Unit 3
Mathematics GSE Algebra I Unit 3: Modeling and Analyzing Quadratic Functions
Richard Woods, State School Superintendent
July 2015 Page 6 of 68
All Rights Reserved
13. How do I justify the quadratic formula?
14. How do I interpret quadratic functions in context?
CONCEPTS/SKILLS TO MAINTAIN
It is expected that students will have prior knowledge/experience related to the concepts and skills
identified below. It may be necessary to pre–assess in order to determine if time needs to be spent on
conceptual activities that help students develop a deeper understanding of these ideas.
1. Use Function Notation
2. Put data into tables
3. Graph data from tables
4. Solve one variable linear equations
5. Determine domain of a problem situation
6. Solve for any variable in a multi–variable equation
7. Recognize slope of a linear function as a rate of change
8. Graph linear functions
9. Graph inequalities
10. Distinguish between linear and non-linear functions.
SELECTED TERMS AND SYMBOLS
The following terms and symbols are often misunderstood. These concepts are not an inclusive list and
should not be taught in isolation. However, due to evidence of frequent difficulty and misunderstanding
associated with these concepts, instructors should pay particular attention to them and how their students
are able to explain and apply them.
The definitions below are for teacher reference only and are not to be memorized by the
students. Students should explore these concepts using models and real life examples. Students
should understand the concepts involved and be able to recognize and/or demonstrate them with
words, models, pictures, or numbers.
The website below is interactive and includes a math glossary.
http://intermath.coe.uga.edu/dictnary/homepg.asp
Definitions and activities for these and other terms can be found on the Intermath website. Links to
external sites are particularly useful.
Formulas and Definitions:
Complete factorization over the integers. Writing a polynomial as a product of polynomials so
that none of the factors is the number 1, there is at most one factor of degree zero, each
polynomial factor has degree less than or equal to the degree of the product polynomial, each
polynomial factor has all integer coefficients, and none of the factor polynomial can written as
such a product.

Georgia Department of Education Georgia Standards of Excellence Framework
GSE Algebra I Unit 3
Mathematics GSE Algebra I Unit 3: Modeling and Analyzing Quadratic Functions
Richard Woods, State School Superintendent
July 2015 Page 7 of 68
All Rights Reserved
Completing the square. Completing the Square is the process of converting a quadratic
equation into a perfect square trinomial by adding or subtracting terms on both sides.
Difference of two squares. A squared (multiplied by itself) number subtracted from another
squared number. It refers to the identity 𝑎2 − 𝑏2 = (𝑎 + 𝑏)(𝑎 − 𝑏) in elementary algebra.
Discriminant of a quadratic equation. The discriminant of a quadratic equation of the form
ax2 + bx+ c = 0, a 0, is the number b2 – 4ac.
Horizontal shift. A rigid transformation of a graph in a horizontal direction, either left or right.
Perfect square trinomial. A trinomial that factors into two identical binomial factors.
Quadratic equation. An equation of degree 2, which has at most two solutions.
Quadratic function. A function of degree 2 which has a graph that “turns around” once,
resembling an umbrella–like curve that faces either right–side up or upside down. This graph is
called a parabola.
Root. The x–values where the function has a value of zero.
Standard form of a quadratic function. 𝑎𝑥2 + 𝑏𝑥 + 𝑐
Vertex. The maximum or minimum value of a parabola, either in terms of y if the parabola is
opening up or down, or in terms of x if the parabola is opening left or right.
Vertex form of a quadratic function. A formula for a quadratic equation of the form
f (x) = a (x – h)2 + k, where a is a nonzero constant and the vertex of the graph is the
point (h, k).
Theorems:

Georgia Department of Education Georgia Standards of Excellence Framework
GSE Algebra I Unit 3
Mathematics GSE Algebra I Unit 3: Modeling and Analyzing Quadratic Functions
Richard Woods, State School Superintendent
July 2015 Page 8 of 68
All Rights Reserved
For 2
bh
a
and
2
bk f
a
, f (x) = a (x – h)2 + k is the same function as f (x) = ax2 + bx + c.
The graph of any quadratic function can be obtained from transformations of the graph of the basic
function f (x) = x2.
Quadratic formula: The solution(s) of the quadratic equation of the form 2 0ax bx c , where a, b,
and c are real numbers with 0a , is
2 4
2
b b acx
a
.
The discriminant of a quadratic equation is positive, zero, or negative if and only if the equation has two
real solutions, one real solution, or two complex conjugate number solutions respectively.
EVIDENCE OF LEARNING
By the conclusion of this unit, students should be able to demonstrate the following competencies:
1. Graph and interpret a quadratic function.
2. Translate the graph of f(x) = x2 as directed.
3. Determine and use the most advantageous method of finding the zeros of a quadratic
equation.
4. Determine the variable rate of change of a quadratic function.
5. Interpret quadratic functions and its key features in context.

Georgia Department of Education Georgia Standards of Excellence Framework
GSE Algebra I Unit 3
Mathematics GSE Algebra I Unit 3: Modeling and Analyzing Quadratic Functions
Richard Woods, State School Superintendent
July 2015 Page 9 of 68
All Rights Reserved
What’s the Pattern? (Spotlight Task)
Name___________________________ Date_______________
Mathematical Goals
Understand the rate of change of quadratic functions.
Write a function to describe a relationship between two variables.
Essential Questions
How do I use functions to represent a relationship between two quantities?
How do I describe the rate of change of quadratic functions?
GEORGIA STANDARDS OF EXCELLENCE
MGSE9‐12.F.IF.6 Calculate and interpret the average rate of change of a function (presented
symbolically or as a table) over a specified interval. Estimate the rate of change from a graph.
MGSE9‐12.F.IF.8 Write a function defined by an expression in different but equivalent forms to reveal
and explain different properties of the function.
MGSE9‐12.F.BF.1 Write a function that describes a relationship between two quantities.
STANDARDS FOR MATHEMATICAL PRACTICE
1. Make sense of problems and persevere in solving them by requiring students to interpret and
make meaning of a problem and find a logical starting point, and to monitor their progress and
change their approach to solving the problem, if necessary.
2. Reason abstractly and quantitatively by requiring students to make sense of quantities and
their relationships to one another in problem situations.
3. Construct viable arguments and critique the reasoning of others by engaging students on
discussion of why they agree or disagree with responses, decide whether they make sense, and
ask useful questions to clarify or improve the arguments.
6. Attend to precision by requiring students to calculate efficiently and accurately; and to
communicate precisely with others by using clear mathematical language to discuss their
reasoning.
7. Look for and make use of structure by expecting students to apply rules, look for patterns and
analyze structure.
What’s the Pattern? (Spotlight Task)

Georgia Department of Education Georgia Standards of Excellence Framework
GSE Algebra I Unit 3
Mathematics GSE Algebra I Unit 3: Modeling and Analyzing Quadratic Functions
Richard Woods, State School Superintendent
July 2015 Page 10 of 68
All Rights Reserved
Name________________________ Date_______________
1. How many 1 X 1 squares are in each stage of this pattern?
2. What might stage 5 of this pattern look like? How many 1 X 1 squares would be in stage 5?
3. Write an expression that describes the number of 1 X 1 squares in stage n of the pattern. Justify your
answer geometrically by referring to the pattern.
4. How much does the number of squares change from stage 1 to stage 2 of the pattern?
5. How much does the number of squares change from stage 2 to stage 3 of the pattern?
6. How much does the number of squares change from stage 3 to stage 4 of the pattern?
7. What do your answers to 4–6 tell you about the rate of change of the number of squares with respect
to the stage number?
8. You have previously worked with linear functions. Can this pattern be expressed as a linear function?
Why or why not?
Stage 4Stage 3Stage 2Stage 1

Georgia Department of Education Georgia Standards of Excellence Framework
GSE Algebra I Unit 3
Mathematics GSE Algebra I Unit 3: Modeling and Analyzing Quadratic Functions
Richard Woods, State School Superintendent
July 2015 Page 11 of 68
All Rights Reserved
Graphing Transformations (Discovery Task) Adapted from Marilyn Munford, Fayette County School System
Name__________________________________ Date______________
Mathematical Goals
Graph parabolas
Investigate transformations
Essential Questions
What conjectures can I make about function transformations?
GEORGIA STANDARDS OF EXCELLENCE
MGSE9-12.F.BF.3 Identify the effect on the graph of replacing f(x) by f(x) + k, k f(x), f(kx), and f(x +
k) for specific values of k (both positive and negative); find the value of k given the graphs. Experiment
with cases and illustrate an explanation of the effects on the graph using technology. Include recognizing
even and odd functions from their graphs and algebraic expressions for them.
STANDARDS FOR MATHEMATICAL PRACTICE
4. Model with mathematics by expecting students to apply the mathematics concepts they know in
order to solve problems arising in everyday situations, and reflect on whether the results are sensible for
the given scenario.
5. Use appropriate tools strategically by expecting students to consider available tools when solving a
mathematical problem. These tools might include pencil and paper, concrete models, a ruler, a
protractor, a compass, a calculator, software, etc.
7. Look for and make use of structure by expecting students to apply rules, look for patterns and
analyze structure.
Georgia Department of Education Georgia Standards of Excellence Framework
GSE Algebra I Unit 3
Mathematics GSE Algebra I Unit 3: Modeling and Analyzing Quadratic Functions
Richard Woods, State School Superintendent
July 2015 Page 12 of 68
All Rights Reserved
Graphing Transformations (Discovery Task) Adapted from Marilyn Munford, Fayette County School System
Name__________________________________ Date______________
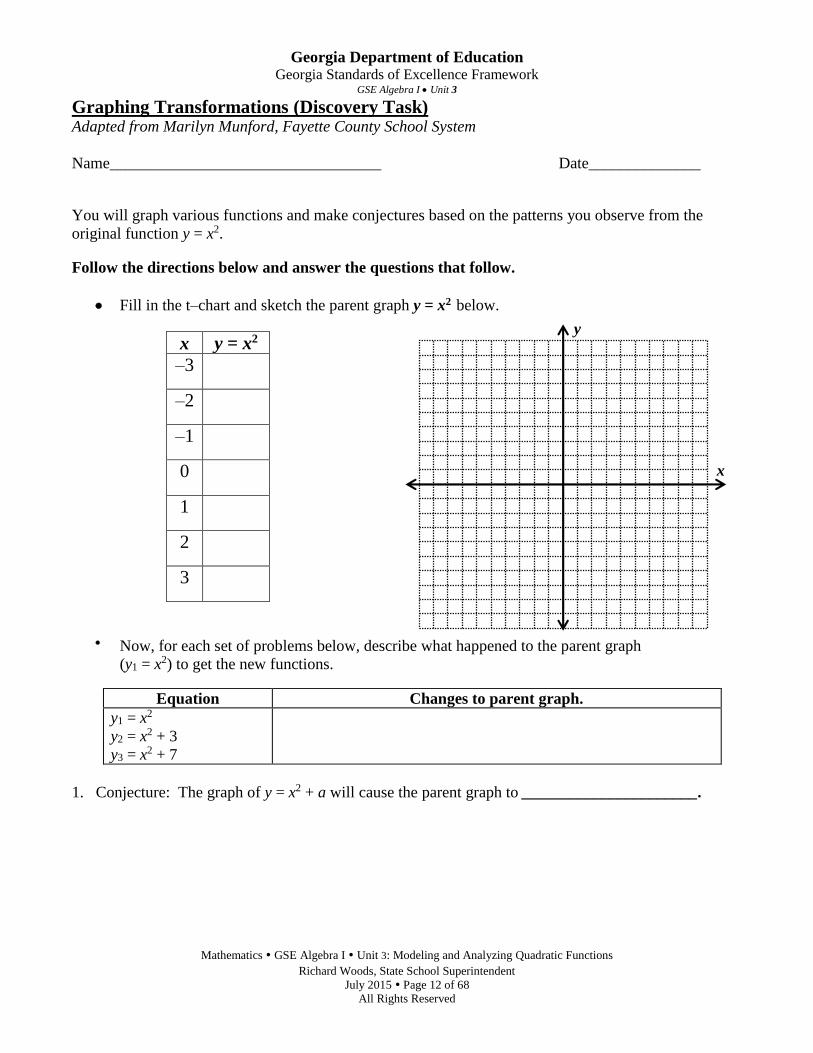
You will graph various functions and make conjectures based on the patterns you observe from the
original function y = x2.
Follow the directions below and answer the questions that follow.
Fill in the t–chart and sketch the parent graph y = x2 below.
Now, for each set of problems below, describe what happened to the parent graph
(y1 = x2) to get the new functions.
1. Conjecture: The graph of y = x2 + a will cause the parent graph to ______________________.
x y = x2
–3
–2
–1
0
1
2
3
Equation Changes to parent graph.
y1 = x2
y2 = x2 + 3
y3 = x2 + 7
y
x

Georgia Department of Education Georgia Standards of Excellence Framework
GSE Algebra I Unit 3
Mathematics GSE Algebra I Unit 3: Modeling and Analyzing Quadratic Functions
Richard Woods, State School Superintendent
July 2015 Page 13 of 68
All Rights Reserved
Equation Changes to parent graph.
y1 = x2
y2 = x2 – 3
y3 = x2 – 7
2. Conjecture: The graph of y = x2 – a will cause the parent graph to _____________________.
Equation Changes to parent graph.
y1 = x2
y2 = (x + 3)2
y3 = (x + 7)2
3. Conjecture: The graph of y = (x + a)2will cause the parent graph to ___________________.
Equation Changes to parent graph.
y1 = x2
y2 = (x – 3)2
y3 = (x – 7)2
4. Conjecture: The graph of y = (x – a)2 will cause the parent graph to ___________________.
Equation Changes to parent graph.
y1 = x2
y2 = –x2
y3 = –3x2
5. Conjecture: Multiplying the parent graph by a negative causes the parent graph to
__________________________________________.
For the following graphs, please use the descriptions “vertical stretch” (skinny) or “vertical shrink” (fat).
Equation Changes to parent graph.
y1 = x2
y2 = 3x2
y3 = 7x2
6. Conjecture: Multiplying the parent graph by a number whose absolute value is greater than one
causes the parent graph to ___________________.

Georgia Department of Education Georgia Standards of Excellence Framework
GSE Algebra I Unit 3
Mathematics GSE Algebra I Unit 3: Modeling and Analyzing Quadratic Functions
Richard Woods, State School Superintendent
July 2015 Page 14 of 68
All Rights Reserved
Equation Changes to parent graph.
y1 = x2
y2 = ½ x2
y3 = ¼ x2
7. Conjecture: Multiplying the parent graph by a number whose absolute value is between zero
and one causes the parent graph to ___________________.
Based on your conjectures above, sketch the graphs without using your graphing calculator.
8. y = (x + 3)2 – 4 9. y = –x2 + 5
Now, go back and graph these on your graphing calculator and see if you were correct.
Were you?
Based on your conjectures, write the equations for the following transformations to y = x2.
10. Translated 6 units up 11. Translated 2 units right
12. Stretched vertically by a factor of 3 13. Reflected over the x–axis, 2 units left
and down 5 units
y
y
x
Georgia Department of Education Georgia Standards of Excellence Framework
GSE Algebra I Unit 3
Mathematics GSE Algebra I Unit 3: Modeling and Analyzing Quadratic Functions
Richard Woods, State School Superintendent
July 2015 Page 15 of 68
All Rights Reserved
Paula’s Peaches (Learning Task)
Name___________________________ Date______________
Mathematical Goals
Factorization
Solving quadratic equations
Essential Questions
How do we use quadratic functions to represent contextual situations?
How do we solve quadratic equations?
How do we interpret quadratic functions in context?
GEORGIA STANDARDS OF EXCELLENCE
MGSE9‐12.A.SSE.3 Choose and produce an equivalent form of an expression to reveal and explain
properties of the quantity represented by the expression.
MGSE9‐12.A.SSE.3a Factor any quadratic expression to reveal the zeros of the function defined by
the expression
MGSE9‐12.A.CED.2 Create linear, quadratic, and exponential equations in two or more variables
to represent relationships between quantities; graph equations on coordinate axes with labels and
scales. (The phrase “in two or more variables” refers to formulas like the compound interest
formula, in which A = P(1 + r/n)nt has multiple variables.)
MGSE9-12.F.IF.1 Understand that a function from one set (the input, called the domain) to another
set (the output, called the range) assigns to each element of the domain exactly one element of the
range, i.e. each input value maps to exactly one output value. If f is a function, x is the input (an
element of the domain), and f(x) is the output (an element of the range). Graphically, the graph is
y = f(x).
MGSE9-12.F.IF.2 Use function notation, evaluate functions for inputs in their domains, and interpret
statements that use function notation in terms of a context.
MGSE9‐12.F.IF.4 Using tables, graphs, and verbal descriptions, interpret the key characteristics of
a function which models the relationship between two quantities. Sketch a graph showing key
features including: intercepts; interval where the function is increasing, decreasing, positive, or
negative; relative maximums and minimums; symmetries; end behavior; and periodicity.
MGSE9‐12.F.IF.5 Relate the domain of a function to its graph and, where applicable, to the quantitative
relationship it describes. For example, if the function h(n) gives the number of person-hours it takes to
assemble n engines in a factory, then the positive integers would be an appropriate domain for the
function.

Georgia Department of Education Georgia Standards of Excellence Framework
GSE Algebra I Unit 3
Mathematics GSE Algebra I Unit 3: Modeling and Analyzing Quadratic Functions
Richard Woods, State School Superintendent
July 2015 Page 16 of 68
All Rights Reserved
MGSE9‐12.F.IF.6 Calculate and interpret the average rate of change of a function (presented
symbolically or as a table) over a specified interval. Estimate the rate of change from a graph.
MGSE9-12.F.IF.7 Graph functions expressed algebraically and show key features of the graph both
by hand and by using technology.
MGSE9-12.F.IF.7a Graph linear and quadratic functions and show intercepts, maxima, and
minima (as determined by the function or by context).
MGSE9-12.F.IF.8a Use the process of factoring and completing the square in a quadratic function
to show zeros, extreme values, and symmetry of the graph, and interpret these in terms of a context.
For example, compare and contrast quadratic functions in standard, vertex, and intercept forms.
MGSE9-12.F.IF.9 Compare properties of two functions each represented in a different way
(algebraically, graphically, numerically in tables, or by verbal descriptions). For example, given a
graph of one function and an algebraic expression for another, say which has the larger maximum.

Georgia Department of Education Georgia Standards of Excellence Framework
GSE Algebra I Unit 3
Mathematics GSE Algebra I Unit 3: Modeling and Analyzing Quadratic Functions
Richard Woods, State School Superintendent
July 2015 Page 17 of 68
All Rights Reserved
Paula’s Peaches (Learning Task)
Name___________________________ Date______________
Paula is a peach grower in central Georgia and wants to expand her peach orchard. In her current
orchard, there are 30 trees per acre and the average yield per tree is 600 peaches. Data from the local
agricultural experiment station indicates that if Paula plants more than 30 trees per acre, once the trees
are in production, the average yield of 600 peaches per tree will decrease by 12 peaches for each tree
over 30. She needs to decide how many trees to plant in the new section of the orchard.
1. Paula believes that algebra can help her determine the best plan for the new section of orchard and
begins by developing a mathematical model of the relationship between the number of trees per acre
and the average yield in peaches per tree.
a. Is this relationship linear or nonlinear? Explain your reasoning.
b. If Paula plants 6 more trees per acre, what will be the average yield in peaches per tree? What is
the average yield in peaches per tree if she plants 42 trees per acre?
c. Let T be the function for which the input x is the number of trees planted on each acre and T(x) is
the average yield in peaches per tree. Write a formula for T(x) in terms of x and express it in
simplest form. Explain how you know that your formula is correct.
d. Draw a graph of the function T. Given that the information from the agricultural experiment
station applies only to increasing the number of trees per acre, what is an appropriate domain for
the function T?
2. Since her income from peaches depends on the total number of peaches she produces, Paula realized
that she needed to take a next step and consider the total number of peaches that she can produce per
acre.
a. With the current 30 trees per acre, what is the yield in total peaches per acre? If Paula plants 36
trees per acre, what will be the yield in total peaches per acre? 42 trees per acre?
b. Find the average rate of change of peaches per acre with respect to number of trees per acre
when the number of trees per acre increases from 30 to 36. Write a sentence to explain what this
number means.
c. Find the average rate of change of peaches per acre with respect to the number of trees per acre
when the number of trees per acre increases from 36 to 42. Write a sentence to explain the
meaning of this number.
Georgia Department of Education Georgia Standards of Excellence Framework
GSE Algebra I Unit 3
Mathematics GSE Algebra I Unit 3: Modeling and Analyzing Quadratic Functions
Richard Woods, State School Superintendent
July 2015 Page 18 of 68
All Rights Reserved
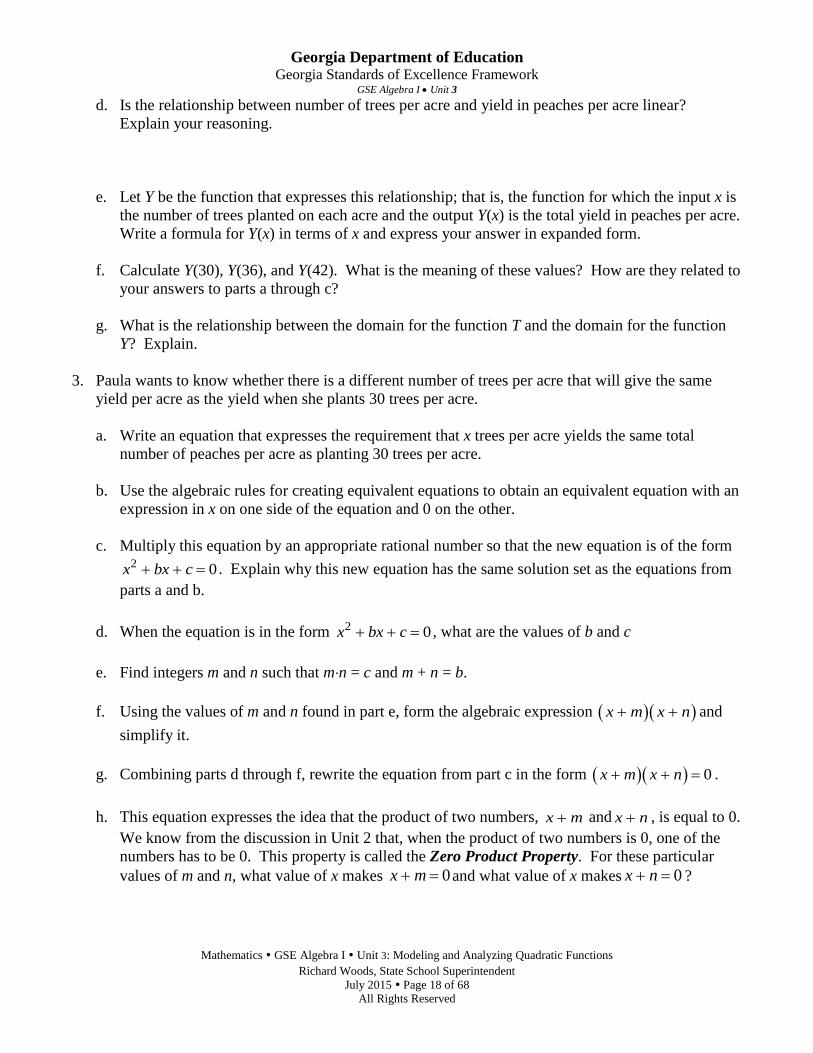
d. Is the relationship between number of trees per acre and yield in peaches per acre linear?
Explain your reasoning.
e. Let Y be the function that expresses this relationship; that is, the function for which the input x is
the number of trees planted on each acre and the output Y(x) is the total yield in peaches per acre.
Write a formula for Y(x) in terms of x and express your answer in expanded form.
f. Calculate Y(30), Y(36), and Y(42). What is the meaning of these values? How are they related to
your answers to parts a through c?
g. What is the relationship between the domain for the function T and the domain for the function
Y? Explain.
3. Paula wants to know whether there is a different number of trees per acre that will give the same
yield per acre as the yield when she plants 30 trees per acre.
a. Write an equation that expresses the requirement that x trees per acre yields the same total
number of peaches per acre as planting 30 trees per acre.
b. Use the algebraic rules for creating equivalent equations to obtain an equivalent equation with an
expression in x on one side of the equation and 0 on the other.
c. Multiply this equation by an appropriate rational number so that the new equation is of the form 2 0x bx c . Explain why this new equation has the same solution set as the equations from
parts a and b.
d. When the equation is in the form 2 0x bx c , what are the values of b and c
e. Find integers m and n such that mn = c and m + n = b.
f. Using the values of m and n found in part e, form the algebraic expression x m x n and
simplify it.
g. Combining parts d through f, rewrite the equation from part c in the form 0x m x n .
h. This equation expresses the idea that the product of two numbers, x m and x n , is equal to 0.
We know from the discussion in Unit 2 that, when the product of two numbers is 0, one of the
numbers has to be 0. This property is called the Zero Product Property. For these particular
values of m and n, what value of x makes 0x m and what value of x makes 0x n ?

Georgia Department of Education Georgia Standards of Excellence Framework
GSE Algebra I Unit 3
Mathematics GSE Algebra I Unit 3: Modeling and Analyzing Quadratic Functions
Richard Woods, State School Superintendent
July 2015 Page 19 of 68
All Rights Reserved
i. Verify that the answers to part h are solutions to the equation written in part a. It is appropriate
to use a calculator for the arithmetic.
j. Write a sentence to explain the meaning of your solutions to the equation in relation to planting
peach trees.
4. Paula saw another peach grower, Sam, from a neighboring county at a farm equipment auction and
began talking to him about the possibilities for the new section of her orchard. Sam was surprised to
learn about the agricultural research and said that it probably explained the drop in yield for a
orchard near him. This peach farm has more than 30 trees per acre and is getting an average total
yield of 14,400 peaches per acre. (Remember: Throughout this task assume that, for all peach
growers in this area, the average yield is 600 peaches per tree when 30 trees per acre are planted
and that this yield will decrease by 12 peaches per tree for each additional tree per acre.)
a. Write an equation that expresses the situation that x trees per acre results in a total yield per acre
of 14,400 peaches per acre.
b. Use the algebraic rules for creating equivalent equations to obtain an equivalent equation with an
expression in x on one side of the equation and 0 on the other.
c. Multiply this equation by an appropriate rational number so that the new equation is of the form 2 0x bx c . Explain why this new equation has the same solution set as the equations from
parts and b.
d. When the equation is in the form2 0x bx c , what is value of b and what is the value of c?
e. Find integers m and n such that mn = c and m + n = b.
f. Using the values of m and n found in part e, form the algebraic expression x m x n and
simplify it.
g. Combining parts d through f, rewrite the equation from part d in the form 0x m x n .
h. This equation expresses the idea that the product of two numbers, x m and x n , is equal to 0.
We know from the discussion in Unit 2 that, when the product of two numbers is 0, one of the
numbers has to be 0. What value of x makes 0x m ? What value of x makes 0x n ?
i. Verify that the answers to part h are solutions to the equation written in part a. It is appropriate
to use a calculator for the arithmetic.
Georgia Department of Education Georgia Standards of Excellence Framework
GSE Algebra I Unit 3
Mathematics GSE Algebra I Unit 3: Modeling and Analyzing Quadratic Functions
Richard Woods, State School Superintendent
July 2015 Page 20 of 68
All Rights Reserved
j. Which of the solutions verified in part i is (are) in the domain of the function Y? How many
peach trees per acre are planted at the peach orchard getting 14400 peaches per acre?
The steps in items 3 and 4 outline a method of solving equations of the form x2 + bx + c. These
equations are called quadratic equations and an expression of the form x2 + bx + c is called a quadratic
expression. In general, quadratic expressions may have any nonzero coefficient on the x2 term. An
important part of this method for solving quadratic expressions with coefficient 1 on the x2term. An
important part of this method for solving quadratic equations is the process of rewriting an expression of
the form x2 + bx + c in the form (x + m)(x + n). The identity tells us that the product of the numbers m
and n must equal c and that the sum of m and n must equal b.
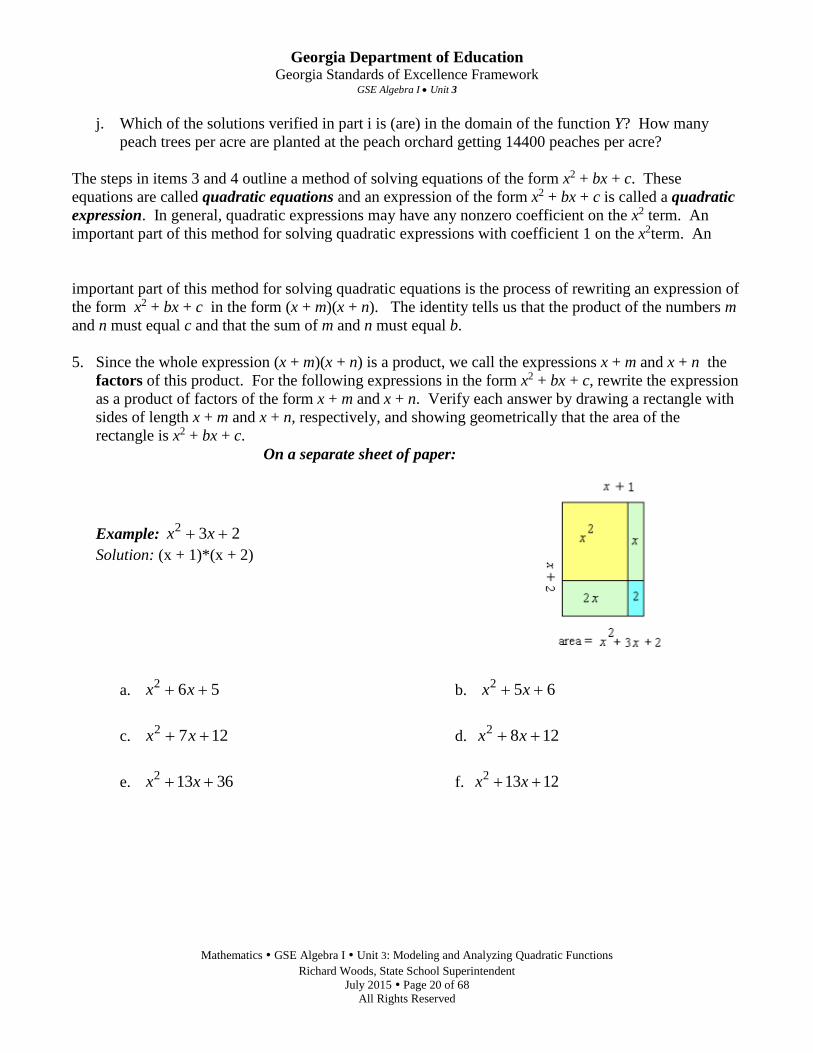
5. Since the whole expression (x + m)(x + n) is a product, we call the expressions x + m and x + n the
factors of this product. For the following expressions in the form x2 + bx + c, rewrite the expression
as a product of factors of the form x + m and x + n. Verify each answer by drawing a rectangle with
sides of length x + m and x + n, respectively, and showing geometrically that the area of the
rectangle is x2 + bx + c.
On a separate sheet of paper:
Example: 2 3 2x x
Solution: (x + 1)*(x + 2)
a. 2 6 5x x b.
2 5 6x x
c. 2 7 12x x d.
2 8 12x x
e. 2 13 36x x f.
2 13 12x x

Georgia Department of Education Georgia Standards of Excellence Framework
GSE Algebra I Unit 3
Mathematics GSE Algebra I Unit 3: Modeling and Analyzing Quadratic Functions
Richard Woods, State School Superintendent
July 2015 Page 21 of 68
All Rights Reserved
6. In item 5, the values of b and c were positive. Now use Identity 1 in reverse to factor each of the
following quadratic expressions of the form x2 + bx + c where c is positive but b is negative. Verify
each answer by multiplying the factored form to obtain the original expression.
On a separate sheet of paper:
a. 2 8 7x x e.
2 11 24x x
b. 2 9 18x x f.
2 11 18x x
c. 2 4 4x x g.
2 12 27x x
d. 2 8 15x x
Paula’s Peaches Continued!
7. Now we return to the peach growers in central Georgia. How many peach trees per acre would
result in only 8400 peaches per acre? Which answer makes sense in this particular context?
8. If there are no peach trees on a property, then the yield is zero peaches per acre. Write an equation
to express the idea that the yield is zero peaches per acre with x trees planted per acre, where x is
number greater than 30. Is there a solution to this equation? Explain why only one of the solutions
makes sense in this context.
Georgia Department of Education Georgia Standards of Excellence Framework
GSE Algebra I Unit 3
Mathematics GSE Algebra I Unit 3: Modeling and Analyzing Quadratic Functions
Richard Woods, State School Superintendent
July 2015 Page 22 of 68
All Rights Reserved
9. At the same auction where Paula heard about the peach grower who was getting a low yield, she
talked to the owner of a major farm supply store in the area. Paula began telling the store owner
about her plans to expand her orchard, and the store owner responded by telling her about a local
grower that gets 19,200 peaches per acre. Is this number of peaches per acre possible? If so, how
many trees were planted?
10. Using graph paper, explore the graph of Y as a function of x.
a. What points on the graph correspond to the answers for part j from questions 3 and 4?
b. What points on the graph correspond to the answers to questions 7, 8, and 9?
c. What is the relationship of the graph of the function Y to the graph of the function f , where the
formula for f(x) is the same as the formula for Y(x) but the domain for f is all real numbers?
d. Questions 4, 7, and 8 give information about points that are on the graph of f but not on the graph
of Y. What points are these?
e. Graph the functions f and Y on the same axes. How does your graph show that the domain of f is
all real numbers? How is the domain of Y shown on your graph?
f. Draw the line y = 18000 on the graph drawn for item 10, part e. This line is the graph of the
function with constant value 18000. Where does this line intersect the graph of the function Y?
Based on the graph, how many trees per acre give a yield of more than 18000 peaches per acre?
g. Draw the line y = 8400 on your graph. Where does this line intersect the graph of the function
Y? Based on the graph, how many trees per acre give a yield of fewer than 8400 peaches per
acre?
h. Use a graphing utility and this intersection method to find the number of trees per acre that give a
total yield closest to the following numbers of peaches per acre:
(i) 10000 (ii) 15000 (iii) 20000
i. Find the value of the function Y for the number of trees given in answering (i) – (iii) in part c
above.

Georgia Department of Education Georgia Standards of Excellence Framework
GSE Algebra I Unit 3
Mathematics GSE Algebra I Unit 3: Modeling and Analyzing Quadratic Functions
Richard Woods, State School Superintendent
July 2015 Page 23 of 68
All Rights Reserved
11. In items 5 and 6, we used factoring as part of a process to solve equations that are equivalent to
equations of the form 2 0x bx c where b and c are integers. Look back at the steps you did
in items 3 and 4, and describe the process for solving an equation of the form 2 0x bx c .
Use this process to solve each of the following equations, that is, to find all of the numbers that
satisfy the original equation. Verify your work by checking each solution in the original
equation.
a. 2 6 8 0x x
b. 2 15 36 0x x
c. 2 28 27 0x x
d. 2 3 10 0x x
e. 2 2 15 0x x
f. 2 4 21 0x x
g. 2 7 0x x
h. 2 13 0x x
Georgia Department of Education Georgia Standards of Excellence Framework
GSE Algebra I Unit 3
Mathematics GSE Algebra I Unit 3: Modeling and Analyzing Quadratic Functions
Richard Woods, State School Superintendent
July 2015 Page 24 of 68
All Rights Reserved
12. For each of the equations solved in question 11, do the following.
a. Use technology to graph a function whose formula is given by the left–hand side of the
equation.
b. Find the points on the graph which correspond to the solutions found in question 8.
c. How is each of these results an example of the intersection method explored above?

Georgia Department of Education Georgia Standards of Excellence Framework
GSE Algebra I Unit 3
Mathematics GSE Algebra I Unit 3: Modeling and Analyzing Quadratic Functions
Richard Woods, State School Superintendent
July 2015 Page 25 of 68
All Rights Reserved
Henley’s Chocolates (Learning Task)
Name________________________________ Date___________________
Mathematical Goals
Solve quadratic equations by taking square roots
Horizontal translations
Essential Questions
How do I solve quadratic equations by taking square roots?
GEORGIA STANDARDS OF EXCELLENCE
MGSE9-12.A.REI.4b Solve quadratic equations by inspection (e.g., for x2 = 49), taking
square roots, factoring, completing the square, and the quadratic formula, as appropriate
to the initial form of the equation (limit to real number solutions).
MGSE9-12.F.BF.3 Identify the effect on the graph of replacing f(x) by f(x) + k, kf(x), f(kx), and
f(x + k) for specific values of k (both positive and negative); find the value of k given the graphs.
Experiment with cases and illustrate an explanation of the effects on the graph using technology.
Include recognizing even and odd functions from their graphs and algebraic expressions for them.
STANDARDS FOR MATHEMATICAL PRACTICE
1. Make sense of problems and persevere in solving them by requiring students to
interpret and make meaning of a problem and find a logical starting point, and to monitor
their progress and change their approach to solving the problem, if necessary.
2. Reason abstractly and quantitatively by requiring students to make sense of quantities
and their relationships to one another in problem situations.
4. Model with mathematics by expecting students to apply the mathematics concepts they
know in order to solve problems arising in everyday situations, and reflect on whether the
results are sensible for the given scenario.
5. Use appropriate tools strategically by expecting students to consider available tools
when solving a mathematical problem. These tools might include pencil and paper,
concrete models, a ruler, a protractor, a compass, a calculator, software, etc.
7. Look for and make use of structure by expecting students to apply rules, look for
patterns and analyze structure.
8. Look for and express regularity in repeated reasoning by expecting students to
understand broader applications and look for structure and general methods in similar
situations.
Georgia Department of Education Georgia Standards of Excellence Framework
GSE Algebra I Unit 3
Mathematics GSE Algebra I Unit 3: Modeling and Analyzing Quadratic Functions
Richard Woods, State School Superintendent
July 2015 Page 26 of 68
All Rights Reserved
Henley’s Chocolates (Learning Task)
Name_______________________________ Date______________
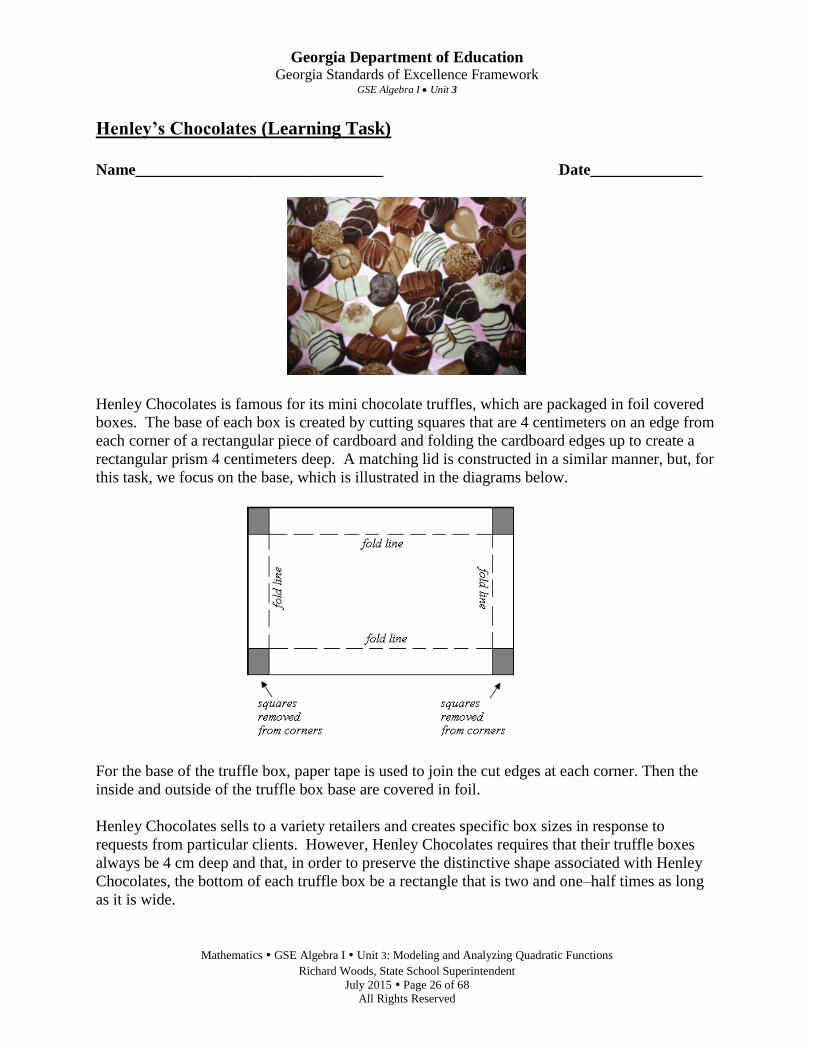
Henley Chocolates is famous for its mini chocolate truffles, which are packaged in foil covered
boxes. The base of each box is created by cutting squares that are 4 centimeters on an edge from
each corner of a rectangular piece of cardboard and folding the cardboard edges up to create a
rectangular prism 4 centimeters deep. A matching lid is constructed in a similar manner, but, for
this task, we focus on the base, which is illustrated in the diagrams below.
For the base of the truffle box, paper tape is used to join the cut edges at each corner. Then the
inside and outside of the truffle box base are covered in foil.
Henley Chocolates sells to a variety retailers and creates specific box sizes in response to
requests from particular clients. However, Henley Chocolates requires that their truffle boxes
always be 4 cm deep and that, in order to preserve the distinctive shape associated with Henley
Chocolates, the bottom of each truffle box be a rectangle that is two and one–half times as long
as it is wide.

Georgia Department of Education Georgia Standards of Excellence Framework
GSE Algebra I Unit 3
Mathematics GSE Algebra I Unit 3: Modeling and Analyzing Quadratic Functions
Richard Woods, State School Superintendent
July 2015 Page 27 of 68
All Rights Reserved
1. Henley Chocolates restricts box sizes to those which will hold plastic trays for a whole
number of mini truffles. A box needs to be at least 2 centimeters wide to hold one row of
mini truffles. Let L denote the length of a piece of cardboard from which a truffle box is
made. What value of L corresponds to a finished box base for which the bottom is a
rectangle that is 2 centimeters wide?
2. Henley Chocolates has a maximum size box of mini truffles that it will produce for retail
sale. For this box, the bottom of the truffle box base is a rectangle that is 50 centimeters
long. What are the dimensions of the piece of cardboard from which this size truffle box
base is made?
3. Since all the mini truffle boxes are 4 centimeters deep, each box holds two layers of mini
truffles. Thus, the number of truffles that can be packaged in a box depends the number of
truffles that can be in one layer, and, hence, on the area of the bottom of the box. Let A(x)
denote the area, in square centimeters, of the rectangular bottom of a truffle box base. Write
a formula for A(x) in terms of the length L, in centimeters, of the piece of cardboard from
which the truffle box base is constructed.
4. Although Henley Chocolates restricts truffle box sizes to those that fit the plastic trays for a
whole number of mini truffles, the engineers responsible for box design find it simpler to
study the function A on the domain of all real number values of L in the interval from the
minimum value of L found in item 1 to the maximum value of L found in item 2. State this
interval of L values as studied by the engineers at Henley Chocolates.
5. Let g be the function with the same formula as the formula for function A but with domain all
real numbers. Describe the transformations of the function f, the square function, that will
produce the graph of the function g. Use technology to graph f and g on the same axes to
check that the graphs match your description of the described transformations.

Georgia Department of Education Georgia Standards of Excellence Framework
GSE Algebra I Unit 3
Mathematics GSE Algebra I Unit 3: Modeling and Analyzing Quadratic Functions
Richard Woods, State School Superintendent
July 2015 Page 28 of 68
All Rights Reserved
6. Describe the graph of the function A in words and make a hand drawn sketch. Remember
that you found the domain of the function in item 4. What is the range of the function A?
7. The engineers at Henley Chocolates responsible for box design have decided on two new box
sizes that they will introduce for the next winter holiday season.
a. The area of the bottom of the larger of the new boxes will be 640 square centimeters.
Use the function A to write and solve an equation to find the length L of the cardboard
need to make this new box.
b. The area of the bottom of the smaller of the new boxes will be 40 square centimeters.
Use the function A to write and solve an equation to find the length L of the cardboard
need to make this new box.
8. How many mini–truffles do you think the engineers plan to put in each of the new boxes?
y
x

Georgia Department of Education Georgia Standards of Excellence Framework
GSE Algebra I Unit 3
Mathematics GSE Algebra I Unit 3: Modeling and Analyzing Quadratic Functions
Richard Woods, State School Superintendent
July 2015 Page 29 of 68
All Rights Reserved
Completing the Square & Deriving the Quadratic Formula (Spotlight Task)
Name______________________________ Date_________________
Mathematical Goals
To learn how to complete the square
To derive the quadratic formula
Essential Questions
How do I complete the square?
How do I justify the quadratic formula?
GEORGIA STANDARDS OF EXCELLENCE
MGSE9-12.A.REI.4a Use the method of completing the square to transform any quadratic
equation in x into an equation of the form (x – p)2 = q that has the same solutions. Derive the
quadratic formula from ax2 + bx + c = 0.
MGSE9-12.A.SSE.3b Complete the square in a quadratic expression to reveal the maximum
and minimum value of the function defined by the expression.
MGSE9-12.F.IF.7 Graph functions expressed algebraically and show key features of the
graph both by hand and by using technology.
STANDARDS FOR MATHEMATICAL PRACTICE
7. Look for and make use of structure by expecting students to apply rules, look for
patterns and analyze structure.
8. Look for and express regularity in repeated reasoning by expecting students to
understand broader applications and look for structure and general methods in similar
situations.
Georgia Department of Education Georgia Standards of Excellence Framework
GSE Algebra I Unit 3
Mathematics GSE Algebra I Unit 3: Modeling and Analyzing Quadratic Functions
Richard Woods, State School Superintendent
July 2015 Page 30 of 68
All Rights Reserved
Completing the Square & Deriving the Quadratic Formula (Spotlight Task)
Name______________________________ Date_________________
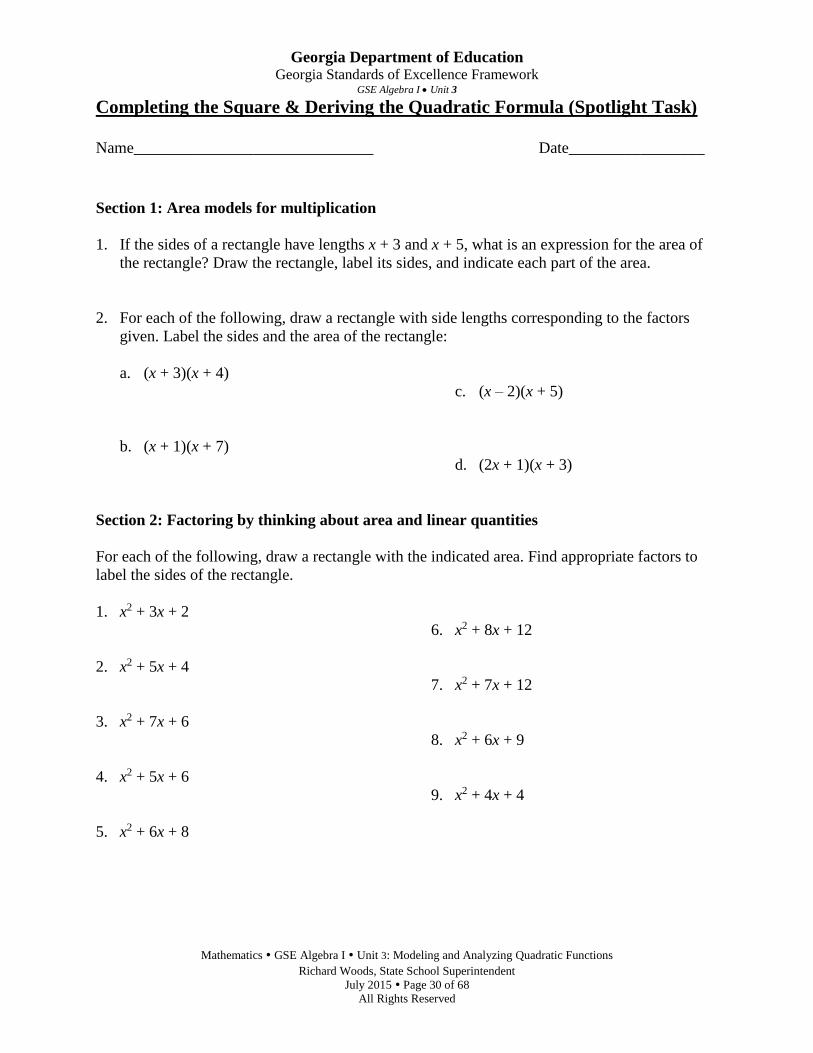
Section 1: Area models for multiplication
1. If the sides of a rectangle have lengths x + 3 and x + 5, what is an expression for the area of
the rectangle? Draw the rectangle, label its sides, and indicate each part of the area.
2. For each of the following, draw a rectangle with side lengths corresponding to the factors
given. Label the sides and the area of the rectangle:
a. (x + 3)(x + 4)
b. (x + 1)(x + 7)
c. (x – 2)(x + 5)
d. (2x + 1)(x + 3)
Section 2: Factoring by thinking about area and linear quantities
For each of the following, draw a rectangle with the indicated area. Find appropriate factors to
label the sides of the rectangle.
1. x2 + 3x + 2
2. x2 + 5x + 4
3. x2 + 7x + 6
4. x2 + 5x + 6
5. x2 + 6x + 8
6. x2 + 8x + 12
7. x2 + 7x + 12
8. x2 + 6x + 9
9. x2 + 4x + 4

Georgia Department of Education Georgia Standards of Excellence Framework
GSE Algebra I Unit 3
Mathematics GSE Algebra I Unit 3: Modeling and Analyzing Quadratic Functions
Richard Woods, State School Superintendent
July 2015 Page 31 of 68
All Rights Reserved
Section 3: Completing the square
1. What number can you fill in the following blank so that x2 + 6x + ____ will have two equal
factors?
What are the factors?
Draw the area and label the sides.
What shape do you have?
2. What number can you fill in the following blank so that x2 + 8x + ____ will have two equal
factors?
What are the factors?
Draw the area and label the sides.
What shape do you have?
3. What number can you fill in the following blank so that x2 + 4x + ____ will have two equal
factors?
What are the factors?
Draw the area and label the sides.
What shape do you have?
4. What would you have to add to x2 + 10x in order to make a square?
What could you add to x2 + 20x to make a square?
What about x2 + 50x?
What if you had x2 + bx?
Section 4: Solving equations by completing the square
1. Solve x2 = 9 without factoring.
How many solutions do you have?
What are your solutions?
2. Use the same method as in question 5 to solve (x + 1)2 = 9.
How many solutions do you have?
What are your solutions?

Georgia Department of Education Georgia Standards of Excellence Framework
GSE Algebra I Unit 3
Mathematics GSE Algebra I Unit 3: Modeling and Analyzing Quadratic Functions
Richard Woods, State School Superintendent
July 2015 Page 32 of 68
All Rights Reserved
3. In general, we can solve any equation of this form (x + h)2 = k by taking the square root of
both sides and then solving the two equations that we get. Solve each of the following:
a. (x + 3)2 = 16
b. (x + 2)2 = 5
c. (x – 3)2 = 4
d. (x – 4)2 = 3
4. Now, if we notice that we have the right combination of numbers, we can actually solve other
equations by first putting them into this, using what we noticed in questions 1 – 4. Notice
that if we have x2 + 6x + 9 = 25, the left side is a square, that is, x2 + 6x + 9 = (x + 3)2. So,
we can rewrite x2 + 6x + 9 = 25 as (x + 3)2 = 25, and then solve it just like we did the
problems in question 7. (What do you get?)
5. Sometimes, though, the problem is not written quite in the right form. That’s okay. We can
apply what we already know about solving equations to write it in the right form, and then
we can solve it. This is called completing the square. Let’s say we have x2 + 6x = 7. The left
side of this equation is not a square, but we know what to add to it. If we add 9 to both sides
of the equation, we get x2 + 6x + 9 = 16. Now we can solve it just like the ones above. What
is the solution?
6. Try these:
a. x2 + 10x = –9
b. x2 + 8x = 20
c. x2 + 2x = 5
d. x2 + 6x – 7 = 0
e. 2x2 + 8x = –6
Section 5: Deriving the quadratic formula by completing the square
If you can complete the square for a general quadratic equation, you will derive a formula you
can use to solve any quadratic equation. Start with ax2 + bx + c = 0, and follow the steps you
used in Section 4.

Georgia Department of Education Georgia Standards of Excellence Framework
GSE Algebra I Unit 3
Mathematics GSE Algebra I Unit 3: Modeling and Analyzing Quadratic Functions
Richard Woods, State School Superintendent
July 2015 Page 33 of 68
All Rights Reserved
Standard to Vertex Form (Spotlight Task)
Name__________________________ Date_________
Mathematical Goals
To convert from standard to vertex form
To identify key features of a quadratic function by completing the square
Essential Questions
How do I convert from standard to vertex form?
How do I identify key features of a quadratic function by completing the square?
Why is it important to be able to complete the square?
GEORGIA STANDARDS OF EXCELLENCE
MGSE9-12.A.SSE.2 Use the structure of an expression to rewrite it in different equivalent
forms. For example, see x4 – y4 as (x2)2 – (y2)2, thus recognizing it as a difference of squares
that can be factored as (x2 – y2)(x2 + y2).
MGSE9-12.A.SSE.3 Choose and produce an equivalent form of an expression to reveal and
explain properties of the quantity represented by the expression.
MGSE9-12.A.SSE.3b Complete the square in a quadratic expression to reveal the maximum
and minimum value of the function defined by the expression.
MGSE9-12.F.IF.7 Graph functions expressed algebraically and show key features of the
graph both by hand and by using technology.
MGSE9-12.F.IF.7a Graph linear and quadratic functions and show intercepts, maxima, and
minima (as determined by the function or by context).
MGSE9-12.F.IF.8 Write a function defined by an expression in different but equivalent forms to
reveal and explain different properties of the function.
MGSE9-12.F.IF.8a Use the process of factoring and completing the square in a quadratic
function to show zeros, extreme values, and symmetry of the graph, and interpret these in
terms of a context. For example, compare and contrast quadratic functions in standard, vertex,
and intercept forms.
STANDARDS FOR MATHEMATICAL PRACTICE
1. Make sense of problems and persevere in solving them by requiring students to
interpret and make meaning of a problem and find a logical starting point, and to monitor
their progress and change their approach to solving the problem, if necessary.

Georgia Department of Education Georgia Standards of Excellence Framework
GSE Algebra I Unit 3
Mathematics GSE Algebra I Unit 3: Modeling and Analyzing Quadratic Functions
Richard Woods, State School Superintendent
July 2015 Page 34 of 68
All Rights Reserved
2. Reason abstractly and quantitatively by requiring students to make sense of quantities
and their relationships to one another in problem situations.
3. Construct viable arguments and critique the reasoning of others by engaging
students on discussion of why they agree or disagree with responses, decide whether they
make sense, and ask useful questions to clarify or improve the arguments.
7. Look for and make use of structure by expecting students to apply rules, look for
patterns and analyze structure.

Georgia Department of Education Georgia Standards of Excellence Framework
GSE Algebra I Unit 3
Mathematics GSE Algebra I Unit 3: Modeling and Analyzing Quadratic Functions
Richard Woods, State School Superintendent
July 2015 Page 35 of 68
All Rights Reserved
Standard to Vertex Form (Spotlight Task)
Name________________________________ Date_________________
In this task you will learn to identify key features of quadratic functions by completing the
square
In addition to solving equations, completing the square can be helpful in identifying horizontal
and vertical shifts in the graph of a function. For instance, suppose you want to graph f(x) = x2 +
6x + 5. We can complete the square to write it in vertex form, so we want it to look like f(x) =
a(x – h)2 + k. We complete the square to find the (x – h)2 part, and in doing so, we also find k.
Look at x2 + 6x. We know from our work earlier that we can add 9 to make a perfect square
trinomial. But we can’t just add 9 to an equation. We can add 9 and subtract 9 (because then
we’re just adding zero). So, we have f(x) = (x2 + 6x +9) + 5 – 9. When we simplify, we get f(x) =
(x + 3)2 – 4. So the graph of this function will be shifted three to the left and four down.
Find the horizontal and vertical shifts by completing the square and graph each of these:
1. f(x) = x2 + 10x + 27 2. f(x) = x2 – 6x + 1
y
x
y
x

Georgia Department of Education Georgia Standards of Excellence Framework
GSE Algebra I Unit 3
Mathematics GSE Algebra I Unit 3: Modeling and Analyzing Quadratic Functions
Richard Woods, State School Superintendent
July 2015 Page 36 of 68
All Rights Reserved
When the leading coefficient is not 1, we have to be even more careful when changing from
standard to vertex form. However, the ideas are the same. We want to create a perfect square
trinomial and write the equation in vertex form. For example, say we have f(x) = 3x2 + 6x + 5.
This time, we need to factor the leading coefficient out of the first two terms and then complete
the square. So, we have f(x) = 3(x2 + 2x ) + 5. Completing the square on x2 + 2x means we need
to add 1. But if we add 1 inside the parentheses, we are actually adding three (3 ∙ 1), so we have
to add 3 and subtract 3: f(x) = 3(x2 + 2x + 1) + 5 – 3. Simplifying, we have f(x) = 3(x + 1)2 + 2.
Find the horizontal and vertical shifts by completing the square and graph each of these:
3. f(x) = 2x2 – 8x + 3 4. f(x) = –3x2 + 12x – 5
y
x
y
x

Georgia Department of Education Georgia Standards of Excellence Framework
GSE Algebra I Unit 3
Mathematics GSE Algebra I Unit 3: Modeling and Analyzing Quadratic Functions
Richard Woods, State School Superintendent
July 2015 Page 37 of 68
All Rights Reserved
Protein Bar Toss (Learning Task)
Name_______________________________ Date________________
Mathematical Goals
Find maximums and minimums of quadratic functions
Interpreting the constant term in a quadratic equation in context
Factoring quadratic trinomials with a > 1
Essential Questions
How do I find maximums and minimums of quadratic functions?
How do I interpret the meaning of the constant term in a quadratic equation in context?
How do I factor quadratic trinomials with a > 1?
GEORGIA STANDARDS OF EXCELLENCE
MGSE9-12.F.IF.4 Using tables, graphs, and verbal descriptions, interpret the key characteristics of
a function which models the relationship between two quantities. Sketch a graph showing key
features including: intercepts; interval where the function is increasing, decreasing, positive, or
negative; relative maximums and minimums; symmetries; end behavior; and periodicity.
MGSE9-12.F.IF.5 Relate the domain of a function to its graph and, where applicable, to the quantitative
relationship it describes. For example, if the function h(n) gives the number of person-hours it takes to
assemble n engines in a factory, then the positive integers would be an appropriate domain for the
function.
MGSE9-12.F.IF.7a Graph linear and quadratic functions and show intercepts, maxima, and
minima (as determined by the function or by context).
MGSE9-12.F.IF.8a Use the process of factoring and completing the square in a quadratic function
to show zeros, extreme values, and symmetry of the graph, and interpret these in terms of a context.
For example, compare and contrast quadratic functions in standard, vertex, and intercept forms.
MGSE9-12.F.IF.9 Compare properties of two functions each represented in a different way
(algebraically, graphically, numerically in tables, or by verbal descriptions). For example, given a
graph of one function and an algebraic expression for another, say which has the larger maximum.
STANDARDS FOR MATHEMATICAL PRACTICE
2. Reason abstractly and quantitatively by requiring students to make sense of quantities and
their relationships to one another in problem situations.
3. Construct viable arguments and critique the reasoning of others by engaging students on
discussion of why they agree or disagree with responses, decide whether they make sense,
and ask useful questions to clarify or improve the arguments.

Georgia Department of Education Georgia Standards of Excellence Framework
GSE Algebra I Unit 3
Mathematics GSE Algebra I Unit 3: Modeling and Analyzing Quadratic Functions
Richard Woods, State School Superintendent
July 2015 Page 38 of 68
All Rights Reserved
4. Model with mathematics by expecting students to apply the mathematics concepts they know in
order to solve problems arising in everyday situations, and reflect on whether the results are
sensible for the given scenario.
5. Use appropriate tools strategically by expecting students to consider available tools when
solving a mathematical problem. These tools might include pencil and paper, concrete models, a
ruler, a protractor, a compass, a calculator, software, etc.
6. Attend to precision by requiring students to calculate efficiently and accurately; and to
communicate precisely with others by using clear mathematical language to discuss their
reasoning.
7. Look for and make use of structure by expecting students to apply rules, look for patterns and
analyze structure.
8. Look for and express regularity in repeated reasoning by expecting students to understand
broader applications and look for structure and general methods in similar situations.
Georgia Department of Education Georgia Standards of Excellence Framework
GSE Algebra I Unit 3
Mathematics GSE Algebra I Unit 3: Modeling and Analyzing Quadratic Functions
Richard Woods, State School Superintendent
July 2015 Page 39 of 68
All Rights Reserved
Protein Bar Toss (Learning Task)
Name_______________________________ Date________________
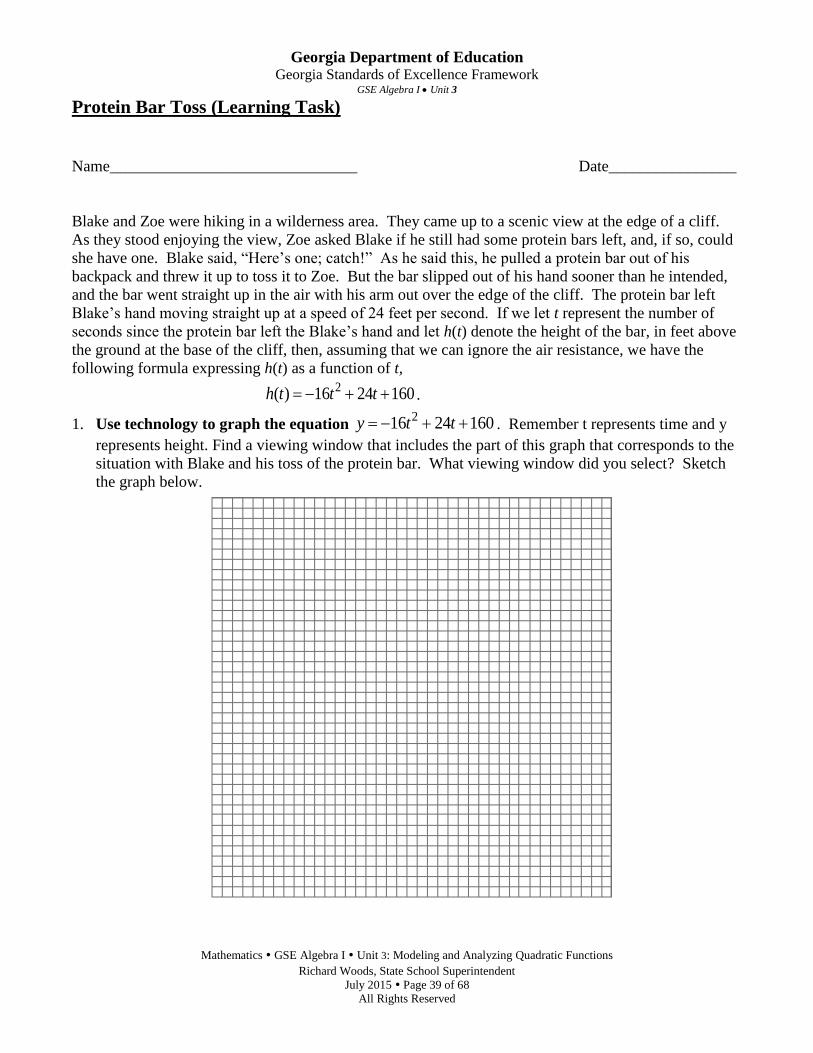
Blake and Zoe were hiking in a wilderness area. They came up to a scenic view at the edge of a cliff.
As they stood enjoying the view, Zoe asked Blake if he still had some protein bars left, and, if so, could
she have one. Blake said, “Here’s one; catch!” As he said this, he pulled a protein bar out of his
backpack and threw it up to toss it to Zoe. But the bar slipped out of his hand sooner than he intended,
and the bar went straight up in the air with his arm out over the edge of the cliff. The protein bar left
Blake’s hand moving straight up at a speed of 24 feet per second. If we let t represent the number of
seconds since the protein bar left the Blake’s hand and let h(t) denote the height of the bar, in feet above
the ground at the base of the cliff, then, assuming that we can ignore the air resistance, we have the
following formula expressing h(t) as a function of t, 2( ) 16 24 160h t t t .
1. Use technology to graph the equation 216 24 160y t t . Remember t represents time and y
represents height. Find a viewing window that includes the part of this graph that corresponds to the
situation with Blake and his toss of the protein bar. What viewing window did you select? Sketch
the graph below.

Georgia Department of Education Georgia Standards of Excellence Framework
GSE Algebra I Unit 3
Mathematics GSE Algebra I Unit 3: Modeling and Analyzing Quadratic Functions
Richard Woods, State School Superintendent
July 2015 Page 40 of 68
All Rights Reserved
2. What was the height of the protein bar, measured from the ground at the base of the cliff, at the
instant that it left Blake’s hand? What special point on the graph is associated with this information?
3. At what other time does the protein bar reach the height from question 2? Describe how you reached
your answer.
4. If Blake does not catch the falling protein bar, how long will it take for the protein bar to hit the base
of the cliff? Justify your answer graphically. Then write a quadratic equation that you would need
to solve to justify the answer algebraically (Note: you do not need to solve this equation at this
point).
The equation from item 5 can be solved by factoring, but it requires factoring a quadratic polynomial
where the leading coefficient is not 1. Our next goal is to learn about factoring this type of polynomial.
We start by examining products that lead to such quadratic polynomials.
5. For each of the following, perform the indicated multiplication and use a rectangular model to show
a geometric interpretation of the product as area for positive values of x.
a. (2x + 3)(3x + 4)
b. (x + 2)(4x + 11)
c. (2x + 1)(5x + 4
6. For each of the following, perform the indicated multiplication (Note: you do not need to use the
rectangular model).
a. (2x – 3)(9x + 2)
b. (3x – 1)(x – 4)
c. (4x – 7)(2x + 9)

Georgia Department of Education Georgia Standards of Excellence Framework
GSE Algebra I Unit 3
Mathematics GSE Algebra I Unit 3: Modeling and Analyzing Quadratic Functions
Richard Woods, State School Superintendent
July 2015 Page 41 of 68
All Rights Reserved
Factoring Polynomials
The method for factoring general quadratic polynomial of the form 2ax bx c , with a, b, and c all
non–zero integers, is similar to the method previously learned for factoring quadratics of this form but
with the value of a restricted to a = 1. The next item guides you through an example of this method.
7. Factor the quadratic polynomial26 7 20x x using the following steps.
a. Think of the polynomial as fitting the form 2ax bx c .
What is a? ____ What is c? ____ What is the product ac? ____
b. List all possible pairs of integers such that their product is equal to the number ac. It may be
helpful to organize your list in a table. Make sure that your integers are chosen so that their
product has the same sign, positive or negative, as the number ac from above, and make sure that
you list all of the possibilities.
Integer pair Integer pair Integer pair Integer pair
c. What is b in the quadratic polynomial given? _____ Add the integers from each pair listed in
part b. Which pair adds to the value of b from your quadratic polynomial? We’ll refer to the
integers from this pair as m and n.
d. Rewrite the polynomial replacing bx with mx nx . [Note either m or n could be negative; the
expression indicates to add the terms mx and nx including the correct sign.]
e. Factor the polynomial from part d by grouping.
f. Check your answer by performing the indicated multiplication in your factored polynomial. Did
you get the original polynomial back?
Integer pair, sum Integer pair, sum Integer pair, sum Integer pair, sum
Georgia Department of Education Georgia Standards of Excellence Framework
GSE Algebra I Unit 3
Mathematics GSE Algebra I Unit 3: Modeling and Analyzing Quadratic Functions
Richard Woods, State School Superintendent
July 2015 Page 42 of 68
All Rights Reserved
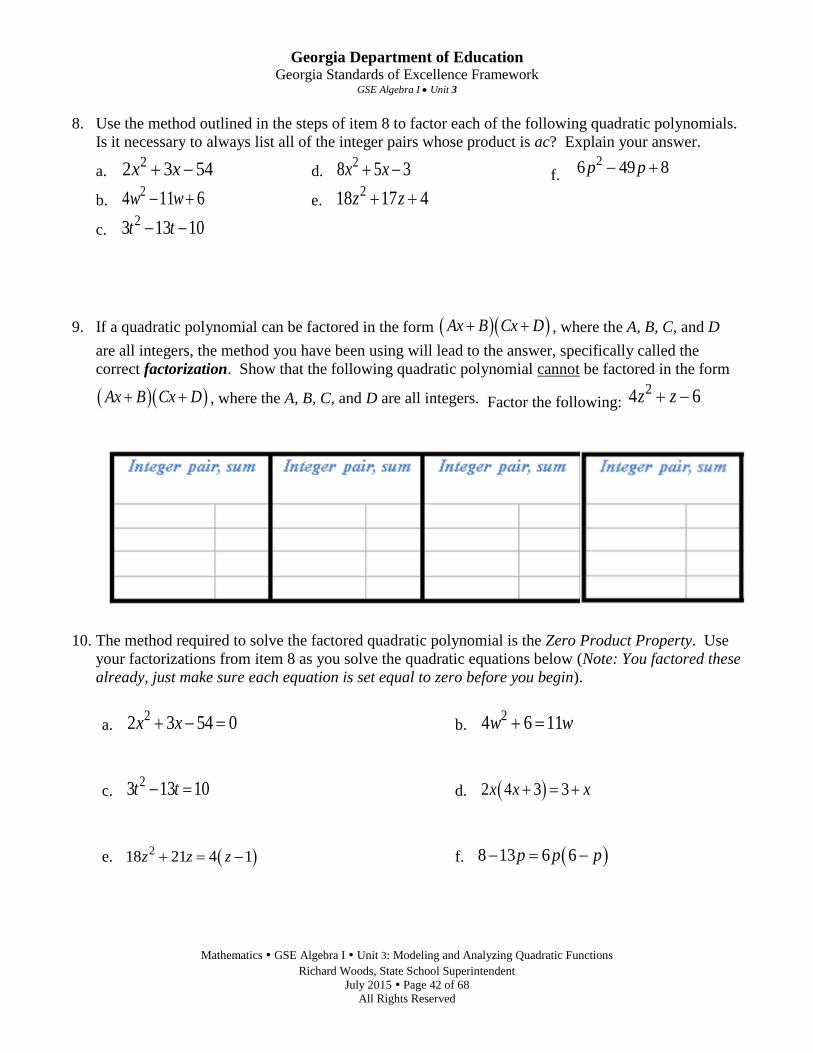
8. Use the method outlined in the steps of item 8 to factor each of the following quadratic polynomials.
Is it necessary to always list all of the integer pairs whose product is ac? Explain your answer.
a. 22 3 54x x
b. 24 11 6w w
c. 23 13 10t t
d. 28 5 3x x
e. 218 17 4z z
f. 26 49 8p p
9. If a quadratic polynomial can be factored in the form Ax B Cx D , where the A, B, C, and D
are all integers, the method you have been using will lead to the answer, specifically called the
correct factorization. Show that the following quadratic polynomial cannot be factored in the form
Ax B Cx D , where the A, B, C, and D are all integers. Factor the following: 24 6z z
10. The method required to solve the factored quadratic polynomial is the Zero Product Property. Use
your factorizations from item 8 as you solve the quadratic equations below (Note: You factored these
already, just make sure each equation is set equal to zero before you begin).
a. 22 3 54 0x x b.
24 6 11w w
c. 23 13 10t t d. 2 4 3 3x x x
e. 218 21 4 1z z z f. 8 13 6 6p p p

Georgia Department of Education Georgia Standards of Excellence Framework
GSE Algebra I Unit 3
Mathematics GSE Algebra I Unit 3: Modeling and Analyzing Quadratic Functions
Richard Woods, State School Superintendent
July 2015 Page 43 of 68
All Rights Reserved
11. Now we return to our goal of solving the equation from item 4. Solve the quadratic equation
using factorization and the Zero Product Property. Explain how the solution relates to the
real–world situation of throwing a protein bar. Do both of your solutions make sense?
12. Suppose the cliff had been 56 feet higher. Answer the following questions for this higher
cliff.
a. What was the height of the protein bar, measured from the ground at the base of the cliff,
at the instant that it left Blake’s hand? What special point on the graph is associated with
this information?
b. What is the formula for the height function in this situation?
c. If Blake wants to catch the falling protein bar, how long does he have until it hits the
ground below the cliff? Justify your answer algebraically.
d. If Blake does not catch the falling protein bar, how long it take for the protein bar to hit
the ground below the cliff? Justify your answer algebraically.
13. Suppose the cliff had been 88 feet lower. Answer the following questions for this lower cliff.
a. What was the height of the protein bar, measured from the ground at the base of the cliff,
at the instant that it left Blake’s hand? What special point on the graph is associated with
this information?
b. What is the formula for the height function in this situation?
c. If Blake does not catch the falling protein bar, how long it take for the protein bar to hit
the ground below the cliff? Justify your answer algebraically.

Georgia Department of Education Georgia Standards of Excellence Framework
GSE Algebra I Unit 3
Mathematics GSE Algebra I Unit 3: Modeling and Analyzing Quadratic Functions
Richard Woods, State School Superintendent
July 2015 Page 44 of 68
All Rights Reserved
The Protein Bar Toss, Part 2 (Learning Task)
Name___________________________ Date_________________
Mathematical Goals
Discover the vertex of a quadratic functions represented in the standard form.
Understand that the graph of the function f(x) = a(x – h)2 + k is obtained by applying
transformations to the graph of f(x) = x2
Explore the vertex and symmetry of a quadratic function
Interpret the key features of a quadratic function in context
Essential Questions
How do I find the vertex of a quadratic function represented in the standard form?
How do I construct a graph of the function f(x) = a(x – h)2 + k by applying
transformations to the graph of f(x) = x2 ?
What key characteristics describe a quadratic function?
How do I interpret the key features of a quadratic function in context?
GEORGIA STANDARDS OF EXCELLENCE
MGSE9-12.A.CED.4 Rearrange formulas to highlight a quantity of interest using the same
reasoning as in solving equations. Examples: Rearrange Ohm’s law V = IR to highlight
resistance R; Rearrange area of a circle formula A = π r2 to highlight the radius r.
MGSE9-12.F.IF.4 Using tables, graphs, and verbal descriptions, interpret the key
characteristics of a function which models the relationship between two quantities. Sketch a
graph showing key features including: intercepts; interval where the function is increasing,
decreasing, positive, or negative; relative maximums and minimums; symmetries; end
behavior; and periodicity.
MGSE9-12.F.IF.7 Graph functions expressed algebraically and show key features of the
graph both by hand and by using technology.
MGSE9-12.F.IF.7a Graph linear and quadratic functions and show intercepts, maxima, and
minima (as determined by the function or by context).
MGSE9-12.F.IF.8 Write a function defined by an expression in different but equivalent forms to
reveal and explain different properties of the function.
MGSE9-12.F.IF.8a Use the process of factoring and completing the square in a quadratic
function to show zeros, extreme values, and symmetry of the graph, and interpret these in
terms of a context. For example, compare and contrast quadratic functions in standard, vertex,
and intercept forms.

Georgia Department of Education Georgia Standards of Excellence Framework
GSE Algebra I Unit 3
Mathematics GSE Algebra I Unit 3: Modeling and Analyzing Quadratic Functions
Richard Woods, State School Superintendent
July 2015 Page 45 of 68
All Rights Reserved
MGSE9‐12.F.BF.3 Identify the effect on the graph of replacing f(x) by f(x) + k, k f(x), f(kx), and
f(x + k) for specific values of k(both positive and negative); find the value of k given the graphs.
Experiment with cases and illustrate an explanation of the effects on the graph using technology.
Include recognizing even and odd functions from their graphs and algebraic expressions for
them.
STANDARDS FOR MATHEMATICAL PRACTICE
2. Reason abstractly and quantitatively by requiring students to make sense of quantities
and their relationships to one another in problem situations.
4. Model with mathematics by expecting students to apply the mathematics concepts they
know in order to solve problems arising in everyday situations, and reflect on whether the
results are sensible for the given scenario.
5. Use appropriate tools strategically by expecting students to consider available tools
when solving a mathematical problem. These tools might include pencil and paper,
concrete models, a ruler, a protractor, a compass, a calculator, software, etc.
6. Attend to precision by requiring students to calculate efficiently and accurately; and to
communicate precisely with others by using clear mathematical language to discuss their
reasoning.
7. Look for and make use of structure by expecting students to apply rules, look for
patterns and analyze structure.
8. Look for and express regularity in repeated reasoning by expecting students to
understand broader applications and look for structure and general methods in similar
situations.

Georgia Department of Education Georgia Standards of Excellence Framework
GSE Algebra I Unit 3
Mathematics GSE Algebra I Unit 3: Modeling and Analyzing Quadratic Functions
Richard Woods, State School Superintendent
July 2015 Page 46 of 68
All Rights Reserved
Protein Bar Toss, Part 2 (Learning Task)
Name___________________________ Date_________________
In the first part of the learning task about Blake attempting to toss a protein bar to Zoe, you
found how long it took for the bar to go up and come back down to the starting height. However,
there is a question we did not consider: How high above its starting point did the protein bar go
before it started falling back down? We’re going to explore that question now.
1. So far in Unit 3, you have examined the graphs of many different quadratic functions.
Consider the functions you graphed in the first part of the Protein Bar Toss. Each of these
functions has a formula that is, or can be put in, the form 2y ax bx c with 0a . When
we consider such formulas with domain all real numbers, there are some similarities in the
shapes of the graphs. The shape of each graph is called a parabola. List at least three
characteristics common to the parabolas seen in these graphs.
2. The question of how high the protein bar goes before it starts to come back down is related to
a special point on the graph of the function. This point is called the vertex of the parabola.
What is special about this point?
3. In the first part of the protein bar task you considered three different functions, each one
corresponding to a different cliff height. Let’s rename the first of these functions as h1, so
that 2
1( ) 16 24 160h t t t .
a. Let 2( )h t denote the height of the protein bar if it is thrown from a cliff that is 56 feet
higher. Write the formula for the function 2h .
b. Let 3( )h t denote the height of the protein bar if it is thrown from a cliff that is 88 feet
lower. Write the formula for the function 3h .

Georgia Department of Education Georgia Standards of Excellence Framework
GSE Algebra I Unit 3
Mathematics GSE Algebra I Unit 3: Modeling and Analyzing Quadratic Functions
Richard Woods, State School Superintendent
July 2015 Page 47 of 68
All Rights Reserved
c. Use technology to graph all three functions, h1, h2, and h3, on the same axes.
d. Estimate the coordinates of the vertex for each graph.
e. What number do the coordinates have in common? What is the meaning of this number
in relation to the toss of the protein bar?
f. The other coordinate is different for each vertex. Explain the meaning of this number for
each of the vertices.

Georgia Department of Education Georgia Standards of Excellence Framework
GSE Algebra I Unit 3
Mathematics GSE Algebra I Unit 3: Modeling and Analyzing Quadratic Functions
Richard Woods, State School Superintendent
July 2015 Page 48 of 68
All Rights Reserved
4. Consider the formulas for h1, h2, and h3.
a. How are the formulas different?
b. Based on your answer to part a, how are the three graphs related? Do you see this
relationship in your graphs of the three functions on the same axes?
Estimating the vertex from the graph gives us an approximate answer to our original question,
but an algebraic method for finding the vertex would give us an exact answer.
5. For each of the quadratic functions below, find the y–intercept of the graph and all other
points with this value for the y–coordinate.
a. f(x) = x2 – 4x + 9 b. f(x) = 4x2 + 8x – 5
c. f(x) = –x2 – 6x + 7 d. f(x) = ax2 + bx + c, a ≠ 0
6. One of the characteristics of a parabola graph is that the graph has a line of symmetry.
a. For each of the parabolas considered in item 5, use what you know about the graphs of
quadratic functions in general with the specific information you have about these
particular functions to find an equation for the line of symmetry.
b. The line of symmetry for a parabola is called the axis of symmetry. Explain the
relationship between the axis of symmetry and the vertex of a parabola.
c. Find the y–coordinate of the vertex for the quadratic functions in item 5, parts a, b, and c,
and then state the vertex as a point.
d. Describe a method for finding the vertex of the graph of any quadratic function given in
the form 2 , 0f x ax bx c a .

Georgia Department of Education Georgia Standards of Excellence Framework
GSE Algebra I Unit 3
Mathematics GSE Algebra I Unit 3: Modeling and Analyzing Quadratic Functions
Richard Woods, State School Superintendent
July 2015 Page 49 of 68
All Rights Reserved
7. Return to height functions h1(t)= –16t2 + 24t + 160, h2(t) = –16t2 + 24t + 216, and
h3(t) = –16t2 + 24t + 72.
a. Use the method you described in item 6, part d, to find the exact coordinates of the vertex
of each
b. Find the exact answer to the question: How high above its starting point did the protein
bar go before it started falling back down?
8. Each part below gives a list of functions. Describe the geometric transformation of the graph
of first function that results in the graph of the second, and then describe the transformation
of the graph of the second that gives the graph of the third, and, where applicable, describe
the transformation of the graph of the third that yields the graph of the last function in the
list.
a. 𝑓(𝑥) = 𝑥2, 𝑓(𝑥) = 𝑥2 + 5, 𝑓(𝑥) = (𝑥 − 2𝑥)2 + 5
b. 𝑓(𝑥) = 𝑥2, 𝑓(𝑥) = 4𝑥2, 𝑓(𝑥) = 4𝑥2 − 9, 𝑓(𝑥) = 4(𝑥 + 1𝑥)2 − 9
c. 𝑓(𝑥) = 𝑥2, 𝑓(𝑥) = −𝑥2, 𝑓(𝑥) = −𝑥2 + 16, 𝑓(𝑥) = −(𝑥 + 3)2 + 16
9. Expand each of the following formulas from the vertex form 2
f x a x h k to the
standard form 𝑓(𝑥) = 𝑎𝑥2 + 𝑏𝑥 + 𝑐.
a. f(x) = 4(x + 1)2 – 9 b. f(x) = –(x + 3)2 + 16
c. Compare these expanded formulas to #5. How are they related?
d. Compare the vertices in the original and expanded form. What special property do you
notice?

Georgia Department of Education Georgia Standards of Excellence Framework
GSE Algebra I Unit 3
Mathematics GSE Algebra I Unit 3: Modeling and Analyzing Quadratic Functions
Richard Woods, State School Superintendent
July 2015 Page 50 of 68
All Rights Reserved
10. For any quadratic function of the form 2
f x a x h k :
a. What do the h and k in the formula represent relative to the function?
b. Is there an alternative way to find (h, k) without finding two symmetrical points, finding
the midpoint, and then finding the corresponding y value to the midpoint?
11. Use the vertex form of the equations for the functions h1, h2, and h3 you found in #7 to
verify algebraically the equivalence with the original formulas for the functions.
12. For the functions given below, put the formula in the vertex form f(x) = a(x – h)2 + k, give the
equation of the axis of symmetry, and describe how to transform the graph of y = x2 to create
the graph of the given function.
a. 𝑓(𝑥) = 3𝑥2 + 12𝑥 + 13 b. 𝑓(𝑥) = 𝑥2 − 7𝑥 + 10
c. 𝑓(𝑥) = −2𝑥2 + 12𝑥 − 24
13. Make a hand–drawn sketch of the graphs of the functions in item 12. Make a dashed line for
the axis of symmetry, and plot the vertex, y–intercept and the point symmetric with the
y–intercept.
a. b.

Georgia Department of Education Georgia Standards of Excellence Framework
GSE Algebra I Unit 3
Mathematics GSE Algebra I Unit 3: Modeling and Analyzing Quadratic Functions
Richard Woods, State School Superintendent
July 2015 Page 51 of 68
All Rights Reserved
c.
14. Extension. Which of the graphs that you drew in item 13 have x–intercepts?
a. Find the x–intercepts that do exist by solving an appropriate equation and then add the
corresponding points to your sketch(es) from item 13.
b. Explain geometrically why some of the graphs have x–intercepts and some do not.
c. Explain how to use the vertex form of a quadratic function to decide whether the graph of
the function will or will not have x–intercepts. Explain your reasoning.

Georgia Department of Education Georgia Standards of Excellence Framework
GSE Algebra I Unit 3
Mathematics GSE Algebra I Unit 3: Modeling and Analyzing Quadratic Functions
Richard Woods, State School Superintendent
July 2015 Page 52 of 68
All Rights Reserved
Just The Right Border (Learning Task)
Name_________________________________ Date____________
Mathematical Goals
Competing the square
Using quadratic formula to solve quadratic equations
Use quadratic equations to solve problems
Explore quadratic equations leading to irrational solutions.
Essential Questions
How do I use quadratic formula to solve quadratic equations?
How do I use quadratic equations to solve problems?
When is quadratic formula useful?
GEORGIA STANDARDS OF EXCELLENCE
MGSE9-12.A.SSE.3 Choose and produce an equivalent form of an expression to reveal and
explain properties of the quantity represented by the expression.
MGSE9-12.A.SSE.3b Complete the square in a quadratic expression to reveal the maximum
and minimum value of the function defined by the expression.
MGSE9–12.A.CED.1 Create equations and inequalities in one variable and use them to solve
problems. Include equations arising from linear, quadratic, simple rational, and exponential
functions (integer inputs only).
MGSE9-12.A.REI.4a Use the method of completing the square to transform any quadratic
equation in x into an equation of the form (x – p)2 = q that has the same solutions. Derive the
quadratic formula from ax2 + bx + c = 0.
MGSE9-12.A.REI.4b Solve quadratic equations by inspection (e.g., for x2 = 49), taking
square roots, factoring, completing the square, and the quadratic formula, as appropriate
to the initial form of the equation (limit to real number solutions).
MGSE9-12.F.IF.4 Using tables, graphs, and verbal descriptions, interpret the key
characteristics of a function which models the relationship between two quantities. Sketch a
graph showing key features including: intercepts; interval where the function is increasing,
decreasing, positive, or negative; relative maximums and minimums; symmetries; end
behavior; and periodicity.
MGSE9-12.F.IF.8 Write a function defined by an expression in different but equivalent forms to
reveal and explain different properties of the function.

Georgia Department of Education Georgia Standards of Excellence Framework
GSE Algebra I Unit 3
Mathematics GSE Algebra I Unit 3: Modeling and Analyzing Quadratic Functions
Richard Woods, State School Superintendent
July 2015 Page 53 of 68
All Rights Reserved
STANDARDS FOR MATHEMATICAL PRACTICE
1. Make sense of problems and persevere in solving them by requiring students to
interpret and make meaning of a problem and find a logical starting point, and to monitor
their progress and change their approach to solving the problem, if necessary.
2. Reason abstractly and quantitatively by requiring students to make sense of quantities
and their relationships to one another in problem situations.
4. Model with mathematics by expecting students to apply the mathematics concepts they
know in order to solve problems arising in everyday situations, and reflect on whether the
results are sensible for the given scenario.
5. Use appropriate tools strategically by expecting students to consider available tools
when solving a mathematical problem. These tools might include pencil and paper,
concrete models, a ruler, a protractor, a compass, a calculator, software, etc.
7. Look for and make use of structure by expecting students to apply rules, look for
patterns and analyze structure.
8. Look for and express regularity in repeated reasoning by expecting students to
understand broader applications and look for structure and general methods in similar
situations.

Georgia Department of Education Georgia Standards of Excellence Framework
GSE Algebra I Unit 3
Mathematics GSE Algebra I Unit 3: Modeling and Analyzing Quadratic Functions
Richard Woods, State School Superintendent
July 2015 Page 54 of 68
All Rights Reserved
Just The Right Border (Learning Task)
Name_________________________________ Date____________
1. Hannah is an aspiring artist who
enjoys taking nature photographs
with her digital camera. Her
mother, Cheryl, frequently attends
estate sales in search of unique
decorative items. Last month
Cheryl purchased an antique
picture frame that she thinks
would be perfect for framing one
of Hannah’s recent photographs.
The frame is rather large, so the
photo needs to be enlarged.
Cheryl wants to mat the picture.
One of Hannah’s art books
suggest that mats should be
designed so that the picture takes up 50% of the area inside the frame and the mat covers the
other 50%. The inside of the picture frame is 20 inches by 32 inches. Cheryl wants Hannah
to enlarge, and crop if necessary, her photograph so that it can be matted with a mat of
uniform width and, as recommended, take up 50% of the area inside the mat. See the image
at the right.
a. Let x denote the width of the mat for the picture. Model this situation with a diagram. Write
an equation in x that models this situation.
b. Put the equation from part a in the standard form ax2 + bx + c = 0. Can this equation be
solved by factoring (using integers)?
c. The quadratic formula can be used to solve quadratic equations that cannot be solved by
factoring over the integers. Using the simplest equivalent equation in standard form, identify
a, b, and c from the equation in part b and find b2 – 4ac; then substitute these values in the
quadratic formula a
acbbx
2
42 , to find the solutions for x. Give exact answers for x
and approximate the solutions to two decimal places.
d. To the nearest tenth of an inch, what should be the width of the mat and the dimensions for
the photo enlargement?
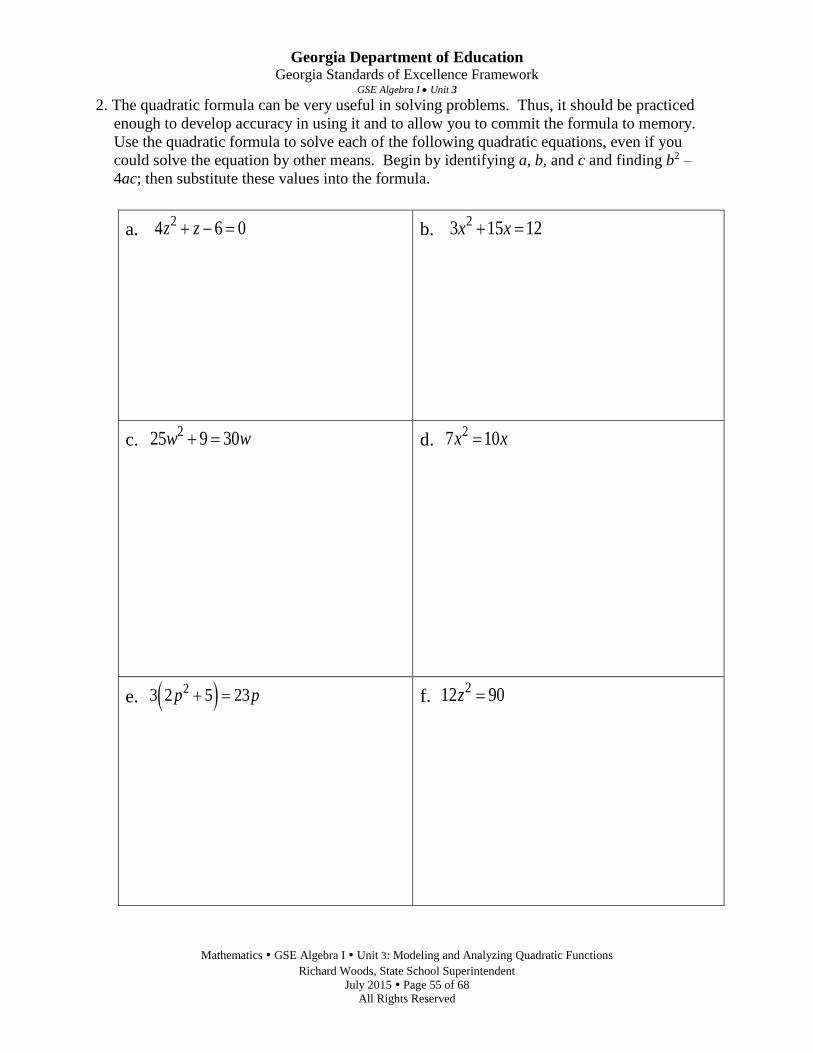
Georgia Department of Education Georgia Standards of Excellence Framework
GSE Algebra I Unit 3
Mathematics GSE Algebra I Unit 3: Modeling and Analyzing Quadratic Functions
Richard Woods, State School Superintendent
July 2015 Page 55 of 68
All Rights Reserved
2. The quadratic formula can be very useful in solving problems. Thus, it should be practiced
enough to develop accuracy in using it and to allow you to commit the formula to memory.
Use the quadratic formula to solve each of the following quadratic equations, even if you
could solve the equation by other means. Begin by identifying a, b, and c and finding b2 –
4ac; then substitute these values into the formula.
a. 24 6 0z z
b. 23 15 12x x
c. 225 9 30w w
d. 27 10x x
e. 23 2 5 23p p
f. 212 90z

Georgia Department of Education Georgia Standards of Excellence Framework
GSE Algebra I Unit 3
Mathematics GSE Algebra I Unit 3: Modeling and Analyzing Quadratic Functions
Richard Woods, State School Superintendent
July 2015 Page 56 of 68
All Rights Reserved
3. The expression b2 – 4ac in the quadratic formula is called the discriminant of the quadratic
equation in standard form. All of the equations in item 2 had values of a, b, and c that are
rational numbers. Answer the following questions for quadratic equations in standard form
when a, b, and c are rational numbers. Make sure that your answers are consistent with the
solutions from item 2.
a. What kind of number is the discriminant when there are two real number solutions to a
quadratic equation?
b. What kind of number is the discriminant when the two real number solutions to a
quadratic equation are rational numbers?
c. What kind of number is the discriminant when the two real number solutions to a
quadratic equation are irrational numbers?
d. Could a quadratic equation with rational coefficients have one rational solution and one
irrational solution? Explain your reasoning.
e. What kind of number is the discriminant when there is only one real number solution?
What kind of number do you get for the solution?
4. There are many ways to show why the quadratic formula always gives the solution(s) to any
quadratic equation with real number coefficients. You can work through one of these by
responding to the parts below. Start by assuming that each of a, b, and c is a real number, that
0a , and then consider the quadratic equation ax2 + bx + c = 0.
a. Why do we assume that a ≠ 0?
b. Form the corresponding quadratic function, 2f x ax bx c , and put the formula for
f(x) in vertex form, expressing k in the vertex form as a single rational expression.
c. Use the vertex form to solve for x–intercepts of the graph and simplify the solution. Hint:
Consider two cases, a > 0 and a < 0, in simplifying 2a .
5. Use the quadratic formula to solve the following equations with real number coefficients.
Approximate each real, but irrational, solution correct to hundredths.
a. 𝑥2 + √5𝑥 + 1 = 0 b. 3𝑡2 + 11 = 2√33𝑡
c. 9𝑤2 = √13𝑤

Georgia Department of Education Georgia Standards of Excellence Framework
GSE Algebra I Unit 3
Mathematics GSE Algebra I Unit 3: Modeling and Analyzing Quadratic Functions
Richard Woods, State School Superintendent
July 2015 Page 57 of 68
All Rights Reserved
6. Verify each answer for item 5 by using a graphing utility to find the x–intercept(s) of an
appropriate quadratic function.
a. Put the function for item 5, part b, in vertex form. Use the vertex form to find the
x–intercept.
b. Solve the equation from item 5, part c, by factoring.
7. Answer the following questions for quadratic equations in standard from where a, b, and c
are real numbers.
a. What kind of number is the discriminant when there are two real number solutions to a
quadratic equation?
b. Could a quadratic equation with real coefficients have one rational solution and one
irrational solution? Explain your reasoning.
c. What kind of number is the discriminant when there is only one real number solution?
d. Summarize what you know about the relationship between the discriminant and the
solutions of a quadratic of the form ax2 + bx + c = 0 where a, b, and c are real numbers
with 0a into a formal statement.
8. A landscape designer included a cloister (a rectangular garden surrounded by a covered
walkway on all four sides) in his plans for a new public park. The garden is to be 35 feet by
23 feet and the total area enclosed by the garden and walkway together is 1200 square feet.
To the nearest inch, how wide does the walkway need to be?
9. In another area of the park, there will be an open rectangular area of grass surrounded by a
flagstone path. If a person cuts across the grass to get from the southeast corner of the area to
the northwest corner, the person will walk a distance of 15 yards. If the length of the area is
5 yards more than the width, to the nearest foot, how much distance is saved by cutting
across rather than walking along the flagstone path?

Georgia Department of Education Georgia Standards of Excellence Framework
GSE Algebra I Unit 3
Mathematics GSE Algebra I Unit 3: Modeling and Analyzing Quadratic Functions
Richard Woods, State School Superintendent
July 2015 Page 58 of 68
All Rights Reserved
Characteristics of Quadratic Functions (Performance Task)
Name____________________________ Date___________
Mathematical Goals
Assess understanding the key features of quadratic functions represented in multiple
ways.
Essential Questions
How well do I understand key characteristics of quadratic functions?
GEORGIA STANDARDS OF EXCELLENCE
MGSE9-12.F.IF.4 Using tables, graphs, and verbal descriptions, interpret the key
characteristics of a function which models the relationship between two quantities. Sketch a
graph showing key features including: intercepts; interval where the function is increasing,
decreasing, positive, or negative; relative maximums and minimums; symmetries; end
behavior; and periodicity.
MGSE9-12.F.IF.5 Relate the domain of a function to its graph and, where applicable, to the
quantitative relationship it describes. For example, if the function h(n) gives the number of person-
hours it takes to assemble n engines in a factory, then the positive integers would be an appropriate
domain for the function.
MGSE9-12.F.IF.7a Graph linear and quadratic functions and show intercepts, maxima, and
minima (as determined by the function or by context).
STANDARDS FOR MATHEMATICAL PRACTICE
2. Reason abstractly and quantitatively by requiring students to make sense of quantities
and their relationships to one another in problem situations.
4. Model with mathematics by expecting students to apply the mathematics concepts they
know in order to solve problems arising in everyday situations, and reflect on whether the
results are sensible for the given scenario.
5. Use appropriate tools strategically by expecting students to consider available tools
when solving a mathematical problem. These tools might include pencil and paper,
concrete models, a ruler, a protractor, a compass, a calculator, software, etc.
6. Attend to precision by requiring students to calculate efficiently and accurately; and to
communicate precisely with others by using clear mathematical language to discuss their
reasoning.
7. Look for and make use of structure by expecting students to apply rules, look for
patterns and analyze structure.
8. Look for and express regularity in repeated reasoning by expecting students to
understand broader applications and look for structure and general methods in similar
situations.

Georgia Department of Education Georgia Standards of Excellence Framework
GSE Algebra I Unit 3
Mathematics GSE Algebra I Unit 3: Modeling and Analyzing Quadratic Functions
Richard Woods, State School Superintendent
July 2015 Page 59 of 68
All Rights Reserved
Characteristics of Quadratic Functions (Performance Task)
Name____________________________ Date___________
Complete a table, graph, and investigate the following functions.
a) 𝑦 = 𝑥2 + 16𝑥 + 28 b) 𝑦 = 𝑥2 − 11𝑥 + 10
State the following…
Domain: Domain:
Range: Range:
Zeros: Zeros:
Y–Intercept: Y–Intercept:
Interval of Increase: Interval of Increase:
Interval of Decrease: Interval of Decrease:
Maximum: Maximum:
Minimum: Minimum:
End Behavior: End Behavior:
Even/Odd/Neither: Even/Odd/Neither:
y x
y
x

Georgia Department of Education Georgia Standards of Excellence Framework
GSE Algebra I Unit 3
Mathematics GSE Algebra I Unit 3: Modeling and Analyzing Quadratic Functions
Richard Woods, State School Superintendent
July 2015 Page 60 of 68
All Rights Reserved
Complete a table, graph, and investigate the following functions.
c) 𝑦 = 𝑥2 − 5𝑥 + 6 d) 𝑦 = 5𝑥2 − 10𝑥 + 20
State the following…
Domain: Domain:
Range: Range:
Zeros: Zeros:
Y–Intercept: Y–Intercept:
Interval of Increase: Interval of Increase:
Interval of Decrease: Interval of Decrease:
Maximum: Maximum:
Minimum: Minimum:
End Behavior: End Behavior:
Even/Odd/Neither: Even/Odd/Neither:
y
x
y
x

Georgia Department of Education Georgia Standards of Excellence Framework
GSE Algebra I Unit 3
Mathematics GSE Algebra I Unit 3: Modeling and Analyzing Quadratic Functions
Richard Woods, State School Superintendent
July 2015 Page 61 of 68
All Rights Reserved
Acme Fireworks (Culminating Task)
Name_______________________________ Date_______________
Mathematical Goals
To assess students’ ability to choose methods of solving quadratic equations
To assess students’ ability to interpret functions in context
Essential Questions
How do I solve real-life problems using quadratic equations?
How do I interpret domain in context?
How do I choose a method of solving quadratic equations?
How do I interpret functions in context?
GEORGIA STANDARDS OF EXCELLENCE
MGSE9‐12.A.REI.4 Solve quadratic equations in one variable.
MGSE9–12.A.REI.4a Use the method of completing the square to transform any quadratic
equation in x into an equation of the form (x – p)2 = q that has the same solutions. Derive the
quadratic formula from ax2 + bx + c = 0.
MGSE9–12.A.REI.4b Solve quadratic equations by inspection (e.g., for x2 = 49), taking
square roots, factoring, completing the square, and the quadratic formula, as appropriate
to the initial form of the equation (limit to real number solutions).
MGSE9-12.F.IF.2 Use function notation, evaluate functions for inputs in their domains, and
interpret statements that use function notation in terms of a context.
MGSE9-12.F.IF.5 Relate the domain of a function to its graph and, where applicable, to the
quantitative relationship it describes. For example, if the function h(n) gives the number of person-
hours it takes to assemble n engines in a factory, then the positive integers would be an appropriate
domain for the function.
MGSE9-12.F.BF.1 Write a function that describes a relationship between two quantities.
STANDARDS FOR MATHEMATICAL PRACTICE
1. Make sense of problems and persevere in solving them by requiring students to
interpret and make meaning of a problem and find a logical starting point, and to monitor
their progress and change their approach to solving the problem, if necessary.
2. Reason abstractly and quantitatively by requiring students to make sense of quantities
and their relationships to one another in problem situations.

Georgia Department of Education Georgia Standards of Excellence Framework
GSE Algebra I Unit 3
Mathematics GSE Algebra I Unit 3: Modeling and Analyzing Quadratic Functions
Richard Woods, State School Superintendent
July 2015 Page 62 of 68
All Rights Reserved
3. Construct viable arguments and critique the reasoning of others by engaging
students on discussion of why they agree or disagree with responses, decide whether they
make sense, and ask useful questions to clarify or improve the arguments.
4. Model with mathematics by expecting students to apply the mathematics concepts they
know in order to solve problems arising in everyday situations, and reflect on whether the
results are sensible for the given scenario.
5. Use appropriate tools strategically by expecting students to consider available tools
when solving a mathematical problem. These tools might include pencil and paper,
concrete models, a ruler, a protractor, a compass, a calculator, software, etc.
6. Attend to precision by requiring students to calculate efficiently and accurately; and to
communicate precisely with others by using clear mathematical language to discuss their
reasoning.
7. Look for and make use of structure by expecting students to apply rules, look for
patterns and analyze structure.
8. Look for and express regularity in repeated reasoning by expecting students to
understand broader applications and look for structure and general methods

Georgia Department of Education Georgia Standards of Excellence Framework
GSE Algebra I Unit 3
Mathematics GSE Algebra I Unit 3: Modeling and Analyzing Quadratic Functions
Richard Woods, State School Superintendent
July 2015 Page 63 of 68
All Rights Reserved
Acme Fireworks (Culminating Task)
Name_______________________________ Date_______________
The Acme Fireworks Company has been engaged to provide the fireworks for the annual 4th of
July fireworks show for the town of Madison, GA. The City Manager of Madison selected
Acme Fireworks because they have four different kinds of fireworks. Each firework is designed
to explode when the rocket reaches its highest point in the air. Once the rocket explodes, the
sparkles of different colors fly out of the rocket and stay in the air for the same number of
seconds as it took for the rocket to reach the highest point. All fireworks are launched from the
ground. The time from x = 0 to the first x–intercept is the time it takes the wick to burn until the
rocket is launched. The City Manager has visited your classroom to ask your class to confirm
the figures that Acme Fireworks Company has given him. Specifically, he wants to know the
height at which the rockets will explode and how long the sparkles for each type of firework will
be in the air. Your teacher is interested in the method that you choose to solve each equation.
Below, you are given the equation for the flight of each firework. For each brand, tell the height
of the rocket when it explodes, how many seconds it took to reach this height, and how long the
sparkles will remain in the air. Lastly, explain why you chose the method you did to solve the
given equation. In each equation, x stands for the number of seconds the rocket is in the air, and
f(x) models the flight of the rocket in feet.
1. Blue Bombers: f(x) = 81 – x2
i. How high is the rocket when it explodes?
ii. How many seconds was the rocket in the air before it exploded?
iii. How many seconds did the sparkles stay in the air?
iv. What method did you use to solve the given equation?
2. Red Rockets: g(x) = –2x2 + 29x – 90
i. How high is the rocket when it explodes?
ii. How many seconds was the rocket in the air before it exploded?
iii. How many seconds did the sparkles stay in the air?
iv. What method did you use to solve the given equation?

Georgia Department of Education Georgia Standards of Excellence Framework
GSE Algebra I Unit 3
Mathematics GSE Algebra I Unit 3: Modeling and Analyzing Quadratic Functions
Richard Woods, State School Superintendent
July 2015 Page 64 of 68
All Rights Reserved
3. Green Gammas: –x2 + 12x = 15
i. How high is the rocket when it explodes?
ii. How many seconds was the rocket in the air before it exploded?
iii. How many seconds did the sparkles stay in the air?
iv. What method did you use to solve the given equation?
4. Orange Orthogonals: h(x) = –6x2 +53x – 91
i. How high is the rocket when it explodes?
ii. How many seconds was the rocket in the air before it exploded?
iii. How many seconds did the sparkles stay in the air?
iv. What method did you use to solve the given equation?
5. Now that you are officially an expert at evaluating fireworks, the Acme Fireworks
Company would like for you to write an equation for their new ultimate firework called
the Golden Fractals. The company wants the Golden Fractals to explode 65 feet above
the ground, and they want the sparkles to stay in the air for eight seconds.
Write an equation for the Golden Fractals. Fully explain how you got each number for
the equation.

Georgia Department of Education Georgia Standards of Excellence Framework
GSE Algebra I Unit 3
Mathematics GSE Algebra I Unit 3: Modeling and Analyzing Quadratic Functions
Richard Woods, State School Superintendent
July 2015 Page 65 of 68
All Rights Reserved
Quadratic Fanatic and the Case of the Foolish Function (Culminating Task) Adapted From Jody Haynes, Fayette County School System
Name________________________________________ Date______________
Mathematical Goals
To assess students’ ability to describe quadratic functions transformations
To assess students’ ability to solve quadratic equations by factoring and taking square
roots.
Essential Questions
How do I analyze the effect of the equation parameters on the graph of a quadratic
function?
How do I solve quadratic equations?
GEORGIA STANDARDS OF EXCELLENCE
MGSE9‐12.A.REI.4 Solve quadratic equations in one variable.
MGSE9–12.A.REI.4b Solve quadratic equations by inspection (e.g., for x2 = 49), taking
square roots, factoring, completing the square, and the quadratic formula, as appropriate
to the initial form of the equation (limit to real number solutions).
MGSE9-12.F.IF.4 Using tables, graphs, and verbal descriptions, interpret the key
characteristics of a function which models the relationship between two quantities. Sketch a
graph showing key features including: intercepts; interval where the function is increasing,
decreasing, positive, or negative; relative maximums and minimums; symmetries; end
behavior; and periodicity.
MGSE9-12.F.BF.3 Identify the effect on the graph of replacing f(x) by f(x) + k, k f(x), f(kx), and
f(x + k) for specific values of k (both positive and negative); find the value of k given the graphs.
Experiment with cases and illustrate an explanation of the effects on the graph using technology.
Include recognizing even and odd functions from their graphs and algebraic expressions for them.
STANDARDS FOR MATHEMATICAL PRACTICE
1. Make sense of problems and persevere in solving them by requiring students to
interpret and make meaning of a problem and find a logical starting point, and to monitor
their progress and change their approach to solving the problem, if necessary.
2. Reason abstractly and quantitatively by requiring students to make sense of quantities
and their relationships to one another in problem situations.
3. Construct viable arguments and critique the reasoning of others by engaging
students on discussion of why they agree or disagree with responses, decide whether they
make sense, and ask useful questions to clarify or improve the arguments.
4. Model with mathematics by expecting students to apply the mathematics concepts they
know in order to solve problems arising in everyday situations, and reflect on whether the
results are sensible for the given scenario.
Georgia Department of Education Georgia Standards of Excellence Framework
GSE Algebra I Unit 3
Mathematics GSE Algebra I Unit 3: Modeling and Analyzing Quadratic Functions
Richard Woods, State School Superintendent
July 2015 Page 66 of 68
All Rights Reserved
5. Use appropriate tools strategically by expecting students to consider available tools
when solving a mathematical problem. These tools might include pencil and paper,
concrete models, a ruler, a protractor, a compass, a calculator, software, etc.
6. Attend to precision by requiring students to calculate efficiently and accurately; and to
communicate precisely with others by using clear mathematical language to discuss their
reasoning.
7. Look for and make use of structure by expecting students to apply rules, look for
patterns and analyze structure.
8. Look for and express regularity in repeated reasoning by expecting students to
understand broader applications and look for structure and general methods

Georgia Department of Education Georgia Standards of Excellence Framework
GSE Algebra I Unit 3
Mathematics GSE Algebra I Unit 3: Modeling and Analyzing Quadratic Functions
Richard Woods, State School Superintendent
July 2015 Page 67 of 68
All Rights Reserved
Quadratic Fanatic and the Case of the Foolish Function (Culminating Task) Adapted From Jody Haynes, Fayette County School System
Name________________________________________ Date______________
“Quadratic Fanatic, we need your help!” declared the voice on the answering machine. While
out helping solve the town’s problems, a crime had occurred at the Function Factory, and now it
was up to the Quadratic Fanatic to straighten things out.
When he arrived at the factory, Quadratic Fanatic was given three different groups of suspects,
each group representing a different shift. He was told that an employee from each shift had
worked together to commit the crime.
The employees from the first shift were all quadratic functions in vertex form. “They are always
acting kind of shifty,” said the manager. The list of suspects from the first shift is below. For
each suspect, list the transformational characteristics of the function.
Function Vertical Shift Horizontal
Shift
Vertical
Stretch/Shrink
Reflected?
A. 𝑓(𝑥) = −1
2(𝑥 − 3)2 − 4
B. 𝑓(𝑥) = 2(𝑥 − 4)2 + 3
C. 𝑓(𝑥) = 2(𝑥 + 4)2 − 3
D. 𝑓(𝑥) = −1
2(𝑥 − 4)2 + 3
E. 𝑓(𝑥) = −2(𝑥 + 4)2 + 3
F. 𝑓(𝑥) = −4(𝑥 − 3)2 − 2
G. 𝑓(𝑥) = 3(𝑥 + 4)2 − 2
According to a several witnesses, the following information about the suspect was gathered:
“He was shifted up three.” Which of the employees above could be suspects?
“His axis of symmetry was x = –4.” Which of the employees above could be suspects?
“He had a vertical stretch of 2.” Which of the employees above could be suspects?
“I could see his reflection.” Which of the employees above could be suspects?
Based on the above information, which employee is guilty? Explain how you know.

Georgia Department of Education Georgia Standards of Excellence Framework
GSE Algebra I Unit 3
Mathematics GSE Algebra I Unit 3: Modeling and Analyzing Quadratic Functions
Richard Woods, State School Superintendent
July 2015 Page 68 of 68
All Rights Reserved
The employees from the second shift were all quadratic functions in standard form. “They
always follow standard procedure,” said the manager. The list of suspects from the second shift
is below. For each suspect, factor and find its solutions.
Function Factors First
Solution
Second
Solution
H. 𝑔(𝑥) = 3𝑥2 − 10𝑥 + 3
I. 𝑔(𝑥) = 3𝑥2 − 21𝑥 + 30
J. 𝑔(𝑥) = 2𝑥2 − 2𝑥 − 4
K. 𝑔(𝑥) = 𝑥2 − 𝑥 − 12
L. 𝑔(𝑥) = 𝑥2 + 3𝑥 − 18
M. 𝑔(𝑥) = 𝑥2 − 12𝑥 + 35
N. 𝑔(𝑥) = 5(𝑥 − 4)2 − 125
Hint: Solve by Square Root Method!
According to a several witnesses, the following information about the suspect was gathered:
“Both solutions were integers.” Which of the employees above could be suspects?
“One of the solutions was negative.” Which of the employees above could be suspects?
“One of the solutions was two.” Which of the employees above could be suspects?
“One of the solutions was negative one.” Which of the employees above could be suspects?
Based on the above information, which employee is guilty? Explain how you know.