georgia trs: pension plan solvency analysis · 15-yeart rendt : rs pension contribution growth...
TRANSCRIPT

GEORGIA TRS: PENSION PLANSOLVENCY ANALYSISPrepared by: Pension Integrity Project at Reason Foundation September 7, 2018

A History of Volatile Solvency (1998-2017)
September 7, 2018Georgia TRS Solvency Analysis 1
Source: Pension Integrity Project analysis of Georgia TRS actuarial valuation reports and CAFRs. Dashed blue line indicates funded ratio based on market values as reported under GASB 67/68
-10%
5%
20%
35%
50%
65%
80%
95%
110%
125%
140%
-$3
$0
$3
$6
$9
$12
$15
$18
$21
$24
$27
1998 2000 2002 2004 2006 2008 2010 2012 2014 2016
Fund
edRatio
Unfund
edLiab
ility,Actua
rialValue
(in$B
illion
s)
-10%
5%
20%
35%
50%
65%
80%
95%
110%
125%
140%
-$3
$0
$3
$6
$9
$12
$15
$18
$21
$24
$27
1998 2000 2002 2004 2006 2008 2010 2012 2014 2016
Fund
edRatio
Unfund
edLiab
ility,Actua
rialValue
(in$B
illion
s)
-10%
5%
20%
35%
50%
65%
80%
95%
110%
125%
140%
-$3
$0
$3
$6
$9
$12
$15
$18
$21
$24
$27
1998 2000 2002 2004 2006 2008 2010 2012 2014 2016
Fund
edRatio
Unfund
edLiab
ility,Actua
rialValue
(in$B
illion
s)
-10%
5%
20%
35%
50%
65%
80%
95%
110%
125%
140%
-$3
$0
$3
$6
$9
$12
$15
$18
$21
$24
$27
1998 2000 2002 2004 2006 2008 2010 2012 2014 2016
Fund
edRatio
Unfund
edLiab
ility,Actua
rialValue
(in$B
illion
s)
-10%
5%
20%
35%
50%
65%
80%
95%
110%
125%
140%
-$3
$0
$3
$6
$9
$12
$15
$18
$21
$24
$27
1998 2000 2002 2004 2006 2008 2010 2012 2014 2016
Fund
edRatio
Unfund
edLiab
ility,Actua
rialValue
(in$B
illion
s)
-10%
5%
20%
35%
50%
65%
80%
95%
110%
125%
140%
-$3
$0
$3
$6
$9
$12
$15
$18
$21
$24
$27
1998 2000 2002 2004 2006 2008 2010 2012 2014 2016
Fund
edRatio
Unfund
edLiab
ility,Actua
rialValue
(in$B
illion
s)

15-Year Trend: TRS Pension Contribution Growth Outpacing State Economic Growth
September 7, 2018Georgia TRS Solvency Analysis 2
Source: Pension Integrity Project analysis of Georgia TRS actuarial valuation reports, as well as data from the Federal Reserve Bank of St. Louis and BLS.GASB recently redefined Actuarially Required Contribution (ARC) as the Actuarially Determined Employer Contribution (ADEC).
-40%
-20%
0%
20%
40%
60%
80%
100%
120%
140%
2002 2004 2006 2008 2010 2012 2014 2016
CumulativePercen
tageIncreaseFrom
2002
GeorgiaTRSContribution RateGrowth:ARC/ADECGeorgiaEconomicGrowth:GDP

The Causes of the Pension Debt Actuarial Experience of Georgia TRS 1998-2017
September 7, 2018
Source: Pension Integrity Project analysis of Georgia TRS CAFRs. Data represents cumulative unfunded liability by gain/loss category.
Georgia TRS Solvency Analysis 3
-$4-$2$0$2$4$6$8$10$12$14$16$18$20$22$24
Und
erpe
rfor
min
gIn
vest
men
ts &
Inte
rest
Rat
eSm
ooth
ing
Dem
ogra
phic
Assu
mpt
ions
Neg
ativ
eAm
ortiz
atio
n
Asse
tEx
perie
nce
&Ch
ange
d M
etho
ds &
Assu
mpt
ions
Legi
slati
veCh
ange
s/O
ther
Sala
ries
Gro
win
gSl
ower
than
Expe
cted
Net
Cha
nge
toU
nfun
ded
Liab
ility
Chan
ge in
Unf
unde
d Li
abili
ty (i
n $B
illio
ns)
4 September 7, 2018
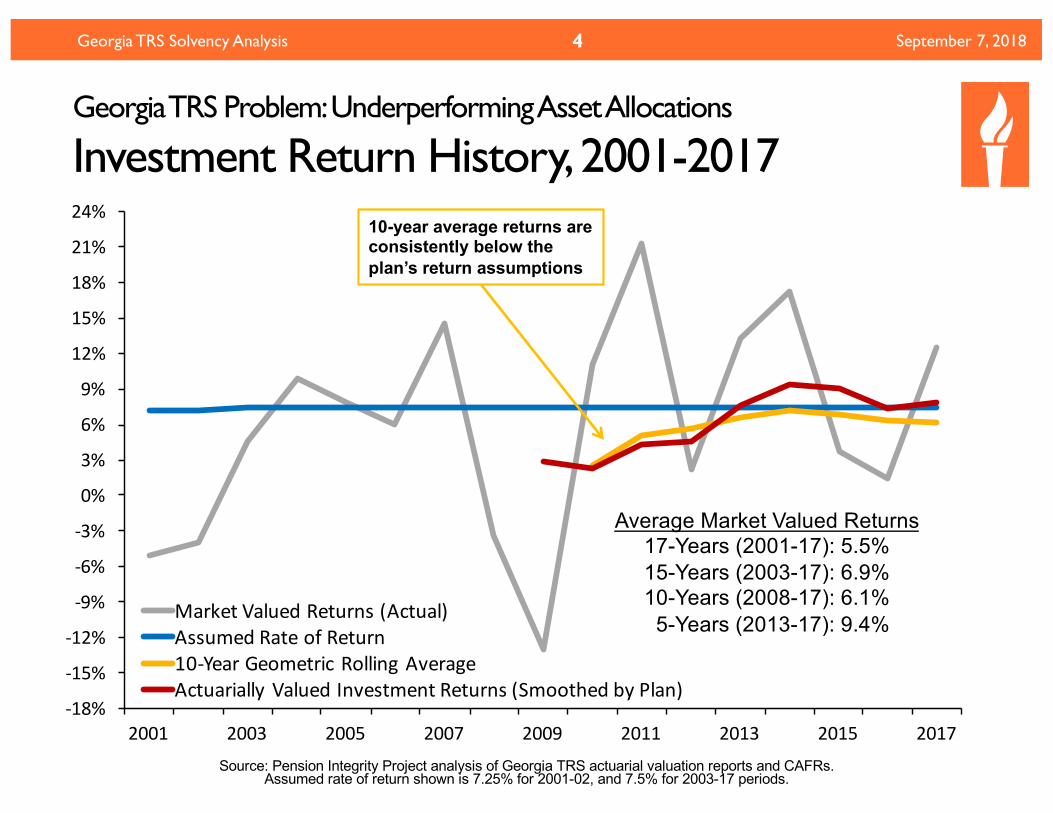
Georgia TRS Problem: Underperforming AssetAllocations
Investment Return History,2001-2017
Georgia TRS Solvency Analysis
-18%
-15%
-12%
-9%
-6%
-3%
0%
3%
6%
9%
12%
15%
18%
21%
24%
2001 2003 2005 2007 2009 2011 2013 2015 2017
MarketValuedReturns(Actual)AssumedRateofReturn10-YearGeometricRollingAverageActuariallyValuedInvestmentReturns(SmoothedbyPlan)
-18%
-15%
-12%
-9%
-6%
-3%
0%
3%
6%
9%
12%
15%
18%
21%
24%
2001 2003 2005 2007 2009 2011 2013 2015 2017
MarketValuedReturns(Actual)AssumedRateofReturn10-YearGeometricRollingAverageActuariallyValuedInvestmentReturns(SmoothedbyPlan)
-18%
-15%
-12%
-9%
-6%
-3%
0%
3%
6%
9%
12%
15%
18%
21%
24%
2001 2003 2005 2007 2009 2011 2013 2015 2017
MarketValuedReturns(Actual)AssumedRateofReturn10-YearGeometricRollingAverageActuariallyValuedInvestmentReturns(SmoothedbyPlan)
-18%
-15%
-12%
-9%
-6%
-3%
0%
3%
6%
9%
12%
15%
18%
21%
24%
2001 2003 2005 2007 2009 2011 2013 2015 2017
MarketValuedReturns(Actual)AssumedRateofReturn10-YearGeometricRollingAverageActuariallyValuedInvestmentReturns(SmoothedbyPlan)
10-year average returns areconsistently below theplan’s return assumptions
Average Market Valued Returns 17-Years (2001-17): 5.5%15-Years (2003-17): 6.9%10-Years (2008-17): 6.1%
5-Years (2013-17): 9.4%
Source: Pension Integrity Project analysis of Georgia TRS actuarial valuation reports and CAFRs. Assumed rate of return shown is 7.25% for 2001-02, and 7.5% for 2003-17 periods.

New Normal: The So-Called Recovery Has Already Happened, the Market Has ChangedThe “new normal” for institutional investing suggests that achieving even a 6% average rate of return is optimistic.
1. Over the past two decades there has been a steady change in the nature of institutional investment returns.• 30-year Treasury yields have fallen from around 8% in the 1990s to consistently
less than 3% today.
• Globally, interest rates are at ultralow historic levels, while market liquidity continues to be restrained by financial regulations.
2. McKinsey & Co. forecast the returns to equities will be 20% to 50% lower over the next two decades compared to the previous three decades. • Using their forecasts, the best case scenario for a 70/30 portfolio of equities and
bonds, similar to Georgia TRS, is likely to earn around 5% return.
3. As Georgia TRS awaits for the “recovery” its unfunded liabilities continue to grow.
September 7, 2018Georgia TRS Solvency Analysis 5

Georgia TRS Asset Allocation (2001-2017)
Expanding Equities in Search for Yield
September 7, 2018Georgia TRS Solvency Analysis 6
Source: Pension Integrity Project analysis of Georgia TRS actuarial valuation reports and CAFRS.
0%
10%
20%
30%
40%
50%
60%
70%
80%
90%
100%
2001 2003 2005 2007 2009 2011 2013 2015 2017
%ofInv
estm
entPortfo
lio
ShortTerm BondsandFixedIncome Equities
USEquities
FixedIncomeLowRisk
and/orHighTransparency
ForeignEquities

Probability Analysis: Measuring the Likelihood of Georgia TRS Achieving Various Rates of Return
September 7, 20187
Source: Pension Integrity Project Monte Carlo model based on Georgia TRS asset allocation and reported expected of returns by asset class. Forecasts of returns by asset class generally from BNYM, JPMC, BlackRock, and Research Affiliates were used and matched to the specific asset class of Georgia TRS
. Probability estimates are approximate as they are based on the aggregated return by asset class. For complete methodology contact Reason Foundation.
Rate of Return
Probability of Georgia TRS Achieving A Given Return Based On:
Georgia TRSExpectations
BNY Mellon10-YearForecast
BlackRockLong-TermForecast
JP Morgan10-15 Year Forecast
Research Affiliates10-Year Forecast
9.0% 39% 8% 10% 7% 3%
8.0% 52% 17% 19% 15% 7%
7.5% 58% 22% 25% 20% 10%
7.0% 64% 28% 31% 27% 14%
6.0% 75% 42% 46% 41% 25%
5.0% 83% 58% 61% 58% 39%
4.0% 90% 74% 75% 73% 54%
Georgia TRS Solvency Analysis

0%
5%
10%
15%
20%
25%
30%
35%
2002
2004
2006
2008
2010
2012
2014
2016
2018
2020
2022
2024
2026
2028
2030
2032
2034
2036
2038
2040
2042
2044
2046
EmployerContributio
n,A
DCBasis(asa
%ofPayroll)
AlternativeScenario:ActualAverageReturnsof5.5%
AlternativeScenario:ActualAverageReturnsof6.5%
WhatTRSAssumesWillHappen:HistoricActualContribution +ForecastedEmployerContribution
What if Georgia TRS Investments Continue Underperforming?
Sensitivity Analysis: Employer Contribution
September 7, 2018Georgia TRS Solvency Analysis 8
0%
5%
10%
15%
20%
25%
30%
35%
2002
2004
2006
2008
2010
2012
2014
2016
2018
2020
2022
2024
2026
2028
2030
2032
2034
2036
2038
2040
2042
2044
2046
EmployerContributio
n,A
DCBasis(asa
%ofPayroll)
AlternativeScenario:ActualAverageReturnsof5.5%
AlternativeScenario:ActualAverageReturnsof6.5%
WhatTRSAssumesWillHappen:HistoricActualContribution +ForecastedEmployerContribution
Source: Pension Integrity Project actuarial forecast of Georgia TRS. Scenario assumes that the state continues to pay 100% of the actuarially determined contribution each year and that Georgia TRS meets its actuarial assumptions, except return assumptions. Employer contributions for 2018-19FY show plan’s
own projections. Years are contribution fiscal years. Figures are rounded and adjusted for inflation.

-20%
-10%
0%
10%
20%
30%
40%
50%
2018
2020
2022
2024
2026
2028
2030
2032
2034
2036
2038
2040
2042
2044
2046
Employ
erCo
ntrib
ution,ADC
Basis(%ofPayroll)
Long-term7.5%Return:MixedTimingofStrongandWeakReturnsLong-term7.5%Return:Even,EqualAnnualReturnsLong-term7.5%Return:StrongEarlyReturnsLong-term7.5%Return:WeakEarlyReturns
What if Georgia TRS Investments Underperform in the Short-term?
Sensitivity Analysis: Employer Contribution
September 7, 2018Georgia TRS Solvency Analysis
Even if a pension plan hits its assumed rate of return on average, the timing of investment returns can have a major
impact on a plan’s actuarially required contributions over the long term.
9
Source: Pension Integrity Project actuarial forecast of Georgia TRS plan. Strong early returns (TWRR = 7.4%, MWRR = 8.5%), Even, equal annual returns (Constant Return = 7.5%), Mixed timing of strong and weak returns (TWRR = 7.5%, MWRR = 7.5%), Weak early returns (TWRR = 7.5%, MWRR = 6.5%)
Scenario assumes that Georgia TRS pays the actuarially required rate each year. Years are plan’s fiscal years.

Negative Amortization: Understanding the Current Funding Policy• Currently, the government employers in Georgia make pension
contributions based on level percent actuarial cost method (ADC). However, contributions made have not always kept up with the interest accruing on the unfunded liabilities.
• Historically, Georgia TRS had been using 30-year schedules to re-amortize its unfunded liabilities, and this frequently led to amortization payments less than accrued interest. In 2013, Georgia TRS adopted a closed schedule for the legacy unfunded liability as of that year — a positive step that will ensure the bulk of existing debt gets wound down. However, Georgia TRS still uses 30-year amortization schedules for new actuarial gains and losses, which can create negative amortization too.
• In 17 of the past 22 years, employer contributions have been less than the interest accrued on the pension debt (i.e. Negative Amortization). Thus, despite receiving 100% ADEC contributions, the plan’s unfunded liability is growing in absolute terms.
• The Society of Actuaries recommends funding periods of 15 to 20 years. Longer periods result in larger long-term costs for the state.
September 7, 2018Georgia TRS Solvency Analysis 10
September 7, 2018
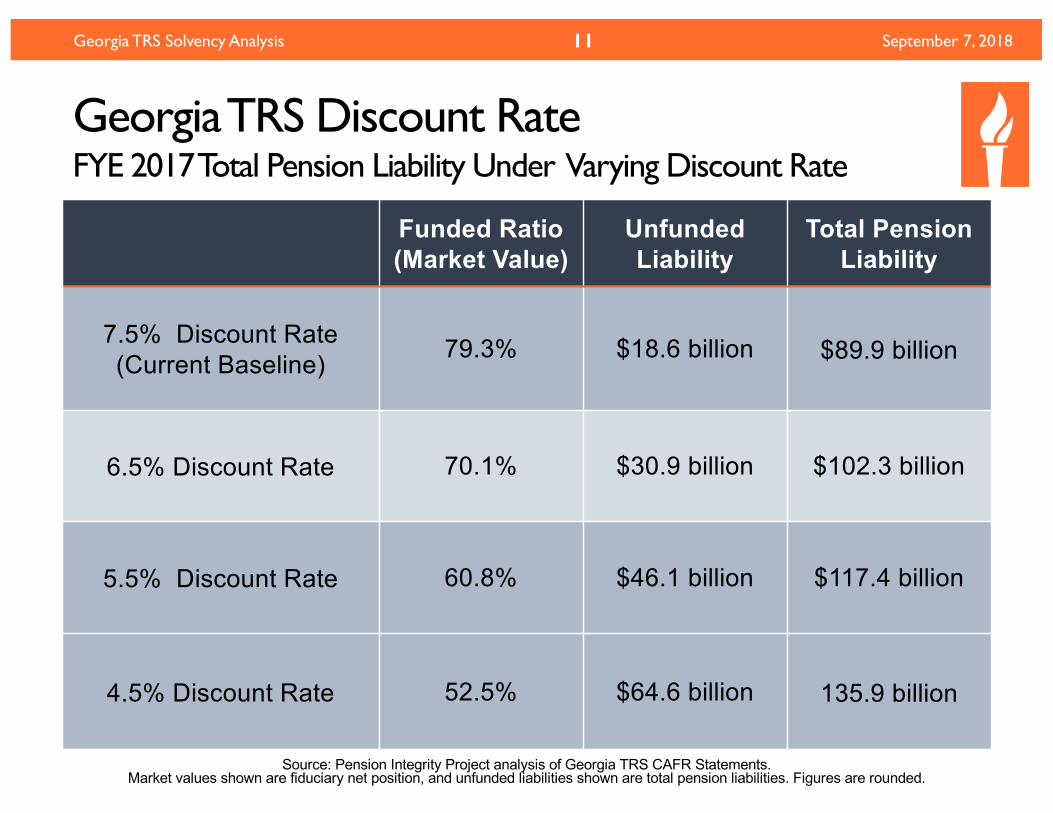
Georgia TRS Discount Rate FYE 2017 Total Pension Liability Under Varying Discount Rate
Georgia TRS Solvency Analysis 11
Funded Ratio(Market Value)
Unfunded Liability
Total PensionLiability
7.5% Discount Rate(Current Baseline) 79.3% $18.6 billion $89.9 billion
6.5% Discount Rate 70.1% $30.9 billion $102.3 billion
5.5% Discount Rate 60.8% $46.1 billion $117.4 billion
4.5% Discount Rate 52.5% $64.6 billion 135.9 billion
Source: Pension Integrity Project analysis of Georgia TRS CAFR Statements. Market values shown are fiduciary net position, and unfunded liabilities shown are total pension liabilities. Figures are rounded.

Probability of Members Remaining in Georgia TRS
September 7, 2018
Source: Bellwether Education Partners benefit modeling and analysis of Georgia TRS Actuarial Valuations
Georgia TRS Solvency Analysis 12
0%
10%
20%
30%
40%
50%
60%
70%
80%
90%
100%
0 2 4 6 8 10 12 14 16 18 20 22 24 26 28 30 32 34 36 38 40 42 44
Percen
tageofM
embe
rsRetained
YearsofService
ProbabilityofParticipantsRemaining10 Years(initial vesting):29%
25 Years(reducedbenefits):19%30 Years (unreducedbenefits):17%
Does Georgia TRS Retirement Plan Work for All of Today’s Employees?
September 7, 2018Georgia TRS Solvency Analysis 13
Source: Pension Integrity Project analysis of Georgia TRS turnover and withdraw assumptions. Estimated percentages are based on the expectations used by the plan actuaries; if actual experience is differing substantially from the assumptions then these forecasts would need to be adjusted accordingly.
• 53% of new teachers/educators leave before 5 years • This teacher turnover rate exceeds occupation averages nationally.• Another 18% of new teachers who are still working after 5 years will
leave before reaching the 10 years of service necessary to vest.
• Only 19% of all teachers hired next year will still be working after 25 years, long enough to qualify for a reduced benefit.
• Only 17% of all teachers hired next year will still be working after 30 years, long enough to qualify for full benefits, according to Bellwether Education Partners.
• Just 25% of Georgia teachers will “break even” on their pensions, according to TeacherPensions.org• Analysis by the Pension Integrity Project suggests that members need
to work more than 24 years for the present value of pension benefits to at least match the value of their own contributions.

FRAMEWORK FOR SOLUTIONS & REFORM
September 7, 2018Georgia TRS Solvency Analysis 14

Objectives of Good Reform
September 7, 2018
• Keeping Promises: Ensure the ability to pay 100% of the benefits earned and accrued by active workers and retirees
• Retirement Security: Provide retirement security for all current and future employees
• Predictability: Stabilize contribution rates for the long-term • Risk Reduction: Reduce pension system exposure to financial
risk and market volatility • Affordability: Reduce long-term costs for employers/taxpayers
and employees• Attractive Benefits: Ensure the ability to recruit 21st Century
employees• Good Governance: Adopt best practices for board
organization, investment management, and financial reporting
Georgia TRS Solvency Analysis 15

Pension Reform Strategies
• Problem 1: Assumptions• Reform Area 1.1: Reduce investment risk and align assumed return
with a more realistic probability of success • Reform Area 1.2: Review and adjust assumptions related to withdrawal
rates, new hire/headcount growth, payroll growth, retirement rates, inflation, and mortality
• Problem 2: Contributions and Methods• Reform Area 2.1: Consider whether the smoothed valuation interest
rate methodology is a net positive or negative for the plan• Reform Area 2.2: Adjust contribution rate method to eliminate negative
amortization, and consider adjusting the amortization method and use shorter periods to amortize the old/original and new unfunded liabilities
• Problem 3: Benefit Design• Reform Area 3.1: Consider whether adjustments to the current system
could reduce costs and risks, while still ensuring retirement security• Reform Area 3.2: Consider whether a new benefit system design could
work for more Georgia TRS members and reduce future risks
September 7, 2018Georgia TRS Solvency Analysis 16

Practical Policy Framework
1. Establish a plan to pay off the unfunded liability as quickly as possible.
• The Society of Actuaries Blue Ribbon Panel recommends amortization schedules be no longer than 15 to 20 years
2. Adopt better funding policy, risk assessment, and actuarial assumptions
• These changes should aim at minimizing risk and contribution rate volatility for employers and employees
3. Create a path to retirement security for all participants• Members that won’t accrue a full pension benefit should have
access to options for other plan designs, like cash balance or DC
September 7, 2018Georgia TRS Solvency Analysis 17

September 7, 2018Georgia TRS Solvency Analysis 18
Reform Case Studies:
Michigan Teachers (2017 & 2018)Why?• Underperforming investment returns• Back-loaded debt payments escalating (due to use of level-percent
amortization method and payroll growth assumption failing to match actual experience)
• Prior reforms (2010, 2012) having limited effect on growth in unfunded liability amortization payments
• History of failing to pay the actuarially determined contribution rate
What?• Plan to phase-in lower assumed rate of return• New choice-based retirement system (DC or DB) for new hires
• Lower assumed return, new amortization method, cost-sharing contribution rate policy for new-hire DB plan
• One-time money added to reduce unfunded liability• Ratchet-down of payroll growth assumption to eliminate backloaded
amortization (unanimous approval in House & Senate in 2018)

September 7, 2018Georgia TRS Solvency Analysis 19
Reform Case Studies:
Michigan Teachers (2017 & 2018)Outcomes?• Growing bipartisan recognition of need for reform:
• The plan design aspect of pension reform was contentious in 2017, passing by just 4 votes in each chamber
• BUT, the funding policy and assumption changes in 2018 were unanimous
• 7/23/18: Standard & Poor’s increased the state’s credit rating from AA-to AA with a “stable outlook,” citing pension reform as a key factor• Only one of three states receiving an upgrade since 2016

Concluding Comments
1. The 2013-2016 funding policy changes—including amortization method and certain actuarial assumptions—have been positive steps for the state in terms of constraining the growth in taxpayer liability. However, significant risks in the system remains.
2. The range of aggressive actuarial assumptions and insufficient ADC contributions suggest continued degrading solvency is likely.
3. While the Georgia TRS amortization schedule was closed to 30 years for existing unfunded liabilities as of 2014, targeting the transitional unfunded liability payoff date around 2044, the growth in required contributions as that date approaches will be substantial if there are no changes to the current plan. In addition, amortizing future unfunded liabilities over a rolling 30-year basis is far too long.
September 7, 2018Georgia TRS Solvency Analysis 20

Questions?
Pension Integrity Project at Reason Foundation
Len Gilroy, Senior Managing [email protected]
Anil Niraula, Policy [email protected]
Jen Sidorova, Policy [email protected]
September 7, 2018Georgia TRS Solvency Analysis 21