georgia’s 2016‐2017 charter schools 2017‐2018 · georgia department of education december 22,...
TRANSCRIPT
Georgia Department of Education December 22, 2017 * Page 1 of 106
Georgia’s Charter Schools
2016‐2017and
2017‐2018
The Georgia
Department of
Education’s District
Flexibility and
Charter Schools
Division’s 2017
Annual Report
submitted on behalf
of the State Board of
Education

Georgia Department of Education December 22, 2017 * Page 2 of 106
Georgia General Assembly State Capitol Building Atlanta, GA 30334 December 22, 2017 Dear Members of the Georgia General Assembly, Georgia law requires all charter schools to submit an annual report to the Department of Education each year and the State Board of Education to report to the General Assembly each year on the status of the charter system program [see O.C.G.A. § 20‐2‐2067.1(c) and § 20‐2‐ 2070]. To facilitate the meeting of these requirements, the Georgia Department of Education’s District Flexibility and Charter Schools Division each year conducts an Annual Report process for charter schools. The Department then compiles the Annual Report data along with academic assessment data and prepares and conveys to the General Assembly this report on behalf of the State Board of Education. The 2017 Charter Schools Annual Report is before you now. The State Board of Education in August 2017 adopted revised Charter School Rules to implement legislative changes from the 2017 session and make other changes. Revisions to the rules included clarifying the definition of Education Service Provider and that charter schools cannot require parent/guardian volunteer commitments as a condition of enrollment in the school; adding a requirement that charter school petitioners provide a description of how its governing board, students, faculty, and staff will be representative of the community diversity in its proposed attendance zone; clarifying that the local district must provide the assurance to the Department regarding a new charter school achieving ready‐to‐open status; and clarifying that the local board of education and the Georgia Department of Education must evaluate a charter school’s performance annually using the Department’s performance work (or an alternate approach approved by the Department). Thank you for your ongoing dedication and hard work in helping to strengthen Georgia’s public education system. Sincerely, Scott Johnson, Chair Kevin Boyd, Co‐Chair District Flexibility and Charter Schools Committee, State Board of Education

Georgia Department of Education December 22, 2017 * Page 3 of 106
Table of Contents Brief History of Charter Schools 4 2017‐18 Charter School List by Type 4 Historical Growth of Charter Schools in Georgia 9 Charter School Student Distribution 11 Historical Growth of Charter School Enrollment 13 Demographics of Charter Schools versus State 13 Support Services Charter Schools versus State 14 School Climate 15 Charter Schools Accountability 16 Charter School Overview by District 18 Charter School Rules – 2017 Update 104 Acknowledgments 106

Georgia Department of Education December 22, 2017 * Page 4 of 106
Brief History of Charter Schools in Georgia
Georgia’s first charter school law was passed in 1993. It allowed for the creation of conversion charter schools only and Georgia’s first three conversion charter schools were approved in 1995. The charter schools law was expanded in 1998, allowing for both locally‐approved and state chartered special schools. Oglethorpe Charter School was the first locally‐approved start‐up charter school. It opened in the Savannah‐Chatham County School System. In 2001, the first two state chartered special schools opened, Charter Conservatory for Liberal Arts and Technology (CCAT) and Odyssey School, which added Georgia’s first virtual school ‐‐ the Georgia Cyber Academy – as a program in 2007. In 2008, the charter law was changed to establish the Georgia Charter Schools Commission, with the first Commission schools opening in 2009. In 2011, the Georgia Supreme Court ruled the Commission law unconstitutional, but in 2012 a constitutional amendment was overwhelmingly approved by Georgia voters to allow for a new State Charter Schools Commission (SCSC). The first members of the SCSC were appointed by the State Board of Education in 2013 and they have been busy working to create high quality state charter schools since then.
2017‐18 Charter Schools
Georgia now has 113 charter schools serving students statewide. There are 12 Conversion Charter
Schools, including 2 Georgia College and Career Academies. There are 72 locally‐approved start‐up
charter schools, including 22 Georgia College and Career Academies. Finally, there are 29 State Charter
Schools.
Georgia Charter Schools, 2017‐18
Conversion Charter Schools (CCA)=Also a College and Career Academy
Sorted by Type and School Name
# All Charter School
County / District Served
Charter Type
1 Centennial Academy APS C
2 George Walton Comprehensive High School
Cobb C
3 Peachtree Charter Middle School DeKalb C
4 Chamblee Charter High School DeKalb C
5 International Studies Elementary Charter School
Dougherty C
6 Union Point STEAM Academy Greene C
7 Hampton Elementary Henry C
8 Hickory Flat Henry C
9 Clubview Elementary School Muscogee C
10 Wynnton Arts Academy Muscogee C
11 William S. Hutchings College and Career Academy
Bibb C (CCA)
12 Cairo High School and College and Career Academy
Grady C (CCA)

Georgia Department of Education December 22, 2017 * Page 5 of 106
Georgia Charter Schools, 2017‐18 Georgia Charter Schools, 2017‐18 Georgia Charter Schools, 2017‐18
Start‐up Charter Schools (CCA)=Also a College and Career Academy
Start‐up Charter Schools (CCA)=Also a College and Career Academy
Start‐up Charter Schools (CCA)=Also a College and Career Academy
Sorted by Type and School Name Sorted by Type and School Name Sorted by Type and School Name
# All Charter School
District Served
Charter Type
# All
Charter School
District Served
Charter Type
# All
Charter School
District Served
Charter Type
1 Atlanta Classical Academy
APS S 10 KIPP Vision ‐ Primary
APS S 19 Coastal Empire Montessori
Chatham S
2 Atlanta Neighborhood Charter School (ES)
APS S 11 KIPP WAYS APS S 20 Oglethorpe Charter School
Chatham S
3
Atlanta Neighborhood Charter School (MS)
APS S 12 KIPP WAYS ‐ Primary
APS S 21 Savannah Classical Academy
Chatham S
4 Charles R. Drew Charter School (ES)
APS S 13 The Kindezi School
APS S 22
Susie King Taylor Community School
Chatham S
5 Charles R. Drew Charter School (JA/SA)
APS S 14 The Kindezi School Old 4th Ward
APS S 23 Tybee Island Maritime Academy
Chatham S
6 KIPP Atlanta Collegiate
APS S 15 Wesley International Academy
APS S 24
Kennesaw Charter Science and Math Academy
Cobb S
7 KIPP STRIVE Academy
APS S 16 Westside Atlanta
APS S 25
DeKalb Academy of Technology & the Environment (D.A.T.E.)
DeKalb S
8 KIPP Strive Primary APS S 17
Berrien Academy Performance Learning Center
Berrien S 26 DeKalb PATH Academy
DeKalb S
9 KIPP Vision APS S 18 Academy for Classical Education
Bibb S 27 DeKalb Preparatory Academy
DeKalb S

Georgia Department of Education December 22, 2017 * Page 6 of 106
Georgia Charter Schools, 2017‐18 Georgia Charter Schools, 2017‐18 Georgia Charter Schools, 2017‐18
Start‐up Charter Schools (CCA)=Also a College and Career Academy
Start‐up Charter Schools (CCA)=Also a College and Career Academy
Start‐up Charter Schools (CCA)=Also a College and Career Academy
Sorted by Type and School Name Sorted by Type and School Name Sorted by Type and School Name
# All
Charter School
District
Served Charter Type
# All
Charter School
District Served
Charter Type
# All
Charter School
District Served
Charter Type
28
Destiny Acheivers Academy of Excellence
DeKalb S 37 Chattahoochee Hills Charter
Fulton S 46 New Life Academy of Excellence
Gwinnett
S
29 International Community School
DeKalb S 38
Fulton Academy of Science and Technology
Fulton S 47
North Metro Academy for Performing Arts
Gwinnett
S
30 Leadership Preparatory Academy
DeKalb S 39
Hapeville Charter Middle School
Fulton S 48
Baconton Community Charter School
Mitchell S
31
Tapestry Public Charter School
DeKalb S 40 KIPP South Fulton Academy
Fulton S 49 Furlow Charter School
Sumter S
32 The GLOBE Academy
DeKalb S 41 Latin College Prep School
Fulton S 50 Bishop Hall Charter School
Thomas S
33 The GLOBE Academy
DeKalb S 42 Skyview Charter School
Fulton S 51 Bartow CCA Bartow S (CCA)
34
The Museum School of Avondale Estates
DeKalb S 43 The Main Street Academy
Fulton S 52 Carroll County CCA
Carroll S (CCA)
35 Brighten Academy
Douglas
S 44 Latin Grammar School
Fulton S 53 Chattahoochee Valley Academy
Chattahoochee
S (CCA)
36 Amana Academy
Fulton S 45 Lake Oconee Academy
Greene S 54 Central Educational Center
Coweta S (CCA)

Georgia Department of Education December 22, 2017 * Page 7 of 106
Georgia Charter Schools, 2017‐18 Georgia Charter Schools, 2017‐18
Start‐up Charter Schools (CCA)=Also a College and Career Academy
Start‐up Charter Schools (CCA)=Also a College and Career Academy
Sorted by Type and School Name Sorted by Type and School Name
# All
Charter School
District Served
Charter Type
# All
Charter School
District Served
Charter Type
55 Commodore Conyers CCA
Dougherty S (CCA) 64 Lamar County CCA
Lamar S (CCA)
56
Douglas County College and Career Institute
Douglas S (CCA) 65 Newton CCA Newton S (CCA)
57 Heart of Georgia CCA
Dublin City and Laurens
County S (CCA) 66
Polk County CCA ‐ Cedartown
Polk S (CCA)
58 Effingham CCA Effingham S (CCA) 67 Polk County CCA ‐ Rockmart
Polk S (CCA)
59 Floyd County CCA
Floyd S (CCA) 68 Rockdale Career Academy
Rockdale S (CCA)
60 Hapeville CCA Fulton S (CCA) 69 Griffin Region CCA
Spalding, Butts, and
Pike S (CCA)
61 Golden Isles Career Academy
Glynn S (CCA) 70 ThINC CCA Troup S (CCA)
62 Academy for Advanced Studies
Henry S (CCA) 71 Southeastern Early CCA
Vidalia City, Toombs,
Montgomery and Treutlen
S (CCA)
63 Houston County CCA
Houston S (CCA) 72 Northwest Georgia CCA
Whitfield and Murray
S (CCA)
Georgia Department of Education December 22, 2017 * Page 8 of 106
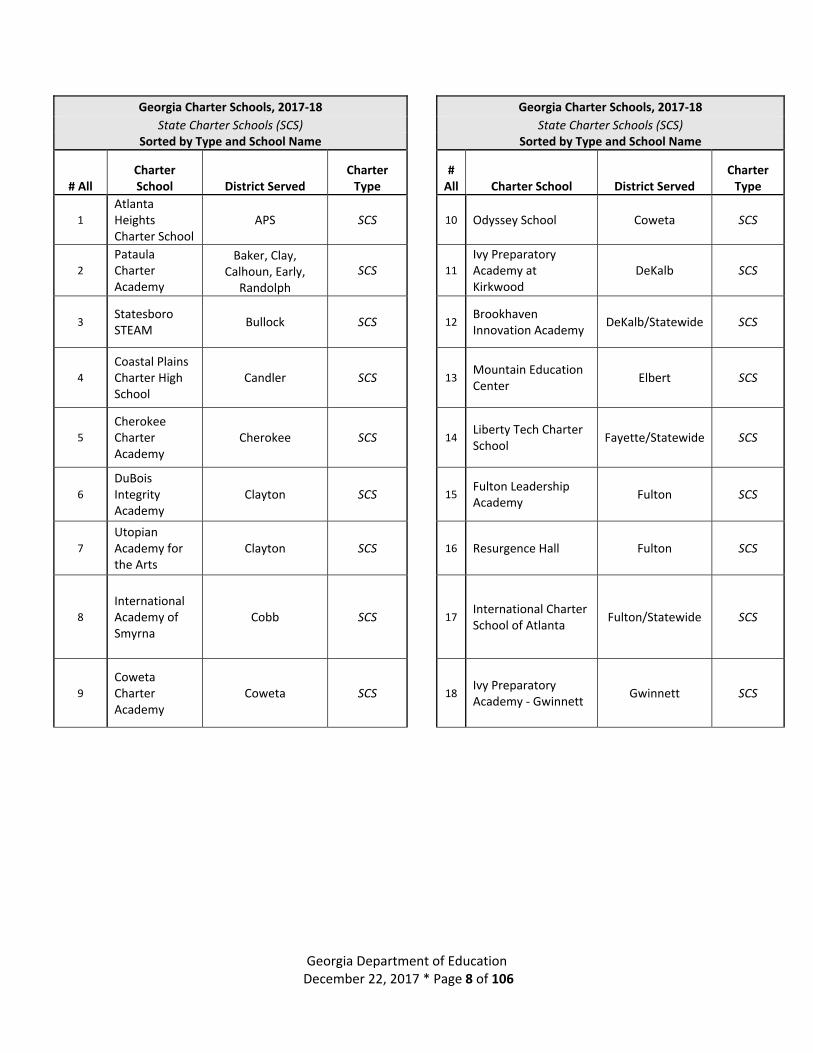
Georgia Charter Schools, 2017‐18 Georgia Charter Schools, 2017‐18
State Charter Schools (SCS) State Charter Schools (SCS)Sorted by Type and School Name Sorted by Type and School Name
# All Charter School District Served
Charter Type
# All Charter School District Served
Charter Type
1
Atlanta Heights Charter School
APS SCS 10 Odyssey School Coweta SCS
2
Pataula Charter Academy
Baker, Clay, Calhoun, Early,
Randolph
SCS 11
Ivy Preparatory Academy at Kirkwood
DeKalb SCS
3 Statesboro STEAM
Bullock SCS 12 Brookhaven Innovation Academy
DeKalb/Statewide SCS
4
Coastal Plains Charter High School
Candler SCS 13 Mountain Education Center
Elbert SCS
5
Cherokee Charter Academy
Cherokee SCS 14 Liberty Tech Charter School
Fayette/Statewide SCS
6
DuBois Integrity Academy
Clayton SCS 15 Fulton Leadership Academy
Fulton SCS
7
Utopian Academy for the Arts
Clayton SCS 16 Resurgence Hall Fulton SCS
8
International Academy of Smyrna
Cobb SCS 17 International Charter School of Atlanta
Fulton/Statewide SCS
9
Coweta Charter Academy
Coweta SCS 18 Ivy Preparatory Academy ‐ Gwinnett
Gwinnett SCS

Georgia Department of Education December 22, 2017 * Page 9 of 106
Georgia Charter Schools, 2017‐18
State Charter Schools (SCS)Sorted by Type and School Name
# All Charter School District Served Charter Type
19 Scintilla Charter Academy Lowndes, Valdosta
City SCS
20 Foothills Charter High School Madison SCS
21 Southwest Georgia STEM Randolph/Statewide SCS
22 Georgia School for Innovation & the Classics
Richmond/statewide SCS
23 Cirrus Academy Charter School Statewide SCS
24 Genesis Academy for Boys Statewide SCS
25 Genesis Academy for Girls Statewide SCS
26 Georgia Connections Academy Statewide SCS
27 Georgia Cyber Academy Statewide SCS
28 Graduation Achievement Center Charter High School
Statewide SCS
29 School for Arts‐Infused Learning (SAIL)
Statewide SCS

Georgia Department of Education December 22, 2017 * Page 10 of 106
Historical Growth of Charter Schools in Georgia
Between the 2016‐17 and 2017‐18 school year, 8 new charter schools were added, and one school gave
up its charter to join a Strategic Waivers School System.
71 76 79
100
113 111 113119
115
106
113
2007‐08 2008‐09 2009‐10 2010‐11 2011‐12 2012‐13 2013‐14 2014‐15 2015‐16 2016‐17 2017‐18
11 ‐Year History of Charter Schools
# of Charter Schools

Georgia Department of Education December 22, 2017 * Page 11 of 106
Charter School Student Distribution
System Name
% of Resident Students
in Charter Schools
System Name
% of Resident Students
in Charter Schools
System Name
% of Resident Students
in Charter Schools
Greene County 49.9% Lumpkin County 3.6% Lanier County 1.8%
Mitchell County 26.5% Talbot County 3.6% Rockdale County 1.8%
Randolph County 25.7% Madison County 3.4% Newton County 1.8%
Grady County 25.4% Burke County 3.3% Glynn County 1.8%
Calhoun County 23.4% Twiggs County 3.2% Banks County 1.7%
Clay County 23.2% Wayne County 3.2% Hall County 1.7%
Atlanta Public Schools 18.6% Cherokee County 3.2% Macon County 1.6%
Sumter County 11.1% Dawson County 3.1% Paulding County 1.6%
DeKalb County 9.8% Baldwin County 3.1% Oglethorpe County 1.6%
Bibb County 9.0% Barrow County 3.0% Warren County 1.6%
Webster County 8.4% Rabun County 3.0% McDuffie County 1.6%
Fulton County 7.7% Early County 3.0% Chattahoochee County 1.5%
Lowndes County 6.5% Glascock County 3.0% Wilkes County 1.5%
Stewart County 6.4% Jackson County 2.9% Gwinnett County 1.5%
Chatham County 6.2% Crawford County 2.8% Worth County 1.5%
Fannin County 6.1% Habersham County 2.8% Liberty County 1.4%
Gilmer County 5.7% Berrien County 2.8% Butts County 1.4%
Coweta County 5.6% Putnam County 2.7% Camden County 1.4%
Baker County 5.4% Hart County 2.7% Carroll County 1.4%
White County 5.2% Monroe County 2.6% Peach County 1.4%
Terrell County 5.2% Long County 2.6% Miller County 1.4%
Towns County 4.8% Columbia County 2.5% Lamar County 1.4%
Toombs County 4.7% Bartow County 2.5% Jasper County 1.4%
Union County 4.6% Elbert County 2.4% Lee County 1.4%
Douglas County 4.6% Fayette County 2.4% Jenkins County 1.3%
Morgan County 4.4% Franklin County 2.4% Laurens County 1.3%
Cobb County 4.4% Walton County 2.3% Johnson County 1.3%
Candler County 4.1% Jefferson County 2.2% Screven County 1.2%
Henry County 4.1% Clarke County 2.2% Brantley County 1.2%
Stephens County 4.0% Bulloch County 2.1% Forsyth County 1.2%
Clayton County 3.9% Brooks County 2.0% Seminole County 1.2%
Muscogee County 3.9% Griffin‐Spalding County 2.0% Quitman County 1.2%
Thomas County 3.8% Haralson County 2.0% Pike County 1.2%
Dougherty County 3.8% Hancock County 2.0% Floyd County 1.2%
Pickens County 3.7% Meriwether County 2.0% Wilcox County 1.1%
McIntosh County 3.6% Pulaski County 1.9% Thomaston‐Upson County 1.1%
Richmond County 3.6% Murray County 1.9% Atkinson County 1.1%

Georgia Department of Education December 22, 2017 * Page 12 of 106
System Name
% of Resident Students
in Charter Schools
System Name
% of Resident Students
in Charter Schools
System Name
% of Resident Students
in Charter Schools
Gordon County 1.1% Vidalia City 0.9% Cook County 0.6%
Troup County 1.1% Ben Hill County 0.9% Echols County 0.6%
Commerce City 1.1% Walker County 0.8% Irwin County 0.6%
Treutlen County 1.1% Dade County 0.8% Pelham City 0.5%
Dodge County 1.1% Turner County 0.8% Telfair County 0.5%
Thomasville City 1.0% Taylor County 0.8% Valdosta City 0.5%
Heard County 1.0% Emanuel County 0.8% Rome City 0.5%
Bryan County 1.0% Marion County 0.8% Social Circle City 0.5%
Effingham County 1.0% Decatur County 0.7% Crisp County 0.5%
Ware County 1.0% Dooly County 0.7% Jefferson City 0.5%
Houston County 1.0% Catoosa County 0.7% Carrollton City 0.5%
Evans County 1.0% Washington County 0.7% Appling County 0.4%
Lincoln County 1.0% Trion City 0.7% Buford City 0.4%
Montgomery County 1.0% Tift County 0.7% Bleckley County 0.4%
Polk County 1.0% Bacon County 0.7% City Schools of Decatur 0.4%
Pierce County 0.9% Taliaferro County 0.7% Chickamauga City 0.4%
Wilkinson County 0.9% Schley County 0.7% Bremen City 0.4%
Jones County 0.9% Coffee County 0.6% Gainesville City 0.3%
Jeff Davis County 0.9% Chattooga County 0.6% Oconee County 0.3%
Charlton County 0.9% Whitfield County 0.6% Dublin City 0.3%
Cartersville City 0.9% Harris County 0.6% Calhoun City 0.2%
Marietta City 0.9% Colquitt County 0.6% Dalton Public Schools 0.2%
Tattnall County 0.9% Wheeler County 0.6% Clinch County 0.1%

Georgia Department of Education December 22, 2017 * Page 13 of 106
Historical Growth of Charter School Enrollment in Georgia
With a net increase of seven (7) new charter schools, there are an additional 2,157 students served in
charter schools for the 2017‐18 school year.
Demographics of Charter Schools versus State
The racial and ethnic composition of Georgia charter schools is different than of the state. Differences for locally‐approved Start‐up Charter Schools include serving a significantly lower percent of White (27.4% to 39.8%) and Hispanic (6.0% to 15.9%) students and a significantly higher percent of Black students (62.6% to 36.2%) than the state. Differences for State Charter Schools include serving a significantly higher percent of White students (46.4% to 39.8%) and a significantly lower percent of Hispanic (8.2% to 15.9%) and Asian (1.0% to 4.1%) students than the state. Conversion Charter School differences include serving a significantly higher percent of Asian students (8.1% to 4.1%) and a lower percent of Hispanic students (14.1% to 15.9%) than non‐charter schools.
School Type White Black Hispanic Asian Indian Pacific Multi
All Charter Schools 35.4% 47.0% 8.4% 2.6% 0.1% * 4.8%
Conversion Charters 36.7% 32.5% 14.1% 8.1% * * 1.7%
Start‐Up Charters 27.4% 62.6% 6.0% 2.3% * * 7.7%
State Charter Schools 46.4% 40.5% 8.2% 1.0% * * 3.8%
Statewide 39.8% 36.2% 15.9% 4.1% 0.2% 0.1% 3.6%
26,299
33,299 33,229
43,928
50,420
58,61160,853
68,841
75,247
90,875
84,392
86,549
2006‐07 2007‐08 2008‐09 2009‐10 2010‐11 2011‐12 2012‐13 2013‐14 2014‐15 2015‐16 2016‐17 2017‐18
11‐Year history of Charter School Enrollment
Georgia Department of Education December 22, 2017 * Page 14 of 106
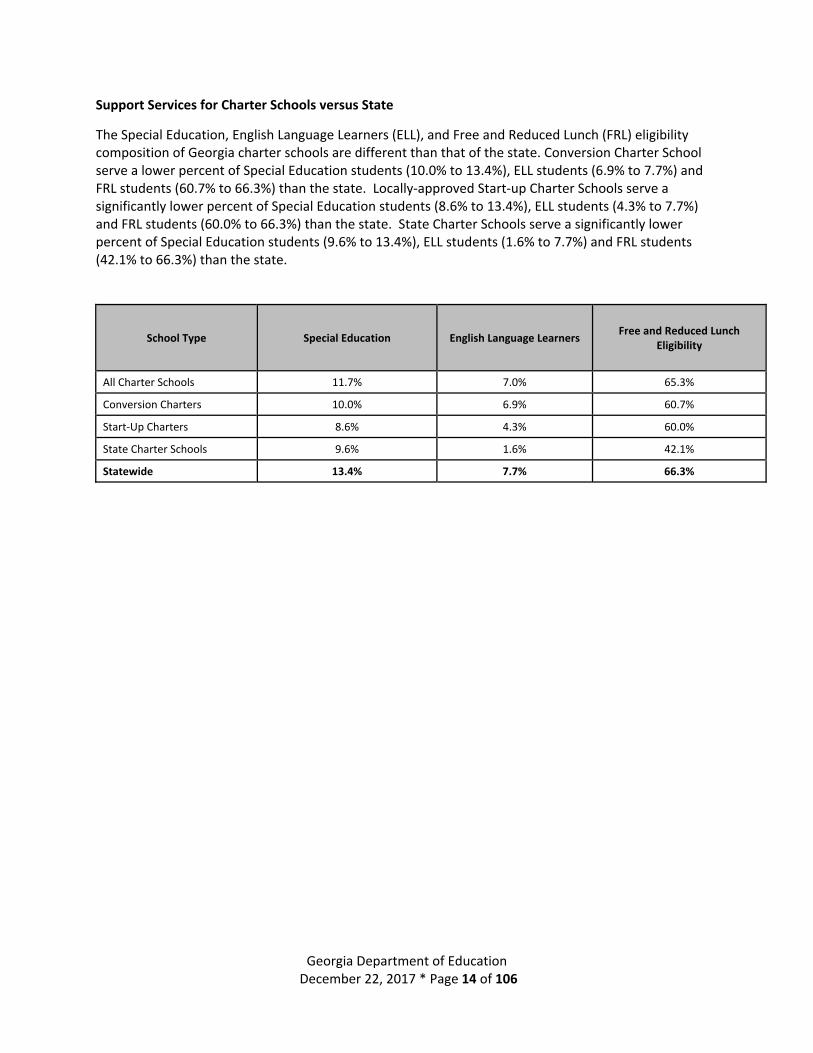
Support Services for Charter Schools versus State
The Special Education, English Language Learners (ELL), and Free and Reduced Lunch (FRL) eligibility composition of Georgia charter schools are different than that of the state. Conversion Charter School serve a lower percent of Special Education students (10.0% to 13.4%), ELL students (6.9% to 7.7%) and FRL students (60.7% to 66.3%) than the state. Locally‐approved Start‐up Charter Schools serve a significantly lower percent of Special Education students (8.6% to 13.4%), ELL students (4.3% to 7.7%) and FRL students (60.0% to 66.3%) than the state. State Charter Schools serve a significantly lower percent of Special Education students (9.6% to 13.4%), ELL students (1.6% to 7.7%) and FRL students (42.1% to 66.3%) than the state.
School Type Special Education English Language Learners Free and Reduced Lunch
Eligibility
All Charter Schools 11.7% 7.0% 65.3%
Conversion Charters 10.0% 6.9% 60.7%
Start‐Up Charters 8.6% 4.3% 60.0%
State Charter Schools 9.6% 1.6% 42.1%
Statewide 13.4% 7.7% 66.3%

Georgia Department of Education December 22, 2017 * Page 15 of 106
School Climate Star Rating
The National School Climate Center defines school climate as “the quality and character of school life” that is based on the “patterns of students’, parents’, and school personnel’s experiences of school life.”1
School climate can be influenced by the norms, goals, values, interpersonal relationships, instructional practices, and organizational structures within a school. Research has found that schools with positive school climates tend to have better test scores and graduation rates; in contrast, schools with negative school climates as a result of unsafe or hostile environments tend to have lower academic performance.2 A sustainable, positive school climate supports people feeling socially, emotionally and physically safe. In a positive school climate people are engaged and respected. By contrast, disruptive and aggressive behavior such as threats, bullying, teasing and harassment creates a hostile school environment that interferes with academic performance. A hostile school environment fosters increased absenteeism and truancy because students feel unsafe at school. If a child is not physically and mentally in attendance, learning cannot take place. Georgia is the first state in the nation to include school climate as an early indicator in its academic accountability system, the College and Career Ready Performance Index (CCRPI). The School Climate Star Rating is a diagnostic tool to determine if a school is on the right path to school improvement. Up to five stars can be awarded.
1 National School Climate Center. (2014). School Climate. Retrieved from http://www.schoolclimate.org/climate/. 2 Thapa, Amrit, Jonathan Cohen, Shawn Guffey, and Ann Higgins‐D’Alessandro. 2013. “A Review of School Climate Research.” Review of Educational Research 83(3): 357‐385.
3.45 3.47
4.28
3.93
3.543.40
3.102.82
3.66 3.73
3.172.95
Statewide Conversions Start‐ups State Charter
School Climate Start Rating2015, 2016, and 2017

Georgia Department of Education December 22, 2017 * Page 16 of 106
Charter School Accountability CCRPI Comparison Charter school CCRPI rose 2.2 points between 2016 and 2017, while the statewide score increased by 2.1 points.
72.8
74.473.8
70.5
71.6
73.7
69.4
70.4
68.168.6
66.3
68.5
2011‐12 2012‐13 2013‐14 2014‐15 2015‐16 2016‐17
6 ‐ Year History of Average CCRPI Scores
Non‐Charter Schools All Charter Schools

Georgia Department of Education December 22, 2017 * Page 17 of 106
CCRPI Comparison – Charter Type Each type of charter school (Start‐up, Conversion, and State Charter) increased their CCRPI from 2016 to 2017. Conversion Charter Schools continue to outperform the state for 6 straight years. Locally‐approved charter schools increased their score by 3.9, State Charter – Non‐Virtual Schools had an increase of 3.2 points between the 2016 school year and the 2017 school year.
73.8
74.073.4
72.1
69.1
73.0
60.3
62.9
57.8
60.8
58.2
62.8
64.4
67.0
65.0 64.9
58.9
66.2
57.9
61.5
55.4
59.4
57.8
61.0
72.9
75.874.9
75.8
81.482.1
72.8
74.473.8
70.5
71.7
73.7
2011‐12 2012‐13 2013‐14 2014‐15 2015‐16 2016‐17
6 ‐ Year History of Average CCRPI Scores By Charter Type
Locally‐approved Start‐up State Charter Combined State Charter Non‐Virtual
State Charter Virtual Conversion Statewide
Georgia Department of Education December 22, 2017 * Page 18 of 106
Charter Schools Overview
The following pages provide an overview of each charter school in the state. They are sorted by the authorizer
(local district or State Charter School Commission) that approved the charter contract. The State Charter Schools
are included together.
The first section includes the number of non‐charter schools in the system, the number of charter schools in the
system, enrollment numbers, and the charter school list.
The second section provides detailed demographic information of the system as well as the charter schools. The
charter school data is presented separately from the system data.
The third section provides detailed support services (Special Education, English Language Learner, and Free and
Reduced Lunch percentages) information of the system as well as the charter schools. The charter school data is
presented separately from the system data.
The remaining sections provide the academic accountability data.
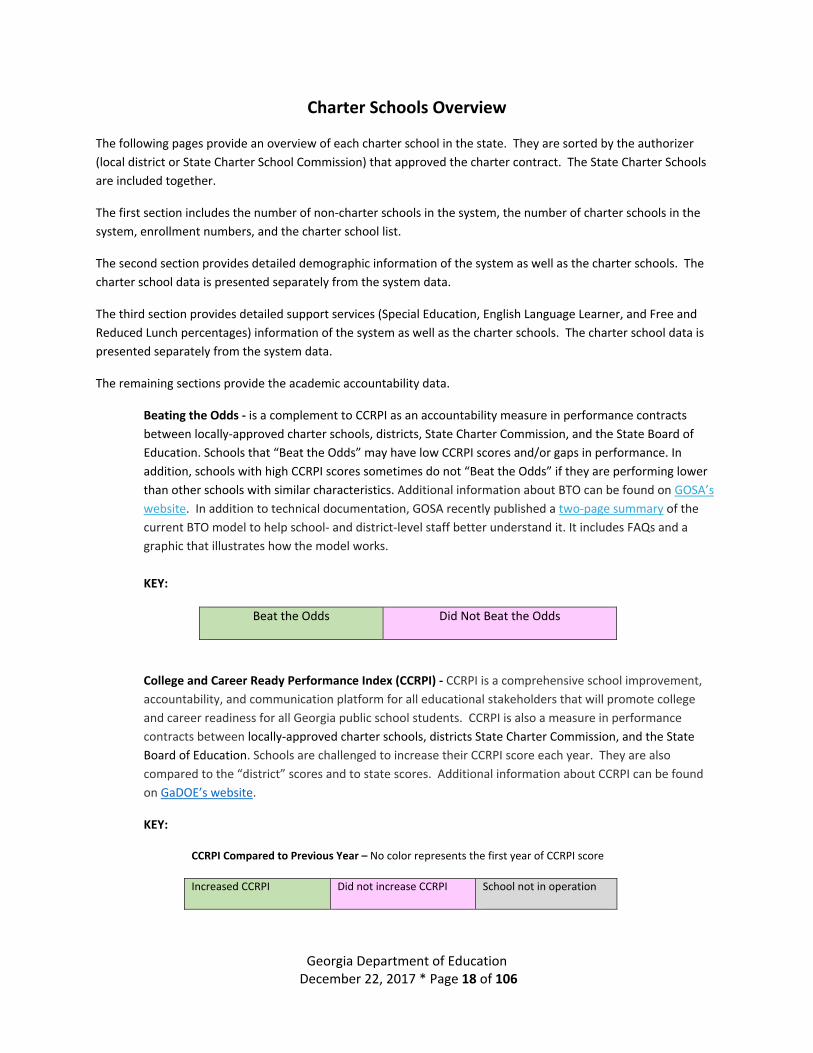
Beating the Odds ‐ is a complement to CCRPI as an accountability measure in performance contracts
between locally‐approved charter schools, districts, State Charter Commission, and the State Board of
Education. Schools that “Beat the Odds” may have low CCRPI scores and/or gaps in performance. In
addition, schools with high CCRPI scores sometimes do not “Beat the Odds” if they are performing lower
than other schools with similar characteristics. Additional information about BTO can be found on GOSA’s
website. In addition to technical documentation, GOSA recently published a two‐page summary of the
current BTO model to help school‐ and district‐level staff better understand it. It includes FAQs and a
graphic that illustrates how the model works.
KEY:
Beat the Odds Did Not Beat the Odds
College and Career Ready Performance Index (CCRPI) ‐ CCRPI is a comprehensive school improvement,
accountability, and communication platform for all educational stakeholders that will promote college
and career readiness for all Georgia public school students. CCRPI is also a measure in performance
contracts between locally‐approved charter schools, districts State Charter Commission, and the State
Board of Education. Schools are challenged to increase their CCRPI score each year. They are also
compared to the “district” scores and to state scores. Additional information about CCRPI can be found
on GaDOE’s website.
KEY:
CCRPI Compared to Previous Year – No color represents the first year of CCRPI score
Increased CCRPI Did not increase CCRPI School not in operation

Georgia Department of Education December 22, 2017 * Page 19 of 106
CCRPI Compared to District – District score is by Grade Band (E ,M, H, EM ,MH, or EMH)
CCRPI Score Higher than
District
CCRPI Score Lower than
District
Only School in that
Grade Band in District
School not in operation
CCRPI Compared to State – State score is by Grade Band (E,M,H,EM,MH,or EMH)
CCRPI Score Higher than
State
CCRPI Score Lower than
State
School not in operation
CCRPI, 2012‐2017 Charter Schools – Line graph comparing all charter schools in the district against the
total district score (minus challenge points) as well as the state.

Georgia Department of Education December 22, 2017 * Page 20 of 106
Atlanta Public School Charter Schools:
Number of Non‐Charter Schools in the System: 71
Number of Charter Schools: 15 Locally‐Approved Start‐up Charters School, 1 Conversion Charter School
Enrollment: APS – Non‐Charter Schools: 43,496 Charter Schools: 8,651
Charter School Charter Type
Year Charter Opened
Current Charter Start
Current Charter End
Grades Served in 2017‐18
1 Atlanta Classical Academy Start‐up 2014 7/1/2014 6/30/2019 K‐12
2 Atlanta Neighborhood Charter School (ES) Start‐up 2011 7/1/2016 6/30/2021 K‐5
3 Atlanta Neighborhood Charter School (MS) Start‐up
2005 7/1/2016 6/30/2021 6‐8
4 Centennial Academy Conversion
2014 7/1/2014 6/30/2019 K‐8
5 Charles R. Drew Charter School (ES) Start‐up
2000 7/1/2017 6/30/2021 K‐5
6 Charles R. Drew Charter School (JA/SA) Start‐up
2012 7/1/2017 6/30/2022 8‐12
7 KIPP Atlanta Collegiate Start‐up
2011 7/1/2014 6/30/2019 9‐12
8 KIPP STRIVE Academy Start‐up
2009 7/1/2014 6/30/2019 5‐8
9 KIPP Strive Primary Start‐up
2014 7/1/2014 6/30/2019 K‐3
10 KIPP Vision Start‐up
2010 7/1/2014 6/30/2019 5‐8
11 KIPP Vision ‐ Primary Start‐up
2014 7/1/2014 6/30/2019 K‐4
12 KIPP WAYS Start‐up
2003 7/1/2014 6/30/2019 5‐8
13 KIPP WAYS ‐ Primary Start‐up
2014 7/1/2014 6/30/2019 K‐3
14 The Kindezi School (2 sites) Start‐up
2010 7/1/2015 6/30/2020 K‐8
15 Wesley International Academy Start‐up
2007 7/1/2013 6/30/2018 K‐8
16 Westside Atlanta Start‐up
2013 7/1/2013 6/30/2018 K‐5

Georgia Department of Education December 22, 2017 * Page 21 of 106
Atlanta Public Schools and Charter Schools Demographics:
Atlanta Public Schools (761) Enrollment by Race/Ethnic Fiscal Year 2018‐1
ID Name Total White Black Hispanic Asian Indian Pacific Multi
# % # % # % # % # % # % # %
Atlanta Public Schools 43,496 6,646 12.7% 31,498 60.4% 3,658 7.0% 563 1.1% 79 0.2% 41 0.1% 1,011 1.9%
415 Atlanta Classical Academy 593 455 76.7% 71 12.0% 67 11.3% * * * *
505 Atlanta Neighborhood Charter ‐ Elementary
353 283 80.2% 70 19.8% * * * * *
206 Atlanta Neighborhood Charter ‐ Middle
194 146 75.3% 48 24.7% * * * * *
199 Centennial Academy 780 * 740 94.9% * * * * 40 5.1%
515 Charles Drew Charter School JA/SA
717 52 7.3% 665 92.7% * * * * *
201 Charles R. Drew Charter School
952 241 25.3% 669 70.3% * * * * 42 4.4%
123 Kindezi 351 * 351 100.0% * * * * *
1417 Kindezi Old 4th Ward 432 48 11.1% 384 88.9% * * * * *
212 KIPP Atlanta Collegiate 764 * 764 100.0% * * * * *
115 KIPP Strive Academy 379 * 379 100.0% * * * * *
213 KIPP Strive Primary 509 * 509 100.0% * * * * *
122 KIPP VISION 348 * 348 100.0% * * * * *
214 KIPP Vision Primary 494 * 494 100.0% * * * * *
215 KIPP WAYS Primary School 402 * 402 100.0% * * * * *
605 KIPP West Atlanta Young Scholars Academy
351 * 351 100.0% * * * * *
1208 Wesley International Academy
785 109 13.9% 582 74.1% 47 6.0% * * * 47 6.0%
314 Westside Atlanta Charter School
247 105 42.5% 142 57.5% * * * * *

2017‐18 Atlanta Public School Charter School Support Services
School Name % Special
Education
% English Language
Learner
% Free and Reduced
Lunch
Atlanta Public Schools 10.8% 4.2% 75.7%
Atlanta Classical Academy 5.9% 4.2% 5.1%
Atlanta Neighborhood Charter ‐ Elementary 9.2% 1.5% 9.2%
Atlanta Neighborhood Charter ‐ Middle 16.2% 2.1% 18.8%
Centennial Academy 7.8% 4.0% 100.0%
Charles Drew Charter School JA/SA 9.4% 0.0% 53.5%
Charles R. Drew Charter School 5.4% 0.4% 45.3%
Kindezi 9.5% 0.0% 100.0%
KIPP Atlanta Collegiate 11.5% 0.5% 100.0%
KIPP Strive Academy 9.6% 0.0% 71.8%
KIPP Strive Primary 4.8% 0.2% 100.0%
KIPP VISION 8.6% 0.3% 100.0%
KIPP Vision Primary 8.2% 1.3% 100.0%
KIPP WAYS Primary School 4.6% 0.0% 100.0%
KIPP West Atlanta Young Scholars Academy 9.7% 0.3% 100.0%
Wesley International Academy 9.3% 0.9% 46.5%
Westside Atlanta Charter School 7.6% 2.2% 36.6%

Georgia Department of Education December 30, 2017 ● Page 23 of 106
Beating the Odds:
School Name Clus‐ter 2012 2013 2014 2015 2016 2017
Atlanta Classical Academy EMH 59.5 69.1 75.3
Atlanta Neighborhood Charter ‐ Elementary E 82.4 88.3 87.6 85.1 82.2 79.1
Atlanta Neighborhood Charter ‐ Middle M 67.7 70.6 77.7 67.6 70.1 76.9
Centennial Academy EM 63.7 66.3 66.4 55.6 60.0 77.0
Charles Drew Charter School JA/SA MH 70.3 67.0 80.3
Charles R. Drew Charter School E 82.7 81.3 79.5 78.8 80.5 83.6
Kindezi EM 74.4 79.6 75.1 77.4 71.8 69.4
KIPP Atlanta Collegiate H 70.0 73.0 64.3 77.4 71.0 69.3
KIPP Strive Academy EM 84.1 79.6 78.6 82.6 74.9 72.7
KIPP Strive Primary Academy E 50.7
KIPP VISION EM 60.7 73.3 67.5 68.2 57.6 65.0
KIPP West Atlanta Young Scholars Academy EM 71.1 72.5 69.5 77.3 74.7 67.2
Wesley International Academy EM 70.4 70.4 71.2 70.6 68.5 65.7
Westside Atlanta Charter School E 60.6 70.6
CCRPI Compared to Previous Year:
School Name 2012 2013 2014 2015 2016 2017
Atlanta Classical Academy 59.5 69.1 75.3
Atlanta Neighborhood Charter ‐ Elementary 82.4 88.3 87.6 85.1 82.2 79.1
Atlanta Neighborhood Charter ‐ Middle 67.7 70.6 77.7 67.6 70.1 76.9
Centennial Academy 63.7 66.3 66.4 55.6 60.0 77.0
Charles Drew Charter School JA/SA 70.3 67.0 80.3
Charles R. Drew Charter School 82.7 81.3 79.5 78.8 80.5 83.6
Kindezi 74.4 79.6 75.1 77.4 71.8 69.4
KIPP Atlanta Collegiate 70.0 73.0 64.3 77.4 71.0 69.3
KIPP Strive Academy 84.1 79.6 78.6 82.6 74.9 72.7
KIPP Strive Primary Academy 50.7
KIPP VISION 60.7 73.3 67.5 68.2 57.6 65.0
KIPP West Atlanta Young Scholars Academy 71.1 72.5 69.5 77.3 74.7 67.2
Wesley International Academy 70.4 70.4 71.2 70.6 68.5 65.7
Westside Atlanta Charter School 60.6 70.6

Georgia Department of Education December 30, 2017 ● Page 24 of 106
CCRPI Compared to District:
School Name 2012 2013 2014 2015 2016 2017
Atlanta Classical Academy 59.5 69.1 75.3
Atlanta Neighborhood Charter ‐ Elementary 82.4 88.3 87.6 85.1 82.2 79.1
Atlanta Neighborhood Charter ‐ Middle 67.7 70.6 77.7 67.6 70.1 76.9
Centennial Academy 63.7 66.3 66.4 55.6 60.0 77.0
Charles Drew Charter School JA/SA 70.3 67.0 80.3
Charles R. Drew Charter School 82.7 81.3 79.5 78.8 80.5 83.6
Kindezi 74.4 79.6 75.1 77.4 71.8 69.4
KIPP Atlanta Collegiate 70.0 73.0 64.3 77.4 71.0 69.3
KIPP Strive Academy 84.1 79.6 78.6 82.6 74.9 72.7
KIPP Strive Primary Academy 50.7
KIPP VISION 60.7 73.3 67.5 68.2 57.6 65.0
KIPP West Atlanta Young Scholars Academy 71.1 72.5 69.5 77.3 74.7 67.2
Wesley International Academy 70.4 70.4 71.2 70.6 68.5 65.7
Westside Atlanta Charter School 60.6 70.6
CCRPI Compared to State:
School Name 2012 2013 2014 2015 2016 2017
Atlanta Classical Academy 59.5 69.1 75.3
Atlanta Neighborhood Charter ‐ Elementary 82.4 88.3 87.6 85.1 82.2 79.1
Atlanta Neighborhood Charter ‐ Middle 67.7 70.6 77.7 67.6 70.1 76.9
Centennial Academy 63.7 66.3 66.4 55.6 60.0 77.0
Charles Drew Charter School JA/SA 70.3 67.0 80.3
Charles R. Drew Charter School 82.7 81.3 79.5 78.8 80.5 83.6
Kindezi 74.4 79.6 75.1 77.4 71.8 69.4
KIPP Atlanta Collegiate 70.0 73.0 64.3 77.4 71.0 69.3
KIPP Strive Academy 84.1 79.6 78.6 82.6 74.9 72.7
KIPP Strive Primary Academy 50.7
KIPP VISION 60.7 73.3 67.5 68.2 57.6 65.0
KIPP West Atlanta Young Scholars Academy 71.1 72.5 69.5 77.3 74.7 67.2
Wesley International Academy 70.4 70.4 71.2 70.6 68.5 65.7
Westside Atlanta Charter School 60.6 70.6

Georgia Department of Education December 30, 2017 ● Page 25 of 106
40
45
50
55
60
65
70
75
80
85
90
2011‐12 2012‐13 2013‐14 2014‐15 2015‐16 2016‐17
CCRPI, 2012‐17Charter Schools in Atlanta Public Schools
Statewide Atlanta Public Schools
Atlanta Classical Academy Atlanta Neighborhood Charter ‐ Elementary
Atlanta Neighborhood Charter ‐ Middle Centennial Academy
Charles Drew Charter School JA/SA Charles R. Drew Charter School
Kindezi KIPP Atlanta Collegiate
Kipp Strive Academy KIPP Strive Primary Academy
KIPP VISION KIPP West Atlanta Young Scholars Academy
Wesley International Academy Westside Atlanta Charter School
Georgia Department of Education December 30, 2017 ● Page 26 of 106
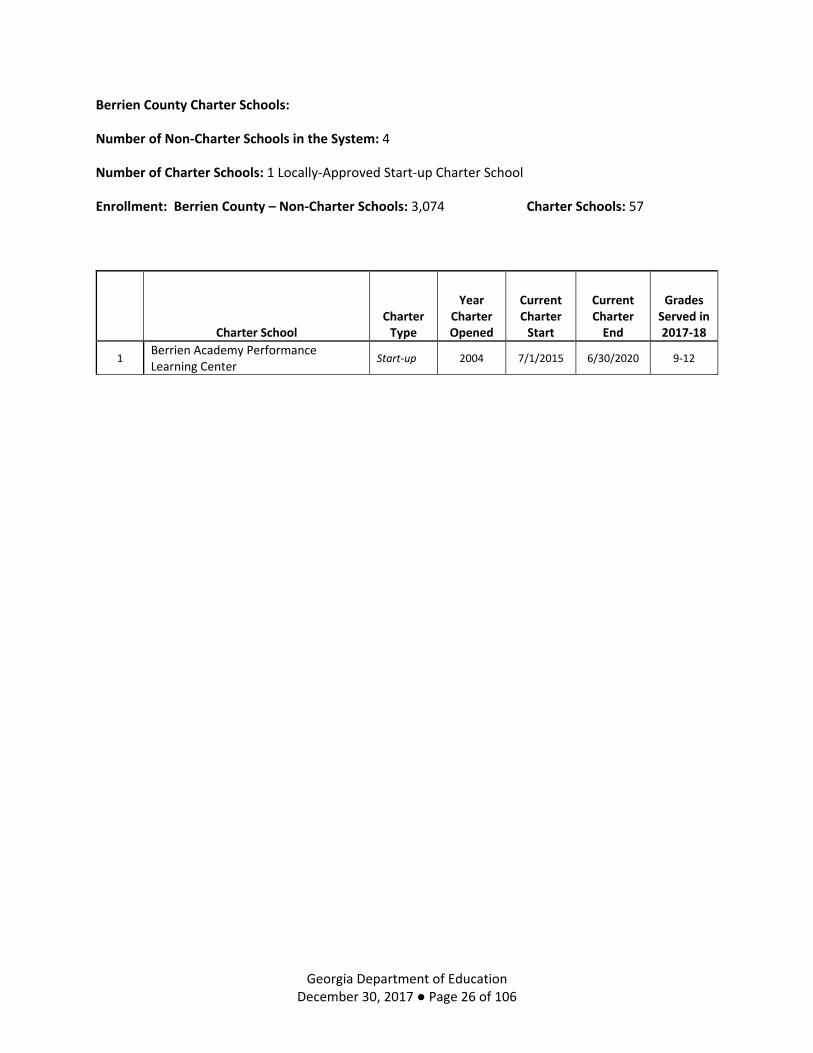
Berrien County Charter Schools:
Number of Non‐Charter Schools in the System: 4
Number of Charter Schools: 1 Locally‐Approved Start‐up Charter School
Enrollment: Berrien County – Non‐Charter Schools: 3,074 Charter Schools: 57
Charter School Charter Type
Year Charter Opened
Current Charter Start
Current Charter End
Grades Served in 2017‐18
1 Berrien Academy Performance Learning Center
Start‐up 2004 7/1/2015 6/30/2020 9‐12
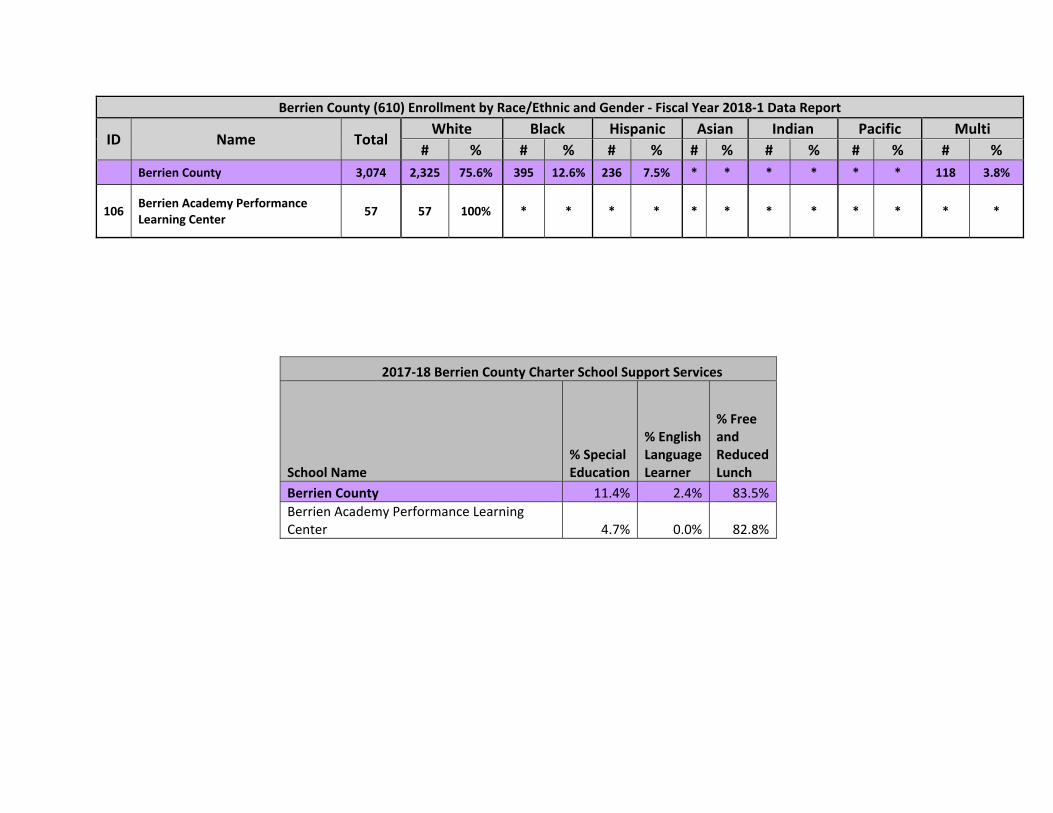
Berrien County (610) Enrollment by Race/Ethnic and Gender ‐ Fiscal Year 2018‐1 Data Report
ID Name Total White Black Hispanic Asian Indian Pacific Multi
# % # % # % # % # % # % # %
Berrien County 3,074 2,325 75.6% 395 12.6% 236 7.5% * * * * * * 118 3.8%
106 Berrien Academy Performance Learning Center
57 57 100% * * * * * * * * * * * *
2017‐18 Berrien County Charter School Support Services
School Name % Special Education
% English Language Learner
% Free and Reduced Lunch
Berrien County 11.4% 2.4% 83.5%
Berrien Academy Performance Learning Center 4.7% 0.0% 82.8%

Beating the Odds:
School Name Clus‐ter 2012 2013 2014 2015 2016 2017
Berrien Academy Performance Learning Center H 43.6 50.0 41.8 48.0 53.2 58.0
CCRPI Compared to Previous Year:
School Name 2012 2013 2014 2015 2016 2017
Berrien Academy Performance Learning Center 43.6 50.0 41.8 48.0 53.2 58.0
CCRPI Compared to District:
School Name 2012 2013 2014 2015 2016 2017
Berrien Academy Performance Learning Center 43.6 50.0 41.8 48.0 53.2 58.0
CCRPI Compared to State:
School Name 2012 2013 2014 2015 2016 2017
Berrien Academy Performance Learning Center 43.6 50.0 41.8 48.0 53.2 58.0

Georgia Department of Education December 30, 2017 ● Page 29 of 106
40
45
50
55
60
65
70
75
80
85
90
2011‐12 2012‐13 2013‐14 2014‐15 2015‐16 2016‐17
CCRPI, 2012‐17Charter Schools in Berrien County
Statewide Berrien County Berrien Academy Performance Learning Center
Georgia Department of Education December 30, 2017 ● Page 30 of 106
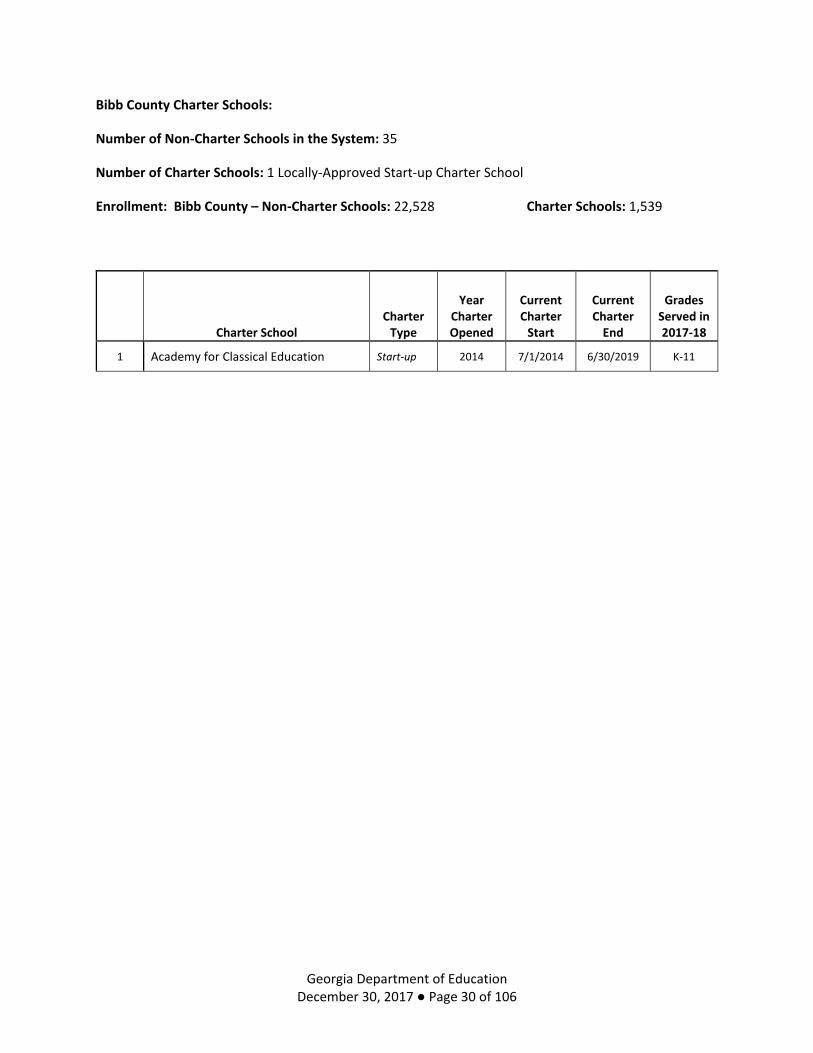
Bibb County Charter Schools:
Number of Non‐Charter Schools in the System: 35
Number of Charter Schools: 1 Locally‐Approved Start‐up Charter School
Enrollment: Bibb County – Non‐Charter Schools: 22,528 Charter Schools: 1,539
Charter School Charter Type
Year Charter Opened
Current Charter Start
Current Charter End
Grades Served in 2017‐18
1 Academy for Classical Education Start‐up 2014 7/1/2014 6/30/2019 K‐11

Bibb County (611) Enrollment by Race/Ethnic and Gender ‐ Fiscal Year 2018‐1 Data Report
ID Name Total White Black Hispanic Asian Indian Pacific Multi
# % # % # % # % # % # % # %
Bibb County 22,528 3,325 14.8% 17,234 76.5% 1,120 5.0% 313 1.4% * * * * 536 2.4%
106 Academy for Classical Education 1,539 1,092 71.0% 246 16.0% 45 2.9% 118 7.7% * * * * 1,539 2.5%
2017‐18 Bibb County Charter School Support Services
School Name % Special Education
% English Language Learner
% Free and Reduced Lunch
Bibb County 9.7% 2.4% 99.1%
Academy for Classical Education 3.4% 1.6% 99.1%

Beating the Odds:
School Name Clus‐ter 2012 2013 2014 2015 2016 2017
Academy for Classical Education EM 67.8 78.3 78.3
CCRPI Compared to Previous Year:
School Name 2012 2013 2014 2015 2016 2017
Academy for Classical Education 67.8 78.3 81.6
CCRPI Compared to District:
School Name 2012 2013 2014 2015 2016 2017
Academy for Classical Education 67.8 78.3 81.6
CCRPI Compared to State:
School Name 2012 2013 2014 2015 2016 2017
Academy for Classical Education 67.8 78.3 81.6

40
45
50
55
60
65
70
75
80
85
90
2014‐15 2015‐16 2016‐17
CCRPI, 2015‐17Charter Schools in Bibb County
Statewide Bibb County Academy for Classical Education

Chatham County Charter Schools:
Number of Non‐Charter Schools in the System: 52
Number of Charter Schools: 5 Locally‐Approved Start‐up Charter Schools
Enrollment: Chatham County – Non‐Charter Schools: 35,957 Charter Schools: 1,654
Charter School Charter Type
Year Charter Opened
Current Charter Start
Current Charter End
Grades Served in 2017‐18
1 Coastal Empire Montessori Start‐up 2008 7/1/2013 6/30/2018 K‐5
2 Oglethorpe Charter School Start‐up 1999 7/1/2013 6/30/2018 6‐8
3 Savannah Classical Academy Start‐up
2013 7/1/2013 6/30/2018 K‐10
4 Susie King Taylor Community School Start‐up
2017 7/1/2017 6/30/2022 K‐8
5 Tybee Island Maritime Academy Start‐up
2013 7/1/2013 6/30/2018 K‐5

Chatham County Schools and Charter Schools Demographics:
Savannah‐Chatham County (625) Enrollment by Race/Ethnic and Gender ‐ Fiscal Year 2018‐1 Data Report
ID Name Total White Black Hispanic Asian Indian Pacific Multi
# % # % # % # % # % # % # %
Chatham County 35,957 9,443 26.3% 20,471 56.9% 3,160 8.8% 812 2.3% 116 0.3% 56 0.2% 1,899 5.3%
109 Coastal Empire Montessori Charter School
263 119 45.2% 144 54.8% * * * * * * * * * *
118 Oglethorpe Charter School 587 118 20.1% 394 67.1% 33 5.6% * * * * * * 42 7.2%
125 Tybee Island Maritime Academy School 242 242 100.0% * * * * * * * * * * * *
128 Savannah Classical Academy Charter School
360 * * 360 100.0% * * * * * * * * * *
515 Susie King Taylor Community School 155 69 44.5% 86 55.5% * * * * * * * * * *
2017‐18 Chatham County Charter School Support Services
School Name % Special
Education
% English Language
Learner
% Free and Reduced
Lunch
Chatham County 11.7% 3.6% 55.2%
Coastal Empire Montessori Charter School 9.1% 0.6% 61.7%
Oglethorpe Charter School 7.0% 0.2% 53.8%
Savannah Classical Academy Charter School 7.2% 0.3% 72.4%
Susie King Taylor Community School 5.8% 0.0% 53.5%
Tybee Island Maritime Academy School 10.4% 0.0% 21.5%

Beating the Odds:
School Name Clus‐ter 2012 2013 2014 2015 2016 2017
Coastal Empire Montessori Charter School E 60.2 61.1 71.1 67.2 73.4 63.6
Oglethorpe Charter School M 76.4 77.1 80.6 75.1 74.3
Savannah Classical Academy Charter School EM
42.6 55.6 54.2 51.4
Tybee Island Maritime Academy School E 76.4 64.6 81.8 84.3
CCRPI Compared to Previous Year:
School Name 2012 2013 2014 2015 2016 2017
Coastal Empire Montessori Charter School 60.2 61.1 71.1 67.2 73.4 63.6
Oglethorpe Charter School 76.4 77.1 80.6 75.1 74.3
Savannah Classical Academy Charter School 42.6 55.6 54.2 51.4
Tybee Island Maritime Academy School 76.4 64.6 81.8 84.3
CCRPI Compared to District:
School Name 2012 2013 2014 2015 2016 2017
Coastal Empire Montessori Charter School 60.2 61.1 71.1 67.2 73.4 63.6
Oglethorpe Charter School 76.4 77.1 80.6 75.1 74.3
Savannah Classical Academy Charter School 42.6 55.6 54.2 51.4
Tybee Island Maritime Academy School 76.4 64.6 81.8 84.3
CCRPI Compared to State:
School Name 2012 2013 2014 2015 2016 2017
Coastal Empire Montessori Charter School 60.2 61.1 71.1 67.2 73.4 63.6
Oglethorpe Charter School 76.4 77.1 80.6 75.1 74.3
Savannah Classical Academy Charter School 42.6 55.6 54.2 51.4
Tybee Island Maritime Academy School 76.4 64.6 81.8 84.3

40
45
50
55
60
65
70
75
80
85
90
2011‐12 2012‐13 2013‐14 2014‐15 2015‐16 2016‐17
CCRPI, 2012‐17Charter Schools in Chatham County
Statewide Chatham County
Coastal Empire Montessori Charter School Oglethorpe Charter School
Savannah Classical Academy Charter School Tybee Island Maritime Academy School

Cobb County Charter Schools:
Number of Non‐Charter Schools in the System: 98
Number of Charter Schools: 2 Locally‐Approved Start‐up Charter Schools, *1 State Commission Charter
School
Enrollment: Cobb County – Non‐Charter Schools: 108,331 Charter Schools: 3753
Charter School Charter Type
Year Charter Opened
Current Charter Start
Current Charter End
Grades Served in 2017‐18
1 George Walton Comprehensive High School
Start‐up 1998 7/1/2013 6/30/2018 9‐12
2 International Academy of Smyrna* Commission 2006 7/1/2017 6/30/2020 K‐8
3 Kennesaw Charter Science and Math Academy
Start‐up2003 7/1/2015 6/30/2020 K‐5
*2017‐18 School year first year as a State Commission Charter School

Cobb County Schools and Charter Schools Demographics:
Cobb County (633) Enrollment by Race/Ethnic - Fiscal Year 2018-1 Data Report
ID Name Total White Black Hispanic Asian Indian Pacific Multi
# % # % # % # % # % # % # %
Cobb County 108,331 40,309 37.2% 33,874 31.3% 23,983 22.1% 5758 5.3% 222 0.2% 78 0.1% 4,107 3.8%
304 Kennesaw Charter School 561 121 21.6% 317 56.5% 89 15.9% * * * * * * 34 6.1%
175 Walton High School 2686 1,802 67.1% 172 6.4% 143 5.3% 508 18.9 * * * * 61 2.3%
2017‐18 Cobb County Charter School Support Services
School Name % Special
Education
% English
Language Learner
% Free and
Reduced Lunch
Cobb County 13.1% 12.1% 42.4%
Walton High School 8.8% 2.3% 4.0%
Kennesaw Charter School 6.6% 10.8% 33.7%

Georgia Department of Education DRAFT December 18, 2017 * Page 40 of 106
Beating the Odds:
School Name Clus‐ter 2012 2013 2014 2015 2016 2017
International Academy of Smyrna E 72.3 79.2 74.7 69.7 56.7 61.3
Kennesaw Charter School M 85.0 78.2 82.3 71.2 69.4 75.0
Walton High School EM 91.0 90.0 87.6 94.5 99.7 98.7
CCRPI Compared to Previous Year:
School Name 2012 2013 2014 2015 2016 2017
International Academy of Smyrna 72.3 79.2 74.7 69.7 56.7 61.3
Kennesaw Charter School 85.0 78.2 82.3 71.2 69.4 75.0
Walton High School 91.0 90.0 87.6 94.5 99.7 98.7
CCRPI Compared to District:
School Name 2012 2013 2014 2015 2016 2017
International Academy of Smyrna 72.3 79.2 74.7 69.7 56.7 61.3
Kennesaw Charter School 85.0 78.2 82.3 71.2 69.4 75.0
Walton High School 91.0 90.0 87.6 94.5 99.7 98.7
CCRPI Compared to State:
School Name 2012 2013 2014 2015 2016 2017
International Academy of Smyrna 72.3 79.2 74.7 69.7 56.7 61.3
Kennesaw Charter School 85.0 78.2 82.3 71.2 69.4 75.0
Walton High School 91.0 90.0 87.6 94.5 99.7 98.7

Georgia Department of Education DRAFT December 18, 2017 * Page 41 of 106
40
50
60
70
80
90
100
2011‐12 2012‐13 2013‐14 2014‐15 2015‐16 2016‐17
CCRPI, 2012‐17Charter Schools in Cobb County
Statewide Cobb County
International Academy of Smyrna Kennesaw Charter School
Walton High School

Georgia Department of Education DRAFT December 18, 2017 * Page 42 of 106
DeKalb County Charter Schools:
Number of Non‐Charter Schools in the System: 117
Number of Charter Schools: 9 Locally‐Approved Start‐up Charter Schools, 2 Conversion Charter Schools
Enrollment: DeKalb – Non‐Charter Schools: 92,855 Charter Schools: 1,657
Charter School Charter Type
Year Charter Opened
Current Charter Start
Current Charter End
Grades Served in 2017‐18
1 Chamblee Charter High School Conversion 2009 7/1/2016 6/30/2021 9‐12
2 DeKalb Academy of Technology & the Environment (D.A.T.E.)
Start‐up 2005 7/1/2016 6/30/2021 K‐8
3 DeKalb PATH Academy Start‐up
2002 7/1/2015 6/30/2020 5‐8
4 DeKalb Preparatory Academy Conversion
2012 7/1/2017 6/30/2019 K‐8
5 Destiny Achievers Academy of Excellence
Start‐up2011 7/1/2011 6/30/2018 9‐12
6 International Community School Start‐up
2002 7/1/2014 6/30/2019 K‐5
7 Leadership Preparatory Academy Start‐up
2010 7/1/2015 6/30/2020 K‐8
8 Peachtree Charter Middle School Conversion
2001 7/1/2016 6/30/2021 6‐8
9 Tapestry Public Charter School Start‐up
2014 7/1/2014 6/30/2019 6‐10
10 The GLOBE Academy Start‐up
2013 7/1/2013 6/30/2018 K‐3
11 The Museum School of Avondale Estates
Start‐up2010 7/1/2017 6/30/2022 K‐8

Georgia Department of Education DRAFT December 18, 2017 * Page 43 of 106
DeKalb County Schools and Charter Schools Demographics:
DeKalb County (644) Enrollment by Race/Ethnic and Gender ‐ Fiscal Year 2018‐1 Data Report
ID Name Total White Black Hispanic Asian Indian Pacific Multi
# % # % # % # % # % # % # %
DeKalb County Schools 92,855 9,218 9.9% 58,743 63.3% 16,460 17.7% 6161 6.6% 309 0.3% 112 0.1% 1,852 2.0%
5052 Chamblee Charter High School
1,657 504 30.4% 445 26.9% 452 27.3% 205 12.4 * * * * 51 3.1%
1010
DeKalb Academy of Technology and the Environment Charter School
679 * * 622 91.6% 57 8.4% * * * * * * * *
705 DeKalb PATH Academy Charter School
349 * * 57 16.3% 292 83.7% * * * * * * * *
113 DeKalb Preparatory Academy Charter
490 * * 490 100.0% * * * * * * * * * *
112 Destiny Achievers Academy of Excellence
218 * * 218 100.0% * * * * * * * * * *
314 GLOBE Academy 781 373 47.8% 217 27.8% 93 11.9% 31 4 * * * * 67 8.6%
805 International Community School
401 91 22.7 152 37.9% * * 158 39.4 * * * * * *
311 Leadership Preparatory Academy
441 * * 441 100.0% * * * * * * * * * *
215 Museum School Avondale Estates
556 328 59 155 27.9% 38 6.8% * * * * * * 35 6.3%
189 Peachtree Middle School
1,540 632 41 250 16.2% 525 34.1% 133 8.6 * * * * * *
315 Tapestry Public Charter School
177 106 59.9 71 40.1% * * * * * * * * * *

2017‐18 DeKalb County Charter School Support Services
School Name
% Special
Education
% English
Language
Learner
% Free
and
Reduced
Lunch
DeKalb County 10.2% 16.5% 72.2%
Chamblee Charter High School 8.1% 11.7% 37.9%
DeKalb Academy of Technology and the Environment Charter School 3.3% 5.2% 61.8%
DeKalb PATH Academy Charter School 6.5% 42.9% 96.5%
DeKalb Preparatory Academy Charter 7.7% 1.5% 79.5%
Destiny Achievers Academy of Excellence 7.2% 0.0% 59.3%
GLOBE Academy Charter School I 8.7% 2.3% 9.6%
International Community School 4.3% 49.0% 69.8%
Leadership Preparatory Academy 5.0% 0.0% 60.8%
Museum School Avondale Estates 9.4% 1.1% 20.5%
Peachtree Middle School 11.6% 18.2% 35.3%
Tapestry Public Charter School 55.6% 3.4% 16.1%

Georgia Department of Education December 30, 2017 ● Page 45 of 106
Beating the Odds:
School Name Clus‐ter 2012 2013 2014 2015 2016 2017
Chamblee Charter High School H 79.3 76.7 79.1 86.8 86.1 81.7
DeKalb Academy of Technology and the Environment Charter School EM 77.7 68.6 66.8 66.5 60.0 76.4
DeKalb PATH Academy Charter School EM 75.3 80.0 78.3 76.1 78.0 76.2
DeKalb Preparatory Academy Charter EM 54.9 53.4 60.4 60.6 66.3
Destiny Achievers Academy of Excellence H 36.6 49.5 38.2 50.7 47.9 54.3
GLOBE Academy Charter School I E 51.1 76.4 88.4 82.8 87.8
International Community School E 66.8 63.0 63.0 62.8 62.4 75.4
Leadership Preparatory Academy EM 68.9 73.9 64.3 69.2 66.2 77.8
Museum School Avondale Estates EM 93.4 88.2 89.3 88.4 87.2 89.1
Peachtree Middle School M 79.1 71.5 78.8 77.6 76.8 76.1
Tapestry Public Charter School MH 60.1 57.6 59.5
CCRPI Compared to Previous Year:
School Name 2012 2013 2014 2015 2016 2017
Chamblee Charter High School 79.3 76.7 79.1 86.8 86.1 81.6
DeKalb Academy of Technology and the Environment Charter School 77.7 68.6 66.8 66.5 60.0 76.4
DeKalb PATH Academy Charter School 75.3 80.0 78.3 76.1 78.0 76.2
DeKalb Preparatory Academy Charter 54.9 53.4 60.4 60.6 66.3
Destiny Achievers Academy of Excellence 36.6 49.5 38.2 50.7 47.9 54.3
GLOBE Academy Charter School I 51.1 76.4 88.4 82.8 87.8
International Community School 66.8 63.0 63.0 62.8 62.4 75.4
Leadership Preparatory Academy 68.9 73.9 64.3 69.2 66.2 77.8
Museum School Avondale Estates 93.4 88.2 89.3 88.4 87.2 89.1
Peachtree Middle School 79.1 71.5 78.8 77.6 76.8 76.1
Tapestry Public Charter School 60.1 57.6 59.5

Georgia Department of Education December 30, 2017 ● Page 46 of 106
CCRPI Compared to District:
School Name 2012 2013 2014 2015 2016 2017
Chamblee Charter High School 79.3 76.7 79.1 86.8 86.1 81.6
DeKalb Academy of Technology and the Environment Charter School 77.7 68.6 66.8 66.5 60.0 76.4
DeKalb PATH Academy Charter School 75.3 80.0 78.3 76.1 78.0 76.2
DeKalb Preparatory Academy Charter 54.9 53.4 60.4 60.6 66.3
Destiny Achievers Academy of Excellence 36.6 49.5 38.2 50.7 47.9 54.3
GLOBE Academy Charter School I 51.1 76.4 88.4 82.8 87.8
International Community School 66.8 63.0 63.0 62.8 62.4 75.4
Leadership Preparatory Academy 68.9 73.9 64.3 69.2 66.2 77.8
Museum School Avondale Estates 93.4 88.2 89.3 88.4 87.2 89.1
Peachtree Middle School 79.1 71.5 78.8 77.6 76.8 76.1
Tapestry Public Charter School 60.1 57.6 59.5
CCRPI Compared to State:
School Name 2012 2013 2014 2015 2016 2017
Chamblee Charter High School 79.3 76.7 79.1 86.8 86.1 81.6
DeKalb Academy of Technology and the Environment Charter School 77.7 68.6 66.8 66.5 60.0 76.4
DeKalb PATH Academy Charter School 75.3 80.0 78.3 76.1 78.0 76.2
DeKalb Preparatory Academy Charter 54.9 53.4 60.4 60.6 66.3
Destiny Achievers Academy of Excellence 36.6 49.5 38.2 50.7 47.9 54.3
GLOBE Academy Charter School I 51.1 76.4 88.4 82.8 87.8
International Community School 66.8 63.0 63.0 62.8 62.4 75.4
Leadership Preparatory Academy 68.9 73.9 64.3 69.2 66.2 77.8
Museum School Avondale Estates 93.4 88.2 89.3 88.4 87.2 89.1
Peachtree Middle School 79.1 71.5 78.8 77.6 76.8 76.1
Tapestry Public Charter School 60.1 57.6 59.5

Georgia Department of Education December 30, 2017 ● Page 47 of 106
35
45
55
65
75
85
95
2011‐12 2012‐13 2013‐14 2014‐15 2015‐16 2016‐17
CCRPI, 2012‐17Charter Schools in DeKalb County
Statewide
DeKalb County
Chamblee Charter High School
DeKalb Academy of Technology and the Environment Charter School
DeKalb PATH Academy Charter School
DeKalb Preparatory Academy Charter
Destiny Achievers Academy of Excellence
GLOBE Academy Charter School I
International Community School
Leadership Preparatory Academy
Museum School Avondale Estates
Peachtree Middle School
Tapestry Public Charter School
Georgia Department of Education December 30, 2017 ● Page 48 of 106
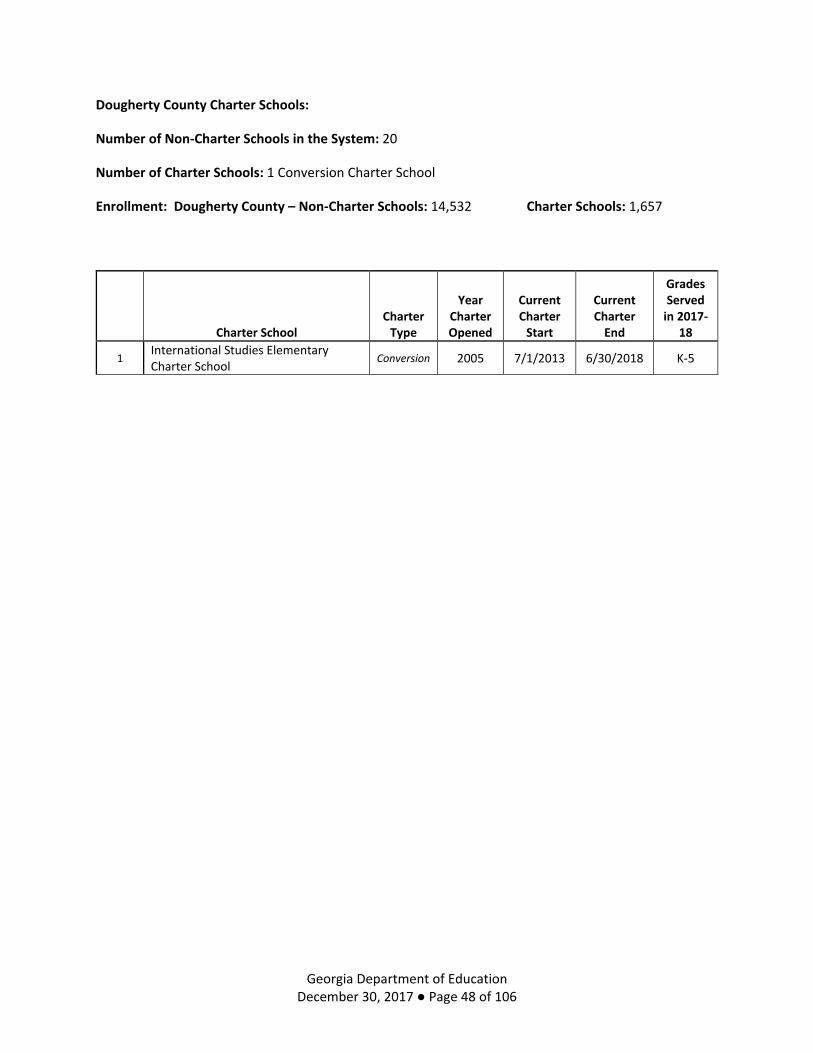
Dougherty County Charter Schools:
Number of Non‐Charter Schools in the System: 20
Number of Charter Schools: 1 Conversion Charter School
Enrollment: Dougherty County – Non‐Charter Schools: 14,532 Charter Schools: 1,657
Charter School Charter Type
Year Charter Opened
Current Charter Start
Current Charter End
Grades Served in 2017‐
18
1 International Studies Elementary Charter School
Conversion 2005 7/1/2013 6/30/2018 K‐5

Dougherty County (647) Enrollment by Race/Ethnic and Gender ‐ Fiscal Year 2018‐1 Data Report
ID Name Total White Black Hispanic Asian Indian Pacific Multi
# % # % # % # % # % # % # %
Dougherty County Schools 14,532 847 5.8% 12,983 89.3% 378 2.6% 63 0.4% 55 0.4%
* * 206 1.4%
5056
International Studies Elementary Charter School
1657 * * 293 77.1% 87 22.9% * * * * * * * *
2017‐18 Dougherty County Charter School Support Services
School Name % Special Education
% English Language Learner
% Free and Reduced Lunch
Dougherty County 10.1% 2.0% 49.8%
International Studies Elementary Charter School 5.6% 16.7% 34.5%

Beating the Odds:
School Name Clus‐ter 2012 2013 2014 2015 2016 2017
International Studies Elementary Charter School EM 65.5 69.7 73.3 68.2 78.0 66.1
CCRPI Compared to Previous Year:
School Name 2012 2013 2014 2015 2016 2017
International Studies Elementary Charter School 65.5 69.7 73.3 68.2 78.0 66.1
CCRPI Compared to District:
School Name 2012 2013 2014 2015 2016 2017
International Studies Elementary Charter School 65.5 69.7 73.3 68.2 78.0 66.1
CCRPI Compared to State:
School Name 2012 2013 2014 2015 2016 2017
International Studies Elementary Charter School 65.5 69.7 73.3 68.2 78.0 66.1

Georgia Department of Education December 30, 2017 ● Page 51 of 106
40
45
50
55
60
65
70
75
80
85
90
2011‐12 2012‐13 2013‐14 2014‐15 2015‐16 2016‐17
CCRPI, 2012‐17Charter Schools in Dougherty County
Statewide Dougherty County International Studies Elementary Charter School

Georgia Department of Education December 30, 2017 ● Page 52 of 106
Douglas County Charter Schools:
Number of Non‐Charter Schools in the System: 33
Number of Charter Schools: 1 Locally‐approved Charter School
Enrollment: Douglas County – Non‐Charter Schools: 26,441 Charter Schools: 747
Charter School Charter Type
Year Charter Opened
Current Charter Start
Current Charter End
Grades Served in 2017‐
18
1 Brighten Academy Start‐up 2006 7/1/2017 6/30/2022 K‐8
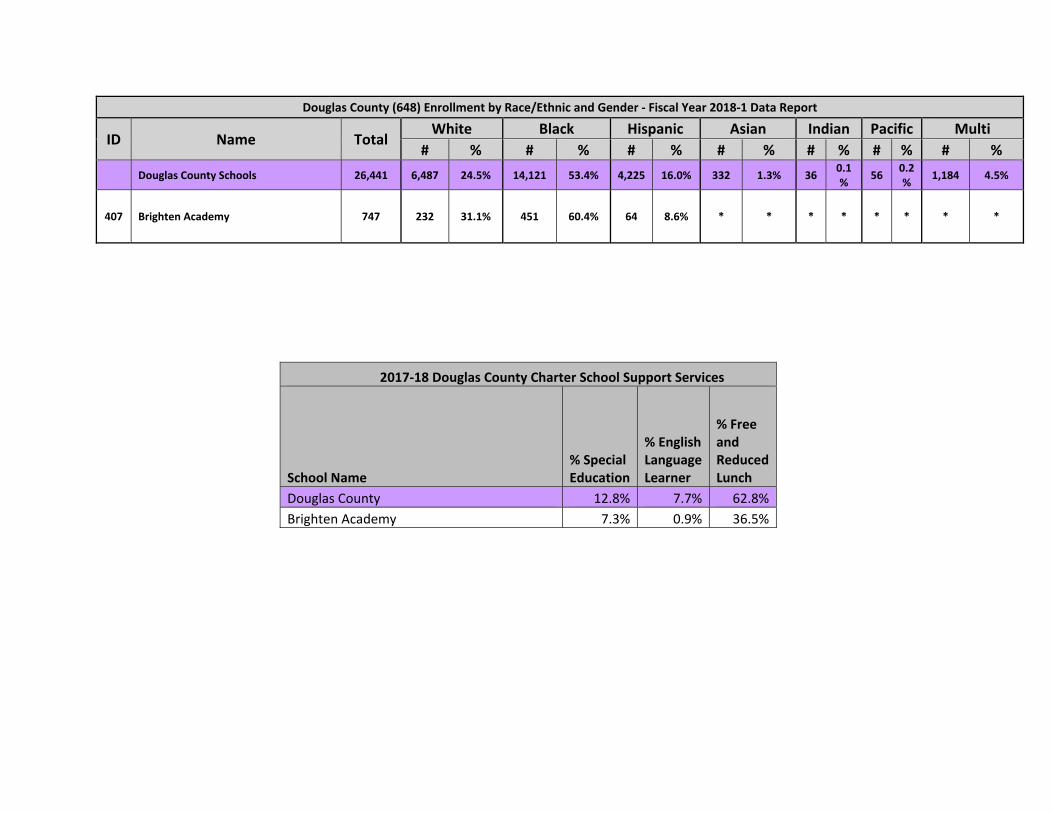
Douglas County (648) Enrollment by Race/Ethnic and Gender ‐ Fiscal Year 2018‐1 Data Report
ID Name Total White Black Hispanic Asian Indian Pacific Multi
# % # % # % # % # % # % # %
Douglas County Schools 26,441 6,487 24.5% 14,121 53.4% 4,225 16.0% 332 1.3% 36 0.1%
56 0.2%
1,184 4.5%
407 Brighten Academy 747 232 31.1% 451 60.4% 64 8.6% * * * * * * * *
2017‐18 Douglas County Charter School Support Services
School Name % Special Education
% English Language Learner
% Free and Reduced Lunch
Douglas County 12.8% 7.7% 62.8%
Brighten Academy 7.3% 0.9% 36.5%

Georgia Department of Education DRAFT December 18, 2017 * Page 54 of 106
Beating the Odds:
School Name Clus‐ter 2012 2013 2014 2015 2016 2017
Brighten Academy EM 85.1 85.1 75.0 76.9 77.1 77.1
CCRPI Compared to Previous Year:
School Name 2012 2013 2014 2015 2016 2017
Brighten Academy 85.1 85.1 75.0 76.9 77.1 77.1
CCRPI Compared to District:
School Name 2012 2013 2014 2015 2016 2017
Brighten Academy 85.1 85.1 75.0 76.9 77.1 77.1
CCRPI Compared to State:
School Name 2012 2013 2014 2015 2016 2017
Brighten Academy 85.1 85.1 75.0 76.9 77.1 77.1

Georgia Department of Education DRAFT December 18, 2017 * Page 55 of 106
40
45
50
55
60
65
70
75
80
85
90
2011‐12 2012‐13 2013‐14 2014‐15 2015‐16 2016‐17
CCRPI, 2012‐17Charter Schools in Douglas County
Statewide Douglas County Brighten Academy

Georgia Department of Education DRAFT December 18, 2017 * Page 56 of 106
Fulton County Charter Schools:
Number of Non‐Charter Schools in the System: 93
Number of Charter Schools: 11 Locally‐Approved Start‐up Charter Schools
Enrollment: Fulton County – Non‐Charter Schools: 90,173 Charter Schools: 8,996
Charter School Charter Type
Year Charter Opened
Current Charter Start
Current Charter End
Grades Served in 2017‐
18
1 Amana Academy Start‐up 2005 7/1/2014 6/30/2019 K‐8
2 Chattahoochee Hills Charter Start‐up 2013 7/1/2013 6/30/2018 K‐8
3 Fulton Academy of Science and Technology (FAST)
Start‐up 2016 7/1/2016 6/30/2021 K‐7
4 Hapeville Charter Career Academy Start‐up
2004 7/1/2009 6/30/2019 9‐12
5 Hapeville Charter Middle School Start‐up
2004 7/1/2009 6/30/2019 6‐8
6 KIPP South Fulton Academy Start‐up
2003 7/1/2014 6/30/2019 5‐8
7 Latin College Prep School Start‐up
2015 7/1/2015 6/30/2020 6‐8
8 Latin Grammar School Start‐up
2015 7/1/2015 6/30/2020 K‐3
9 Skyview Charter School (GA HS for Accelerated Learning)
Start‐up2016 7/1/2016 6/30/2021 9‐12
10 The Main Street Academy (2 sites) Start‐up
2010 7/1/2015 6/30/2020 K‐8

Georgia Department of Education DRAFT December 18, 2017 * Page 57 of 106
Fulton County Schools and Charter Schools Demographics:
Fulton County (660) Enrollment by Race/Ethnic and Gender ‐ Fiscal Year 2018‐1 Data Report
ID Name Total White Black Hispanic Asian Indian Pacific Multi
# % # % # % # % # % # % # %
Fulton County Schools 90,813 26,750 29.5% 36,487 40.2% 14,294 15.7% 10443 11.5% 103 0.1% 53 0.1% 2,683 3.0%
406 Amana Academy School 696 171 24.6% 279 40.1% 103 14.8% 106 15.2% * * * * 37 5.3%
215 Chattahoochee Hills Charter School
435 51 11.7% 384 88.3% * * * * * * * * * *
1319 Fulton Academy of Science and Technology
505 246 48.7% 101 20.0% * * 158 31.3% * * * * * *
118 Hapeville Charter Career Academy 657 * * 598 91.0% 59 9.0% * * * * * * * *
605 Hapeville Charter Middle School 470 * * 381 81.1% 89 18.9% * * * * * * * *
204 KIPP South Fulton Academy School
293 * * 293 100.0% * * * * * * * * * *
1313 Latin College Prep 277 * * 277 100.0% * * * * * * * * * *
1312 Latin Grammar School 292 * * 292 100.0% * * * * * * * * * *
116 Main Street Charter Academy 839 33 3.9 767 91.4% 39 4.6% * * * * * * * *
1320 Skyview High School 257 * * 257 100.0% * * * * * * * * * *

2017‐18 Fulton County Charter School Support Services
School Name % Special
Education
% English Language
Learner
% Free and Reduced
Lunch
Fulton County 10.1% 8.7% 45.3%
Amana Academy School 7.3% 19.7% 53.5%
Chattahoochee Hills Charter School 10.0% 0.0% 42.1%
Fulton Academy of Science and Technology 4.7% 6.6% 0.0%
Hapeville Charter Career Academy 12.6% 1.9% 73.0%
Hapeville Charter Middle School 6.4% 5.8% 85.1%
KIPP South Fulton Academy School 5.1% 2.1% 76.9%
Latin College Prep 6.8% 1.9% 53.4%
Latin Grammar School 3.7% 3.7% 73.2%
Main Street Charter Academy 5.3% 1.6% 55.9%
Skyview High School 10.9% 0.7% 36.2%

Georgia Department of Education December 30, 2017 ● Page 59 of 106
Beating the Odds:
School Name Clus‐ter 2012 2013 2014 2015 2016 2017
Amana Academy School EM 78.0 78.1 83.1 76.0 76.3 80.5
Chattahoochee Hills Charter School EM 56.0 66.3 63.7
Fulton Academy of Science and Technology (FAST) EM
Hapeville Charter Career Academy H 43.8 64.2 60.5 67.2 54.5 68.2
Hapeville Charter Middle School M 61.1 58.5 57.0 50.8 57.9 68.1
KIPP South Fulton Academy School EM 73.3 81.1 81.4 79.6 72.5 74.5
Latin Academy College Prep M 79.8 67.2
Main Street Charter Academy EM 63.7 75.2 73.9 72.2 61.5 73.3
CCRPI Compared to Previous Year:
School Name 2012 2013 2014 2015 2016 2017
Amana Academy School 78.0 78.1 83.1 76.0 76.3 80.5
Chattahoochee Hills Charter School 56.0 66.3 63.7
Fulton Academy of Science and Technology (FAST) 84.2
Fulton Leadership Academy 81.8 85.0 76.4 66.0 61.2 69.9
Hapeville Charter Career Academy 43.8 64.2 60.5 67.2 54.5 68.2
Hapeville Charter Middle School 61.1 58.5 57.0 50.8 57.9 68.1
KIPP South Fulton Academy School 73.3 81.1 81.4 79.6 72.5 74.5
Latin Academy College Prep 79.8 67.2
Main Street Charter Academy 63.7 75.2 73.9 72.2 61.5 73.3
CCRPI Compared to District:
School Name 2012 2013 2014 2015 2016 2017
Amana Academy School 78.0 78.1 83.1 76.0 76.3 80.5
Chattahoochee Hills Charter School 56.0 66.3 63.7
Fulton Academy of Science and Technology (FAST) 84.2
Fulton Leadership Academy 81.8 85.0 76.4 66.0 61.2 69.9
Hapeville Charter Career Academy 43.8 64.2 60.5 67.2 54.5 68.2
Hapeville Charter Middle School 61.1 58.5 57.0 50.8 57.9 68.1
KIPP South Fulton Academy School 73.3 81.1 81.4 79.6 72.5 74.5
Latin Academy College Prep 79.8 67.2
Main Street Charter Academy 63.7 75.2 73.9 72.2 61.5 73.3
Georgia Department of Education December 30, 2017 ● Page 60 of 106
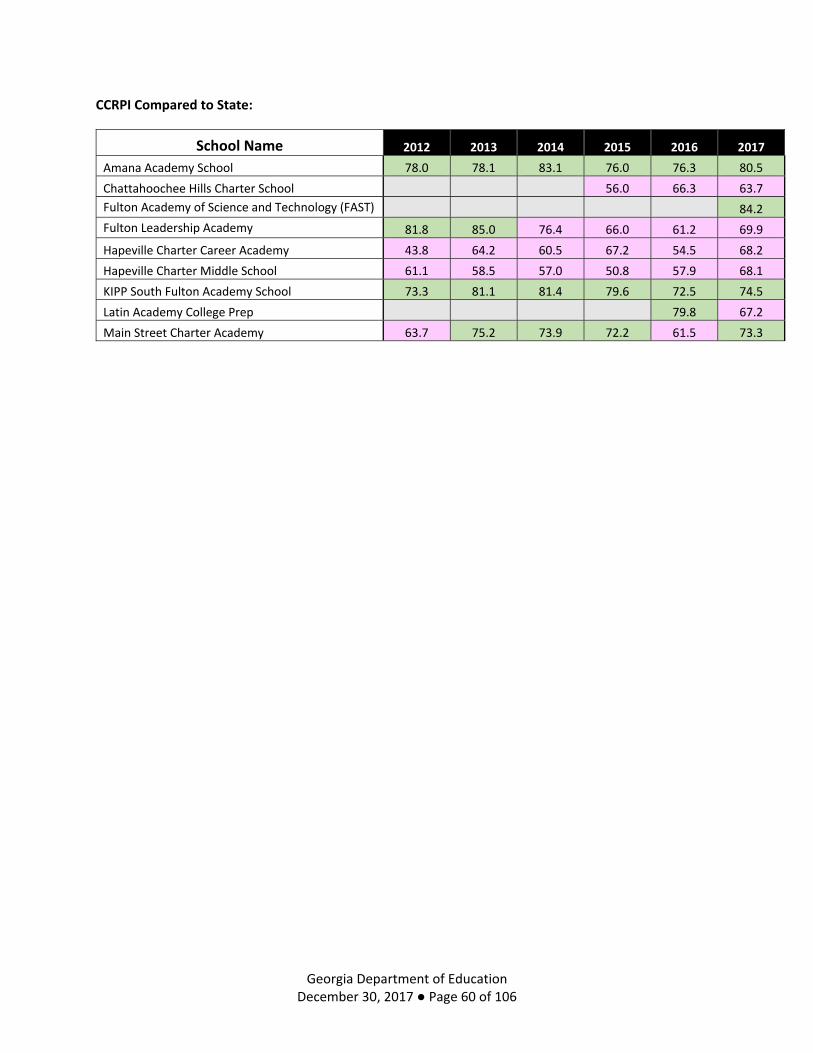
CCRPI Compared to State:
School Name 2012 2013 2014 2015 2016 2017
Amana Academy School 78.0 78.1 83.1 76.0 76.3 80.5
Chattahoochee Hills Charter School 56.0 66.3 63.7
Fulton Academy of Science and Technology (FAST) 84.2
Fulton Leadership Academy 81.8 85.0 76.4 66.0 61.2 69.9
Hapeville Charter Career Academy 43.8 64.2 60.5 67.2 54.5 68.2
Hapeville Charter Middle School 61.1 58.5 57.0 50.8 57.9 68.1
KIPP South Fulton Academy School 73.3 81.1 81.4 79.6 72.5 74.5
Latin Academy College Prep 79.8 67.2
Main Street Charter Academy 63.7 75.2 73.9 72.2 61.5 73.3

Georgia Department of Education December 30, 2017 ● Page 61 of 106
40
45
50
55
60
65
70
75
80
85
90
2011‐12 2012‐13 2013‐14 2014‐15 2015‐16 2016‐17
CCRPI, 2012‐17Charter Schools in Fulton County
Statewide Fulton County
Amana Academy School Chattahoochee Hills Charter School
Fulton Academy of Science and Technology (FAST) Hapeville Charter Career Academy
Hapeville Charter Middle School KIPP South Fulton Academy School
Latin Academy College Prep Main Street Charter Academy
Georgia Department of Education December 30, 2017 ● Page 62 of 106
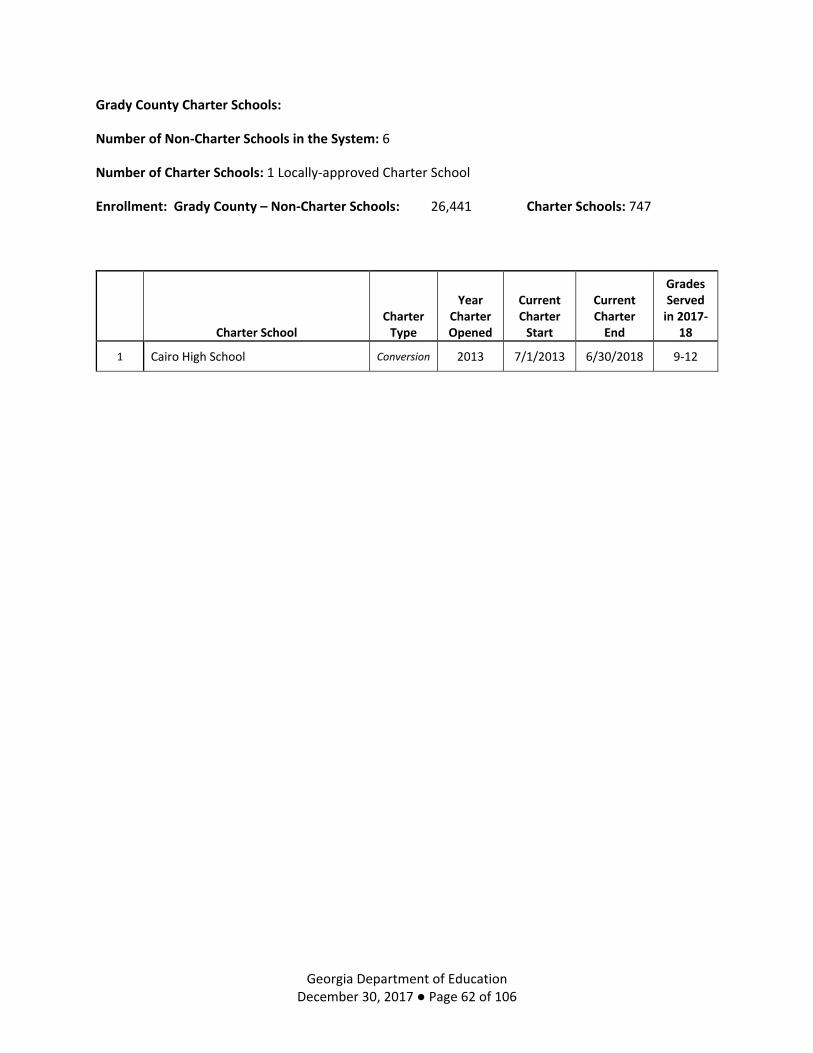
Grady County Charter Schools:
Number of Non‐Charter Schools in the System: 6
Number of Charter Schools: 1 Locally‐approved Charter School
Enrollment: Grady County – Non‐Charter Schools: 26,441 Charter Schools: 747
Charter School Charter Type
Year Charter Opened
Current Charter Start
Current Charter End
Grades Served in 2017‐
18
1 Cairo High School Conversion 2013 7/1/2013 6/30/2018 9‐12

Grady County (665) Enrollment by Race/Ethnic and Gender ‐ Fiscal Year 2018‐1 Data Report
ID Name Total White Black Hispanic Asian Indian Pacific Multi
# % # % # % # % # % # % # %
Grady County Schools 3,355 1,406 41.9% 1,125 33.5% 824 24.6% * * * * * * * *
1050
Cairo High School 696 540 45.3% 444 37.2% 208 17.6% * * * * * * * *
2017‐18 Grady County Charter School Support Services
School Name % Special Education
% English Language Learner
% Free and Reduced Lunch
Grady County 10.9% 11.3% 90.2%
Cairo High School 9.9% 2.6% 90.2%

Beating the Odds:
School Name Clus‐ter 2012 2013 2014 2015 2016 2017
Cairo High School H 62.0 65.5 53.9 61.0 64.9 60.7
CCRPI Compared to Previous Year:
School Name 2012 2013 2014 2015 2016 2017
Cairo High School 62.0 65.5 53.9 61.0 64.9 60.7
CCRPI Compared to District:
School Name 2012 2013 2014 2015 2016 2017
Cairo High School 62.0 65.5 53.9 61.0 64.9 60.7
CCRPI Compared to State:
School Name 2012 2013 2014 2015 2016 2017
Cairo High School 62.0 65.5 53.9 61.0 64.9 60.7

40
45
50
55
60
65
70
75
80
85
90
2011‐12 2012‐13 2013‐14 2014‐15 2015‐16 2016‐17
CCRPI, 2012‐17Charter Schools in Grady County
Statewide Grady County Cairo High School
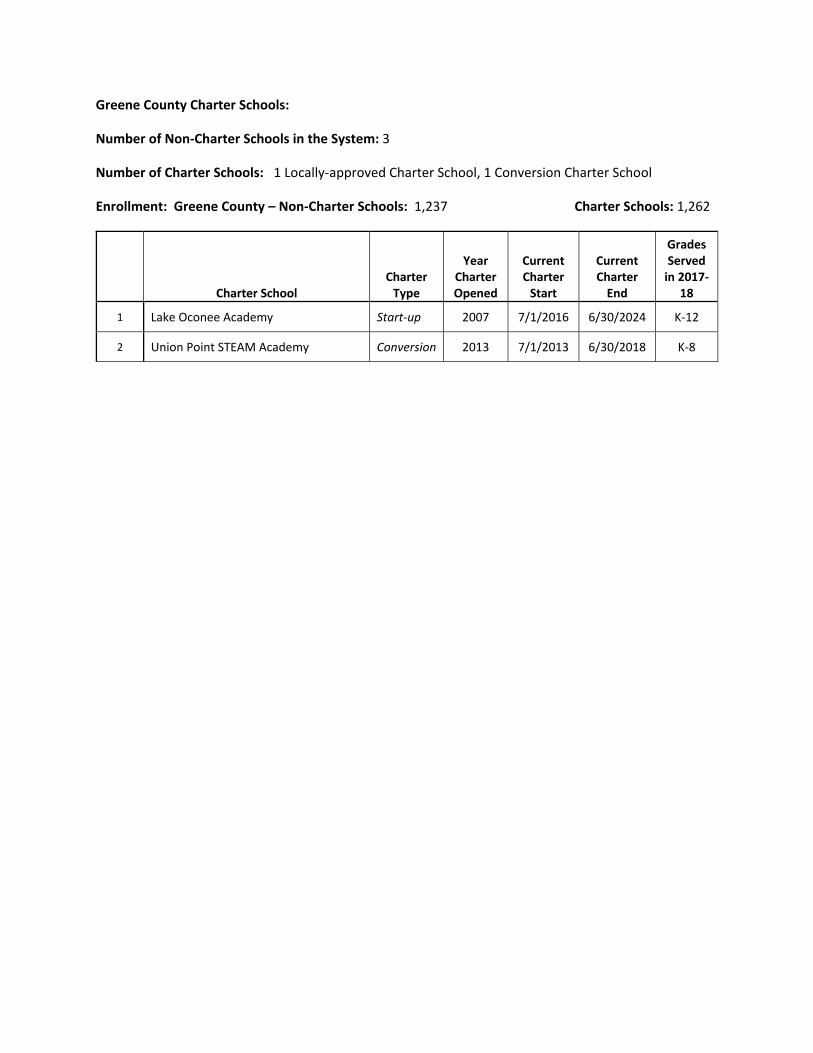
Greene County Charter Schools:
Number of Non‐Charter Schools in the System: 3
Number of Charter Schools: 1 Locally‐approved Charter School, 1 Conversion Charter School
Enrollment: Greene County – Non‐Charter Schools: 1,237 Charter Schools: 1,262
Charter School Charter Type
Year Charter Opened
Current Charter Start
Current Charter End
Grades Served in 2017‐
18
1 Lake Oconee Academy Start‐up 2007 7/1/2016 6/30/2024 K‐12
2 Union Point STEAM Academy Conversion 2013 7/1/2013 6/30/2018 K‐8

Greene County Schools and Charter Schools Demographics:
Greene County (666) Enrollment by Race/Ethnic and Gender - Fiscal Year 2018-1 Data Report
ID Name Total White Black Hispanic Asian Indian Pacific Multi
# % # % # % # % # % # % # %
Greene County 1,237 15 9.3% 902 72.9% 178 14.4% * * * * * * 42 3.4%
109 Lake Oconee Academy 944 707 74.9% 98 10.4% 98 10.4% * * * * * * 41 4.3%
201 Union Point STEAM Academy 318 87 27.4% 178 56.3% 52 16.4% * * * * * * * *
2017‐18 Greene County Charter School Support Services
School Name % Special
Education
% English
Language Learner
% Free and
Reduced Lunch
Greene County 11.1% 5.0% 70.6%
Lake Oconee Academy 8.6% 3.3% 25.2%
Union Point STEAM Academy 14.5% 8.4% 97.9%

Beating the Odds:
School Name Clus‐ter 2012 2013 2014 2015 2016 2017
LAKE OCONEE CHARTER EMH 90.4 92.3 91.2 84.2 87.0 83.3
Union Point Elementary EM 50.2 60.5 74.6 69.4 55.1 70.8
CCRPI Compared to Previous Year:
School Name 2012 2013 2014 2015 2016 2017
LAKE OCONEE CHARTER 90.4 92.3 91.2 84.2 87.0 83.3
Union Point Elementary 50.2 60.5 74.6 69.4 55.1 70.8
CCRPI Compared to District:
School Name 2012 2013 2014 2015 2016 2017
LAKE OCONEE CHARTER 90.4 92.3 91.2 84.2 87.0 83.3
Union Point Elementary 50.2 60.5 74.6 69.4 55.1 70.8
CCRPI Compared to State:
School Name 2012 2013 2014 2015 2016 2017
LAKE OCONEE CHARTER 90.4 92.3 91.2 84.2 87.0 83.3
Union Point Elementary 50.2 60.5 74.6 69.4 55.1 70.8

40
50
60
70
80
90
2011‐12 2012‐13 2013‐14 2014‐15 2015‐16 2016‐17
CCRPI, 2012‐17Charter Schools in Greene County
Statewide Greene County LAKE OCONEE CHARTER Union Point Elementary

Gwinnett County Charter Schools:
Number of Non‐Charter Schools in the System: 131
Number of Charter Schools: 2 Locally‐approved Charter Schools
Enrollment: Gwinnett County – Non‐Charter Schools: 177,885 Charter Schools: 783
Charter School Charter Type
Year Charter Opened
Current Charter Start
Current Charter End
Grades Served in 2017‐
18
1 New Life Academy of Excellence Start‐up 2011 7/1/2012 6/30/2019 K‐8
2 North Metro Academy for Performing Arts
Start‐up 2007 7/1/2014 6/30/2019 K‐8

Gwinnett County Schools and Charter Schools Demographics:
Gwinnett County (667) Enrollment by Race/Ethnic and Gender - Fiscal Year 2018-1 Data Report
ID Name Total White Black Hispanic Asian Indian Pacific Multi
# % # % # % # % # % # % # %
Gwinnett County 177,885 41,359 23.3% 56,363 31.7% 54,130 30.4% 18,729 10.5% 331 0.2% 173 0.1% 6,800 3.8%
1020 New Life Academy of Excellence 539 41 7.6% 386 71.6% 112 20.8% * * * * * * * *
1215 North Metro Academy of Performing Arts
244 * * 205 84.0% 39 16.0% * * * * * * * *
2017‐18 Gwinnett County Charter School Support Services
School Name % Special
Education
% English
Language Learner
% Free and
Reduced Lunch
Gwinnett County 12.6% 17.1% 55.1%
New Life Academy of Excellence 5.4% 14.0% 48.7%
North Metro Academy of Performing Arts 5.4% 8.5% 74.5%

Beating the Odds:
School Name Clus‐ter 2012 2013 2014 2015 2016 2017
New Life Academy of Excellence EM 82.2 82.1 78.7 64.3 77.4 74.8
North Metro Academy of Performing Arts EM 45.9 53.6 67.5
CCRPI Compared to Previous Year:
School Name 2012 2013 2014 2015 2016 2017
New Life Academy of Excellence 82.2 82.1 78.7 64.3 77.4 74.8
North Metro Academy of Performing Arts 45.9 53.6 67.5
CCRPI Compared to District:
School Name 2012 2013 2014 2015 2016 2017
New Life Academy of Excellence 82.2 82.1 78.7 64.3 77.4 74.8
North Metro Academy of Performing Arts 45.9 53.6 67.5
CCRPI Compared to State:
School Name 2012 2013 2014 2015 2016 2017
New Life Academy of Excellence 82.2 82.1 78.7 64.3 77.4 74.8
North Metro Academy of Performing Arts 45.9 53.6 67.5

40
45
50
55
60
65
70
75
80
85
90
2011‐12 2012‐13 2013‐14 2014‐15 2015‐16 2016‐17
CCRPI, 2012‐17Charter Schools in Gwinnett County
Statewide Gwinnett County
New Life Academy of Excellence North Metro Academy of Performing Arts

Henry County Charter Schools:
Number of Non‐Charter Schools in the System: 47
Number of Charter Schools: 2 Conversion Charter Schools
Enrollment: Henry County – Non‐Charter Schools: 40,922 Charter Schools: 1,012
Charter School Charter Type
Year Charter Opened
Current Charter Start
Current Charter End
Grades Served in 2017‐
18
1 Hampton Elementary Conversion 2014 7/1/2014 6/30/2019 K‐5
2 Hickory Flat Conversion 2013 7/1/2013 6/30/2018 K‐5

Henry County Schools and Charter Schools Demographics:
Henry County (675) Enrollment by Race/Ethnic and Gender ‐ Fiscal Year 2018‐1 Data Report
ID Name Total White Black Hispanic Asian Indian Pacific Multi
# % # % # % # % # % # % # %
Henry County 40,922 12,144 29.7% 21,652 52.9% 4,019 9.8% 1,130 2.8% 73 0.2% 48 0.1% 1,856 4.5%
2050 Hampton Elementary School
338 116 34.3% 170 50.0% 52 15.4% * * * * * * * *
297 Hickory Flat Elementary School
674 55 8.2% 464 68.8% 59 8.8% 59 8.8 * * * * 37 5.5%
2017‐18 Henry County Charter School Support Services
School Name % Special
Education
% English
Language Learner
% Free and
Reduced Lunch
Henry County 13.3% 2.4% 52.2%
Hickory Flat Elementary School 8.6% 3.7% 58.4%
Hampton Elementary School 8.8% 7.2% 77.0%

Beating the Odds:
School Name Clus‐ter 2012 2013 2014 2015 2016 2017
Hampton Elementary School E 73.5 72.5 62.9 59.1 62.2 66.4
Hickory Flat Elementary School E 82.5 76.6 75.2 75.5 66.8 75.5
CCRPI Compared to Previous Year:
School Name 2012 2013 2014 2015 2016 2017
Hampton Elementary School 73.5 72.5 62.9 59.1 62.2 66.4
Hickory Flat Elementary School 82.5 76.6 75.2 75.5 66.8 75.5
CCRPI Compared to District:
School Name 2012 2013 2014 2015 2016 2017
Hampton Elementary School 73.5 72.5 62.9 59.1 62.2 66.4
Hickory Flat Elementary School 82.5 76.6 75.2 75.5 66.8 75.5
CCRPI Compared to State:
School Name 2012 2013 2014 2015 2016 2017
Hampton Elementary School 73.5 72.5 62.9 59.1 62.2 66.4
Hickory Flat Elementary School 82.5 76.6 75.2 75.5 66.8 75.5

Georgia Department of Education December 30, 2017 ● Page 77 of 106
40
45
50
55
60
65
70
75
80
85
2011‐12 2012‐13 2013‐14 2014‐15 2015‐16 2016‐17
CCRPI, 2012‐17Charter Schools in Henry County
Statewide Henry County
Hampton Elementary School Hickory Flat Elementary School

Georgia Department of Education December 30, 2017 ● Page 78 of 106
Mitchell County Charter Schools:
Number of Non‐Charter Schools in the System: 4
Number of Charter Schools: 1 Locally‐approved Charter School
Enrollment: Mitchell County – Non‐Charter Schools: 1,374 Charter Schools: 761
Charter School Charter Type
Year Charter Opened
Current Charter Start
Current Charter End
Grades Served in 2017‐
18
1 Baconton Community Charter School Start‐up 2000 7/1/2016 6/30/2021 PK‐12

Mitchell County (701) Enrollment by Race/Ethnic and Gender ‐ Fiscal Year 2018‐1 Data Report
ID Name Total White Black Hispanic Asian Indian Pacific Multi
# % # % # % # % # % # % # %
Mitchell County 1,374 122 8.9% 1,144 83.3% 108 7.9% * * * * * * * *
105 Baconton Community Charter School
761 577 75.8% 144 18.9% 40 5.3% * * * * * * * *
2017‐18 Mitchell County Charter School Support Services
School Name % Special Education
% English Language Learner
% Free and Reduced Lunch
Mitchell County 10.0% 1.7% 97.5%
Baconton Community Charter School 9.3% 0.6% 97.5%
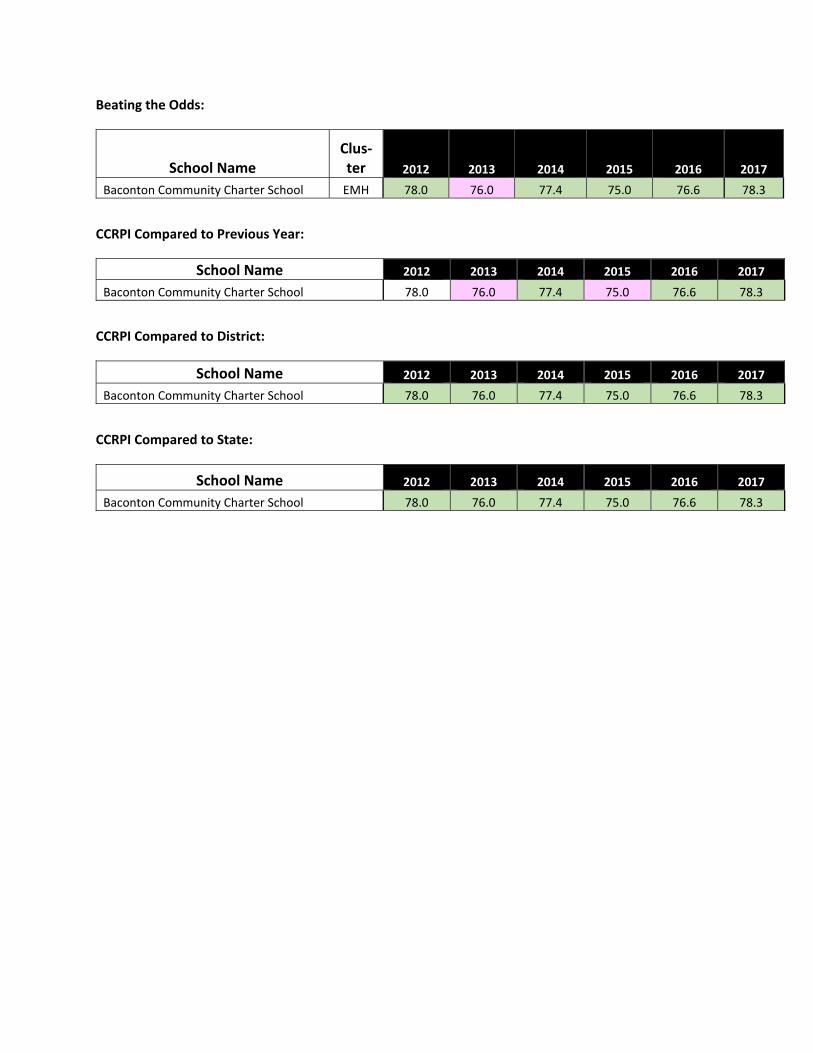
Beating the Odds:
School Name Clus‐ter 2012 2013 2014 2015 2016 2017
Baconton Community Charter School EMH 78.0 76.0 77.4 75.0 76.6 78.3
CCRPI Compared to Previous Year:
School Name 2012 2013 2014 2015 2016 2017
Baconton Community Charter School 78.0 76.0 77.4 75.0 76.6 78.3
CCRPI Compared to District:
School Name 2012 2013 2014 2015 2016 2017
Baconton Community Charter School 78.0 76.0 77.4 75.0 76.6 78.3
CCRPI Compared to State:
School Name 2012 2013 2014 2015 2016 2017
Baconton Community Charter School 78.0 76.0 77.4 75.0 76.6 78.3

40
45
50
55
60
65
70
75
80
85
90
2011‐12 2012‐13 2013‐14 2014‐15 2015‐16 2016‐17
CCRPI, 2012‐17Charter Schools in Mitchell County
Statewide Mitchell County Baconton Community Charter School

Muscogee County Charter Schools:
Number of Non‐Charter Schools in the System: 52
Number of Charter Schools: 2 Conversion Charter Schools
Enrollment: Muscogee County – Non‐Charter Schools: 30,909 Charter Schools: 854
Charter School Charter Type
Year Charter Opened
Current Charter Start
Current Charter End
Grades Served in 2017‐
18
1 Clubview Elementary School Conversion 2006 7/1/2016 6/30/2021 K‐5
2 Wynnton Arts Academy Conversion 2008 7/1/2008 6/30/2018 K‐5

Muscogee County Schools and Charter Schools Demographics:
Muscogee County (706) Enrollment by Race/Ethnic and Gender ‐ Fiscal Year 2018‐1 Data Report
ID Name Total White Black Hispanic Asian Indian Pacific Multi
# % # % # % # % # % # % # %
Muscogee County 30,909 7,564 24.5% 18,092 58.5% 2,723 8.8% 814 2.6% 60 0.2% 73 0.2% 1,583 5.1%
2054 Clubview Elementary School 430 279 64.9% 151 35.1% * * * * * * * * * *
4070 Wynnton Elementary School 424 96 22.6% 328 77.5% * * * * * * * * * *
2017‐18 Muscogee County Charter School Support Services
School Name % Special
Education
% English
Language Learner
% Free and
Reduced Lunch
Muscogee County 14.5% 3.5% 78.1%
Clubview Elementary School 11.0% 0.4% 38.3%
Wynnton Elementary School 15.9% 0.4% 94.5%

Beating the Odds:
School Name Clus‐ter 2012 2013 2014 2015 2016 2017
Clubview Elementary School E 78.4 80.9 83.3 74.0 75.2 77.4
Wynnton Elementary School E 65.0 65.6 62.5 59.1 63.1 70.7
CCRPI Compared to Previous Year:
School Name 2012 2013 2014 2015 2016 2017
Clubview Elementary School 78.4 80.9 83.3 74.0 75.2 77.4
Wynnton Elementary School 65.0 65.6 62.5 59.1 63.1 70.7
CCRPI Compared to District:
School Name 2012 2013 2014 2015 2016 2017
Clubview Elementary School 78.4 80.9 83.3 74.0 75.2 77.4
Wynnton Elementary School 65.0 65.6 62.5 59.1 63.1 70.7
CCRPI Compared to State:
School Name 2012 2013 2014 2015 2016 2017
Clubview Elementary School 78.4 80.9 83.3 74.0 75.2 77.4
Wynnton Elementary School 65.0 65.6 62.5 59.1 63.1 70.7

Georgia Department of Education December 30, 2017 ● Page 85 of 106
40
45
50
55
60
65
70
75
80
85
90
2011‐12 2012‐13 2013‐14 2014‐15 2015‐16 2016‐17
CCRPI, 2012‐17Charter Schools in Muscogee County
Statewide Muscogee County Clubview Elementary School Wynnton Elementary School
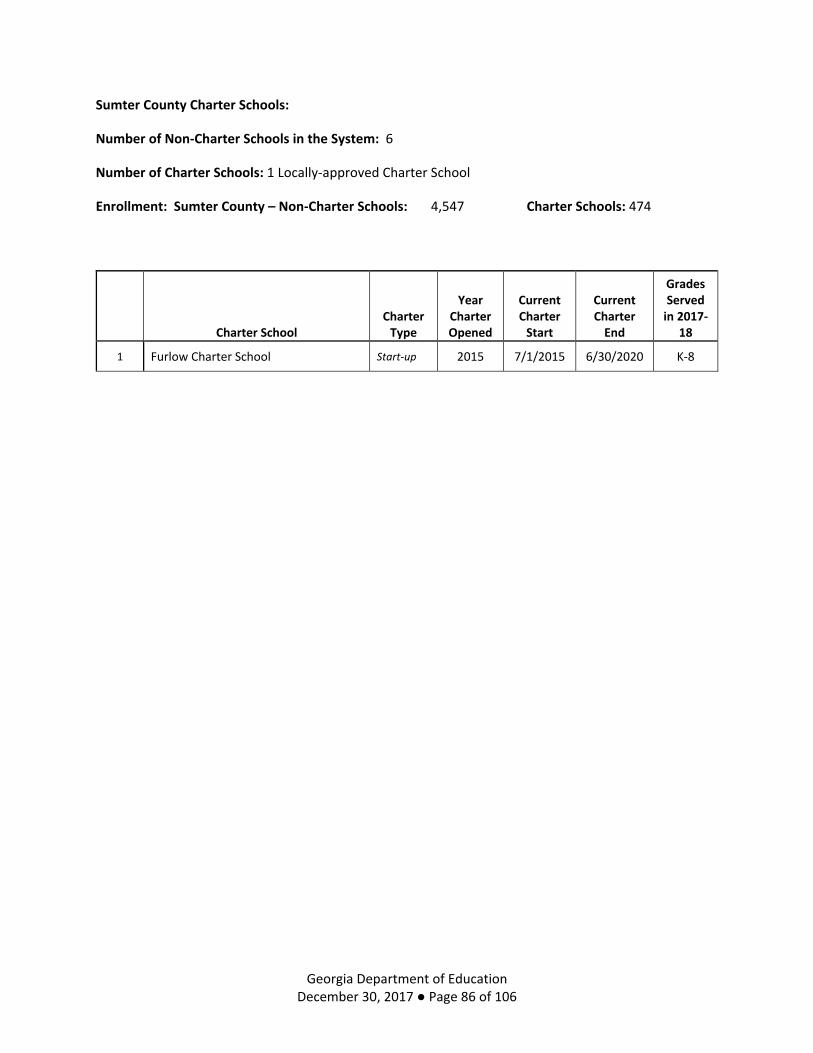
Georgia Department of Education December 30, 2017 ● Page 86 of 106
Sumter County Charter Schools:
Number of Non‐Charter Schools in the System: 6
Number of Charter Schools: 1 Locally‐approved Charter School
Enrollment: Sumter County – Non‐Charter Schools: 4,547 Charter Schools: 474
Charter School Charter Type
Year Charter Opened
Current Charter Start
Current Charter End
Grades Served in 2017‐
18
1 Furlow Charter School Start‐up 2015 7/1/2015 6/30/2020 K‐8

Sumter County (729) Enrollment by Race/Ethnic and Gender ‐ Fiscal Year 2018‐1 Data Report
ID Name Total White Black Hispanic Asian Indian Pacific Multi
# % # % # % # % # % # % # %
Sumter County 4,073 337 8.3% 3,181 78.1% 461 11.3% * * * * * * 94 2.3%
396 Furlow Charter School 474 311 65.6% 95 20.0% 68 14.3% * * * * * * * *
2017‐18 Sumter County Charter School Support Services
School Name % Special Education
% English Language Learner
% Free and Reduced Lunch
Sumter County 12.2% 6.2% 99.0%
Furlow Charter School 8.6% 5.5% 100.0%

Beating the Odds:
School Name Clus‐ter 2012 2013 2014 2015 2016 2017
Furlow Charter School EM 53.5 69.8
CCRPI Compared to Previous Year:
School Name 2012 2013 2014 2015 2016 2017
Furlow Charter School 53.5 69.8
CCRPI Compared to District:
School Name 2012 2013 2014 2015 2016 2017
Furlow Charter School 53.5 69.8
CCRPI Compared to State:
School Name 2012 2013 2014 2015 2016 2017
Furlow Charter School 53.5 69.8

Georgia Department of Education December 30, 2017 ● Page 89 of 106
40
45
50
55
60
65
70
75
80
85
90
2015‐16 2016‐17
CCRPI, 2016‐17Charter Schools in Sumter County
Statewide Sumter County Furlow Charter School

Georgia Department of Education December 30, 2017 ● Page 90 of 106
Thomas County Charter Schools:
Number of Non‐Charter Schools in the System: 5
Number of Charter Schools: 1 Locally‐approved Charter School
Enrollment: Thomas County – Non‐Charter Schools: 5,610 Charter Schools: 194
Charter School Charter Type
Year Charter Opened
Current Charter Start
Current Charter End
Grades Served in 2017‐
18
1 Bishop Hall Charter School Start‐up 1999 7/1/2014 6/30/2019 9‐12

Thomas County (736) Enrollment by Race/Ethnic and Gender ‐ Fiscal Year 2018‐1 Data Report
ID Name Total White Black Hispanic Asian Indian Pacific Multi
# % # % # % # % # % # % # %
Thomas County 5,610 2,960 52.8% 2,005 35.7% 398 7.1% 43 0.8% * * * * 204 3.6%
100 Bishop Hall Charter School 194 148 76.3% 46 23.0% * * * * * * * * * *
2017‐18 Thomas County Charter School Support Services
School Name % Special Education
% English Language Learner
% Free and Reduced Lunch
Thomas County 16.2% 1.6% 76.8%
Bishop Hall Charter School 12.0% 1.9% 69.0%

Georgia Department of Education DRAFT December 18, 2017 * Page 92 of 106
Beating the Odds:
School Name Clus‐ter 2012 2013 2014 2015 2016 2017
Bishop Hall Charter School MH 36.6 27.8 41.2 45.2 50.0 56.9
CCRPI Compared to Previous Year:
School Name 2012 2013 2014 2015 2016 2017
Bishop Hall Charter School 36.6 27.8 41.2 45.2 50.0 56.9
CCRPI Compared to District:
School Name 2012 2013 2014 2015 2016 2017
Bishop Hall Charter School 36.6 27.8 41.2 45.2 50.0 56.9
CCRPI Compared to State:
School Name 2012 2013 2014 2015 2016 2017
Bishop Hall Charter School 36.6 27.8 41.2 45.2 50.0 56.9

Georgia Department of Education DRAFT December 18, 2017 * Page 93 of 106
25
35
45
55
65
75
2011‐12 2012‐13 2013‐14 2014‐15 2015‐16 2016‐17
CCRPI, 2012‐17Charter Schools in Thomas County
Statewide Thomas County Bishop Hall Charter School
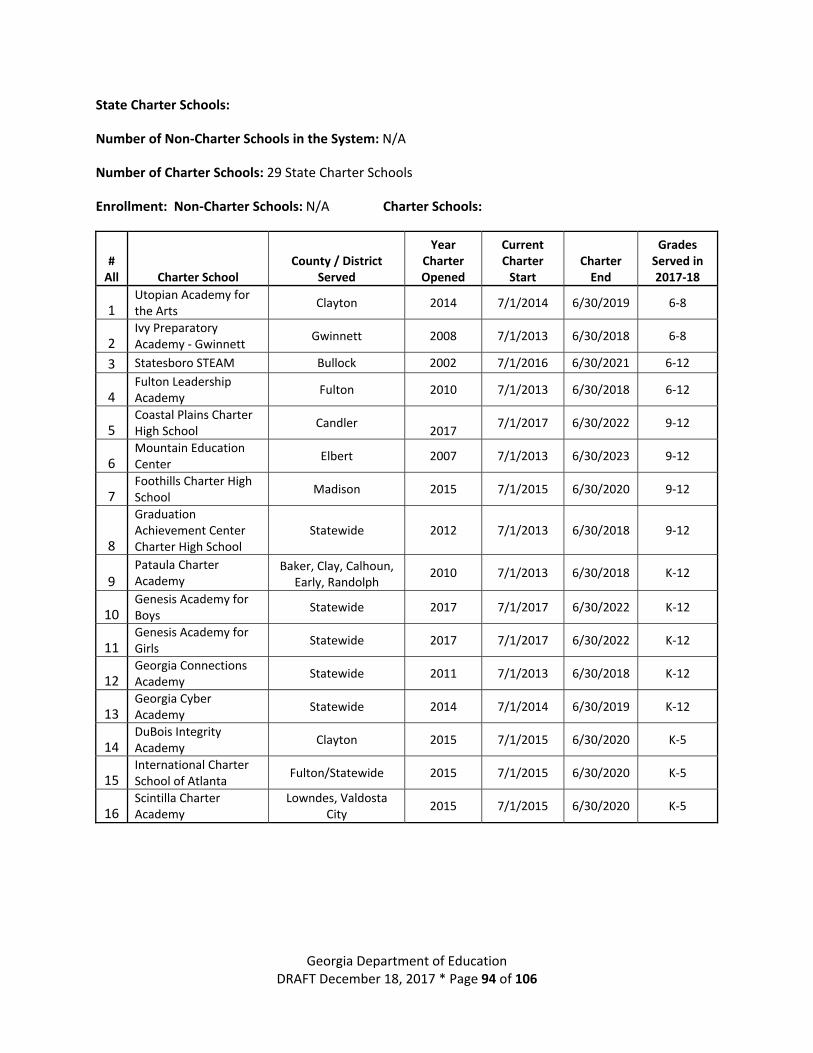
Georgia Department of Education DRAFT December 18, 2017 * Page 94 of 106
State Charter Schools:
Number of Non‐Charter Schools in the System: N/A
Number of Charter Schools: 29 State Charter Schools
Enrollment: Non‐Charter Schools: N/A Charter Schools:
# All Charter School
County / District Served
Year Charter Opened
Current Charter Start
Charter End
Grades Served in 2017‐18
1 Utopian Academy for the Arts
Clayton 2014 7/1/2014 6/30/2019 6‐8
2 Ivy Preparatory Academy ‐ Gwinnett
Gwinnett 2008 7/1/2013 6/30/2018 6‐8
3 Statesboro STEAM Bullock 2002 7/1/2016 6/30/2021 6‐12
4 Fulton Leadership Academy
Fulton 2010 7/1/2013 6/30/2018 6‐12
5 Coastal Plains Charter High School
Candler 2017
7/1/2017 6/30/2022 9‐12
6 Mountain Education Center
Elbert 2007 7/1/2013 6/30/2023 9‐12
7 Foothills Charter High School
Madison 2015 7/1/2015 6/30/2020 9‐12
8
Graduation Achievement Center Charter High School
Statewide 2012 7/1/2013 6/30/2018 9‐12
9 Pataula Charter Academy
Baker, Clay, Calhoun, Early, Randolph
2010 7/1/2013 6/30/2018 K‐12
10 Genesis Academy for Boys
Statewide 2017 7/1/2017 6/30/2022 K‐12
11 Genesis Academy for Girls
Statewide 2017 7/1/2017 6/30/2022 K‐12
12 Georgia Connections Academy
Statewide 2011 7/1/2013 6/30/2018 K‐12
13 Georgia Cyber Academy
Statewide 2014 7/1/2014 6/30/2019 K‐12
14 DuBois Integrity Academy
Clayton 2015 7/1/2015 6/30/2020 K‐5
15 International Charter School of Atlanta
Fulton/Statewide 2015 7/1/2015 6/30/2020 K‐5
16 Scintilla Charter Academy
Lowndes, Valdosta City
2015 7/1/2015 6/30/2020 K‐5

Georgia Department of Education DRAFT December 18, 2017 * Page 95 of 106
# All Charter School
County / District Served
Year Charter Opened
Current Charter Start
Charter End
Grades Served in 2017‐18
17 Southwest Georgia STEM
Randolph/Statewide 2016 7/1/2016 6/30/2021 K‐5
18 Brookhaven Innovation Academy
DeKalb/Statewide 2016 7/1/2016 6/30/2021 K‐6
19
School for Arts‐Infused Learning (SAIL)
Statewide 2017 7/1/2017 6/30/2022
K‐6
20 Liberty Tech Charter School
Fayette/Statewide 2016 7/1/2016 6/30/2021 3‐8
21 Atlanta Heights Charter School
APS 2010 7/1/2013 6/30/2018 K‐8
22 Cherokee Charter Academy
Cherokee 2011 7/1/2013 6/30/2018 K‐8
23 International Academy of Smyrna
Cobb 2006 7/1/2017 6/30/2020 K‐8
24 Coweta Charter Academy
Coweta 2010 7/1/2013 6/30/2018 K‐8
25 Odyssey School Coweta 2004 7/1/2014 6/30/2019 K‐8
26 Ivy Preparatory Academy at Kirkwood
DeKalb 2011 7/1/2013 6/30/2018 K‐8
27 Resurgence Hall Fulton 2017 7/1/2017 6/30/2022 K‐8
28
Georgia School for Innovation & the Classics
Richmond/statewide 2015 7/1/2015 6/30/2020 K‐8
29 Cirrus Academy Charter School
Statewide 2015 7/1/2015 6/30/2020 K‐8

Georgia Department of Education DRAFT December 18, 2017 * Page 96 of 106
State Charter Schools Demographics:
State Commission Enrollment by Race/Ethnic and Gender ‐ Fiscal Year 2018‐1 Data Report
ID Name Total White Black Hispanic Asian Indian Pacific Multi
# % # % # % # % # % # % # %
7830410 Atlanta Heights Charter School
724 * *
724 100.0% * * * * * * * * * *
7830613 Brookhaven Innovation Academy
459
220 47.9%
114 24.8% 86 18.7% * * * * * * 39 8.5%
7820212 Cherokee Charter Academy
803
593 73.8%
141 17.6% 69 8.6% * * * * * * * *
7830611 Cirrus Charter Academy
414 * *
414 100.0% * * * * * * * * * *
7820618 Coastal Plains Charter High School
629
361 57.4%
206 32.8% 62 9.9% * * * * * * * *
7830610 Coweta Charter Academy
686
541 78.9%
105 15.3% * * * * * * * * 40 5.8%
7820617 Dubois Integrity Academy
680 * *
680 100.0% * * * * * * * * * *
7820613 Foothills Charter High School
1,213
674 55.6%
409 33.7% 130 10.7% * * * * * * * *
7830310 Fulton Leadership Academy
345 * *
345 100.0% * * * * * * * * * *
7830615 Genesis Innovation Academy for Boys
220 * *
202 91.8% 18 8.2% * * * * * * * *
7830616 Genesis Innovation Academy for Girls
162 * *
162 100.0% * * * * * * * * * *
7820412 Georgia Connections Academy
3,868
1,931 49.9%
1,343 34.7% 308 8.0% 76 2.0% * * * * 210 5.4%
7820120 Georgia Cyber Academy
14,262
6,799 47.7%
5,088 35.7%
1,158 8.1% 273 1.9% 47 0.3% * * 897 6.3%
7820616 Georgia School for Innovation and the Classics
684
509 74.4%
139 20.3% 36 5.3% * * * * * * * *
7820119 Graduation Achievement Center Charter High School
1,584
374 23.6%
971 61.3% 191 12.1% * * * * * * 48 3.0%
7830619 International Academy of Smyrna
506 * *
405 80.0% 101 20.0% * * * * * * * *
7820614 International Charter School of Atlanta
589
250 42.4%
178 30.2% 111 18.8% * * * * * * 50 8.5%

State Commission Enrollment by Race/Ethnic and Gender ‐ Fiscal Year 2018‐1 Data Report
ID Name Total White Black Hispanic Asian Indian Pacific Multi
# % # % # % # % # % # % # %
7830110 Ivy Preparatory Academy At Gwinnett
100 * *
79 79.0% 21 21.0% * * * * * * * *
7820612 Ivy Preparatory Academy, Inc
497 * *
497 100.0% * * * * * * * * * *
7830614 Liberty Tech Charter Academy
369
258 69.9%
111 30.1% * * * * * * * * * *
7820108 Mountain Education Charter High School
2,191
1,775 81.0%
83 3.8% 333 15.2% * * * * * * * *
7820110 Odyssey Charter School
295
182 61.7%
113 38.3% * * * * * * * * * *
7830210 Pataula Charter Academy
503
386 76.7%
117 23.3% * * * * * * * * * *
7830617 Resurgence Hall Charter School
112 * *
112 100.0% * * * * * * * * * *
7830618
SAIL Charter Academy ‐ School for Arts‐Infused Learning
403
293 72.7%
74 18.4% 36 8.9% * * * * * * * *
7820615 Scintilla Charter Academy
442
241 54.5%
201 45.5% * * * * * * * * * *
7830612 Southwest Georgia S.T.E.M. Charter Academy
154
154 100.0% * * * * * * * * * * * *
7830103 Statesboro STEAM Academy
137
114 83.2% 23 16.8% * * * * * * * * * *
7820121 Utopian Academy for the Arts Charter School
236 * *
236 100.0% * * * * * * * * * *

Georgia Department of Education DRAFT December 18, 2017 * Page 98 of 106
School Name % Special Education
% English Language Learner
% Free and Reduced Lunch School Name
% Special Education
% English Language Learner
% Free and Reduced Lunch
State of Georgia 12.1% 7.9% 60.6% International Charter School of Atlanta 4.6% 8.0% 1.1%
Atlanta Heights Charter School 8.5% 1.6% 92.3% International Academy of Smryna 3.8% 15.3% 61.4%
Brookhaven Innovation Academy 9.4% 11.3% 10.2% Ivy Preparatory Academy At Gwinnett 9.4% 0.9% 44.3%
Cherokee Charter Academy 12.2% 6.1% 14.5% Ivy Preparatory Academy, Inc 4.7% 0.0% 73.2%
Cirrus Charter Academy 4.8% 0.0% 100.0% Liberty Tech Charter Academy 8.2% 0.0% 16.4%
Coastal Plains Charter High School ‐ Candler Campus 12.1% 1.6% 35.2%
Mountain Education Charter High School 14.1% 2.8% 59.3%
Coweta Charter Academy 9.7% 0.3% 18.1% Odyssey Charter School 13.4% 4.5% 41.9%
Dubois Integrity Academy 10.6% 3.0% 0.0% Pataula Charter Academy 9.0% 1.4% 29.7%
Foothills Charter High School (Central Office ‐ Madison) 15.3% 1.7% 34.8% Resurgence Hall Charter School 3.5% 0.0% 66.1%
Fulton Leadership Academy 14.1% 0.0% 60.7% SAIL Charter Academy ‐ School for Arts‐Infused Learning 5.3% 0.0% 14.2%
Genesis Innovation Academy for Boys 4.4% 0.0% 32.0% Scintilla Charter Academy 9.0% 0.2% 50.5%
Genesis Innovation Academy for Girls 2.3% 0.0% 20.9% Southwest Georgia S.T.E.M. Charter Academy 11.3% 0.5% 65.0%
Georgia Connections Academy 11.0% 0.5% 28.9% Statesboro STEAM Academy 15.6% 0.0% 58.1%
Georgia Cyber Academy 13.2% 0.9% 67.4% Utopian Academy for the Arts Charter School 11.2% 0.0% 99.6%
Georgia School for Innovation and the Classics 9.6% 0.1% 0.0% State of Georgia 12.1% 7.9% 60.6%
Graduation Achievement Center Charter High School 12.2% 0.6% 43.7%

Beating the Odds:
School Name Clus‐ter 2012 2013 2014 2015 2016 2017
Atlanta Heights Charter Commission School EM 56.8 58.2 56.8 57.9 57.5 64.3
Brookhaven Innovation Academy EM 54.5
Cherokee Charter Academy EM 73.4 78.3 77.6 71.7 74.8 73.2
Cirrus Academy Charter School EM 42.4
Coweta Charter Academy EM 83.1 74.4 81.6 72.9 72.9 82.4
Dubois Integrity Academy I E 33.3 67.0
Foothills Charter High School (Madison Campus) H 46.2 48.0
Fulton Leadership Academy MH 81.8 85.0 76.4 66.0 61.2 69.9
Georgia Connections Academy EMH 47.9 63.8 57.2 61.7 60.4 63.8
Georgia Cyber Academy EMH 61.4 58.5 61.9
Georgia School for Innovation and the Classics EM 54.4 71.8
Graduation Achievement Center Charter High School H 37.0 33.2 40.4 44.1 45.0
International Charter School of Atlanta E 70.1 77.5
Ivy Prep Academy at Kirkwood for Girls School MH 73.3 76.3 71.1 56.3 58.2
Ivy Preparatory Academy School M 58.3 72.9 62.0 44.9 48.5 77.9
Liberty Tech Charter School EM 73.0
Mountain Education Center School H 57.5 57.4 51.1 63.7 55.0 63.9
Odyssey School EM 58.8 62.2 57.9 64.1 71.0 73.5
Pataula Charter Academy EMH 78.9 72.7 75.4 71.4 72.4 74.0
Scintilla Charter Academy E 51.8 64.7
Statesboro STEAM MH 68.8 76.1 60.4 69.2 64.3 69.8
Utopian Academy for the Arts Charter School M 63.8 57.9 55.0

Georgia Department of Education DRAFT December 18, 2017 * Page 100 of 106
CCRPI Compared to Previous Year:
School Name 2012 2013 2014 2015 2016 2017
Atlanta Heights Charter Commission School 56.8 58.2 56.8 57.9 57.5 64.3
Brookhaven Innovation Academy 54.5
Cherokee Charter Academy 73.4 78.3 77.6 71.7 74.8 73.2
Cirrus Academy Charter School 42.4
Coweta Charter Academy 83.1 74.4 81.6 72.9 72.9 82.4
Dubois Integrity Academy I 33.3 67.0
Foothills Charter High School 46.2 48.0
Fulton Leadership Academy 81.8 85.0 76.4 66.0 61.2 69.9
Georgia Connections Academy 47.9 63.8 57.2 61.7 60.4 63.8
Georgia Cyber Academy 61.4 58.5 61.9
Georgia School for Innovation and the Classics 54.4 71.8
Graduation Achievement Center Charter High School 37.0 33.2 40.4 44.1 45.0
International Charter School of Atlanta 70.1 77.5
Ivy Prep Academy at Kirkwood for Girls School 73.3 76.3 71.1 56.3 58.2
Ivy Preparatory Academy School 58.3 72.9 62.0 44.9 48.5 77.9
Liberty Tech Charter School 73.0
Mountain Education Center School 57.5 57.4 51.1 63.7 55.0 63.9
Odyssey School 58.8 62.2 57.9 64.1 71.0 73.5
Pataula Charter Academy 78.9 72.7 75.4 71.4 72.4 74.0
Scintilla Charter Academy 51.8 64.7
Statesboro STEAM 68.8 76.1 60.4 69.2 64.3 69.8
Utopian Academy for the Arts Charter School 63.8 57.9 55.0
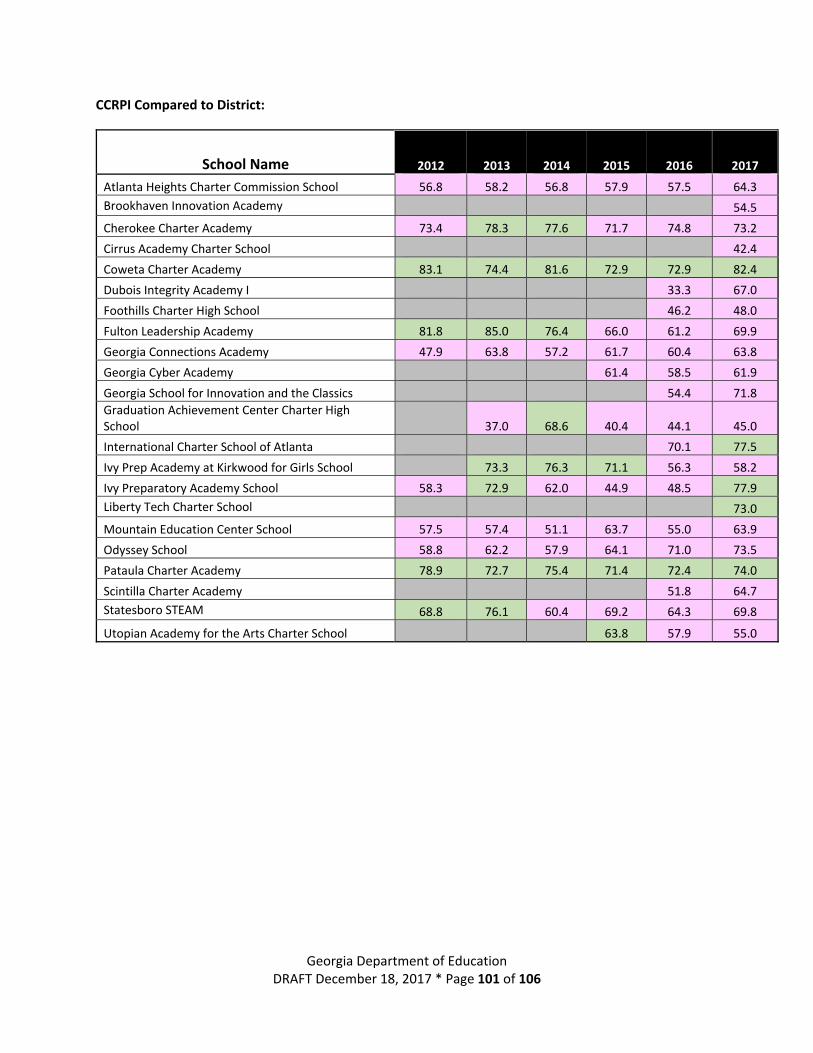
Georgia Department of Education DRAFT December 18, 2017 * Page 101 of 106
CCRPI Compared to District:
School Name 2012 2013 2014 2015 2016 2017
Atlanta Heights Charter Commission School 56.8 58.2 56.8 57.9 57.5 64.3
Brookhaven Innovation Academy 54.5
Cherokee Charter Academy 73.4 78.3 77.6 71.7 74.8 73.2
Cirrus Academy Charter School 42.4
Coweta Charter Academy 83.1 74.4 81.6 72.9 72.9 82.4
Dubois Integrity Academy I 33.3 67.0
Foothills Charter High School 46.2 48.0
Fulton Leadership Academy 81.8 85.0 76.4 66.0 61.2 69.9
Georgia Connections Academy 47.9 63.8 57.2 61.7 60.4 63.8
Georgia Cyber Academy 61.4 58.5 61.9
Georgia School for Innovation and the Classics 54.4 71.8
Graduation Achievement Center Charter High School 37.0 68.6 40.4 44.1 45.0
International Charter School of Atlanta 70.1 77.5
Ivy Prep Academy at Kirkwood for Girls School 73.3 76.3 71.1 56.3 58.2
Ivy Preparatory Academy School 58.3 72.9 62.0 44.9 48.5 77.9
Liberty Tech Charter School 73.0
Mountain Education Center School 57.5 57.4 51.1 63.7 55.0 63.9
Odyssey School 58.8 62.2 57.9 64.1 71.0 73.5
Pataula Charter Academy 78.9 72.7 75.4 71.4 72.4 74.0
Scintilla Charter Academy 51.8 64.7
Statesboro STEAM 68.8 76.1 60.4 69.2 64.3 69.8
Utopian Academy for the Arts Charter School 63.8 57.9 55.0

Georgia Department of Education DRAFT December 18, 2017 * Page 102 of 106
CCRPI Compared to State:
School Name 2012 2013 2014 2015 2016 2017
Atlanta Heights Charter Commission School 56.8 58.2 56.8 57.9 57.5 64.3
Brookhaven Innovation Academy 54.5
Cherokee Charter Academy 73.4 78.3 77.6 71.7 74.8 73.2
Cirrus Academy Charter School 42.4
Coweta Charter Academy 83.1 74.4 81.6 72.9 72.9 82.4
Dubois Integrity Academy I 33.3 67.0
Foothills Charter High School 46.2 48.0
Fulton Leadership Academy 81.8 85.0 76.4 66.0 61.2 69.9
Georgia Connections Academy 47.9 63.8 57.2 61.7 60.4 63.8
Georgia Cyber Academy 61.4 58.5 61.9
Georgia School for Innovation and the Classics 54.4 71.8
Graduation Achievement Center Charter High School 37.0 33.2 40.4 44.1 45.0
International Charter School of Atlanta 70.1 77.5
Ivy Prep Academy at Kirkwood for Girls School 73.3 76.3 71.1 56.3 58.2
Ivy Preparatory Academy School 58.3 72.9 62.0 44.9 48.5 77.9
Liberty Tech Charter School 73.0
Mountain Education Center School 57.5 57.4 51.1 63.7 55.0 63.9
Odyssey School 58.8 62.2 57.9 64.1 71.0 73.5
Pataula Charter Academy 78.9 72.7 75.4 71.4 72.4 74.0
Scintilla Charter Academy 51.8 64.7
Statesboro STEAM 68.8 76.1 60.4 69.2 64.3 69.8
Utopian Academy for the Arts Charter School 63.8 57.9 55.0

30
40
50
60
70
80
90
2012 School 2013 School 2014 School 2015 School 2016 School 2017 School
CCRPI, 2012‐17State Charter Schools
Statewide Atlanta Heights Charter Commission School
Brookhaven Innovation Academy Cherokee Charter Academy
Cirrus Academy Charter School Coweta Charter Academy
Dubois Integrity Academy I Foothills Charter High School
Fulton Leadership Academy Georgia Connections Academy
Georgia Cyber Academy Georgia School for Innovation and the Classics
Graduation Achievement Center Charter High School International Charter School of Atlanta
Ivy Prep Academy at Kirkwood for Girls School Ivy Preparatory Academy School
Liberty Tech Charter School Mountain Education Center School
Odyssey School Pataula Charter Academy
Scintilla Charter Academy Statesboro STEAM
Utopian Academy for the Arts Charter School

Charter School Rules – 2017 Update
The State Board of Education in August 2017 adopted revised Charter Rules to implement legislative changes from the 2017 session and to make other changes. The revised rules include the following changes and/or additions.
160‐4‐9‐.04 Charter Schools and Charter Systems Definitions
Add the federal definition of Academically Poor Performing Charter School as required by the
U.S. Department of Education’s Charter School Program State Educational Agencies (SEA) Grant terms and conditions for the Georgia Department of Education.
Add definitions for Charter Management Organization, Education Management
Organization, Education Service Organization, and the Department’s charter performance framework.
Clarify the definition of Education Service Provider.
Clarify the definition of substantially detrimental to include the physical and/or mental
health, safety, and welfare of students and/or faculty.
160‐4‐9‐.05 Charter Schools Petition Process
Clarify that the maximum charter term for all charter school contracts is five (5) years.
Clarify that any federal, state, and local rules and regulations, court orders, and statutes
related to the physical and mental health and safety of school students, employees, and visitors cannot be waived by charter schools or charter systems.
Clarify that charter schools cannot require parent/guardian volunteer commitments as a condition of enrollment in the school.
Add requirement that charter school petitioners provide a description of how its governing
board, students, faculty, and staff will be representative of the community diversity in its proposed attendance zone.
Clarify that charter school employees are prohibited from serving on the school’s
governing board unless otherwise stipulated by the Department.
160‐4‐9‐.06 Charter Authorizers, Financing, Management, and Governance Training
Clarify that the local district must provide the assurance to the Department regarding a new
charter school achieving ready‐to‐open status.

Georgia Department of Education DRAFT December 18, 2017 * Page 105 of 106
Clarify that the local board of education and the Georgia Department of Education must evaluate a charter school’s performance annually using the Department’s performance work (or an alternate approach approved by the Department).
Clarify that charter schools must maintain their school records, including school policies,
budgets, and governing board meeting materials, and make them available for public inspection via an online school website pursuant to the Georgia Open Records Act.
Clarify that a charter school or charter system may be placed on probation or terminated for
failure to meet one or more of the standards given in the Department’s performance framework.
Clarify the permitted financial governance training providers for new and returning
charter school governing board members.
Clarify the training requirements for college and career academy governing board members, including the number of hours, topics, and permitted training providers.

Georgia Department of Education DRAFT December 18, 2017 * Page 106 of 106
Acknowledgements
A special thank you from the GaDOE District Flexibility and Charter Schools Division to the following individuals and teams for their contributions to this report. State Board of Education District Flexibility and Charter Schools Committee
Mr. Scott Johnson, Chair Mr. Kevin Boyd, Co‐Chair Ms. Lisa Kinnemore Mr. Vann Parrott Mr. Mike Cheokas
Georgia Department of Education Dr. Garry McGiboney, Deputy Superintendent, External Affairs Dr. Xiaoying Wu, Education Statistics Analyst, Policy Division
Mr. Mark Vignati, Systems Analyst, Office of Technology Services Georgia Office of Student Achievement
Ms. Martha Ann Todd, Executive Director Mr. Sam Rauschenberg, Deputy Director, Research, Policy, & Accountability Ms. Pascael Beaudette, Program Manager, Research and Evaluation
District Flexibility and Charter Schools Division
Contact Information District Flexibility and Charter Schools Division Georgia Department of Education 2053 Twin Towers East 205 Jesse Hill Jr. Dr. SE Atlanta, Georgia 30334‐5040 (404) 657‐0515 (404) 657‐6978 (Fax)
District Flexibility & Charter Schools Division
Mr. Louis Erste, Associate Superintendent Mr. Allen Mueller, Director Ms. Francesca Black, Staff Attorney Ms. Kerry Pritchard, Accountability Manager Ms. Selena McBride, Grants & Financial Manager Ms. Latoya Satterwhite, Operations Coordinator