geosynchronous orbit a satellite in geosynchronous orbit circles the earth once each day. the time...
Post on 22-Dec-2015
235 views
TRANSCRIPT
Geosynchronous Orbit
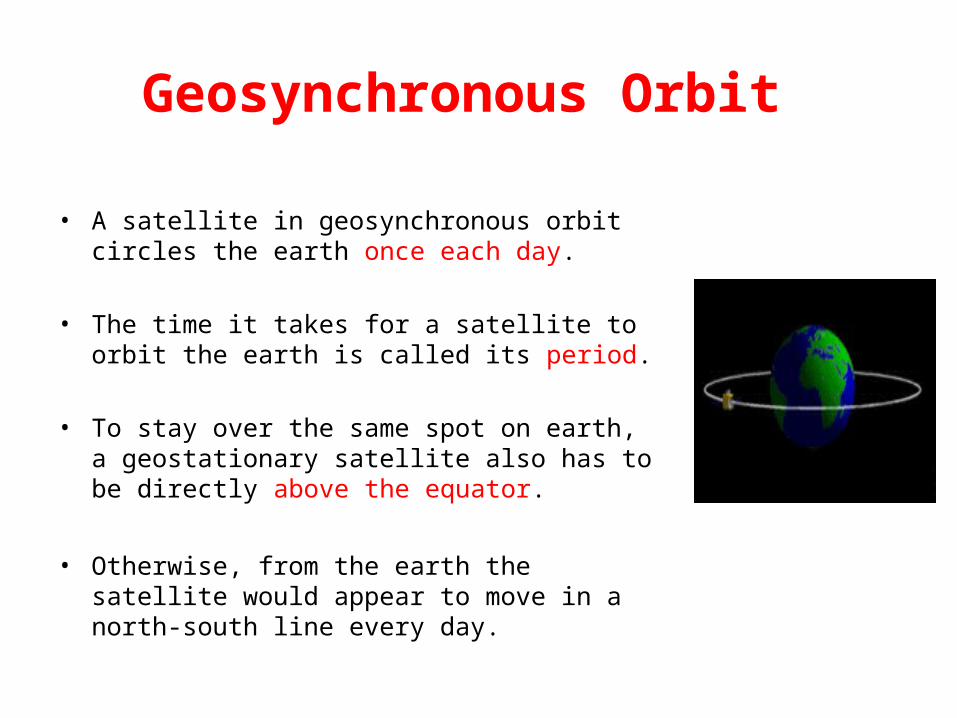
• A satellite in geosynchronous orbit circles the earth once each day.
• The time it takes for a satellite to orbit the earth is called its period.
• To stay over the same spot on earth, a geostationary satellite also has to be directly above the equator.
• Otherwise, from the earth the satellite would appear to move in a north-south line every day.
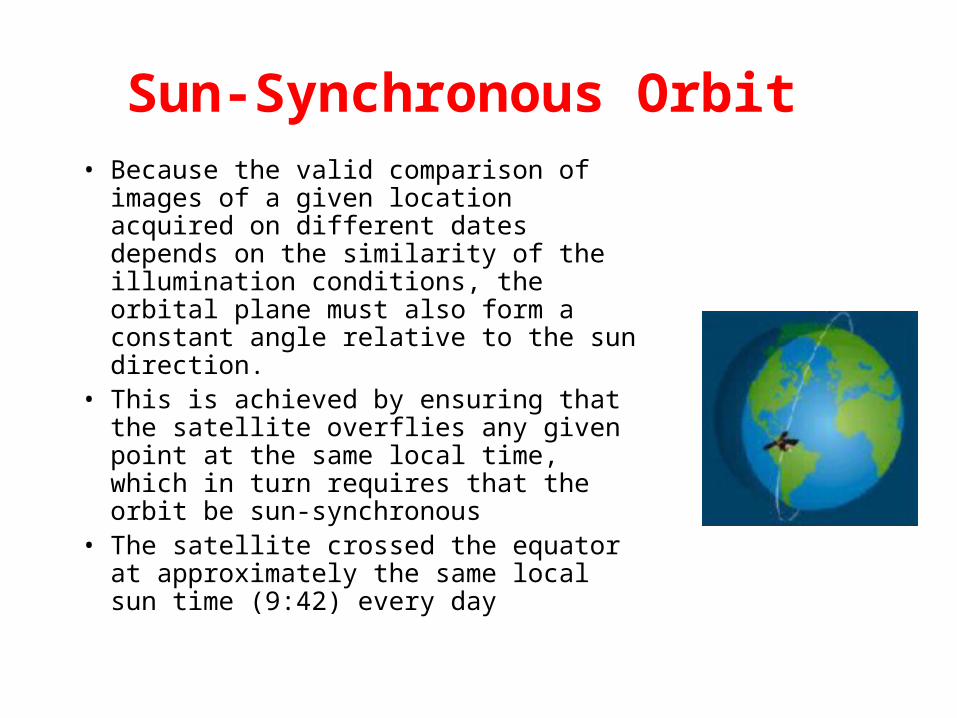
Sun-Synchronous Orbit • Because the valid comparison of
images of a given location acquired on different dates depends on the similarity of the illumination conditions, the orbital plane must also form a constant angle relative to the sun direction.
• This is achieved by ensuring that the satellite overflies any given point at the same local time, which in turn requires that the orbit be sun-synchronous
• The satellite crossed the equator at approximately the same local sun time (9:42) every day
Earth Resource Satellites Operating in the Optical Spectrum• Landsat • SPOT • Meteorological Satellites
– NOAA satellites – GOES satellites
• Ocean Monitoring Satellites – Radar Satellites – Seasat – ERS-1 – JERS-1 – Radarsat
Landsat-7
• This program is jointly managed by NASA and USGS (http://landsat.gsfc.nasa.gov/announcements/program_update.html)
• Launched on April 15, 1999 (http://landsat.gsfc.nasa.gov/main/project.html)
• A new sensor : Enhanced Thematic Mapper Plus (ETM+)
• Same swath as ETM, similar orbits and characteristics• Swath: The area imaged on the surface.
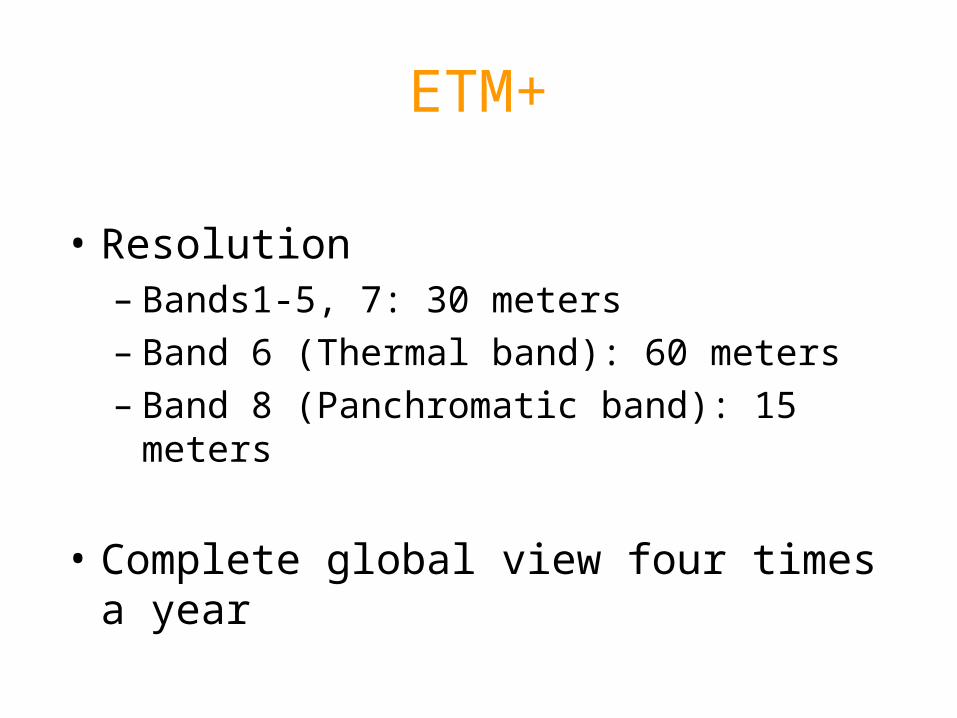
ETM+
• Resolution– Bands1-5, 7: 30 meters– Band 6 (Thermal band): 60 meters– Band 8 (Panchromatic band): 15 meters
• Complete global view four times a year
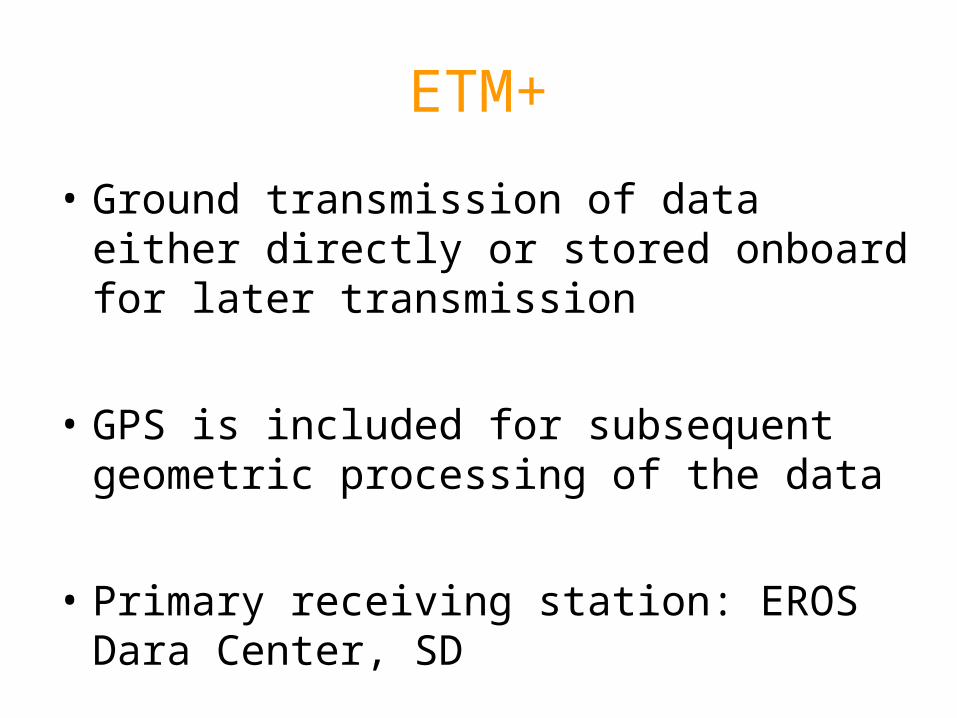
ETM+
• Ground transmission of data either directly or stored onboard for later transmission
• GPS is included for subsequent geometric processing of the data
• Primary receiving station: EROS Dara Center, SD
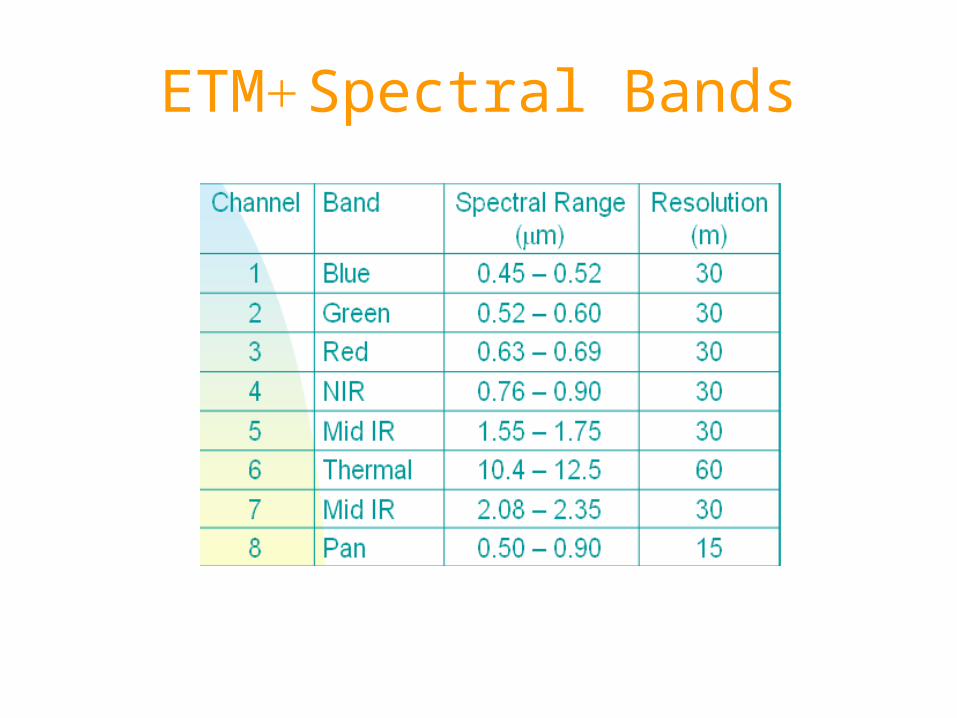
ETM+ Spectral Bands

Landsat 7 +ETM Spectral Bands
Band Wavelength/ µm
Spectral Location
Principal Applications
1 0.45-0.52
Blue Designed for water body penetration, making it useful for coastal water mapping. Also, useful for soil/vegetation discrimination, forest type mapping and cultural feature identification.
2 0.52-0.60
Green Designed to measure green reflectance peak of vegetation for vegetation discrimination and vigor assessment. Also useful for cultural feature identification
3 0.63-0.69
Red Designed to sense in a chlorophyll absorption region aiding in plant species differentiation. Also useful for cultural identification.
4 0.76-0.90
Near infrared
Useful for determining vegetation stress, vigor, and biomass content, for delineating water bodies, and for soil moisture discrimination.
5 1.55-1.75 Mid-infrared
Indicative of vegetation moisture content and soil moisture. Also useful for differentiation of snow from clouds.
6 10.4-12.5
Thermal infrared
Useful in vegetation stress analysis, soil moisture discrimination, and thermal mapping applications.
7 2.08-2.35 Mid-infrared
Useful for discrimination of mineral and rock types. Also sensitive to vegetation moisture content.

Landsat Resources
• Data acquisition
(http://landsat.usgs.gov/pathrows.php
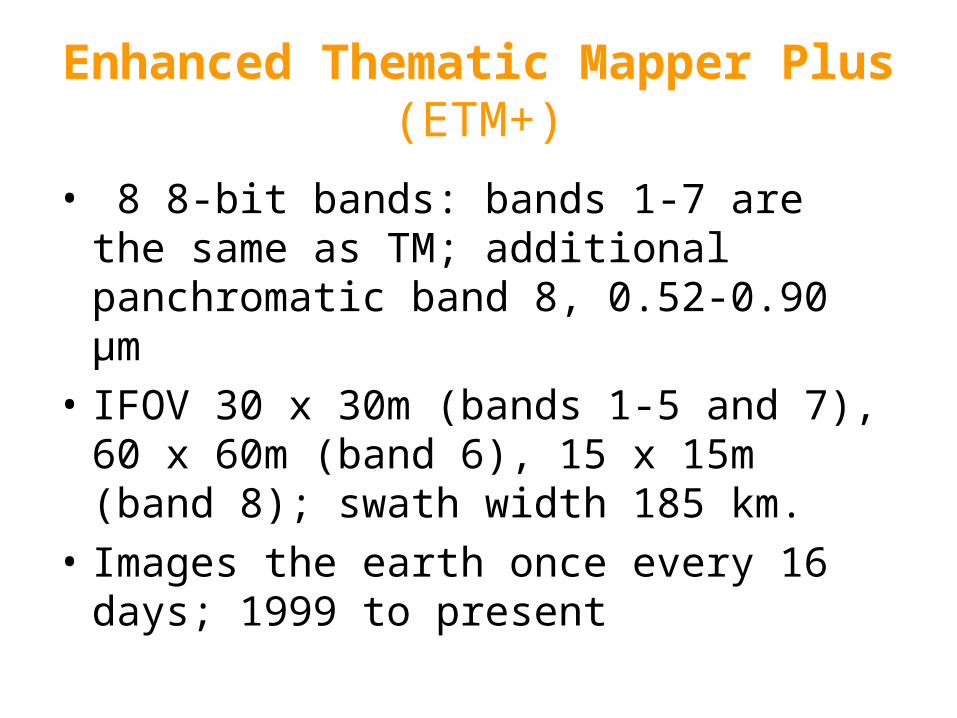
Enhanced Thematic Mapper Plus (ETM+)
• 8 8-bit bands: bands 1-7 are the same as TM; additional panchromatic band 8, 0.52-0.90 μm
• IFOV 30 x 30m (bands 1-5 and 7), 60 x 60m (band 6), 15 x 15m (band 8); swath width 185 km.
• Images the earth once every 16 days; 1999 to present
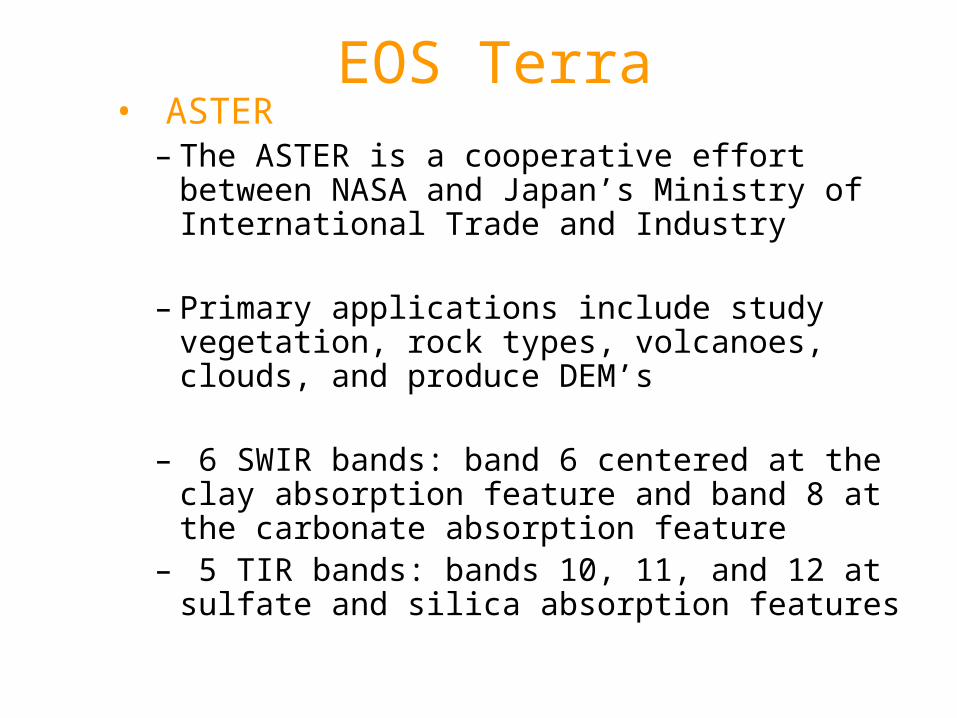
EOS Terra• ASTER
– The ASTER is a cooperative effort between NASA and Japan’s Ministry of International Trade and Industry
– Primary applications include study vegetation, rock types, volcanoes, clouds, and produce DEM’s
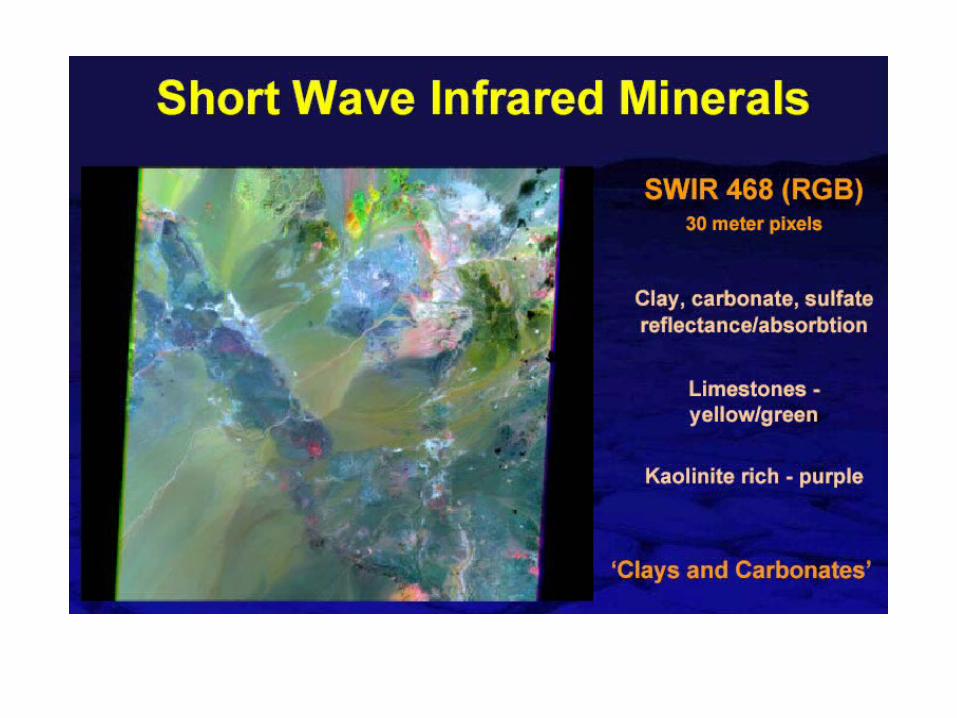
– 6 SWIR bands: band 6 centered at the clay absorption feature and band 8 at the carbonate absorption feature
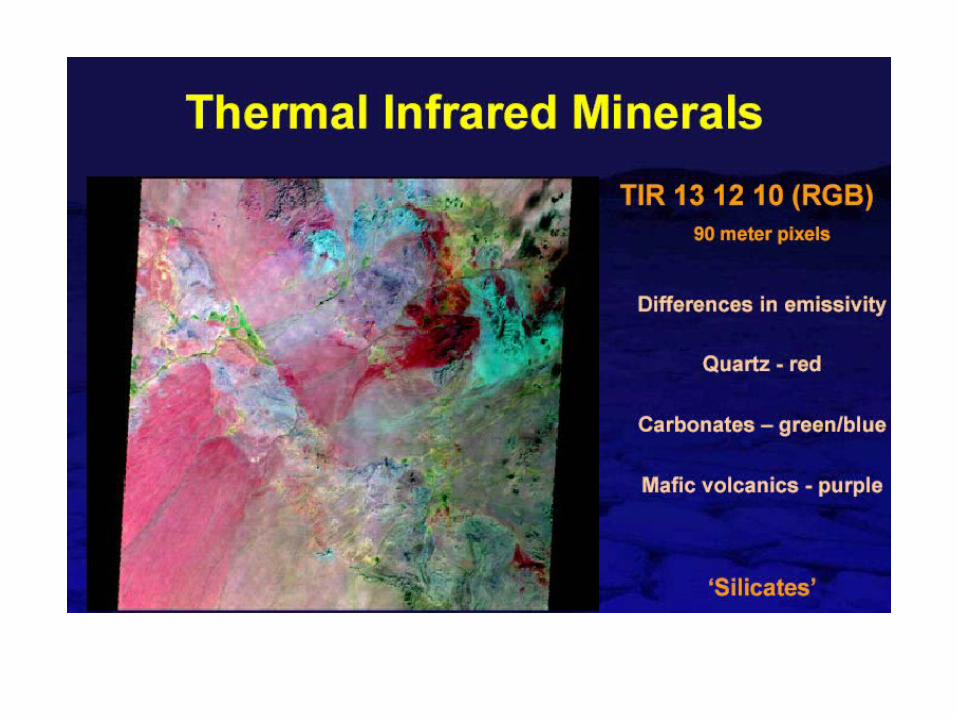
– 5 TIR bands: bands 10, 11, and 12 at sulfate and silica absorption features
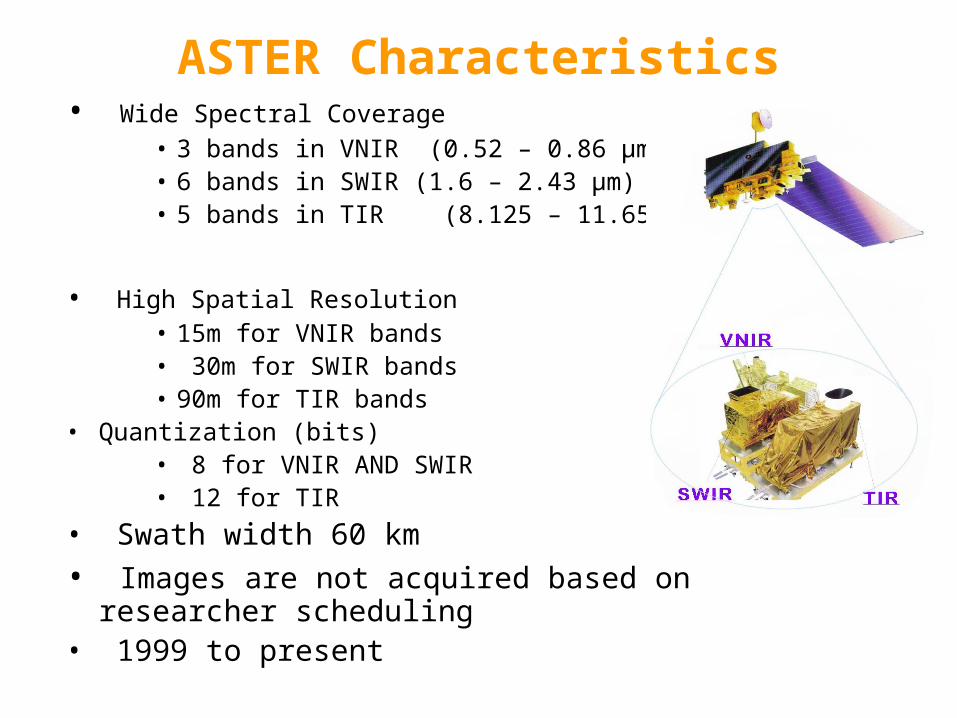
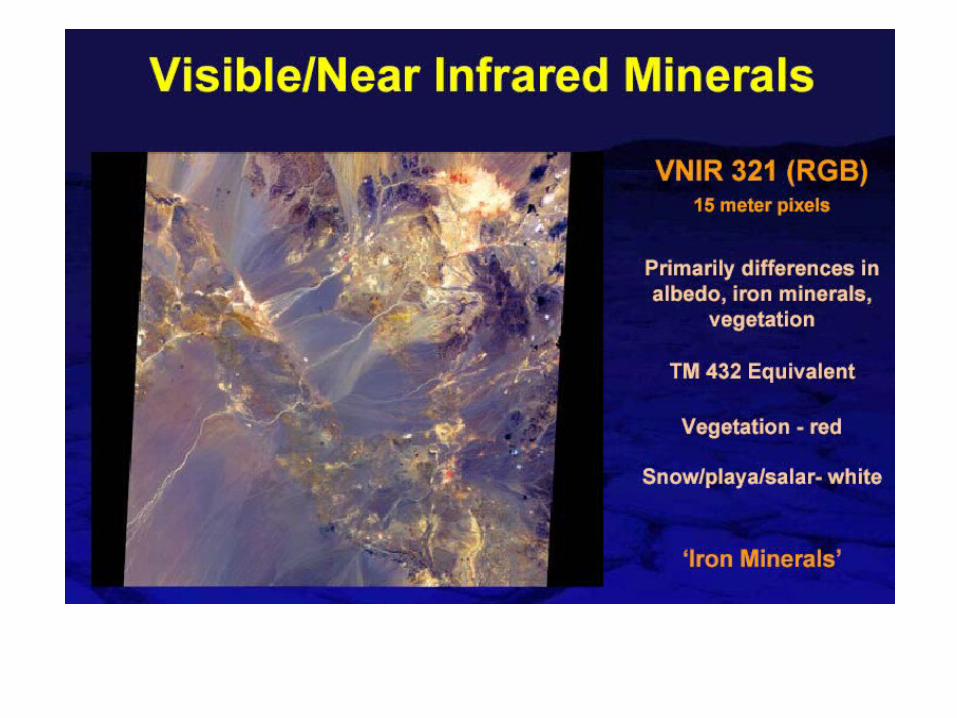
ASTER Characteristics• Wide Spectral Coverage
• 3 bands in VNIR (0.52 – 0.86 μm)• 6 bands in SWIR (1.6 – 2.43 μm)• 5 bands in TIR (8.125 – 11.65 μm)
• High Spatial Resolution• 15m for VNIR bands• 30m for SWIR bands• 90m for TIR bands
• Quantization (bits)• 8 for VNIR AND SWIR • 12 for TIR
• Swath width 60 km
• Images are not acquired based on researcher scheduling
• 1999 to present
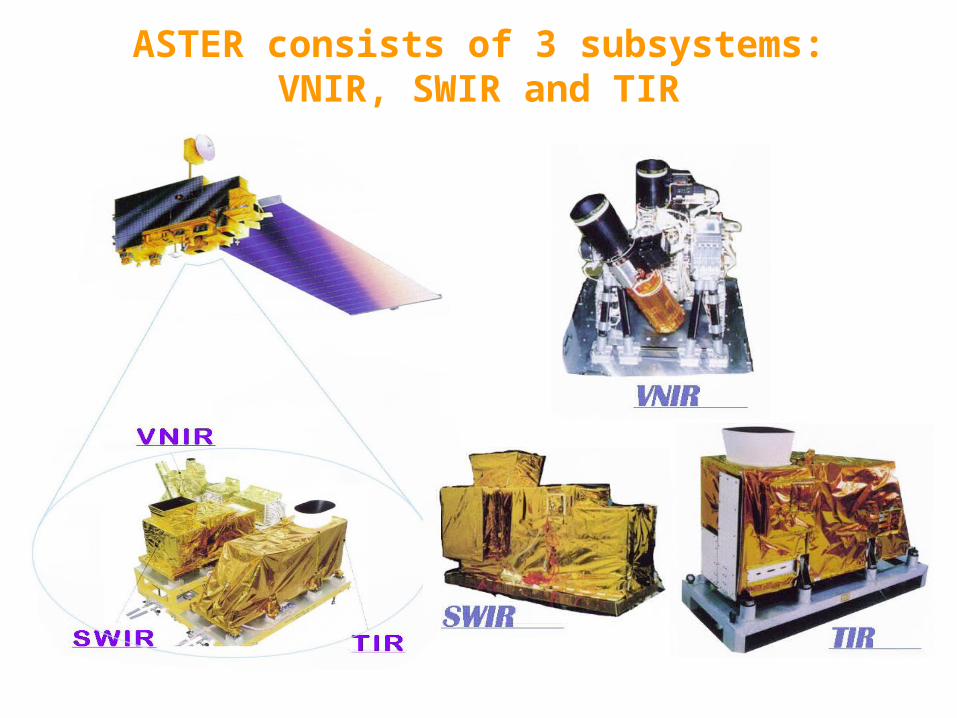
ASTER consists of 3 subsystems:VNIR, SWIR and TIR
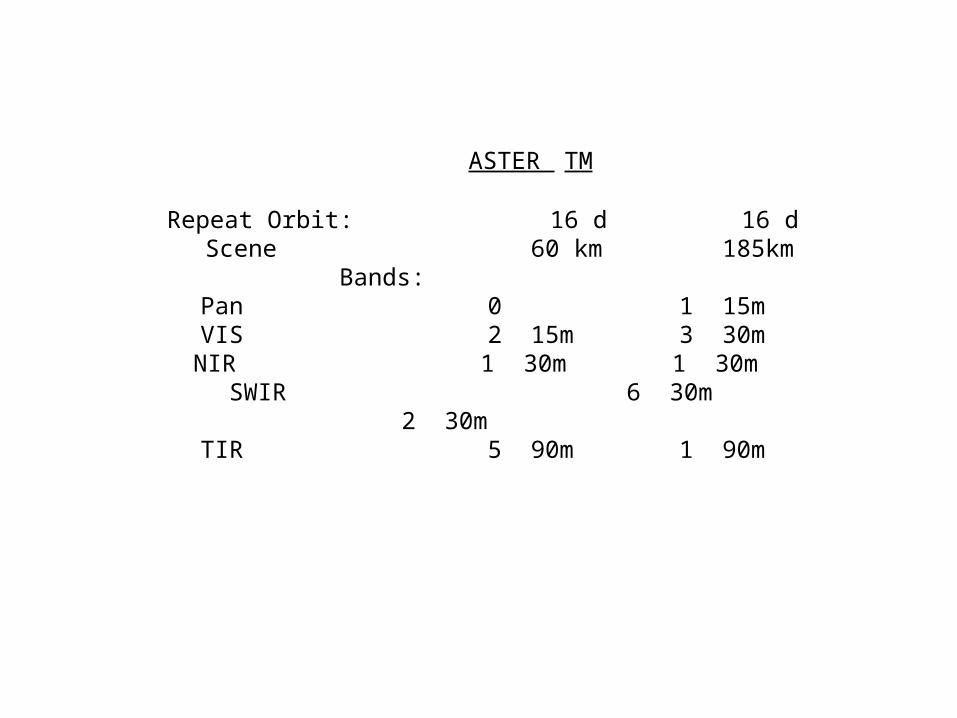
ASTER TM
Repeat Orbit: 16 d 16 d Scene 60 km 185km
Bands:Pan 0 1 15mVIS 2 15m 3 30mNIR 1 30m 1 30m
SWIR 6 30m 2 30mTIR 5 90m 1 90m
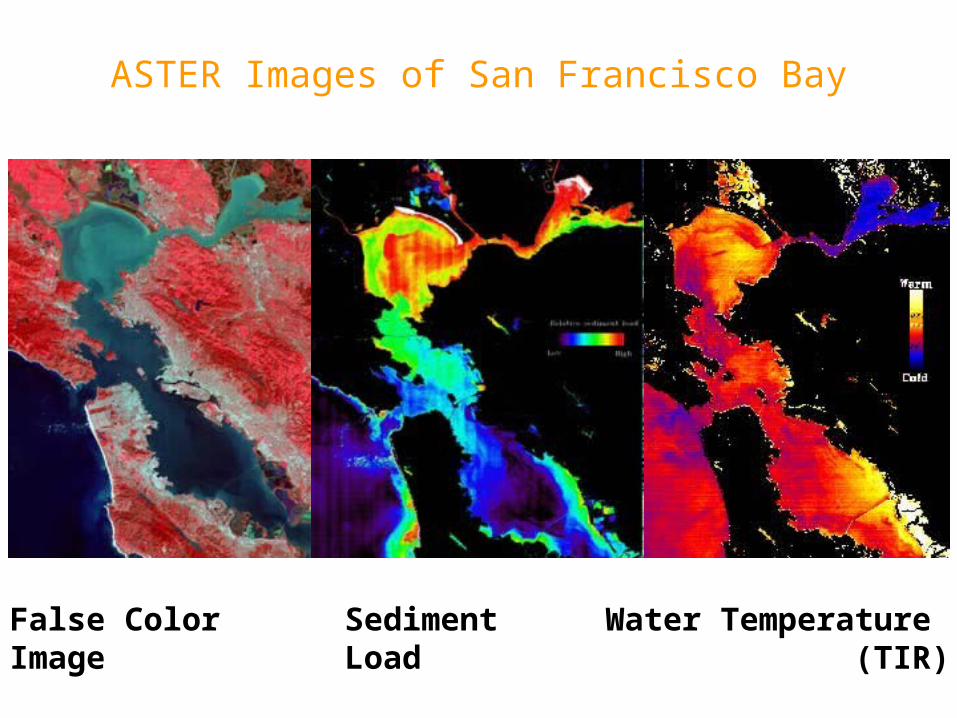
ASTER Images of San Francisco Bay
False Color Image (VNIR)
Sediment Load (VNIR)
Water Temperature (TIR)
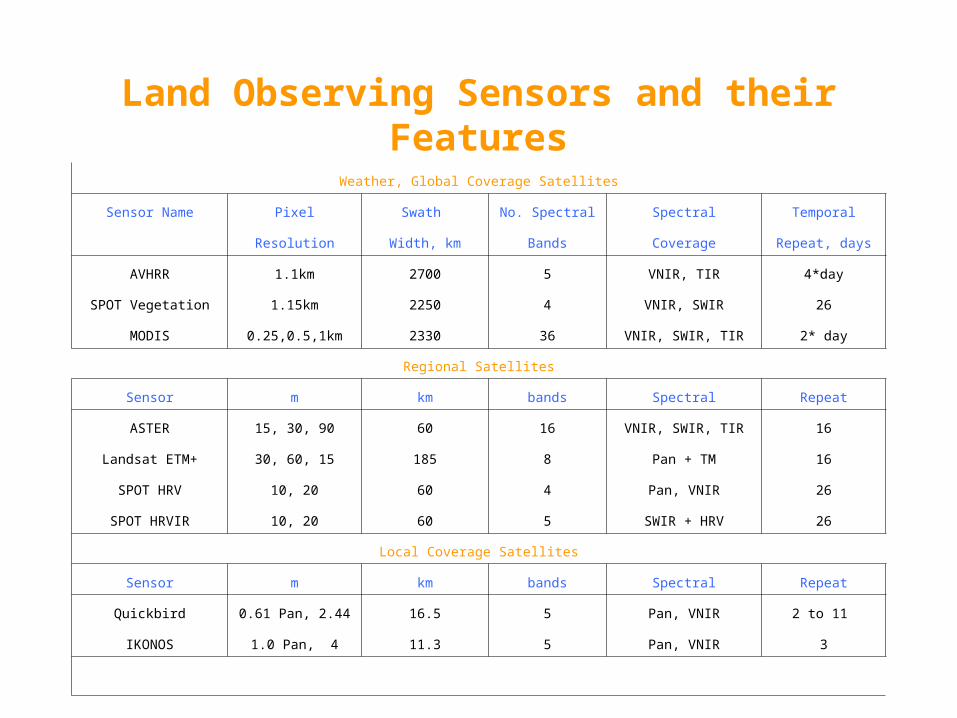
Land Observing Sensors and their FeaturesWeather, Global Coverage Satellites
Sensor Name Pixel Swath No. Spectral Spectral Temporal
Resolution Width, km Bands Coverage Repeat, days
AVHRR 1.1km 2700 5 VNIR, TIR 4*day
SPOT Vegetation 1.15km 2250 4 VNIR, SWIR 26
MODIS 0.25,0.5,1km 2330 36 VNIR, SWIR, TIR 2* day
Regional Satellites
Sensor m km bands Spectral Repeat
ASTER 15, 30, 90 60 16 VNIR, SWIR, TIR 16
Landsat ETM+ 30, 60, 15 185 8 Pan + TM 16
SPOT HRV 10, 20 60 4 Pan, VNIR 26
SPOT HRVIR 10, 20 60 5 SWIR + HRV 26
Local Coverage Satellites
Sensor m km bands Spectral Repeat
Quickbird 0.61 Pan, 2.44 16.5 5 Pan, VNIR 2 to 11
IKONOS 1.0 Pan, 4 11.3 5 Pan, VNIR 3
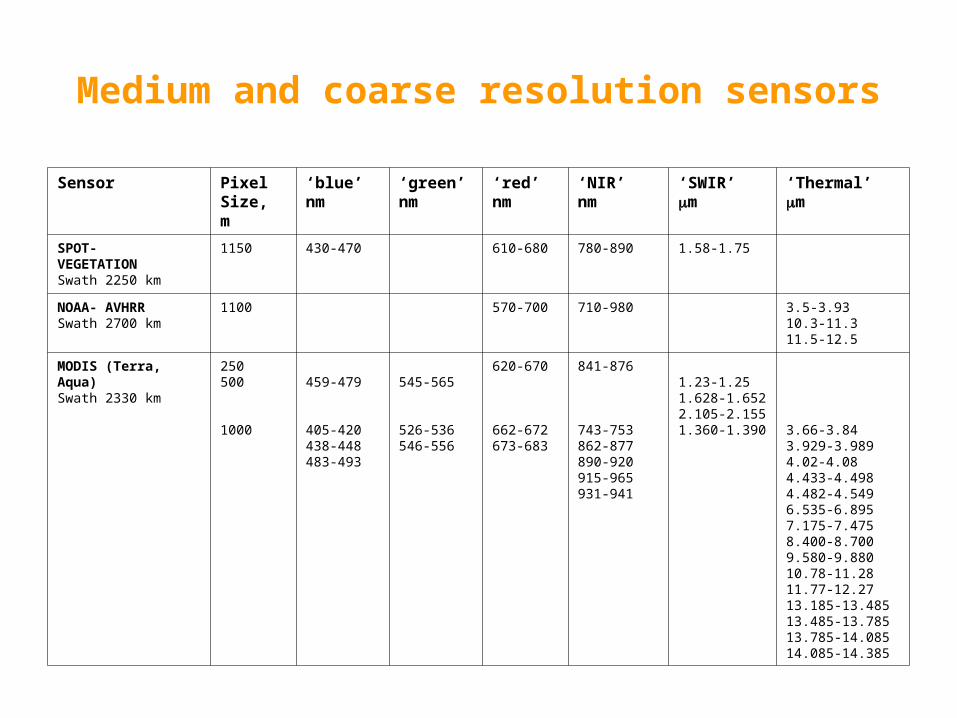
Medium and coarse resolution sensors
Sensor Pixel Size, m
‘blue’nm
‘green’nm
‘red’nm
‘NIR’nm
‘SWIR’m
‘Thermal’m
SPOT-VEGETATIONSwath 2250 km
1150 430-470 610-680 780-890 1.58-1.75
NOAA- AVHRRSwath 2700 km
1100 570-700 710-980 3.5-3.9310.3-11.311.5-12.5
MODIS (Terra, Aqua)Swath 2330 km
250 500
1000
459-479
405-420438-448483-493
545-565
526-536546-556
620-670
662-672673-683
841-876
743-753862-877890-920915-965931-941
1.23-1.251.628-1.6522.105-2.1551.360-1.390 3.66-3.84
3.929-3.9894.02-4.084.433-4.4984.482-4.5496.535-6.8957.175-7.4758.400-8.7009.580-9.88010.78-11.2811.77-12.2713.185-13.48513.485-13.78513.785-14.08514.085-14.385
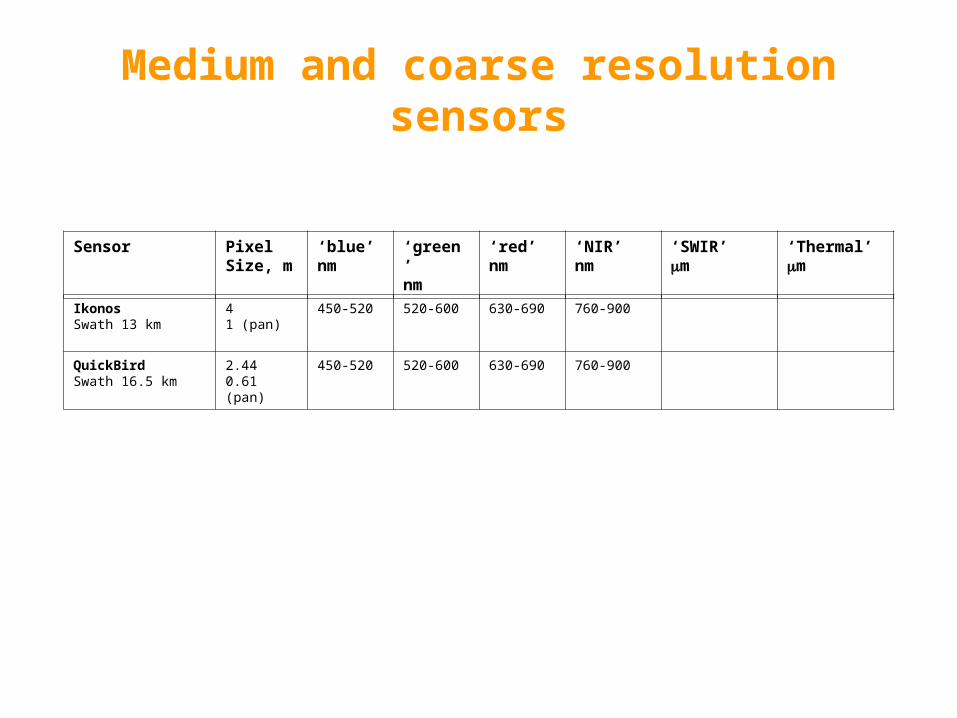
Medium and coarse resolution sensors
IkonosSwath 13 km
41 (pan)
450-520 520-600 630-690 760-900
QuickBirdSwath 16.5 km
2.440.61 (pan)
450-520 520-600 630-690 760-900
Sensor Pixel Size, m
‘blue’nm
‘green’nm
‘red’nm
‘NIR’nm
‘SWIR’m
‘Thermal’m