geot56 627 - discovery - university of dundee
TRANSCRIPT

University of Dundee
Analysis of a rapid load test on an instrumented bored pile in clay
Brown, M. J.; Hyde, A. F. L.; Anderson, W. F.
Published in:Géotechnique
DOI:10.1680/geot.2006.56.9.627
Publication date:2006
Document VersionPublisher's PDF, also known as Version of record
Link to publication in Discovery Research Portal
Citation for published version (APA):Brown, M. J., Hyde, A. F. L., & Anderson, W. F. (2006). Analysis of a rapid load test on an instrumented boredpile in clay. Géotechnique, 56(9), 627-638. https://doi.org/10.1680/geot.2006.56.9.627
General rightsCopyright and moral rights for the publications made accessible in Discovery Research Portal are retained by the authors and/or othercopyright owners and it is a condition of accessing publications that users recognise and abide by the legal requirements associated withthese rights.
• Users may download and print one copy of any publication from Discovery Research Portal for the purpose of private study or research. • You may not further distribute the material or use it for any profit-making activity or commercial gain. • You may freely distribute the URL identifying the publication in the public portal.
Take down policyIf you believe that this document breaches copyright please contact us providing details, and we will remove access to the work immediatelyand investigate your claim.
Download date: 11. Mar. 2022

Brown, M. J., Hyde, A. F. L. & Anderson, W. F. (2006). Geotechnique 56, No. 9, 627–638
627
Analysis of a rapid load test on an instrumented bored pile in clay
M. J. BROWN*, A. F. L. HYDE† and W. F. ANDERSON†
Rapid load testing methods for piled foundations aregenerally easier and quicker to mobilise than classicstatic tests, and are less complex to analyse than dynamicload tests. A recently developed rapid load pile testingmethod known as the Statnamic test is seeing greater usein the UK for the assessment of piles. For foundationdesign, it is necessary to derive the equivalent staticload–settlement curve from the rapid load test data byeliminating inertial and damping effects. Existing meth-ods of test analysis generally provide good correlationwith static tests for sands and gravels, but overpredictpile capacities by up to 50% for clays. In order to gainan insight into the behaviour of rapid load pile testing inclays, a full-scale pile instrumented with accelerometers,strain-gauged sister bars and a tip load cell was tested ina glacial lodgement till near Grimsby, UK. The soilaround the pile was also instrumented with radiallyarrayed buried accelerometers. The test pile was sub-jected to rapid loading tests, the results of which werecompared with constant rate of penetration and main-tained load static tests on the same pile. Results from thefield testing have been analysed using non-linear viscousparameters obtained from laboratory model and elementtests to represent rate-dependent clay shear resistance inthe post-yield phase of loading. Shaft frictions derivedfrom the strain-gauged reinforcement in the pile havebeen compared with shear strains and stresses derivedfrom accelerations in the surrounding soil to give aninsight into the load transfer mechanisms for a rapidlyloaded pile in clay.
KEYWORDS: clays; dynamics; field instrumentation; full-scaletests; glacial soils; piles
Les tests de chargement rapides pour des fondations depieux offrent generalement des methodes plus faciles etplus rapidement mobilisables que les tests statiques tradi-tionnels, et ils sont egalement moins complexes a analyserque les tests de chargement dynamiques. Une methode dechargement de pieu a courte duree connue sous le nomd’essai statnamique voit son utilisation se developper auRoyaume-Uni pour l’evaluation des pieux. Pour la con-ception des fondations, il est necessaire de deriver lacourbe de charge-tassement des donnees equivalente destests de chargement rapides en eliminant les effets d’iner-tie et d’amortissement. Les methodes existantes d’analysedes essais fournissent generalement une bonne correlationavec les tests statiques pour les sables et les graviers,mais surestiment les capacites du pieu jusqu’a 50 % pourles argiles. Afin de mieux comprendre le comportementdes tests de chargement de pieu rapides dans les argiles,un pieu instrumente de pleine echelle, disposant d’acce-lerometres, de barres jumelles munies de jauge de defor-mation et d’une cellule de mesure a ete teste dans unemoraine de fond glaciaire a Grimsby, au Royaume-Uni.Le terrain autour du pieu etait egalement equipe d’acce-lerometres enterres radialement. Le pieu servant a l’essaia ete soumis a des tests de chargement rapides, dont lesresultats ont ete compares a ceux obtenus pour des testsde chargement statiques maintenus et avec un taux depenetration constant sur la meme pile. Les resultatsde l’experimentation in situ ont ete analyses au moyen deparametres de viscosite non lineaires obtenus a partirde tests d’elements et de modele de laboratoire pourrepresenter la resistance au cisaillement de l’argile de-pendante du taux dans la phase post-elasticite de lacharge. Les frottements au fut derives du renforcementjauge en deformation dans le pieu ont ete compares avecles deformations et contraintes de cisaillement deriveesd’accelerations dans le sol environnant pour donner unmeilleur apercu des mecanismes de transfert de chargepour un pieu rapidement charge dans l’argile.
INTRODUCTIONTraditionally, pile load testing is carried out using staticmethods, which are relatively simple to undertake andanalyse but require substantial temporary infrastructure thatincreases with pile ultimate load capacity, making themexpensive and time consuming.
In recent decades dynamic pile testing methods have beendeveloped that require minimal infrastructure but are compli-cated to analyse. They may also result in pile damage owingto the generation of tensile stresses as a result of the veryshort loading period of 5–10 ms. Rapid load test (RLT)methods have been developed as an alternative: they utilise
the advantages of both static and dynamic tests while avoid-ing some of the disadvantages. The commonest rapid loadtesting method, known as the Statnamic test (Fig. 1), worksby the rapid burning of a fuel that produces gas in apressure chamber (Middendorp, 1993). This gas acceleratesa reaction mass upwards at a maximum peak acceleration ofabout 20g, which in turn imparts a downward load on thetest pile. Thus only 5% of the reaction mass used duringstatic testing is required to produce the same load(Middendorp, 2000). The maximum load and its duration areregulated by controlling the quantity of fuel and the ventingof the gas. The load duration is normally regulated to about200 ms. This loading period is between 20 and 40 timesgreater than that for a dynamic test, thus avoiding thegeneration of tensile stresses for piles of up to 40 m length(Middendorp & Bielefeld, 1995; Nishimura & Matsumoto,1995; Mullins et al., 2002).
For foundation design, it is necessary to derive an equiva-lent static load–settlement curve from the rapid load testdata by eliminating rate effects. The most common form of
Manuscript received 26 October 2004; revised manuscript accepted16 August 2006.Discussion on this paper closes on 1 May 2007, for further detailssee p. ii.* Division of Civil Engineering, University of Dundee, UK.† Department of Civil and Structural Engineering, University ofSheffield, UK.

analysis currently used is the unloading point method or UPM(Kusakabe & Matsumoto, 1995), which takes into accountboth velocity-dependent soil viscous damping and accelera-tion-dependent pile inertia. However, this method assumesthat the soil viscous damping is linear with velocity. Soildamping in clays is highly non-linear, and forms an importantcomponent of ultimate pile resistance at enhanced rates oftesting (Hyde et al., 2000; Brown, 2004). The UPM methodprovides a good correlation with static tests for sands andgravels (Brown, 1994; McVay et al., 2003; Wood, 2003),where viscous damping is negligible, but overpredicts pilecapacities by up to 50% for clay soils (Holeyman et al., 2000).
In order to gain a better understanding of the load transfermechanisms under rapid loading, and to improve the analysisof these types of test in clay soils, a full-scale auger-boredpile, instrumented with strain gauges and accelerometers,was installed in a glacial lodgement till with buried accel-erometers. Rapid load test results are compared with thosefrom standardised static load tests.
FIELD PILE STUDYThe Grimsby research site was located in a piling contrac-
tor’s plant yard near Waltham, Grimsby, UK. The groundconditions at the test site comprised matrix-dominant glaciallodgement till (Weltman & Healy, 1978), which was under-lain by Cretaceous chalk bedrock (Powell & Butcher, 2003).The till of this region is described as being stiff to firm,greyish to dark brown, predominantly silty clay with avariety of cobbles, boulders and pebbles (Berridge & Pat-tison, 1994). It is cohesive, overconsolidated, but may alsobe soft and weathered (reddish brown) with grey jointsurfaces (Bell, 2001).
Ground investigation and laboratory soils testingTwo cable percussive boreholes were undertaken adjacent
to the test pile location, which encountered 2.4 m of firm tovery stiff slightly gravelly orangey brown clay, followed by18 m of firm to very stiff gravelly greyish brown to darkbrown clay with occasional coarse gravel and rare cobbles.The underlying bedrock was not encountered during theinvestigation. In the first borehole alternate U100 samplingand standard penetration testing (SPT) was undertaken atapproximately 1 m vertical centres, and continuous U100sampling was carried out in the second borehole to recoversamples for laboratory triaxial testing (Balderas-Meca,2004). Additional in situ testing was undertaken using piezo-cone penetration testing (PCPT) and surface to downholeseismic CPT (SCPT). The results are shown in Fig. 2.Results for multistage undrained triaxial testing (Anderson,1974) carried out on 100 mm diameter samples are shown inFig. 3 together with those from previous undrained testingof 38 mm diameter samples (Taylor, 1966) and on-site handshear vane tests. Further laboratory test results are sum-marised in Table 1. The soil profile encountered during insitu and laboratory testing suggests that the upper soil layershad previously been exposed to weathering and desiccation.The observed low CPT readings in the top 1.8 m are notrepresentative of the final site conditions as the surfacematerial was replaced with compacted fill for a piling work-ing platform after the borehole and CPT investigation.
Pile description and installationThe instrumented test pile was a 600 mm nominal dia-
meter bored cast in situ pile installed using a standard flat-bladed rotary clay auger to 12.1 m below ground level(BGL) (Fig. 4). Only simple total stress design calculationswere undertaken for selection of the pile dimensions basedupon the site investigation data shown in Fig. 3. After boringto a depth of 2 m, a steel friction-reducing casing of610 mm external diameter and 8 mm wall thickness wasinserted to 1.8 m BGL with 480 mm left above ground. Thiswas to act as a sleeve, reducing the influence of the variationin soil properties for the desiccated clay layer and pile rigworking platform. After reaching the final depth the unsup-ported bore was inspected and cleaned out using a barrel-like tool with a blade at its base. A tip load cell was theninstalled on a bed of cement grout, and an instrumentedreinforcing cage, incorporating strain-gauged sister bars andembedded accelerometers, was lowered to just above the tipload cell. The reinforcement consisted of six vertical 12 mlong T16 bars with a single T12 helical at 300 mm verticalcentres. The reinforcing cage was initially tied together andthen spot-welded to minimise flexure of the cage duringcraneage and thus reduce the risk of instrumentation da-mage. The pile concrete (C35, 10 mm aggregate), which hada 28-day strength of 36 N/mm2 and an average density of2.35 Mg/m3 was poured within 6 h of excavating the bore.
Pile instrumentationThe sister bars incorporated in the pile consisted of 15
strain-gauged T12 reinforcing bars 1 m in length, three ateach of five different levels, tied to the horizontal reinforce-ment (Fig. 4). The three bars at each level were spacedequally around the pile circumference. The sister bars in-corporated bonded foil strain gauges rather than the morecommonly employed vibrating wire type, which, thoughdurable, are unsuitable for high-frequency loading(Dunnicliff & Green, 1988). The foil gauges were protectedby coating with polyurethane followed by several coats ofepoxy resin. Finally, the central 150 mm of sister bar was
Fig. 1. 3 MN Statnamic testing device
628 BROWN, HYDE AND ANDERSON

covered with a protective layer of adhesive-lined shrink-fitplastic. This coating also acted to debond the gauged lengthfrom the concrete.
The two piezoelectric shear-type accelerometers embeddedin the pile were sealed in waterproof protective stainlesssteel housings (140 mm in length and 25 mm outer diameter)and secured to the pile reinforcement at two levels. To avoidthe unwanted build-up of moisture within the enclosures achemical desiccant was included with the accelerometers.The accelerometers and protective housings had a low massto minimise inclusion effects such as frequency alteration.
The pile-tip load cell was also installed to investigate thesignificant differences between shaft and tip response duringrapid load tests as identified by Brown (2004). The pile-tipload cell consisted of an upper and lower plate separated bythree strain-gauged load columns (Fig. 5), calibrated in thelaboratory to a maximum load of 600 kN. The upper andlower load cell plates were fabricated from 40 mm thickmild steel plate, 500 mm in diameter. Each load columnconsisted of a cylinder 210 mm in length with an outerdiameter of 43.74 mm and a wall thickness of 18.74 mmmachined from high-strength, low-hysteresis stainless steel.The strain gauges on the load columns were protected bylayers of polyurethane and wax, and then the whole columnwas surrounded by a thin-walled stainless steel cylinder thatslotted into O-ring seals in the top and bottom end plates(Brown, 2004). The cable from the load cell was taken tothe surface via two lengths of galvanised steel pipe cast inthe pile. This was surrounded by a PVC pipe to de-bond itfrom the concrete. An inflatable packer was incorporatedbetween the top and bottom plates of the load cell to preventthe concrete from encasing the load cell (Fig. 6). This wasinflated with water to the in situ hydrostatic head of 120 kPaprior to the pouring of concrete, and left pressurised for24 h after concreting.
Soil instrumentationSix accelerometers in similar housings to those installed in
the pile were also installed in the soil surrounding the pile.As shown in Fig. 4 these were installed at two levels (4 mand 8 m BGL) corresponding to the levels of the acceler-ometers installed in the pile, with three at each level(4 m BGL: 3.05R, 5.04R and 8.5R; 8 m BGL: 2.89R, 4.70Rand 9.12R, where R is the pile radius). The radial locations ofthe accelerometers were chosen based upon accelerationsmeasured in a related laboratory calibration chamber studyinto the behaviour of model piles subject to rapid loading(Brown, 2004). To install the accelerometers a hollow casingof 36 mm internal diameter with a sacrificial tip was pushedto the required depth. The accelerometer in its own protectivecasing was lowered down the hollow casing until contact wasmade with the tip. The casing was then withdrawn as acement/bentonite grout was poured down the casing.
PILE TEST RESULTSThe pile testing programme was designed to compare the
results from rapid and static load tests. Rapid load piletesting commenced 35 days after the pile was installed. Thepile was subjected to five different target levels of rapidloading over a two-day period with an initial test taken to1163 kN on the first day followed by peak loads of 1700,2048, 2525 and 3071 kN on the second day (Table 2). Theactual peak loads measured at the pile head were alwayshigher than the related target loads. This was followed21 days later by a constant rate of penetration (CRP) testand a further 5 days after this by a maintained load test(MLT). Constant rate of penetration testing was carried outat 0.01 mm/s (ICE, 1997). The maintained load test wasundertaken as a proof load test followed by an extendedproof load test to the same specification. The design verifica-
������������� �
� �� �� �� ���
�
�
�
�
��
��
��
��
��
��
�������������
�������
� ����
�
�
�
�
��
��
��
��
��
��
��������� ���!�"#$�
� �%�� �%��
� �����&�����'�������
�%� �%� �%� �%�
�
�
�
�
�
��
��
��
��
��
������ ����
(�)
�*�+
� �
�,
�� �
���
��#
Fig. 2. Results from in situ testing in glacial lodgement till
RAPID LOAD TEST ON AN INSTRUMENTED BORED PILE IN CLAY 629

tion load chosen was 900 kN with a specified working loadof 900 kN (ICE, 1997). The testing programme is sum-marised in Table 2, which also lists the exact time intervalsbetween the different tests.
For rapid loading, a 3 MN tripod Statnamic device wasused with a hydraulic catch mechanism and 18 t weight pack
(Fig. 1). Load was measured by a load cell mounted in thebase of the piston device. The pile settlement was measuredby a photovoltaic sensor mounted in the base of the piston,which was excited by a laser reference beam (Middendorp,2000). For static loading, reaction was provided by beamsrunning over the test pile anchored to three auger-bored piles11.5 m long and 600 mm in diameter arranged in a triangu-lar pattern with two piles equidistant at 2.1 m from the testpile (centre to centre) and a third pile at the apex, 3.5 mdistant. Load was applied to the test pile by a hydraulic jackand measured by an independent calibrated load cell. Pilesettlement readings were provided by four linear variable
� ��� ��� ��� ����*�������,�*'�����"��
�
�
�
�
�
��
��
��
��
��
��
��
(�)
�*�+
� �
�,
�� �
���
��#
�� ������,�����-��
.�� �����
���-�� ����! '��/���
Fig. 3. Shear strength variation with depth for lodgement till
Table 1. Strength and undrained properties for glacial lodge-ment till
Property Value
Liquid limit: % 20–36Plastic limit: % 12–18Plasticity index: % 7–20Moisture content: % 14–24Specific gravity of solids 2.69Clay fraction: % , 2 �m 20–38Activity 0.35–1.07Coefficient of vertical permeability atvoid ratios of 0.40–0.42: m/s
3–5 3 10�11
Cc 0.03–0.04e0 0.53–0.64Slope of critical state line projected toq9–p9 plane
1.07
�%0��#123�
�%���#123
�%���#123
�%���#123
�%���#123
��%���#123
��%0��#123
��%�0�#1233� ���
�%���#123
������,��,� �������+�
�%����# �,����� )� ��� ����
�
�
�
�
�%���#123
4��� �#����
Fig. 4. Schematic of auger-bored pile and instrumentationlocations (not to scale). Levels shown are initial levels prior topile testing
Fig. 5. Pile-tip load cell with top plate removed and loadcolumns visible
630 BROWN, HYDE AND ANDERSON

displacement transducers (LVDTs) placed on the pile andreferenced to a remote beam.
Load and settlement behaviourThe load–settlement behaviour for each of the pile tests is
shown in Fig. 7. The loads measured during rapid load testingdo not start at zero because, prior to testing, the 18 t reactionmass was lowered onto the pile. The settlement of the pile isnot normally monitored during this operation. The settlementsassociated with the maximum pile-head loads are shown inTable 2. It is immediately apparent from comparison of thehigher-magnitude rapid load tests (Tests 4 and 5) with thestatic tests (Tests 6 and 7) that, although much greater loadswere applied to the pile during rapid load testing, the resultingmaximum and residual deflections were smaller. Pile yield andultimate resistance can be easily identified from the static testdata. This is not so evident on inspection of the results fromthe rapid load tests despite the maximum load for the 3000 kNtest exceeding the maximum static loads for CRP and MLT byfactors of 1.39 and 1.71 respectively.
Load distribution on the pile during testsTo analyse the results from the embedded sister bars, it
was necessary to determine the stiffness of the pile. The pilestiffness was determined in situ from the first loading cycleof the maintained load test by considering the strain in theuppermost sister bars (Level 1, Fig. 4) which were locatedwithin the sleeved section of the pile. The tangent modulus(Ect) for concrete in the pile was calculated using (Delpak etal., 1998)
Ect ¼Ph � Es As1�1
�1 Ac1
(1)
where Ph is the pile-head load (kN) applied in the first cycle,Es is the Young’s modulus of the steel (taken as 200 kN/mm2), As1 is the cross-sectional area of reinforcing steelin mm2 at level 1 including the sleeve, �1 is the strain in theconcrete at level 1, and Ac1 is the cross-sectional area of theconcrete pile at level 1.
The concrete tangent modulus was found to vary withincreasing strain from 28 to 24 kN/mm2. This comparedwith an average secant modulus of 31 kN/mm2 found duringconcurrent laboratory testing of concrete cylinders ( fcu ¼44 N/mm2) to BS 1881 (BSI, 1983). Although Delpak et al.(1998) used a non-linear tangent modulus–strain relation-ship, a linear approach was found to be adequate in thiscase. This was then used to find the axial force (Pi) at thedifferent levels in the pile using
Pi ¼ �i � dEct
d��i þ Ect0
� �Aci þ Es Asi
� �(2)
where Ect0 is the apparent tangent modulus at zero strain.The pile stiffness was calculated from the results of the
MLT and used for the load transfer analyses for the CRPand rapid load tests.
The results from the load transfer analysis for the rapidload test with a target load of 3000 kN (Test 5) are showncompared with the CRP (Test 6) and MLT (Test 7) at variousloads in Figs 8–10. The local unit shaft friction along withthe calculated axial force along the pile was derived fromthe load gradients between the strain gauges. Values for theunit shaft resistance between strain gauge Levels 1 and 2 arenot shown owing to the transition from the steel frictionreducing casing to soil–concrete contact.
In Fig. 8 the loads are shown for the maximum loadapplied in each type of pile test (Table 2). In Fig. 9, com-parison is made at a load of 1800 kN, which represents the
Fig. 6. Pile-tip load cell prior to installation with packer deflated
Table 2. Pile testing programme with pile load–settlement summary
Test no. Test type Tsu:days
Targetload: kN
Max. appliedload: kN
�h at maxload: mm
Max. �h duringtest: mm
�h at testend: mm
�h at testend/max. �h: %
1 RLT 35 1000 1163 3.13 3.27 0.88 272 RLT 35.7 1500 1700 5.08 5.50 1.46 273 RLT 35.7 2000 2048 6.46 7.09 1.68 244 RLT 35.7 2500 2525 6.86 8.63 2.48 295 RLT 35.8 3000 3071 7.92 10.96 4.42 406 CRP 56.9 – 2205 26.78 26.78 21.90 827 MLT 61.7 – 1800 23.05 23.05 19.47 85
� ��� ���� ���� ���� ���� ���� ���� ������ ��*�� � � ��"5
�
��
��
��
��
��
��
�� �
�*��
���
�� �#
�����
##
6�)� � � �������!� ����������#+���������������������)����������������#+������������� � � �������������#+��0�
�����"5��!� ����������"5��!� �����
�����"5��!� ����������"5��!� �����
�����"5��!� �����
Fig. 7. Pile load–settlement history from different load-testingmethods
RAPID LOAD TEST ON AN INSTRUMENTED BORED PILE IN CLAY 631

� ���� ���� ���� ����4-�� �&����"5
� �� ��� ���3�� �������*�&�������������"5$#�
�
�
�
�
�
��
��
(�)
�*�+
� �
�,
�� �
���
��#
�����"5�63�����
�6�����
�3���0�
�
�
�
�
�
��
��
Fig. 8. Axial loads and shaft resistances from pile instrumentation during RLT andmaintained load and constant rate of penetration static load tests at maximum applied loads
���� ����� ���� ����
4-�� �&����"5
� �� ��� ���3�� �������*�&�������������"5$#�
�
�
�
�
�
��
��
(�)
�*�+
� �
�,
�� �
���
��#
�����"5�63�����
�6�����
�3���0�
�
�
�
�
�
��
��
���
Fig. 9. Axial loads and shaft resistances from pile instrumentation during RLT andmaintained load and constant rate of penetration static load tests (1800 kN load)
632 BROWN, HYDE AND ANDERSON
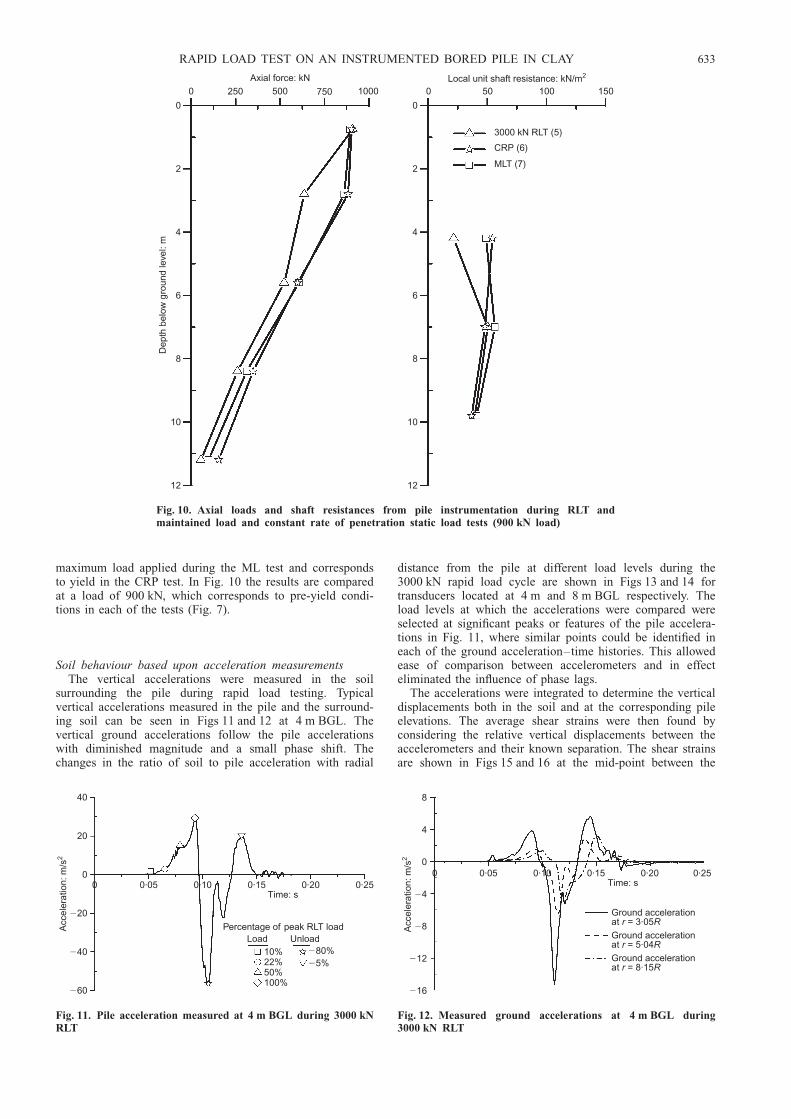
maximum load applied during the ML test and correspondsto yield in the CRP test. In Fig. 10 the results are comparedat a load of 900 kN, which corresponds to pre-yield condi-tions in each of the tests (Fig. 7).
Soil behaviour based upon acceleration measurementsThe vertical accelerations were measured in the soil
surrounding the pile during rapid load testing. Typicalvertical accelerations measured in the pile and the surround-ing soil can be seen in Figs 11 and 12 at 4 m BGL. Thevertical ground accelerations follow the pile accelerationswith diminished magnitude and a small phase shift. Thechanges in the ratio of soil to pile acceleration with radial
distance from the pile at different load levels during the3000 kN rapid load cycle are shown in Figs 13 and 14 fortransducers located at 4 m and 8 m BGL respectively. Theload levels at which the accelerations were compared wereselected at significant peaks or features of the pile accelera-tions in Fig. 11, where similar points could be identified ineach of the ground acceleration–time histories. This allowedease of comparison between accelerometers and in effecteliminated the influence of phase lags.
The accelerations were integrated to determine the verticaldisplacements both in the soil and at the corresponding pileelevations. The average shear strains were then found byconsidering the relative vertical displacements between theaccelerometers and their known separation. The shear strainsare shown in Figs 15 and 16 at the mid-point between the
� ����4-�� �&����"5
� �� ��� ���3�� �������*�&�������������"5$#�
�
�
�
�
�
��
��
(�)
�*�+
� �
�,
�� �
���
��#
�����"5�63�����
�6�����
�3���0�
�
�
�
�
�
��
��
������ 0��
Fig. 10. Axial loads and shaft resistances from pile instrumentation during RLT andmaintained load and constant rate of penetration static load tests (900 kN load)
��
��
�
���
���
���
� �%�� �%�� �%�� �%�� �%����#����
�������,��&�)��"�63�� � 3� 7� �
��8��8��8���8
���8��8
4��
� �
���
���#
$��
Fig. 11. Pile acceleration measured at 4 m BGL during 3000 kNRLT
�
�
�
��
���
���
� �%�� �%�� �%�� �%�� �%����#����
��
2�� ����� ����������9��%���2�� ����� ����������9��%���2�� ����� ����������9��%���
4��
� �
���
���#
$��
Fig. 12. Measured ground accelerations at 4 m BGL during3000 kN RLT
RAPID LOAD TEST ON AN INSTRUMENTED BORED PILE IN CLAY 633

accelerometers. The engineering shear strains derived fromthe accelerometers were each considered at the same pointin time. These strain values were then used to find indicativeshear stresses (Figs 17 and 18) by using shear modulus va-lues (G) for the appropriate strain level derived from mono-tonic triaxial testing and the in situ seismic CPT (Fig. 19).
As the resolution of standard strain-measuring devices intriaxial testing is inadequate for determining strains over therange considered, comparison was made with previous deter-minations by Powell & Butcher (2003) and Hird et al.(1991). Their determinations were based upon a combinationof laboratory and in situ techniques including resonantcolumn tests, stress path triaxial testing with local strainmeasurement, self-boring and cone pressuremeters as well aslarge instrumented plate load tests. The shear modulusvalues derived from the monotonic triaxial tests on samplesfrom 4 and 8 m BGL were normalised by the shear modulus
�
�������,��&�)��"�63�� � 3� 7� �
��8��8��8���8
���8��8
� � � � � 0 � / ��5#� ��� �� �� �)�����'����
�
�%�
�%�
�%�
�%�3
�� ��
���
���
��$
�� �
����
� �
���
�
Fig. 13. Influence of pile loads on soil acceleration at 4 m BGLduring 3000 kN RLT
�
�������,��&�)��"�63�� � 3� 7� �
��8��8��8���8
���8��8
� � � � � 0 � / ��5#� ��� �� �� �)�����'����
�
�%�
�%�
�%�
�%�
3��
����
� �
���
�$�
� ���
���
���
��
Fig. 14. Influence of pile loads on soil acceleration at 8 m BGLduring 3000 kN RLT
�
�������,��&�)��"�63�� � 3� 7� �
��8��8��8���8
���8��8
� � � � � 0 � / ��5#� ��� �� �� �)�����'����
�
�%��
�%�
�
��
4��
�,�
��*�
���
���
�'��
���8
Fig. 15. Average shear strain at 4 m BGL during 3000 kN RLT
�
�������,��&�)��"�63�� �
3� 7� � ��8��8��8���8
���8��8
� � � � � 0 � / ��5#� ��� �� �� �)�����'����
�%���
�%��
�%�
�
��
4��
�,�
��*�
���
���
�'��
���8
Fig. 16. Average shear strain at 8 m BGL during 3000 kN RLT
�������,��&�)��"�63�� �
3� 7� �
��8��8��8���8
���8��8
5
#�
���
��*�
���
���
����
$��
� � � � � � 0 ��
�%�
�%�
�%�
�%�
�%�
�%�
�%�
5#� ��� �� �� �)�����'����
Fig. 17. Average shear stress at 4 m BGL during 3000 kN RLT
�������,��&�)��"�63�� �
3� 7� �
��8��8��8���8
���8��8
5
#�
���
��*�
���
���
����
$��
� � � � � � 0 ��
�%�
�%�
�%�
�%�
�%�
�%�
�%�
5#� ��� �� �� �)�����'����
Fig. 18. Average shear stress at 8 m BGL during 3000 kN RLT
634 BROWN, HYDE AND ANDERSON

determined from the seismic CPT results (G0) at the appro-priate depth, and show good correlation with those sum-marised from other studies. The best fit to the data from thisstudy and those undertaken previously was then used todetermine the appropriate shear modulus for the strainsbeing considered. Values of shear stress at the pile interfacewere derived separately from the local unit shaft resistancebased upon pile instrumentation readings, as shown inFigs 8–10.
DISCUSSION OF TEST PILE RESULTSInstrumentation performance
Although the sister bar reinforcement and accelerometersperformed without fault during the investigation, problemswere experienced with the pile-tip load cell. These problemswere characterised by non-uniform load distribution on thethree columns in the load cell (Fig. 5) during the rapid loadtests. Thus the pile-tip loads have not been presented, asthey were not considered reliable. The skin friction mighthave been inferred below the lowest sister bar by assumingconstant frictional resistance derived from the bars above,but this was avoided, as Borghi et al. (2001) showed thatsignificant localised increase in elastic normal stresses mayoccur on the shaft near the tip due to end bearing. The non-uniform load on the pile-tip load cell may have been causedby tilting of the cell during installation.
Load and settlement behaviourFor the purposes of this paper the initial part of the load–
displacement curve for each test will be referred to as the‘apparently linear’ portion. The term ‘elastic’ has not beenused to define this behaviour as the true elastic range of soilbehaviour is much smaller than was measured during piletesting. The non-linear portion is then defined as the yield-ing or plastic zone. Comparison of the results from thedifferent pile tests is shown in Fig. 20 with pile settlementreset to zero between tests. The load–settlement behaviourof the pile is very similar for all tests in the apparentlylinear zone up to 1000 kN, which is approximately 50% ofthe ultimate CRP static pile capacity. After this, the stiffnessfor the rapid load test exceeded the static load test stiffnessas the static tests began to yield. The ML and CRP test hadsimilar stiffness up to 1350 kN, at which point the MLTdisplayed an abrupt yield. Significant plunging of the pileduring ML testing was encountered at a load of 1800 kN.
Although rapid load testing was taken to the maximumtest load of 3000 kN, it can be assumed that larger residualpile settlements would have been achieved if greater loadshad been applied. Based upon the results, it is proposed thatthe minimum applied target load during rapid load testing inclays must be at least 1.7 times the design ultimate staticcapacity to allow direct comparison of rapid and static tests.
Shaft capacity and load transferThe load transfer from pile to soil was calculated from
the change in pile load measured between two points.Examination of the change in axial force between the upperstrain gauge positions (Levels 1 and 2) shown in Figs 8, 9and 10 reveals that considerably greater load transfer oc-curred during rapid load testing than during the other typesof test. This greater load transfer between Levels 1 and 2 forrapid load tests could be due to the upper very stiff claylayer, which had correspondingly high cone resistance andS-wave velocities, having a higher resistance to rapid loadingdespite the presence of the friction-reducing casing. Whereaxial loads are compared at similar load levels of 900 and1800 kN for each test (Figs 9 and 10), loads in the pile shaftduring rapid load testing are lower than those during statictesting, thus indicating that greater load transfer had oc-curred at the top of the pile.
In Fig. 8 the maximum load levels are different in eachcase. However, the decay in axial force in the pile is greaterfor the rapid load test, indicating a higher degree of loadtransfer. This said, it is difficult to establish whether similarconditions of pile mobilisation had been reached in the rapidload test as in the static tests. Although far greater loadswere applied during the rapid load test, much smallerresidual deflections were observed (Table 2).
The peak shaft resistances shown in Fig. 8 illustrate theenhancement associated with rapid load tests at ultimate loadconditions. The shaft resistance between 4 m and 10 m BGLfor the rapid load test varied from 96 to 130 kN/m2 at peakload, which is approximately 30% higher than the MLTresults and 20% greater than the CRP values. At peak loadduring the rapid load test, the pile-head velocity was475 mm/s compared with 0.01 mm/s during the CRP test.This confirms that pile shaft resistance is significantly influ-enced by pile loading rate after soil yielding has occurred.In contrast, the shaft resistances below Levels 1 and 2 forthe rapid load test at load levels of 900 and 1800 kN areactually similar to or lower than those encountered in thestatic load tests even though the pile-head velocities were 70and 290 mm/s respectively. At these load levels (900 and
�%���� �%��� �%�� �%� � ���*��������'�����8
�%�
�%�
�%�
�%�
�%�
�
5
#�
���
��*�
��#
�
��'�
��
4���#� ���:���)&� ����-�� �#�����#�������#123����-�� �#�����#�������#123�
6��,��&��� ����&#� �+��!�� ���������������,�)������ +!���� ��� �1���*����������� .� ���� ����//��
6�������� �#����������� ��� �1���*�'������
Fig. 19. Shear modulus profile used to determine average shearstresses from ground accelerometers
� ��� ���� ���� ���� ���� ���� ���� ������ ��*�� � � ��"5
�
�
��
��
��
��
��
�� �
�*��
���
�� �#
�����
##
�����"5�63������6������3���0�
Fig. 20. Pile load–settlement history from different load testingmethods (pile-head settlement zeroed)
RAPID LOAD TEST ON AN INSTRUMENTED BORED PILE IN CLAY 635

1800 kN) the 3000 kN rapid load test result was still in thepre-yield apparently linear phase rather than the post-yieldplastic phase of loading (Fig. 20), and much of the loadtransfer was occurring in the stiff near-surface clay layer.When the rapid load test results are compared with the staticresults in the pre-yield apparently linear phase of the testthere is no significant enhancement of stiffness. This impliesthat the rate-dependent or viscous behaviour was not in-itiated until yield of the soil had occurred (Fig. 20). This isconsistent with laboratory element testing of fine-grainedsoils presented by Tatsuoka et al. (1997), who showed thatthere was no rate effect within the elastic region of a soil’sbehaviour at very small strains. As the strain level increasedtowards that consistent with the apparently linear phase ofpile behaviour the soils displayed a high degree of ratesensitivity. Richardson & Whitman (1963) and Lefebvre &LeBoeuf (1987) also noted that pore pressure was unaffectedby strain rate at strains less than 0.5%, although it should benoted that the maximum strain rates used in these laboratorystudies are typically closer to those associated with staticpile tests.
Soil behaviour derived from ground accelerationsThe ground accelerations had decayed markedly by a
radial distance 3R and had fallen below 20% of the pile’sacceleration by 6R. It is clear from Figs 13 and 14 that theground accelerations vary with changing load level during arapid load test. These accelerations are at a maximum at lowloads, reducing to a minimum at peak load. This wouldsuggest a decoupling of the pile acceleration from that ofthe soil on approaching peak load, as originally proposed byRandolph & Simons (1986), who suggested that accelerationof the soil mass would occur only during the initial pre-yieldapparently linear loading phase. After this, the pile and arelatively small annulus of soil would shear relative to thelarger soil mass, and rate-dependent soil shear resistancewould need to be considered. This model of pile–soil loadtransfer is consistent with the measurements of shaft resis-tance discussed above, where little enhancement of shaftresistance was noted prior to yielding. This said, the soilagain begins to accelerate with the pile during unloading.For instance, in Fig. 13 during unloading the proportion ofacceleration experienced by the soil (local acceleration) at80% peak RLT load is similar to that observed at 50% peakRLT load during the loading phase.
The derived shear strains (Figs 15 and 16) show increasingaverage shear strain in the soil with increasing applied pileload up to peak load. After this the shear strain continues toincrease as the pile unloads. This is consistent with thetypical RLT load–displacement behaviour shown in Fig. 20,where maximum pile displacement occurs at post-peak loads.The strains at 4 m and 8 m BGL (Figs 15 and 16) are similarin magnitude, but at 8 m BGL the smooth radial decay ofstrains is not apparent between 3R and 4R. This is due to theadjacent accelerometer readings having comparable magni-tudes between 2.89R and 4.70R (Fig. 12), which may havebeen the result of a variation in localised radial soil propertiesor the presence of a stiff inclusion. The results show that theshear strains at 2R and beyond may be classified as smallstrain (as defined by Viggiani & Atkinson, 1995) during theRLT test, with large strains being experienced only at 2R atmaximum pile displacement and beyond.
The radial variation of average vertical shear stress nor-malised by the undrained shear strength is shown in Figs 17and 18. The shear stresses are consistent with the strains,except that the stresses at the pile/soil interface obtainedfrom the pile instrumentation are a maximum at the peakapplied pile load. During unloading the shaft resistance
reduces rapidly, resulting in a lag between the change in soilstress close to the pile and that at a distance such that whenthe load has reduced to 5% of the peak value the shearstress at 2R is higher than the shaft friction.
In Figs 13 and 14 the acceleration ratios from 4.5R out-wards were similar for the two levels of 4 m and 8 m; theproportion of acceleration at 3.05R at 4 m BGL was greaterfor all but the peak load. This is likely to have beeninfluenced by the degree of mobilisation of soil shearstrength, which, as can be seen in Figs 17 and 18, wassignificantly lower at 4 m BGL than at 8 m BGL.
ANALYSIS OF RAPID LOAD TESTS IN GLACIAL TILLThe aim of undertaking rapid load testing was to obtain
the equivalent ultimate static pile behaviour and to test thefindings as part of a Class B prediction (Lambe, 1973).Randolph & Deeks (1992) proposed that the ultimate shaftresistance of a pile subjected to loading at elevated penetra-tion rates during dynamic testing could be represented by
�d ¼ �s 1 þ Ƙ�
�0
� ��
�Ƙ�min
�0
� ��" #
(3)
where �d is the pile shaft resistance at an elevated penetra-tion rate; �s is the shaft resistance at a low penetration rate,similar to those encountered during static pile testing; ˜v isthe relative pile/soil slip velocity; ˜vmin is the relative pile/soil slip velocity in a ‘static’ test; v0 is a reference velocitytaken as 1 m/s; and Æ and � are rate parameters. Theequation above is based upon that proposed by Smith (1962)for dynamic soil pile interaction but modified to incorporatenon-linear rate effects, as proposed by Gibson & Coyle(1968).
Simulation of model rapid load tests by Brown et al.(2004) verified that equation (3) was also valid for the ratesof penetration associated with rapid load testing, which arelower than those encountered during dynamic testing. Brown(2004) proposed that, for determination of the ultimate staticequivalent pile resistance from a rapid load test in fine-grained soils ( Fstatic(ultimate)), where the majority of a pile’scapacity was derived from shaft resistance, the followingcould be used.
Fstatic(ultimate) ¼FSTN � M €xxð ÞPile
1 þ Æ ˜�=�0ð Þ�� Æ ˜�min=�0ð Þ�(4)
where FSTN is the measured pile-head load, M is the mass ofthe pile, and €xx is the measured or calculated pile acceleration.
Values for the parameters Æ ¼ 1.26 and � ¼ 0.34 wereobtained by Brown (2004) testing model piles in a calibra-tion chamber in a kaolin, silt and sand mixture. The modelpiles instrumented with pore water pressure and skin and tipload transducers were made from stainless steel with adiameter of 70 mm and a typical embedded length of800 mm. They were installed in pre-bored holes prior tofinal consolidation, and CRP testing was undertaken at ratesup to 500 mm/s. Balderas-Meca (2004), testing both thecalibration chamber clay and the glacial till described aboveusing varying-rate triaxial shear tests, showed that the rateparameters, though different under triaxial conditions, werealmost identical for the two materials. The calibration cham-ber values were therefore adopted for analysing the full-scalepile test data.
The results of this method of analysis for the 3000 kNrapid load test are presented in Fig. 21. These results havebeen compared with those obtained by using the unloadingpoint method (Kusakabe & Matsumoto, 1995). The pile-headsettlement chosen as the point of comparison for the three
636 BROWN, HYDE AND ANDERSON

types of test was limited by the deflection in the rapid loadtest. A deflection of 8.85 mm was chosen because this was arecorded data point close to the peak for the rapid load testand within the ultimate yield zones for the ML and CRPtest. The predicted static capacity of 1746 kN was only 10%less than the measured CRP load of 1946 kN. In comparison,the unloading point method (UPM) overpredicts the pilecapacity by 31% and fails to define a clear yield point.Although the rate parameters used in equation (4) werebased upon model pile CRP tests (Brown, 2004), it isinteresting to compare the results with the MLT data,particularly as the maintained load test is the preferredmethod of testing piles in the UK. The maximum predictedload of 1746 kN compares well with the load of 1800 kN atwhich plunging of the pile occurred during MLT.
Application of the analysis in the pre-yield phase ofloading results in an underprediction of stiffness. This isalso true for the UPM. This is not surprising, as theempirical rate parameters used in equation (4) were devel-oped based upon ultimate model pile behaviour as discussedabove. Results from soil accelerometers suggest that the soilsurrounding the shaft has limited inertial and dampingresistance during this phase of loading. It is interesting tonote that static and raw RLT load–settlement data up to30% of the peak rapid load are very similar and may offeran empirical method of estimating pile stiffness up to work-ing loads (Fig. 20).
It should be noted that the results from the analysis of therapid load test and the subsequent comparison with the resultsof static pile testing will be affected by the adoption ofmultiple testing of a single pile. This approach is likely tohave greatest influence on the results from the pre-yield phaseof loading. This can be seen in the work of Marsland &Powell (1980), who, carrying out a series of large-diametercyclic plate load tests in the same till deposit, showed thatthere was no significant change in ultimate capacity measuredby CRP testing after cyclic loading, but there was an overallstiffening of response in the pre-yield phase. Lehane &Jardine (1994), testing model jacked-in displacement piles atthe same site, concluded that retesting the piles resulted inalteration of the soil fabric, described as plastic hardening,with radial effective stresses being approximately 15% higherin all retests. However, the relative disturbance of the soilfabric is likely to be greater for a displacement pile than forthe auger-bored pile described here.
The results of this study highlight the need for anappreciation of the significance of damping in clay soilswhen specifying rapid load pile testing. To develop a fullRLT analysis method greater knowledge is required of soil
rate effects for different soil types. These parameters may bederived from full-scale RLT-static comparisons or laboratorymodel and element tests, as undertaken by Brown (2004)and Balderas-Meca (2004).
CONCLUSIONSRapid load pile tests offer the potential for cost and time
savings for the quality control of deep foundations. Loadtransfer data obtained from a full-scale instrumented pile in aglacial clay, which derived the majority of its capacity fromskin resistance, have been used to show that enhanced shaftresistance as a result of viscous rate effects is significant onlyafter yield of the pile–soil interface. Prior to this, in theapparently linear phase of loading there was no significantenhancement of shaft resistance due to penetration rate.
Accelerometers in the pile and surrounding soil indicatedthat the proportion of acceleration transferred to the groundreduced with increasing pile load up to the peak rapid load.The low soil accelerations at the peak rapid load providedevidence of decoupling of the pile acceleration from thesurrounding ground. Vertical shear strains derived from theacceleration readings were in all cases reduced to less than1% beyond two pile radii.
A simple non-linear viscous rate model originally pro-posed by Randolph & Deeks (1992) gave a Class B predic-tion of ultimate pile capacity that lay between the valuesobtained for static ML and CRP tests. Use of this model inthe apparently linear zone significantly underestimated pre-yield pile stiffness. It is, however, interesting to note thatstatic and raw RLT load displacement data up to 30% of thepeak rapid load are very similar, and this may offer anempirical method of estimating pile stiffness up to workingloads, although this point requires verification for a pile thathas only been subjected to first time static loading.
Where rapid load pile testing is specified in clay soils,care should be taken to verify that the testing device hassufficient capability to mobilise the test pile capacity atelevated pile penetration rates. To allow derivation of theequivalent ultimate static pile behaviour from rapid loadtests in clays, the minimum applied target load must be atleast 1.7 times the predicted ultimate static capacity.
ACKNOWLEDGEMENTSThis research project was funded by the Engineering and
Physical Sciences Research Council (Grant No. GR/R46939/01). Technical assistance was provided by BerminghammerFoundation Equipment (Canada) and TNO Building Re-search (Netherlands). The Expanded Piling Company (UK)kindly installed the piles and provided the research sitefacility. Rapid load testing and static pile load testing wereundertaken by Precision Monitoring and Control (UK). Conepenetration testing and ground accelerometer installationwere undertaken by Lankelma. Thanks are also extended toDr Juan Balderas-Meca for provision of the results fromelement testing of the glacial lodgement till.
NOTATIONAci cross-sectional area of concrete at pile level iAs i cross-sectional area of steel at pile level iCc slope of normal compression linecu undrained shear strength
Ect tangent modulus of concretee0 voids ratio of normally consolidated soil at
p9 ¼ 1.0 kPaEs Young’s modulus of steel
Fstatic(ultimate) derived equivalent ultimate static pile resistance
� ��� ���� ���� ���� ���� ���� ���� ������ ��*�� � � ��"5
�
�
��
��
��
��
��
�� �
�*��
���
�� �#
�����
##
�6������3���0�
�)�� ���� !�����������;���� ���7�����������;���� ���
Fig. 21. Comparison of derived ultimate static equivalent pilebehaviour with measured static CRP and ML tests
RAPID LOAD TEST ON AN INSTRUMENTED BORED PILE IN CLAY 637

FSTN measured rapid load test pile resistancefcu concrete cube strengthfs sleeve frictionG shear modulus
Go shear modulus from seismic wave measurementsM mass of element under considerationN standard penetration test N value
Ph pile-head loadPi pile axial force at level iqc cone resistanceR pile radiusr radial position under consideration
Tsu time interval between pile installation and pile testing˜v relative velocity of pile and soilv0 reference velocity
vmin lowest velocity used in derivation of rate parameters€xx pile accelerationÆ damping constant� damping constant�h pile-head settlement�s shear strain�i strain in the concrete at pile level i� shear stress�d shaft resistance at elevated rates�s shaft resistance at low rates
REFERENCESAnderson, W. F. (1974). The use of multistage triaxial tests to find
the undrained strength parameters of stony boulder clay. Proc.Inst. Civ. Engrs 57, Part 2, 367–372.
Balderas-Meca, J. (2004). Rate effects in rapid loading of clay soils.PhD thesis, University of Sheffield, UK.
Bell, A. (2001). Investigation into the increase in capacity withtime of precast piles driven into stiff overconsolidated clay. MScthesis, University of Sheffield, UK.
Berridge, N. G. & Pattison, J. (1994). Geology of the CountryAround Grimsby and Partington — Memoir for 1:50 000 Geolo-gical Sheets 81 & 82 and 90 & 91. Nottingham: BritishGeological Survey.
Borghi, X., White, D. J., Bolton, M. D. & Springman, S. (2001).Empirical pile design based on cone penetrometer data: anexplanation for the reduction of unit base resistance betweenCPTs and piles. Proc. 5th Int. Conf. on Deep FoundationsPractice, Singapore, 125–132.
British Standards Institution (1983). Testing concrete: Method fordetermination of static modulus of elasticity in compression, BS1881:Part 121. Milton Keynes: BSI.
Brown, D. A. (1994). Evaluation of static capacity of deep founda-tions from Statnamic testing. Geotech. Test. J. ASTM 17, No. 4,403–414.
Brown, M. J. (2004). The rapid load testing of piles in fine grainedsoils. PhD thesis, University of Sheffield, UK.
Brown, M. J., Anderson, W. F. & Hyde, A. F. L. (2004). Statnamictesting of model piles in a clay calibration chamber. Int. J. Phys.Modelling Geotech. 4, No. 1, 11–24.
Delpak, R., Robinson, R. B. & Omer, J. R. (1998). Assessment ofthe performance of large-diameter bored cast in situ pilesformed in Mercia Mudstone. Proceedings of the CIRIA confer-ence on the engineering properties of the Mercia MudstoneGroup, Derby, pp. 36–63.
Dunnicliff, J. & Green, G. E. (1988). Geotechnical instrumentationfor measuring field performance. New York: Wiley.
Gibson, G. C. & Coyle, H. M. (1968). Soil damping constantsrelated to common soil properties in sands and clays (bearingcapacity for axially loaded piles), Research Report 125-1, Study2-5-67-125, Texas A&M University, Texas, Texas TransportationInstitute.
Hird, C. C., Powell, J. J. M. & Yung, P. C. Y. (1991) Investigationof the stiffness of a glacial clay till. Proc. 10th Eur. Conf. SoilMech. Found. Engng, Florence, 107–110.
Holeyman, A. E., Maertens, J., Huybrechts, N. & Legrand, C.(2000). Results of an international pile dynamic testing predic-
tion event. Proc. 6th Int. Conf. on the Application of StressWave Theory to Piles, Sao Paulo, 725–732.
Hyde, A. F. L., Robinson, S. A. & Anderson, W. F. (2000). Rateeffects in clay soils and their relevance to Statnamic pile testing.Proc. 2nd Int. Statnamic Seminar, Tokyo, 303–309.
Institution of Civil Engineers. (1997). Specification for piling andembedded retaining walls, 1st edn. London: Thomas Telford.
Kusakabe, O. & Matsumoto, T. (1995). Statnamic tests of Shonantest program with review of signal interpretation. Proc. 1st Int.Statnamic Seminar, Vancouver, 113–122.
Lambe, T. W. (1973) Predictions in soil engineering. Geotechnique23, No. 2, 149–202.
Lefebvre, G. & Leboeuf, D. (1987). Rate effects and cyclic loadingof sensitive clays. J. Geotech. Engng ASCE 113, No. 3, 476–489.
Lehane, B. M. & Jardine, R. J. (1994) Displacement pile behaviourin glacial clay. Can. Geotech. J. 31, No. 1, 79–90.
Marsland, A. & Powell, J. J. M. (1980) Cyclic load tests on865 mm diameter plates in a stiff clay till. Proceedings of theinternational symposium on soils under cyclic and transientloading, Swansea, pp. 837–847.
McVay, M. C., Kuo, C. L. & Guisinger, A. L. (2003) Calibratingresistance factor in the load and resistance factor design ofStatnamic load testing, Research Report 4910–4504–823–12,Contract BC354, RPWO#42. University of Florida, FloridaDepartment of Transportation.
Middendorp, P. (1993). First experiences with Statnamic load test-ing of foundation piles in Europe. Proc. 2nd Int. Geotech.Seminar on Deep Foundations on Bored and Auger Piles, Ghent,265–272.
Middendorp, P. (2000). Statnamic the engineering of art. Proc. 6thInt. Conf. on the Application of Stress Wave Theory to Piles,Sao Paulo, 551–561.
Middendorp, P. & Bielefeld, M. W (1995). Statnamic load testingand the influence of stress wave phenomena. Proc. 1st Int.Statnamic Seminar, Vancouver, 207–220.
Mullins, G., Lewis, C. L. & Justason, M. D (2002). Advancementsin Statnamic data regression techniques. Proceedings of theASTM International Deep Foundations Congress, ASTM Geo-technical Special Publication No. 116, Vol. 2, pp. 915–930.West Conshohocken, PA: ASTM International.
Nishimura, S. & Matsumoto, T. (1995). Wave propagation analysisduring Statnamic loading of a steel pipe. Proc. of 1st Int.Statnamic Seminar, Vancouver, 23–33.
Powell, J. J. M. & Butcher, A. P. (2003) Characterisation of aglacial till at Cowden, Humberside. Proceedings of the interna-tional conference on the characterisation and engineering prop-erties of natural soils, Singapore, pp. 983–1019.
Randolph, M. F. & Deeks, A. J. (1992). Dynamic and static soilmodels for axial response. Proc. 4th Int. Conf. on the Applica-tion of Stress Wave Theory to Piles, The Hague, 3–14.
Randolph, M. F. & Simons, H. A. (1986). An improved soil modelfor one-dimensional pile driving analysis. Proc. 3rd Int. Conf.on Numerical Methods in Offshore Piling, Nantes, 3–17.
Richardson, A. M. & Whitman, R. V. (1963). Effect of strain rateupon undrained shear resistance of a saturated remoulded fatclay. Geotechnique 13, No. 4, 310–324.
Smith, E. A. L. (1962). Pile-driving analysis by the wave equation.J. Soil Mech. Found. Div. ASCE 127, Part I, 1145–1193.
Tatsuoka, F., Jardine, R. J., Lo Presti, D., Di Benedetto, H. &Kodaka, T. (1997). Characterising the pre-failure deformationproperties of geomaterials. Proc. 14th Int. Conf. Soil Mech.Found. Engng, Hamburg, 2129–2164.
Taylor, P. T. (1966). Age effects on shaft resistance and effect ofloading rate on load distribution of bored piles. PhD thesis,University of Sheffield, UK.
Viggiani, G. & Atkinson, J. H. (1995). Stiffness of fine-grained soilat very small strains. Geotechnique 45, No. 2, 249–265.
Weltman, A. J. & Healy, P. R. (1978). Piling in Boulder Clay andother glacial tills, CIRIA Report No. PG5. London: DOE andCIRIA Piling Group.
Wood, T. (2003). An investigation into the validation of pile per-formance using Statnamic tests. MSc thesis, Imperial College ofScience, Technology and Medicine, UK.
638 BROWN, HYDE AND ANDERSON