geotam (geographic texas air monitoring) user guide
TRANSCRIPT

GeoTAM (Geographic Texas Air Monitoring)
User Guide
Texas Commission on Environmental Quality
Office of Compliance and Enforcement Monitoring Division

2
Contents GeoTAM (Geographic Texas Air Monitoring) User Guide ......................................................................... 1
Application Overview ....................................................................................................................................... 3
Zoom Tools and Search Bar ............................................................................................................................ 4
Navigation Tools ........................................................................................................................................... 4
Search Bar ...................................................................................................................................................... 5
Search Tools .................................................................................................................................................. 6
Main Toolbar ................................................................................................................................................... 17
Measure tool ............................................................................................................................................... 17
Draw tool ..................................................................................................................................................... 20
Bookmark tool............................................................................................................................................ 22
Legend.......................................................................................................................................................... 23
Layer List ..................................................................................................................................................... 24
Basemap Gallery ........................................................................................................................................ 28
Print .............................................................................................................................................................. 29
Inset Map ......................................................................................................................................................... 31
Coordinate Indicator ..................................................................................................................................... 33
3
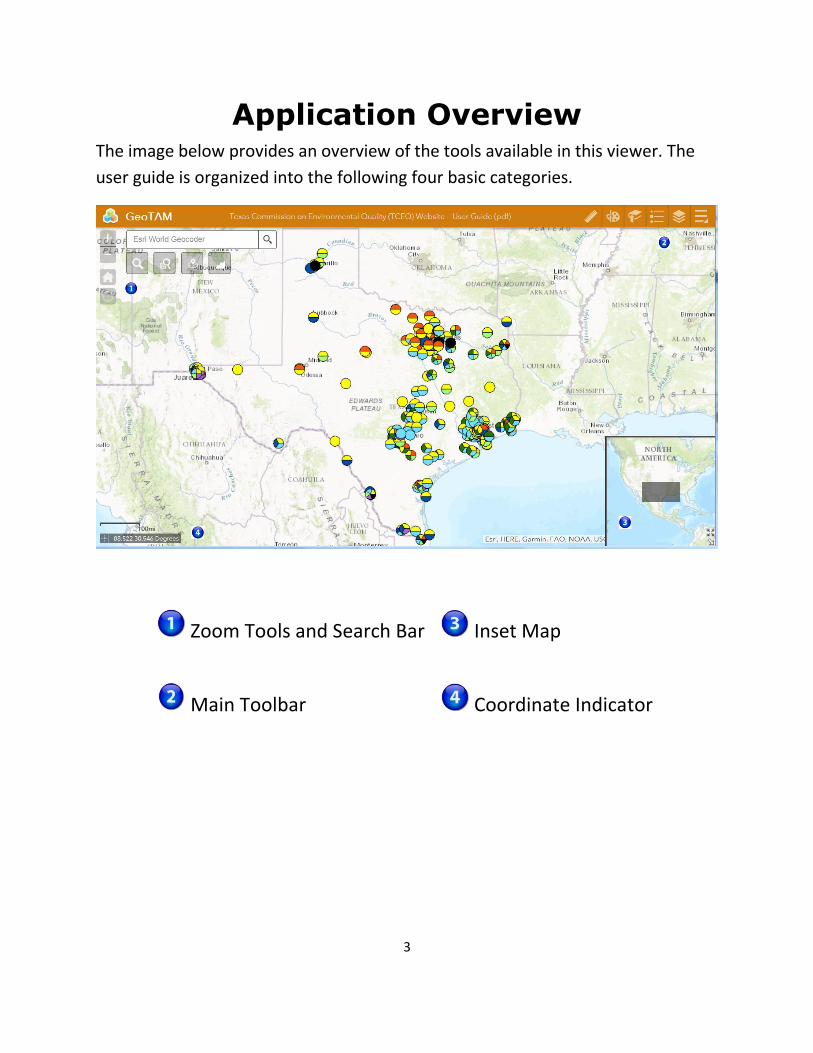
Application Overview The image below provides an overview of the tools available in this viewer. The
user guide is organized into the following four basic categories.
Zoom Tools and Search Bar Inset Map
Main Toolbar Coordinate Indicator

4
Zoom Tools and Search Bar
Use these tools to navigate within the viewer, and to search for different types of
features.
Navigation Tools
Icon Description
Zoom In – Click this button once or multiple times to zoom in at fixed
increments.
Zoom Out – Click this button once or multiple times to zoom out at fixed
increments.
Home – Click once to return to the default extent
5
Icon Description
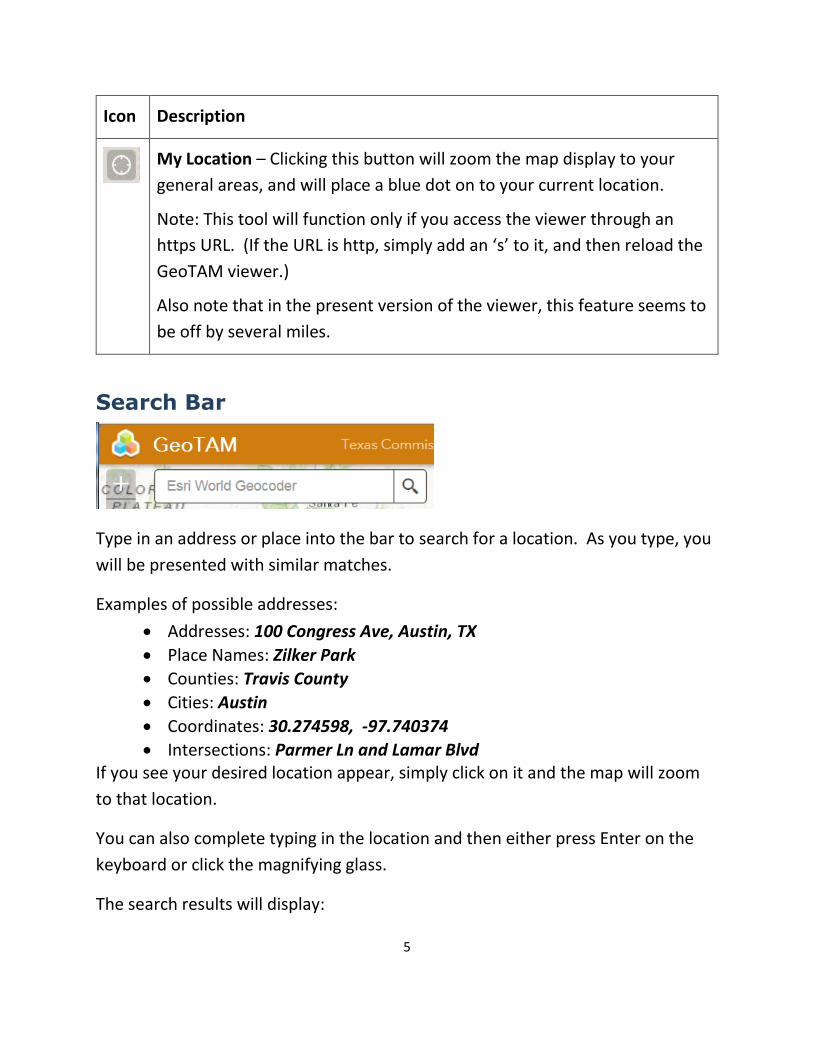
My Location – Clicking this button will zoom the map display to your
general areas, and will place a blue dot on to your current location.
Note: This tool will function only if you access the viewer through an
https URL. (If the URL is http, simply add an ‘s’ to it, and then reload the
GeoTAM viewer.)
Also note that in the present version of the viewer, this feature seems to
be off by several miles.
Search Bar
Type in an address or place into the bar to search for a location. As you type, you
will be presented with similar matches.
Examples of possible addresses:
Addresses: 100 Congress Ave, Austin, TX
Place Names: Zilker Park
Counties: Travis County
Cities: Austin
Coordinates: 30.274598, -97.740374
Intersections: Parmer Ln and Lamar Blvd If you see your desired location appear, simply click on it and the map will zoom
to that location.
You can also complete typing in the location and then either press Enter on the
keyboard or click the magnifying glass.
The search results will display:
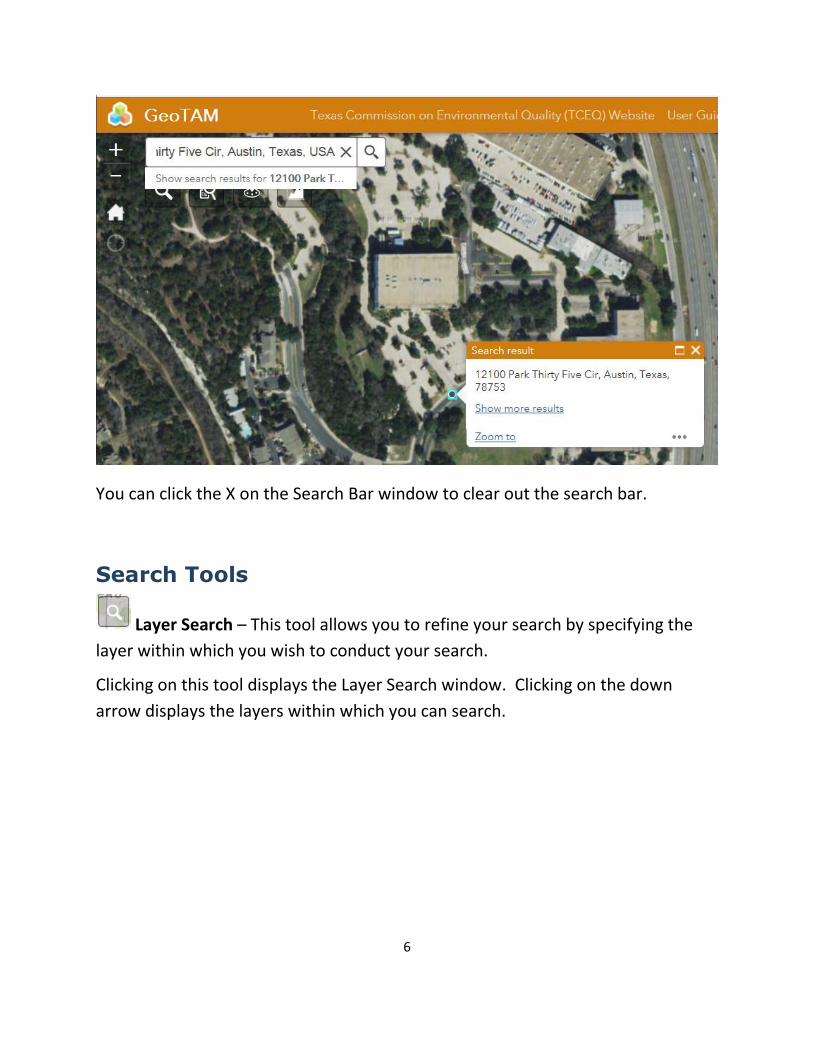
6
You can click the X on the Search Bar window to clear out the search bar.
Search Tools
Layer Search – This tool allows you to refine your search by specifying the
layer within which you wish to conduct your search.
Clicking on this tool displays the Layer Search window. Clicking on the down
arrow displays the layers within which you can search.

7
The example below displays the search results when you select TCEQ Regions (HQ
Name) and enter Dallas in the search window.

8
Select Sites by Area – This tools allows you to select a specific type of site
(Air Monitoring Sites, CAMS – Continuous Ambient Monitoring Stations, or TCEQ
Region) within a geographic area that you draw on the viewer using the cursor.
In the example below, after Air Monitoring Sites have been selected, the viewer displays a Spatial Filter window for Air Monitoring Sites.

9
Click on the Extent tool, then draw a box around the geographic area of interest.

10
Click on the Execute button. The viewer will zoom to the area you selected and display the results:

11
Clicking on the three ellipsis points in the upper right corner of the window gives you a list of menu options for viewing, analyzing, or exporting the results:
Near Me (Buffer Query)
This tool allows you to draw a buffer around a location you specify, either by providing an address or clicking on a location in the viewer.
The results list the monitoring sites that fall within that buffer.
12
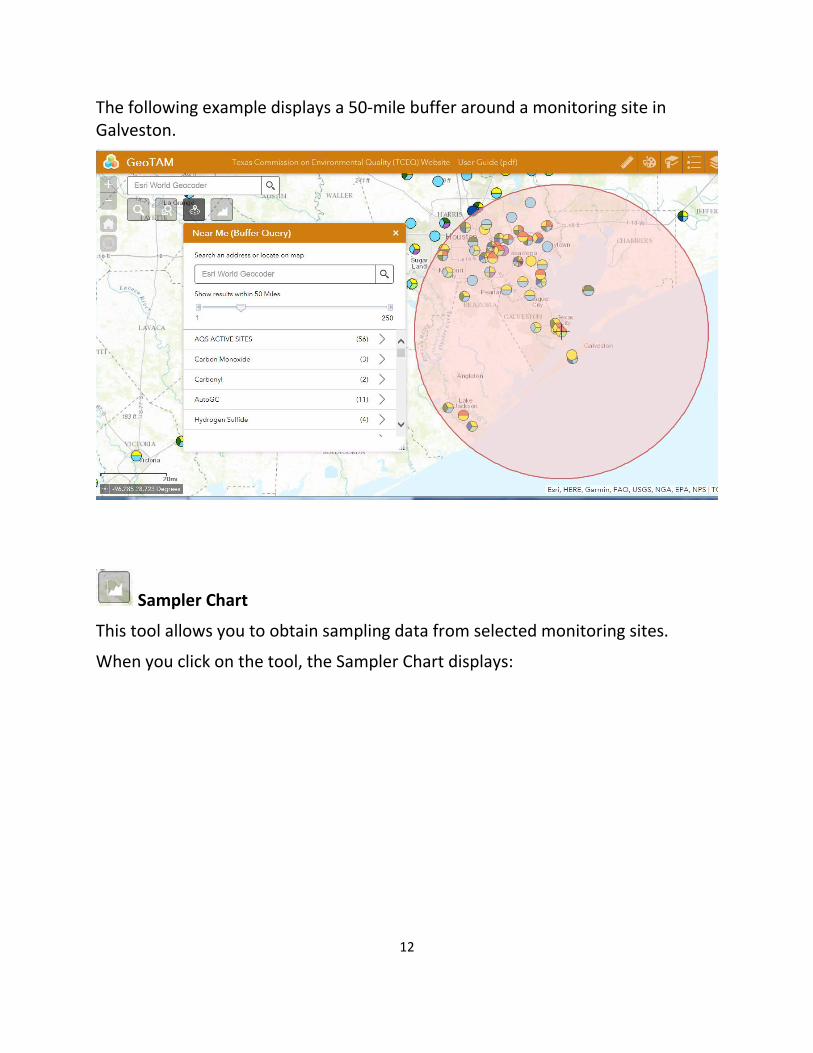
The following example displays a 50-mile buffer around a monitoring site in Galveston.
Sampler Chart
This tool allows you to obtain sampling data from selected monitoring sites.
When you click on the tool, the Sampler Chart displays:

13
At present, the AQS (Air Quality System) Active Sites geodatabase is the only data source that the viewer can access.
Clicking on the AQS Active Sites link (GDB_ADM.TCEQ_AQS_ACTIVE_SITES) opens a new window in the Sampler Chart window.

14
At present, the Options button does not function.
Clicking on the Use spatial filter to limit features check box allows you
to define the geographic extent of the features for which you want to
display sample results.
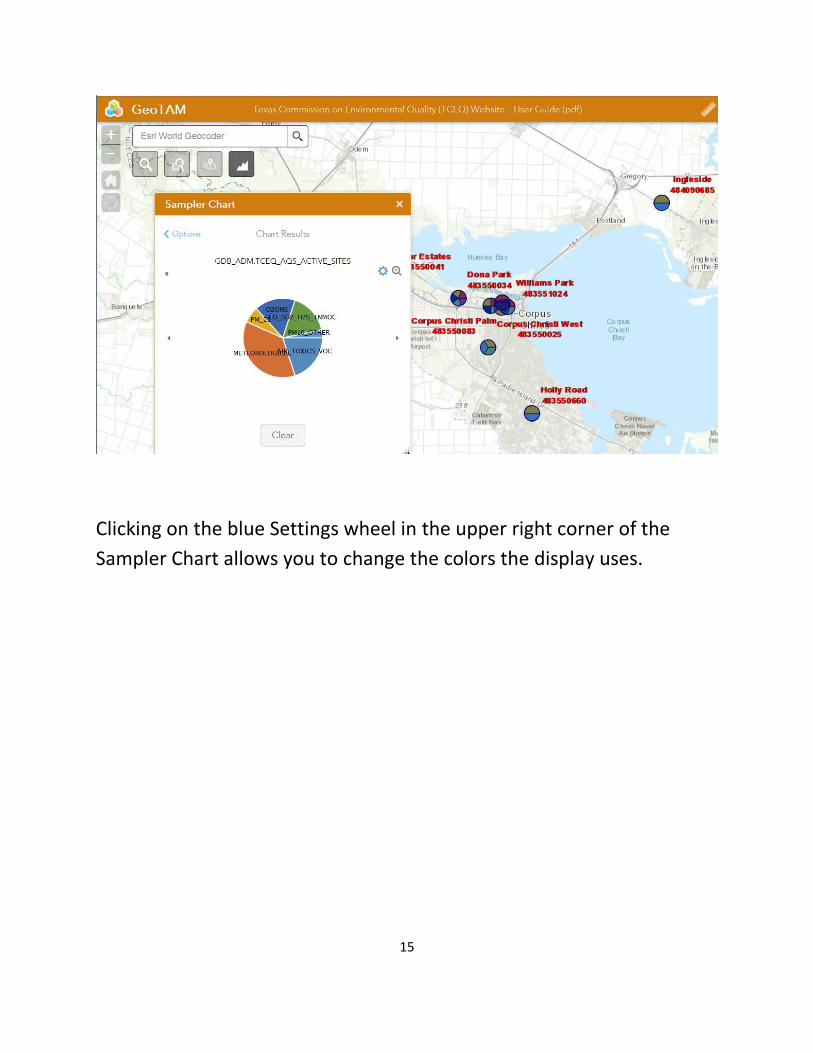
Clicking on the Apply button displays the sampling results for the
selected geographic area. The example below displays the distribution
of pollutants in the Corpus Christi area.
15
Clicking on the blue Settings wheel in the upper right corner of the
Sampler Chart allows you to change the colors the display uses.

16

17
Main Toolbar
Each of the tool buttons in the main toolbar opens a new window.
Each of these tools will be described in the following sections.
For each of the tool windows:
To collapse the window, click the tool on the Layer List bar.
To close the window, click the Close tool in the upper right hand corner.
Measure tool
The Measure tool enables the user to measure point, linear, and area features on
the map.

18
There are three different ways to measure features on the map, as represented in
the table below:
Icon Description
Area – Click this button, then choose a unit of measure from the drop-
down list.
Single-click the first point of your polygon on the map.
Continue to single-click until you have finished measuring your area
feature. Double-click to end.
Results will appear in the Measure window.
Distance – Click this button, then choose a unit of measure from the
drop-down list.
Single-click the first point of your line on the map.
Continue to single-click until you have finished measuring your linear
feature. Double-click to end.
Results will appear in the Measure window.

19
Icon Description
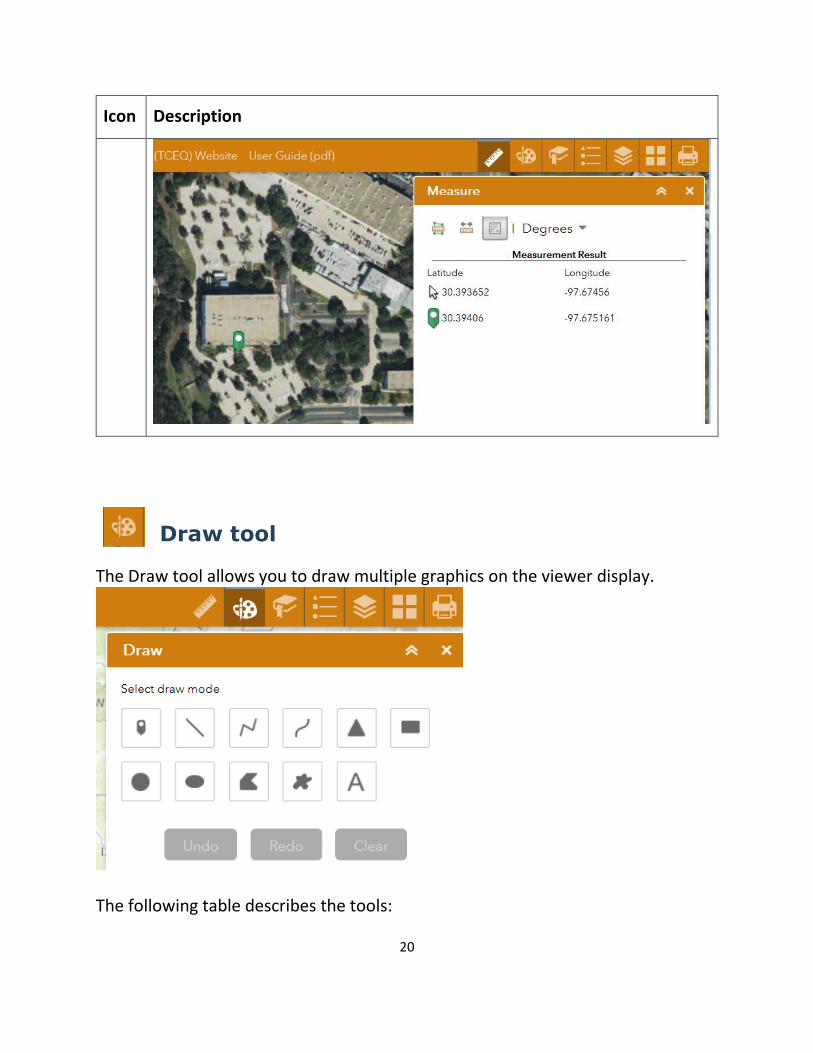
Location – Click this button, then choose a unit of measure from the
drop-down list.
Click a point on the map, then move the mouse across the map.
Clicking on a point will place a green cursor in the display window, along
with its location in the units of measurement you specified.
If you continue to move the mouse, the location will continuously appear
in the display window next to the arrow symbol.
20
Icon Description
Draw tool
The Draw tool allows you to draw multiple graphics on the viewer display.
The following table describes the tools:
21
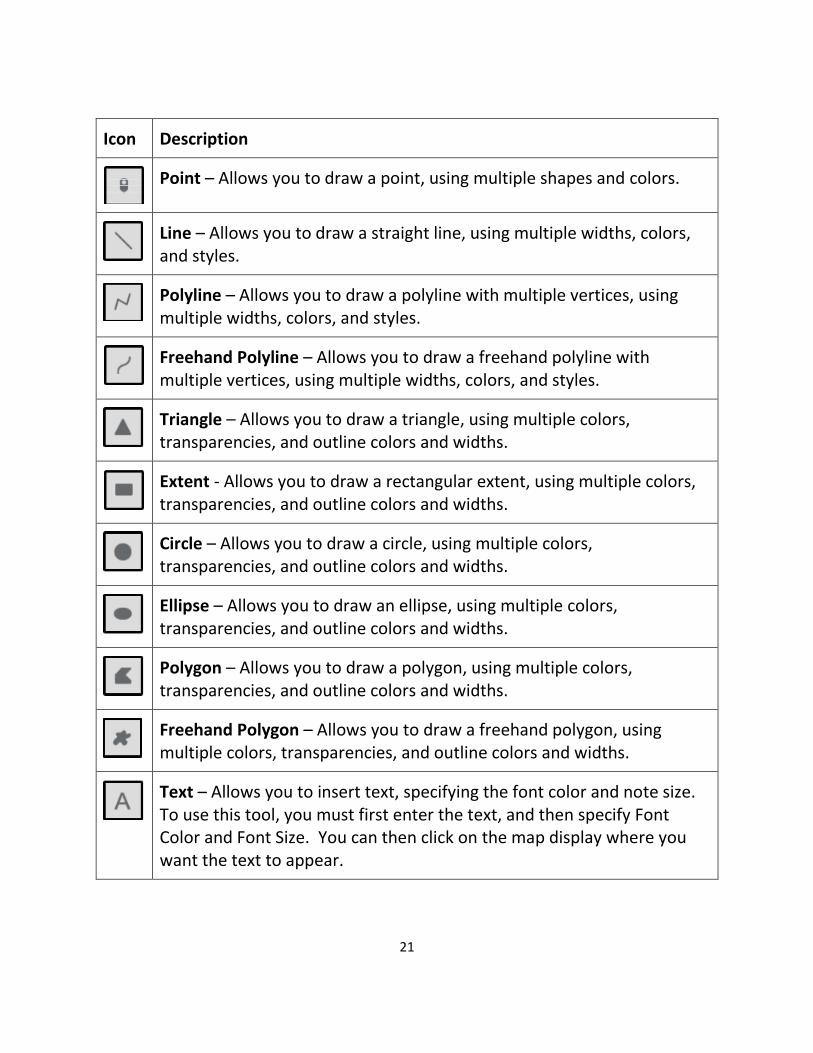
Icon Description
Point – Allows you to draw a point, using multiple shapes and colors.
Line – Allows you to draw a straight line, using multiple widths, colors, and styles.
Polyline – Allows you to draw a polyline with multiple vertices, using multiple widths, colors, and styles.
Freehand Polyline – Allows you to draw a freehand polyline with multiple vertices, using multiple widths, colors, and styles.
Triangle – Allows you to draw a triangle, using multiple colors, transparencies, and outline colors and widths.
Extent - Allows you to draw a rectangular extent, using multiple colors, transparencies, and outline colors and widths.
Circle – Allows you to draw a circle, using multiple colors, transparencies, and outline colors and widths.
Ellipse – Allows you to draw an ellipse, using multiple colors, transparencies, and outline colors and widths.
Polygon – Allows you to draw a polygon, using multiple colors, transparencies, and outline colors and widths.
Freehand Polygon – Allows you to draw a freehand polygon, using multiple colors, transparencies, and outline colors and widths.
Text – Allows you to insert text, specifying the font color and note size. To use this tool, you must first enter the text, and then specify Font Color and Font Size. You can then click on the map display where you want the text to appear.

22
Bookmark tool
You can use the Bookmark tool to save a particular map extent (or zoom area).
For example, you may wish to zoom to a particular block or neighborhood, then
create bookmark to save that extent to revisit later.
To create a bookmark, click on the Bookmark tool in the main toolbar.
Type in a unique name for your bookmark and then click the add button (the plus
sign) on the right. Your new bookmark will be added to the list of bookmarks in
the display window.
You can click on individual bookmarks in the display window to zoom to each
unique view.
To delete a bookmark, select the bookmark and then click on the Delete button at
the bottom of the display window.

23
Legend
The Legend tool shows the symbology for the selected layers that you selected using the Layers tool.
The legend will display those layers that have been activated using the Layers
tool.

24
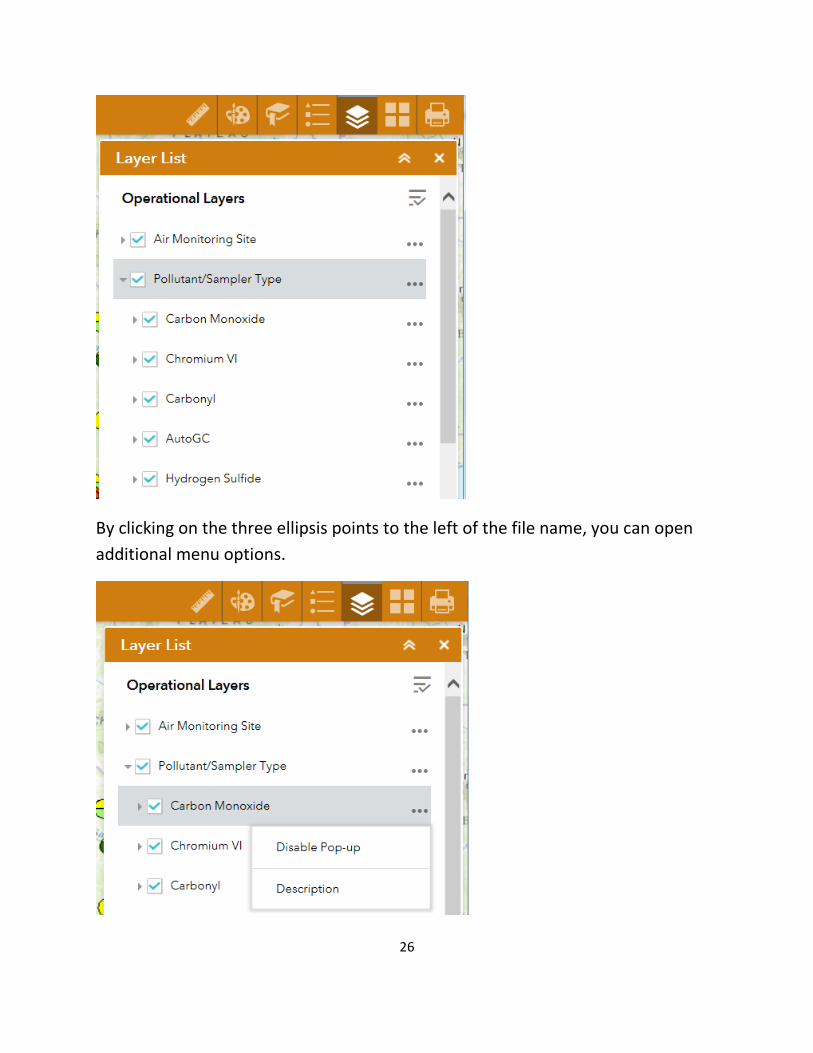
Layer List
The Layer List tool can be used to turn on and off operational data layers such as
Air Monitoring Sites, Pollutant Sampler Types, and General Layers.
To displays specific layers, click the Layers button in the main tool bar, then check
or uncheck the data layers you would like to display.
The Layer List Master Display tool in the upper right corner of the Layer List
window allows you to turn all layers on or off, and to expand and collapse all
layers.

25
For each layer, you can click on the arrow to the left of the layer name to expand
the contents of the layer:
26
By clicking on the three ellipsis points to the left of the file name, you can open
additional menu options.
27
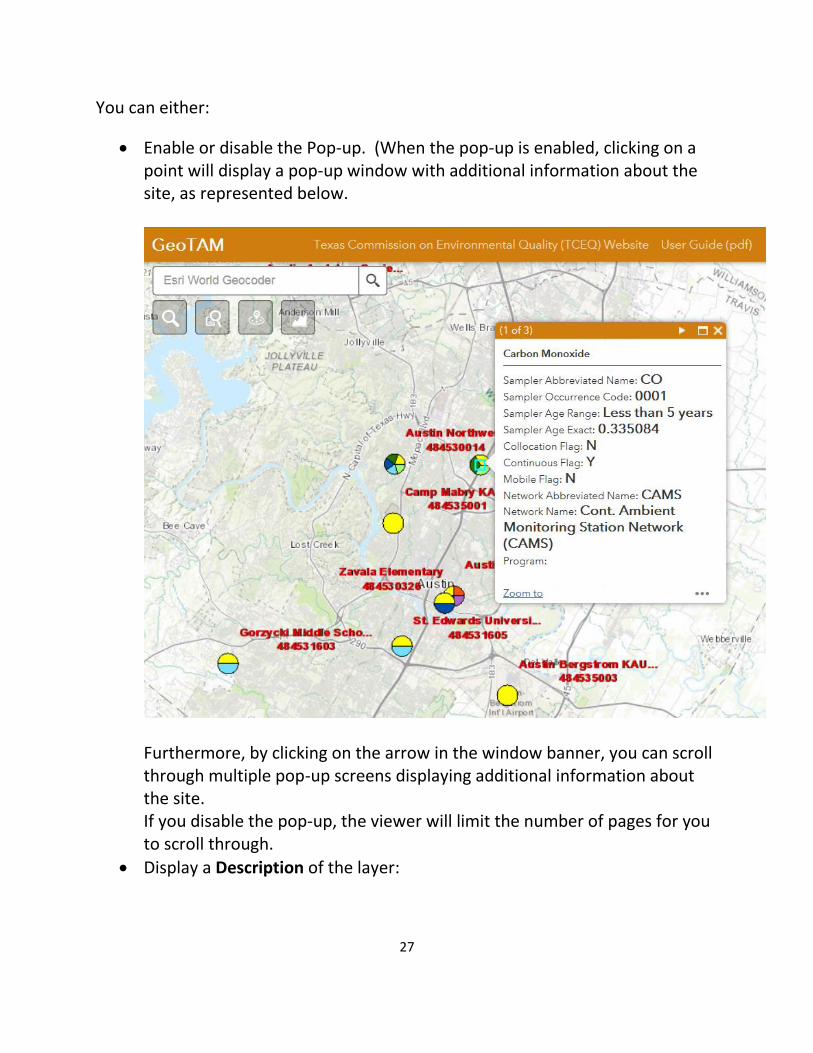
You can either:
Enable or disable the Pop-up. (When the pop-up is enabled, clicking on a point will display a pop-up window with additional information about the site, as represented below.
Furthermore, by clicking on the arrow in the window banner, you can scroll through multiple pop-up screens displaying additional information about the site. If you disable the pop-up, the viewer will limit the number of pages for you to scroll through.
Display a Description of the layer:

28
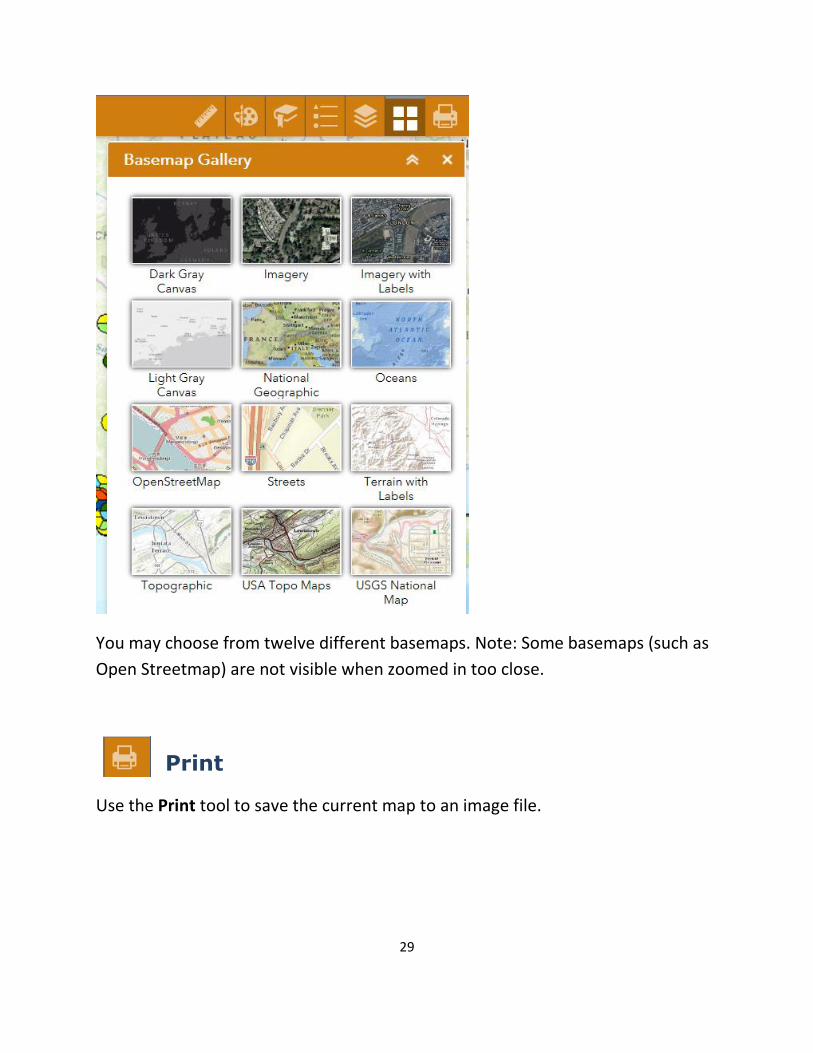
Basemap Gallery
Use the Basemap tool to change the background in the map viewer.
The Topographic basemap is the default basemap.
To change the basemap, click on the Basemap tool on the main toolbar, then
select the basemap you wish to use.
29
You may choose from twelve different basemaps. Note: Some basemaps (such as
Open Streetmap) are not visible when zoomed in too close.
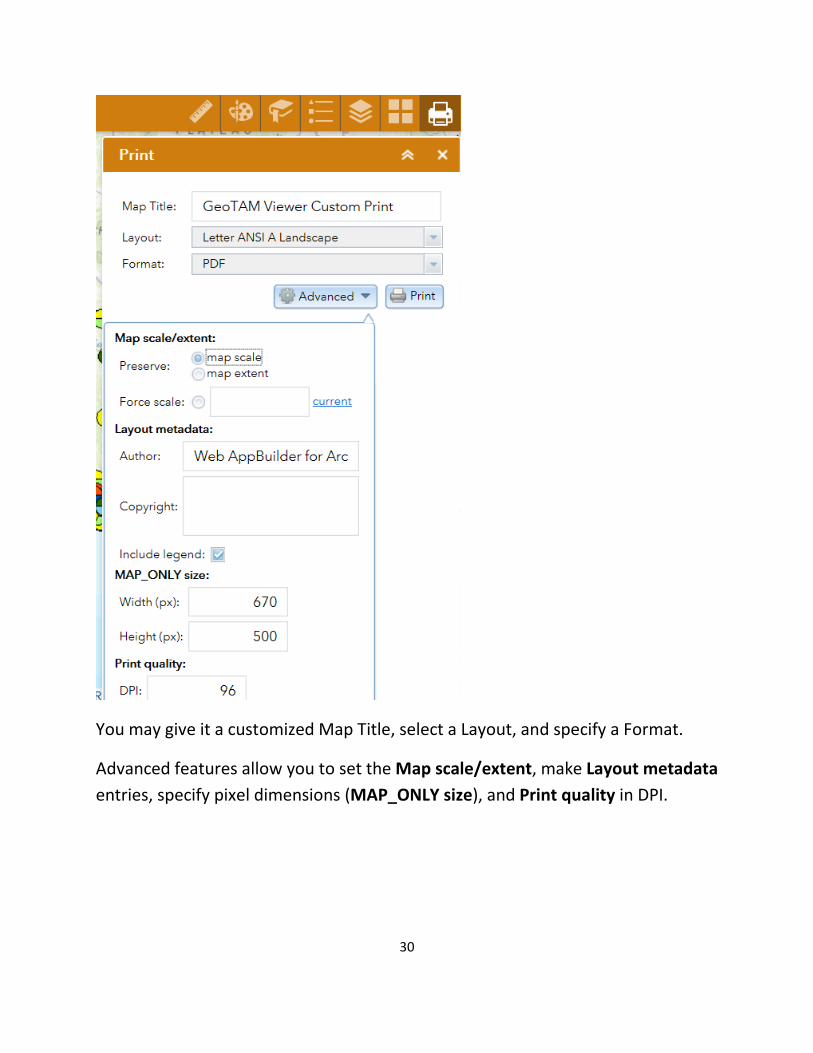
Use the Print tool to save the current map to an image file.
30
You may give it a customized Map Title, select a Layout, and specify a Format.
Advanced features allow you to set the Map scale/extent, make Layout metadata
entries, specify pixel dimensions (MAP_ONLY size), and Print quality in DPI.

31
Inset Map
The Inset map allows you to click and drag the gray box to reposition the main
map. The image below shows what happens if you drag the inset map west to
California:

32
Click the four arrow box with arrows pointing outward to zoom out to a map
view of the entire world:
Click on the same box with arrows pointing inward to restore the viewer to the
previous extent
To close the overview map, click the white arrow in the bottom right corner.
To restore the overview map, click on the white arrow again.
33
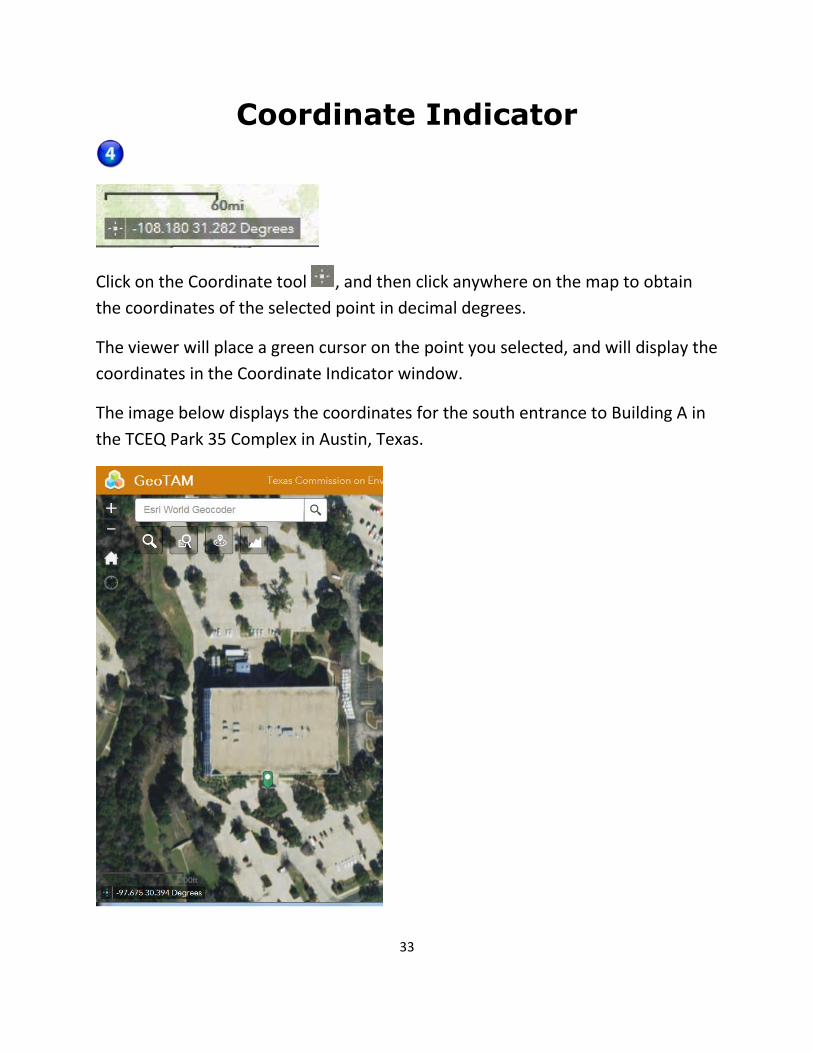
Coordinate Indicator
Click on the Coordinate tool , and then click anywhere on the map to obtain
the coordinates of the selected point in decimal degrees.
The viewer will place a green cursor on the point you selected, and will display the
coordinates in the Coordinate Indicator window.
The image below displays the coordinates for the south entrance to Building A in
the TCEQ Park 35 Complex in Austin, Texas.

34
Click on the tool again to remove the green cursor from the map display.
As you move the cursor over the map, the tool will display the coordinates of your
current mouse position.
Version: This user guide was last updated on April 20, 2017.