geotextile and temporary drainage and temporary drainage design of methods kbp1011 water handling...
TRANSCRIPT

e
SVENSK KÄRNBRÄNSLEHANTERING AB
SWEDISH NUCLEAR FUEL
AND WASTE MANAGEMENT CO
Box 3091, SE-169 03 Solna
Phone +46 8 459 84 00
skb.se
SVENSK KÄRNBRÄNSLEHANTERING
Geotextile and temporary drainage
Design of methods
KBP1011 Water handling during backfill installation
Torbjörn Sandén
Report
P-16-15November 2017


Geotextile and temporary drainage
Design of methods
KBP1011 Water handling during backfill installation
Torbjörn Sandén, Clay Technology AB
ISSN 1651-4416SKB P-16-15ID 1532516
November 2017
Keywords: KBP1011, K3-2210, Bentonite pellets, Backfill, Geotextile, Water storage, Temporary drainage.
This report concerns a study which was conducted for Svensk Kärnbränslehantering AB (SKB). The conclusions and viewpoints presented in the report are those of the author. SKB may draw modified conclusions, based on additional literature sources and/or expert opinions.
Data in SKB’s database can be changed for different reasons. Minor changes in SKB’s database will not necessarily result in a revised report. Data revisions may also be presented as supplements, available at www.skb.se.
A pdf version of this document can be downloaded from www.skb.se.
© 2017 Svensk Kärnbränslehantering AB

SKB P-16-15 3
Abstract
The reference method for backfilling of deposition tunnels includes use of pre-compacted backfill blocks to fill the majority of the tunnel volume. Bentonite pellets are then used to fill all the gaps between the blocks and rock walls. Pellets will also be used as a floor levelling material to even out the rough rock surface and thereby provide a suitable surface on which the backfill blocks can be stacked. A concern is that inflowing water may disturb the backfill installation process. Depending on flow rates and also on how the inflow points are distributed in the deposition tunnel, the inflow-ing water may affect the stability of the backfill installation and it could also erode the bentonite. The length of a backfill section i.e. the distance between two deposition holes varies between 6 m (SKB) and 10 m (Posiva).
This report describes the development and testing of two water handling methods that are intended to be used during the backfilling of deposition tunnels. Investigations have shown that inflowing water can be effectively stored in the pellet filling. This storage capacity will probably be enough for the main part of the tunnels during backfilling operations.
Earlier tests have shown that by using a geotextile sheet that is fastened on the rock wall over a water bearing fracture zone, the inflowing water will be distributed over a larger area and as a result the water storage capacity of the pellet filling will increase significantly. The geotextile tests have been done at half-scale in a simulated deposition tunnel. Since it is desirable that the amount of organic material left in the repository is small, the new test series have been made using geotextile made of glass-fiber. The test matrix has included water inflow flow rates between 0.25 and 1.0 l/min.
A second approach to inflow water handling that has been developed and tested is based on a temporary drainage of water away from the inflow location and out past the pellet filling. In this approach, a special water collector is connected to the geotextile and the water is then drained via a pipe that after use will be retrieved. With this method a number of backfill sections can be installed without the installed materials being exposed to inflowing water. After retrieval of the drainage pipe, water will enter the already installed pellet filling. This method decreases the risk of disrupting the installed materials by “buying” extra time for backfill installation before water begins to enter the volume adjacent to the inflow location(s). This method has been estimated to be suitable for inflow rates between 0.5 and 1.0 liters per minute.
4 SKB P-16-15
Sammanfattning
I referensmetoden för återfyllning av deponeringstunnlar ingår att förkompakterade återfyllnings-block fyller upp huvuddelen av volymen. Bentonitpellets fyller upp alla spalter mellan block och berg och används även som ett bäddmaterial för att jämna ut den ojämna bergytan och skapa ett jämnt underlag på vilket återfyllningsblocken kan staplas. Inflödande vatten från berget kan komma att störa återfyllnadsprocessen. Beroende på inflödeshastighet och på hur inflödespunkterna är fördelade i deponeringstunnlarna kan det inflödande vattnet påverka stabiliteten hos blockstapeln och även leda till erosion av bentonit.
Denna rapport beskriver utvecklingen och testerna av två olika vattenhanteringsmetoder som är tänkta att användas i samband med återfyllningen av deponeringstunnlar. Undersökningar har visat att inflödande vatten i stor utsträckning kan lagras i pelletsfyllningen. Denna vattenlagring kommer förmodligen att vara tillräcklig för merparten av alla deponeringstunnlar. Tidigare försök har visat att geotextil som fästs på bergväggen över en vattenförande sprickzon, kommer att fördela det inflödande vattnet över en större yta och därmed öka vattenlagringskapaciteten hos pelletsfyllningen. Testerna med geotextil har genomförts i skala 1:2 i en simulerad deponeringstunnel gjord av stål. Eftersom det är önskvärt att så lite organiskt material som möjligt lämnas kvar i slutförvaret har de nya testerna genomförts med geotextil tillverkat av glasfiber. Testmatrisen har inkluderat vatten flöden mellan 0.25 och 1,0 liter per minut.
Den andra vattenhanteringsmetoden som har utvecklats och testats innebär att inflödande vatten temporärt dräneras bort genom pelletsfyllningen. En speciell vattensamlare ansluts till geotextilen och vattnet leds därefter in i ett rör som efter användning kommer att återtas. Med denna metod kan ett antal återfyllningssektioner installeras utan att exponeras för inflödande vatten. Efter återtaget av dräneringsröret kommer vatten att börja lagras i den redan installerade pelletsen. Denna metod innebär att installationen av återfyllning kan göras på ett säkrare sätt genom att man ”köper” sig extra tid. Metoden bedöms vara lämplig för flöden mellan 0.5 och 1.0 liter per minut.
SKB P-16-15 5
Contents
1 Background 7
2 Geotextile 92.1 General 92.2 Geotextile material 9
3 Laboratory tests in order to verify the function of the geotextile 113.1 Method 113.2 Test matrix 113.3 Results 11
4 Steel tunnel tests 154.1 General 154.2 Test design 15
4.2.1 Materials 154.2.2 Attachment of the geotextile to the steel tunnel wall 174.2.3 Water inflow and outflow 174.2.4 Installation of the backfill in the steel tunnel 174.2.5 Measuring and data acquisition 18
4.3 Test matrix 204.4 Results 21
4.4.1 Test 1, reference test, 0.25 l/min 214.4.2 Test 2, geotextile, 0.25 l/min 264.4.3 Test 3, geotextile, 0.5 l/min 314.4.4 Test 4, geotextile, 0.5 l/min (repetition of Test 3) 364.4.5 Test 5, geotextile, 1.0 l/min including test of temporary drainage 41
4.5 Comments and conclusions 464.5.1 Water pressure development 464.5.2 Water storage capacity 464.5.3 Erosion 494.5.4 Artificially wetted wall 49
5 Temporary drainage 515.1 General 515.2 Design description 51
5.2.1 Water collector 515.2.2 Pipe 515.2.3 Pipe supports 52
5.3 Functional test in steel tunnel 525.3.1 General test description 525.3.2 Results 535.3.3 Comments and conclusions 55
5.4 Functional test in conjunction with Steel tunnel Test 5 565.4.1 General test description 565.4.2 Results 565.4.3 Comments and conclusions 57
5.5 Pipe removal 575.5.1 Dry pellet filling 575.5.2 Comments 59
5.6 Comments and conclusions 59
References 61

SKB P-16-15 7
1 Background
SKB and Posiva are working together to develop and test different design variations of the KBS-3 concept for a final repository for spent nuclear fuel. As part of this co-operative work, development of methods for backfilling, sealing and closure of a repository has been ongoing for many years.
The reference design considered by both SKB and Posiva for backfilling deposition tunnels includes emplacement of pre-compacted bentonite blocks and then bentonite pellets to fill the space between the blocks and the tunnel walls. Pellets will also be placed on the tunnel floor in order to even out the rough rock surface and by that provide a suitable surface on which the backfill blocks can be installed. The installation of such a backfill system involves use of advanced technical solutions for block manufac-turing, block transport, installation of blocks, emplacement of pellets etc. The deposition tunnels in the current reference design have an upwards inclination (towards the back of the tunnel), of 1 % to enable drainage of inflowing water away from the backfilling works as long as possible.
One of the main issues identified with backfilling operations is how water inflow into the tunnels should be handled during emplacement. Depending on flow rates and how the inflow points are distributed in the tunnels, the inflowing water may affect the stability of the backfill installation and also cause erosion of the backfill. Both the Forsmark site in Sweden and the Olkiluoto site in Finland are assessed to be rather dry, but preliminary hydrogeological modelling of the sites using available information shows that a number of the planned deposition tunnels will have inflow rates of more than 5 l/min and in some tunnels the inflows can be more than 30 liters per minute (Joyce et al. 2013, Hartley et al. 2010). It should, however, be emphasized that these figures are based on modelling and that the real inflow situation will not be known until after construction of the deposition tunnels. Some information will be available before tunnel excavation occurs (pilot or exploratory borehole), but there is always the potential for unexpected inflow conditions to be encountered. Since it is desirable that no deposition tunnels be abandoned, it has been necessary to develop methods and techniques to handle unexpectedly high water inflows. However, one of the requirements on the project was that methods should be developed in order to handle water inflows to a deposition tunnel of maximum 10 l/min.
This report describes investigations made in order to improve the water storing capacity in the pellet filling during backfilling operations. Two methods have been investigated:
1. Geotextile. Geotextile can be used as a distributor of inflowing water. The geotextile is fastened on the rock wall over either a point inflow or over a water bearing fracture zone and it then distributes the inflowing water over a larger area. The idea is to improve the short-term water storing capacity of the pellet filling with this technique.
2. Temporary drainage. If the inflow rate is between 0.5 to 1.0 l/min it could be necessary to also use temporary drainage in combination with the geotextile. This technique requires that the geotextile is connected to a steel tube so that the inflowing water can be drained away while the pellet filling is installed. The drainage pipe would be removed after having provided drainage during local backfilling operations. The main goal of this technique is to delay the time at which the pellets must start storing inflow water and thereby delay the arrival of inflowing water at the backfill installation front.


SKB P-16-15 9
2 Geotextile
2.1 GeneralTests have shown that during backfilling operations, the inflowing water from the rock will largely be stored in the pellet filling rather than moving towards the working face. It has also been assessed that in water bearing fracture zones with inflow rates below 0.25 l/min, no additional action is neces-sary (Sandén and Börgesson 2014).
When the inflow rates are between 0.25 l/min and 1 l/min it is planned to use geotextile as a distribu-tor of the inflowing water. The geotextile is fastened on the rock wall, over either a point inflow or over a water bearing fracture zone, before the backfill installation process has started. The idea is to improve the water storing capacity of the pellet filling by distributing it over a larger area.
Geotextile will locally increase the hydraulic conductivity but this is assessed to be accepted from a post closure point of view since it occupies only a small, isolated area and so will not contribute discernibly to movement along the tunnel once saturation and backfill equilibration has occurred.
2.2 Geotextile materialIn the beginning of this project (Water handling during backfill installation, KBP1011) it was decided to use a geotextile with as low as possible organic content. Two qualities of geotextile made of 100 % glass fiber i.e. there is no organic material, have been tested. The geotextiles have the trade names “TG1000CS” and “TG660” respectively, and is manufactured by HKO Heat Protection Group, see photos provided in Figure 2-1. After having performed the initial laboratory tests on the two geo textiles it was decided to use “TG1000CS” in the steel tunnel tests, see results in Section 3.3.
Figure 2‑1. Samples of glass fiber based geotextiles. The one to the right was judged to be most feasible as water distributor in the steel tunnel tests.

SKB P-16-15 11
3 Laboratory tests in order to verify the function of the geotextile
Tests have been done in the laboratory in order to verify the effectiveness of the selected geotextile as a water distributor. The same type of testing was done previously but with other geotextile types (Koskinen and Sandén 2014).
3.1 MethodThe laboratory test equipment consists of a Plexiglas tube (inner diameter 100 mm and length 500 mm) which is filled with pellets (see photos provided in Figure 3-1). In both ends of the tube perforated steel plates are mounted in order to keep the pellets in position but still allow water to drain through the pellet fill. At the mid-point of the tube length it is possible to apply a water flow (Figure 3-1). The tests can be performed with pellet-only filling but it is also possible to place a piece of geotextile below the inflow point (Figure 3-1). The Plexiglas makes it possible to study the wetting behavior from the outside of the tube.
The tests were performed by applying a constant inflow of 0.01 l/min at the inflow point. This inflow rate is much lower than in the real case, but at the scale examined in the laboratory, using an inflow rate of e.g. 0.25 l/min would result in an almost immediate filling of the test equipment. Before the tests it was considered whether the rather low flow rate should influence the function of the geotextile. However, the same test method had been used earlier within another project (Koskinen and Sandén 2014) with good results. As part of test monitoring, water pressure needed in order to keep the water flow constant was measured. In addition, the movement of the wetting front in the pellet filling was monitored from the outside. Photos were taken at predetermined intervals.
3.2 Test matrixIn total three tests were performed:
1. Reference test. This test was performed with the pure pellet filling.
2. Geotextile type 1. Trade name TG660.
3. Geotextile type 2. Trade name TG1000.
Extruded pellets manufactured of Asha bentonite was used in all tests. The pellets had a water content of 17.0 %. The water used to simulate groundwater entering the backfill had a salinity of 1 % (50/50 Na/Ca). This water type corresponds well to the water salinity that is expected at the time for installation (Forsmark and Olkiluoto). Water inflow rate was set to be 0.01 l/min.
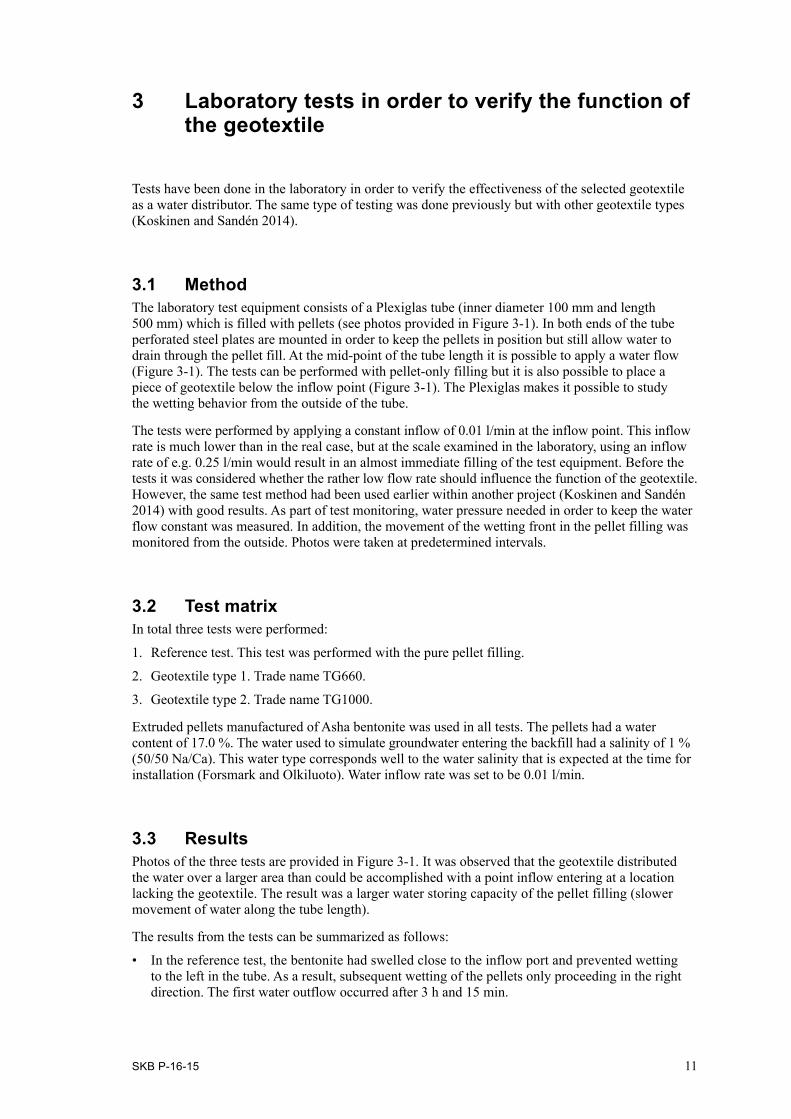
3.3 ResultsPhotos of the three tests are provided in Figure 3-1. It was observed that the geotextile distributed the water over a larger area than could be accomplished with a point inflow entering at a location lacking the geotextile. The result was a larger water storing capacity of the pellet filling (slower movement of water along the tube length).
The results from the tests can be summarized as follows:
• In the reference test, the bentonite had swelled close to the inflow port and prevented wetting to the left in the tube. As a result, subsequent wetting of the pellets only proceeding in the right direction. The first water outflow occurred after 3 h and 15 min.
12 SKB P-16-15
• In the two tests with geotextile, the wetting has proceeded more evenly i.e. in both directions from the inflow point. The two tests were running for 5.5 hours and at this time no water had reached the ends of the tubes.
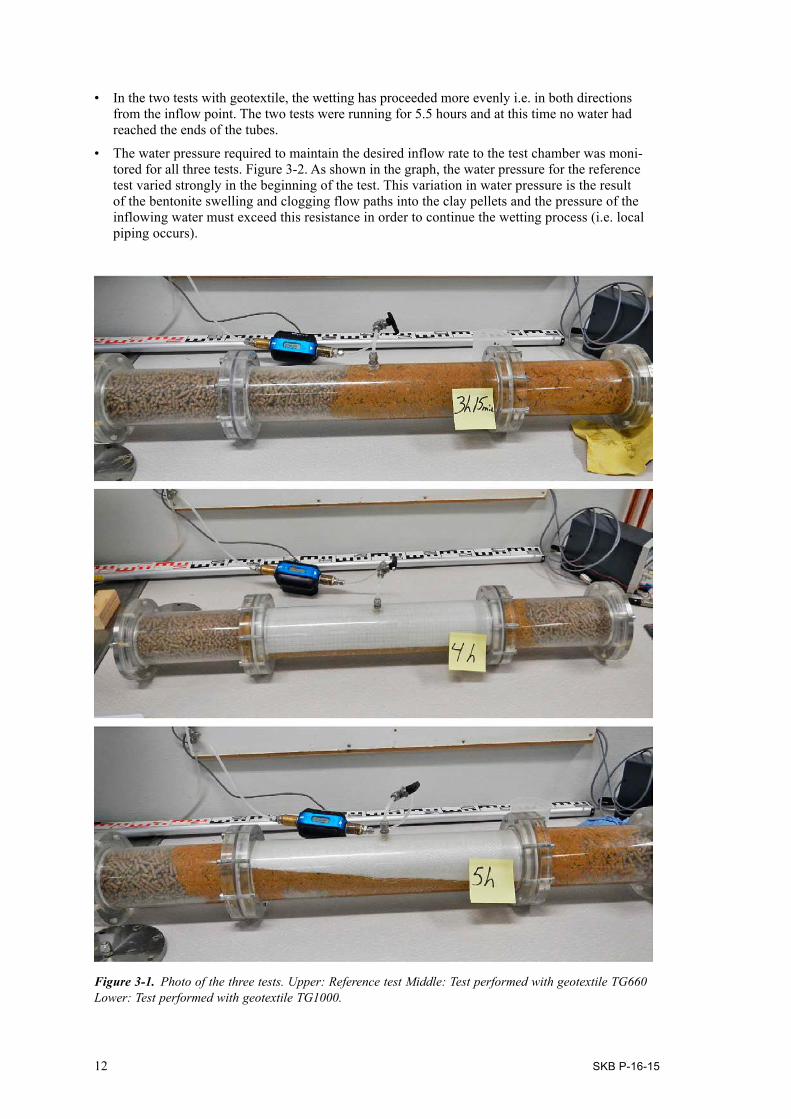
• The water pressure required to maintain the desired inflow rate to the test chamber was moni-tored for all three tests. Figure 3-2. As shown in the graph, the water pressure for the reference test varied strongly in the beginning of the test. This variation in water pressure is the result of the bentonite swelling and clogging flow paths into the clay pellets and the pressure of the inflowing water must exceed this resistance in order to continue the wetting process (i.e. local piping occurs).
Figure 3‑1. Photo of the three tests. Upper: Reference test Middle: Test performed with geotextile TG660 Lower: Test performed with geotextile TG1000.
SKB P-16-15 13
The two tests performed with geotextile show different behavior than was observed for the pellet-only test. The flow resistance of the geotextile systems increases more evenly with time since the wetting of the pellet can proceed over a larger area. The pressure of the inflowing water needed to induce water percolation through the geotextile at a constant rate of 0.01 l/min, increases with time and especially when the wetting front reaches the pellets outside the regions in direct contact with the geotextile.
The geotextile with the commercial name “TG1000CS” was selected to be used in the steel tunnel tests, see description in next chapter. The main reason for this selection was that it was assessed to be softer, but also stronger, and that it would be easier to mount on an uneven rock surface than the “TG660”.
Figure 3‑2. Water pressure plotted as function of time for the three tests.
0
10
20
30
40
50
60
70
80
90
100
110
120
0.0 0.5 1.0 1.5 2.0 2.5 3.0 3.5 4.0 4.5 5.0 5.5 6.0
Wat
er p
ress
ure,
kPa
Time, hours
Reference Asha
Geotextile 600 g/m2
Geotextile 1000 g/m2

SKB P-16-15 15
4 Steel tunnel tests
4.1 GeneralTests have previously been performed within the project “System design of backfill” with the aim to investigate if geotextile can be used as a water distributor during backfill installation (Koskinen and Sandén 2014). Four tests were performed in the steel tunnel (half scale tests in the bentonite laboratory) and one full scale test was performed underground at the Äspö HRL. After evaluation of these tests there were some remaining questions e.g. how the results were influenced of fines present in the pellet filling.
In the current project, Water handling during backfill installation, five additional tests have been performed in the half-scale steel tunnel mockup in SKB’s bentonite laboratory. The new tests were performed with the aim of investigating:
• The water storing capacity of sieved pellets i.e. all fine materials were removed before installation,
• The limits regarding the maximum water inflow rate that can be handled with this geotextile technique.
• Testing of the new glass fiber geotextile.
• One of the tests, no. 5, also included a test of temporary drainage equipment, see description in Chapter 5.
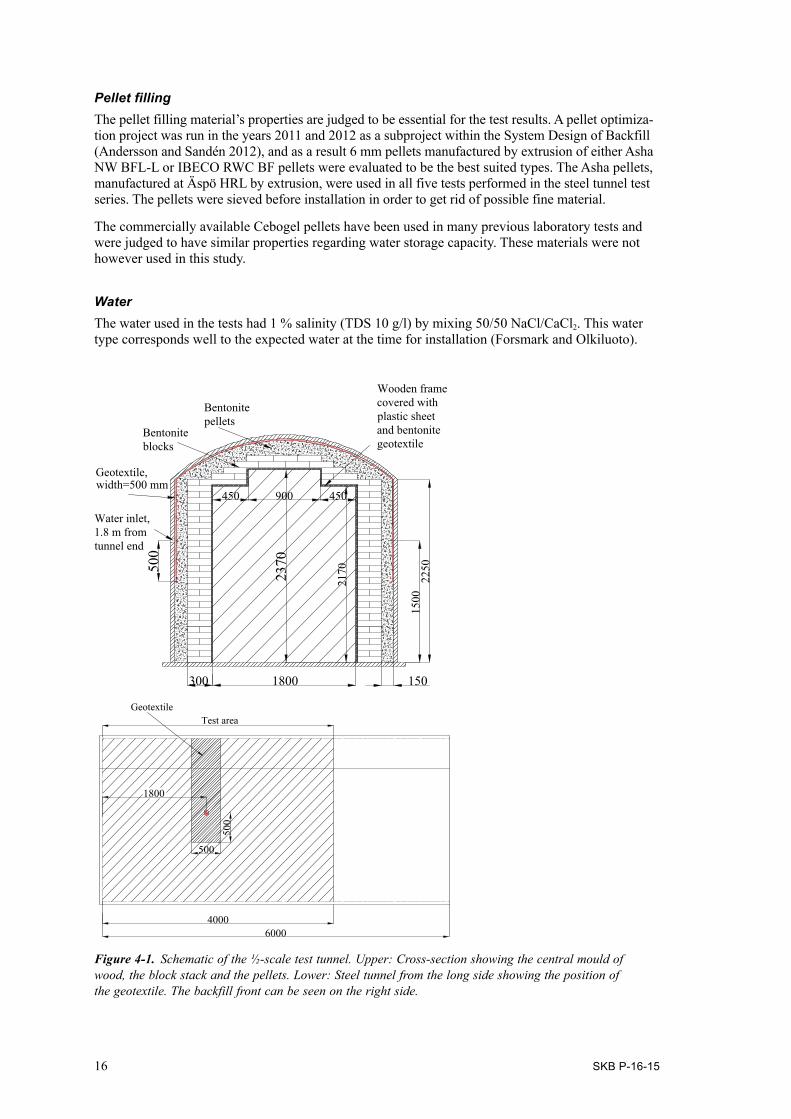
4.2 Test designThe half-scale test tunnel is made of steel, Figure 4-1. The nominal cross sectional area of the tunnel is 7.1 m2 and the length is 6 m. The usable length for the tests has been 4 m. The tunnel walls are not able to withstand the full swelling pressure of a completely backfilled tunnel and therefore, instead of backfilling the centre of the tunnel, there is a wooden framework designed to deform and fail mechanically if the swelling pressures becomes too high. Since the influence of blocks on water movement into and through the pellet fill are assessed to be of less importance for the test results, this approach to test design is time and cost effective. The wooden frame was first covered with plastic sheeting and then a bentonite geotextile mat to prevent further inwards movement of any water that has managed to penetrate both the pellet and the block materials. Two different block stacking patterns (and three block sizes), were used in the test series, see description provided in Section 4.2.4. The reason for use of two patterns was that already available blocks and they came in varying dimensions. As noted before, the block materials are not key to the behavior being inves-tigated in this study and so changing their layout is not considered to have an impact on the results obtained. The remaining gaps between the blocks and the wall and ceiling were filled with pellets.
4.2.1 MaterialsBackfill blocks.Three different backfill block sizes have been used in this test series:
1. Blocks manufactured of Asha NW BFL-L 2010 with the approximately dimensions of 300 × 150 × 75 mm. These blocks were manufactured within the SKB project System Design of Backfill. This block type was used in Test 1 and Test 2.
2. Blocks with the same dimensions as above, but manufactured of a mixture of 30 % bentonite from Ibeco and 70 % crushed rock. As the blocks were deemed to play only a minor role in the kind of tests done in this study, it was decided that it was acceptable to use these blocks. This block type was only used in Test 3.
3. Full scale backfill blocks manufactured of Asha NW BFL-L 2010 with the approximately dimen-sions 500 × 570 × 400 mm. These blocks were manufactured within the SKB project System Design of Backfill and were used in the test for demonstration of the backfill installation process. This block type was used in Tests 4 and 5.
16 SKB P-16-15
Pellet fillingThe pellet filling material’s properties are judged to be essential for the test results. A pellet optimiza-tion project was run in the years 2011 and 2012 as a subproject within the System Design of Backfill (Andersson and Sandén 2012), and as a result 6 mm pellets manufactured by extrusion of either Asha NW BFL-L or IBECO RWC BF pellets were evaluated to be the best suited types. The Asha pellets, manufactured at Äspö HRL by extrusion, were used in all five tests performed in the steel tunnel test series. The pellets were sieved before installation in order to get rid of possible fine material.
The commercially available Cebogel pellets have been used in many previous laboratory tests and were judged to have similar properties regarding water storage capacity. These materials were not however used in this study.
Water The water used in the tests had 1 % salinity (TDS 10 g/l) by mixing 50/50 NaCl/CaCl2. This water type corresponds well to the expected water at the time for installation (Forsmark and Olkiluoto).
Figure 4‑1. Schematic of the ½-scale test tunnel. Upper: Cross-section showing the central mould of wood, the block stack and the pellets. Lower: Steel tunnel from the long side showing the position of the geotextile. The backfill front can be seen on the right side.
1500
2250
Water inlet, 1.8 m from tunnel end
500
1800
900 450450
217023
70
Bentonite pellets
blocksBentonite
Wooden frame covered with plastic sheet and bentonite geotextile
Geotextile, width=500 mm
300 150
4000
1800
6000
Test area
500
500
Geotextile

SKB P-16-15 17
4.2.2 Attachment of the geotextile to the steel tunnel wallThe 0.5 m wide geotextile was attached to the steel tunnel wall using silicone adhesive. The geo-textile was positioned over the water inlet point, so that there was approximately the same amount of fabric on both sides of the inlet point. The lower edge of the geotextile was approximately 0.5 m below the water inlet port and extended all the way to the same height on the other side of the tunnel as shown in Figure 4-1.
4.2.3 Water inflow and outflowThe salt solution (10 g/l TDS, 50/50 NaCl/CaCl2), used in this project was mixed in big tanks. Special metering pumps were used to pump the water at a pre-determined flow rate into the inflow point on the steel tunnel. The geotextile was placed over the inflow point and then the whole way up to the roof and down on the other side of the tunnel. This design made it possible to study how well the inflowing water could be distributed to the other side of the tunnel by the geotextile.
Water inflow rate and water pressure were continuously registered and when water leaked out from the test, it was collected and pumped into a container whose mass was continuously monitored.
4.2.4 Installation of the backfill in the steel tunnelThe backfill blocks were installed in two different ways, with method depending on the large differ-ences in size and weight:
1. Test 1–3. Brick size blocks (300 × 150 × 75 mm) were installed by hand against the inner wood frame, Figure 4-2. The blocks were assembled to a cross pattern with a depth of 300 mm.
2. Test 4–5. Full size backfill blocks (500 × 570 × 400 mm), Figure 4-3. To install these blocks in the steel tunnel in a secure way it was necessary to remove the roof (bolted to the walls). The blocks were then installed by use of a vacuum lifting tool connected to an overhead crane.
In order to achieve a similar gap width between blocks and the steel walls, two different wooden frames were used, as shown in the drawings and photos provided in Figure 4-2 and Figure 4-3.
Figure 4‑2. Left: Schematic drawing of the block pattern used in Test 1-3 Right: Photo showing Test 3 after installation of backfill including the concluding vertical pellet wall.
1500
2250
Water inlet, 1.8 m fromtunnel end
500
1800
900 450450
217023
70
Wooden frame covered with plastic sheet and bentonite geotextile
Bentonite pellets
blocksBentonite
Geotextile, width=500 mm
300 150
18 SKB P-16-15
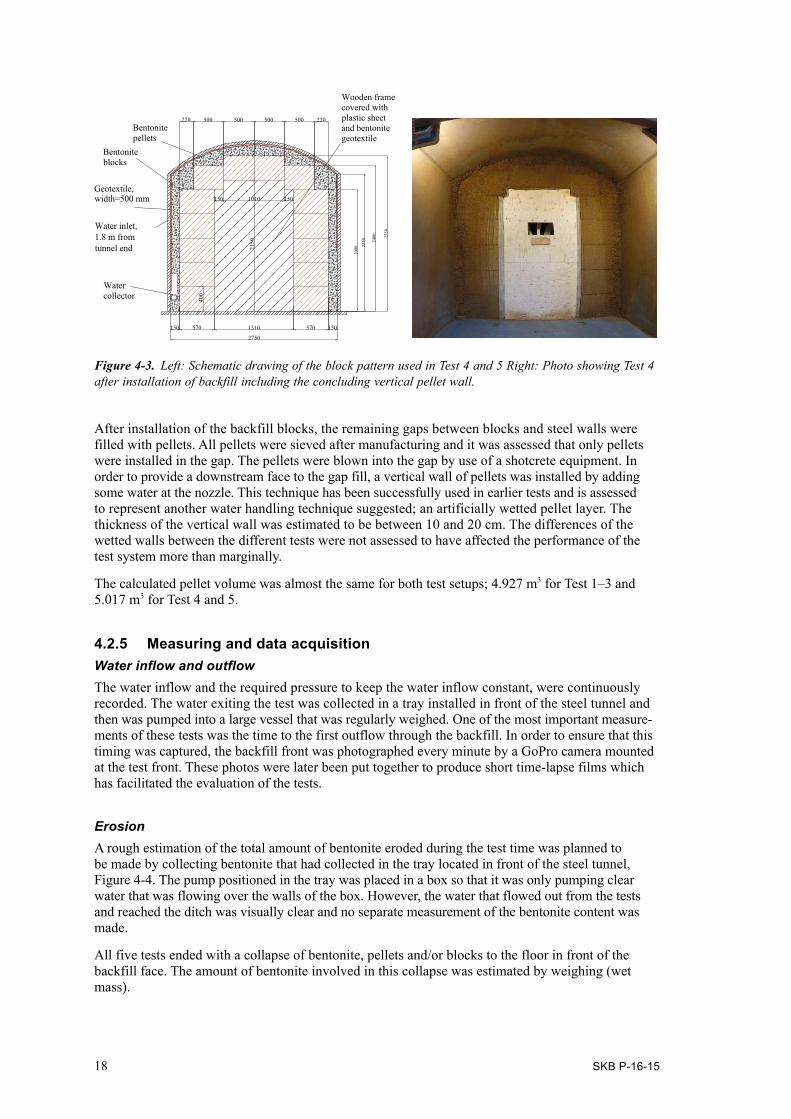
After installation of the backfill blocks, the remaining gaps between blocks and steel walls were filled with pellets. All pellets were sieved after manufacturing and it was assessed that only pellets were installed in the gap. The pellets were blown into the gap by use of a shotcrete equipment. In order to provide a downstream face to the gap fill, a vertical wall of pellets was installed by adding some water at the nozzle. This technique has been successfully used in earlier tests and is assessed to represent another water handling technique suggested; an artificially wetted pellet layer. The thickness of the vertical wall was estimated to be between 10 and 20 cm. The differences of the wetted walls between the different tests were not assessed to have affected the performance of the test system more than marginally.
The calculated pellet volume was almost the same for both test setups; 4.927 m3 for Test 1–3 and 5.017 m3 for Test 4 and 5.
4.2.5 Measuring and data acquisitionWater inflow and outflowThe water inflow and the required pressure to keep the water inflow constant, were continuously recorded. The water exiting the test was collected in a tray installed in front of the steel tunnel and then was pumped into a large vessel that was regularly weighed. One of the most important measure-ments of these tests was the time to the first outflow through the backfill. In order to ensure that this timing was captured, the backfill front was photographed every minute by a GoPro camera mounted at the test front. These photos were later been put together to produce short time-lapse films which has facilitated the evaluation of the tests.
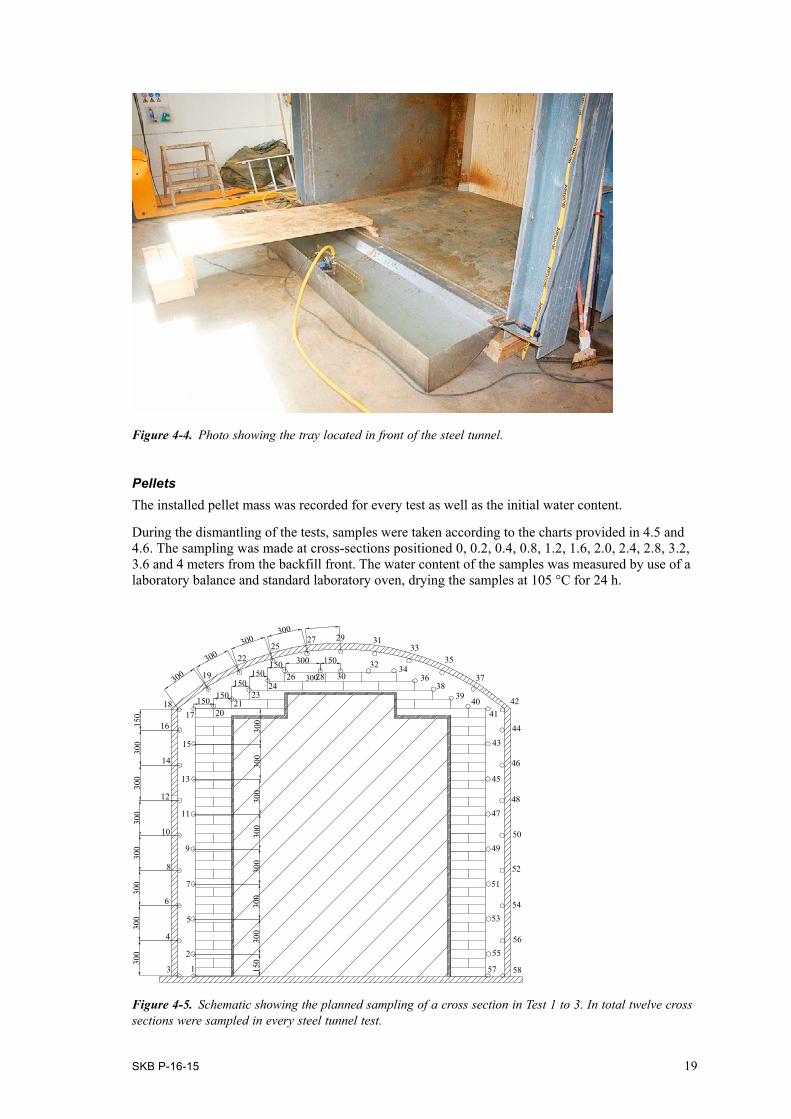
ErosionA rough estimation of the total amount of bentonite eroded during the test time was planned to be made by collecting bentonite that had collected in the tray located in front of the steel tunnel, Figure 4-4. The pump positioned in the tray was placed in a box so that it was only pumping clear water that was flowing over the walls of the box. However, the water that flowed out from the tests and reached the ditch was visually clear and no separate measurement of the bentonite content was made.
All five tests ended with a collapse of bentonite, pellets and/or blocks to the floor in front of the backfill face. The amount of bentonite involved in this collapse was estimated by weighing (wet mass).
Figure 4‑3. Left: Schematic drawing of the block pattern used in Test 4 and 5 Right: Photo showing Test 4 after installation of backfill including the concluding vertical pellet wall.
Bentonite blocks
Bentonite pellets
Wooden frame covered with plastic sheet and bentonite geotextile
2250
2000
1310 150570570150
2750
400
500 500 500 500 220220
2150
150 1010 150
2400 25
50
Water collector
Water inlet, 1.8 m fromtunnel end
Geotextile, width=500 mm
SKB P-16-15 19
Figure 4‑4. Photo showing the tray located in front of the steel tunnel.
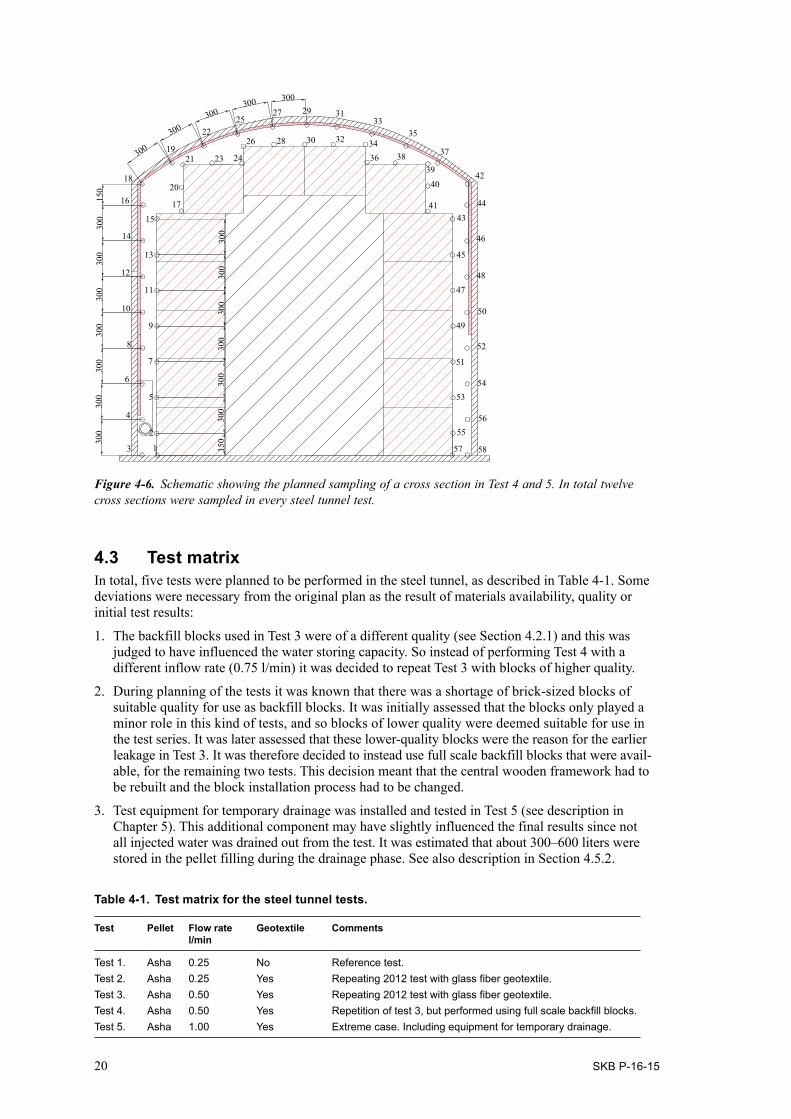
Figure 4‑5. Schematic showing the planned sampling of a cross section in Test 1 to 3. In total twelve cross sections were sampled in every steel tunnel test.
57 58
5556
54
52
50
53
51
49
47
45
48
46
44
43
4140
3938
363432
42
37
3533
31292725
22
30282624
2321
20
19
1817
16
15
14
13
12
11
10
9
8
7
6
5
4
13
150300150150
150
150 150
300
300300
300
300
150
150
300
300
300
300
300
300
300
300
300
300
300
300
300
300 2
PelletsThe installed pellet mass was recorded for every test as well as the initial water content.
During the dismantling of the tests, samples were taken according to the charts provided in 4.5 and 4.6. The sampling was made at cross-sections positioned 0, 0.2, 0.4, 0.8, 1.2, 1.6, 2.0, 2.4, 2.8, 3.2, 3.6 and 4 meters from the backfill front. The water content of the samples was measured by use of a laboratory balance and standard laboratory oven, drying the samples at 105 °C for 24 h.
20 SKB P-16-15
4.3 Test matrixIn total, five tests were planned to be performed in the steel tunnel, as described in Table 4-1. Some deviations were necessary from the original plan as the result of materials availability, quality or initial test results:
1. The backfill blocks used in Test 3 were of a different quality (see Section 4.2.1) and this was judged to have influenced the water storing capacity. So instead of performing Test 4 with a different inflow rate (0.75 l/min) it was decided to repeat Test 3 with blocks of higher quality.
2. During planning of the tests it was known that there was a shortage of brick-sized blocks of suitable quality for use as backfill blocks. It was initially assessed that the blocks only played a minor role in this kind of tests, and so blocks of lower quality were deemed suitable for use in the test series. It was later assessed that these lower-quality blocks were the reason for the earlier leakage in Test 3. It was therefore decided to instead use full scale backfill blocks that were avail-able, for the remaining two tests. This decision meant that the central wooden framework had to be rebuilt and the block installation process had to be changed.
3. Test equipment for temporary drainage was installed and tested in Test 5 (see description in Chapter 5). This additional component may have slightly influenced the final results since not all injected water was drained out from the test. It was estimated that about 300–600 liters were stored in the pellet filling during the drainage phase. See also description in Section 4.5.2.
Table 4-1. Test matrix for the steel tunnel tests.
Test Pellet Flow rate l/min
Geotextile Comments
Test 1. Asha 0.25 No Reference test.Test 2. Asha 0.25 Yes Repeating 2012 test with glass fiber geotextile.Test 3. Asha 0.50 Yes Repeating 2012 test with glass fiber geotextile.Test 4. Asha 0.50 Yes Repetition of test 3, but performed using full scale backfill blocks.Test 5. Asha 1.00 Yes Extreme case. Including equipment for temporary drainage.
Figure 4‑6. Schematic showing the planned sampling of a cross section in Test 4 and 5. In total twelve cross sections were sampled in every steel tunnel test.
300
300
300
300
300
300
300
150
300
300300
300300
2725
22
19
18
16
14
15
17
13
12
10
8
6
4
3 1
2
9
11
300
300
300
300
300
300
150
29
5
7
41
42
44
46
43
45
4847
5049
52
51
5453
56
57
55
58
3133
35
37
20
21 23 24
26 28 30 32 3436 38
3940
SKB P-16-15 21
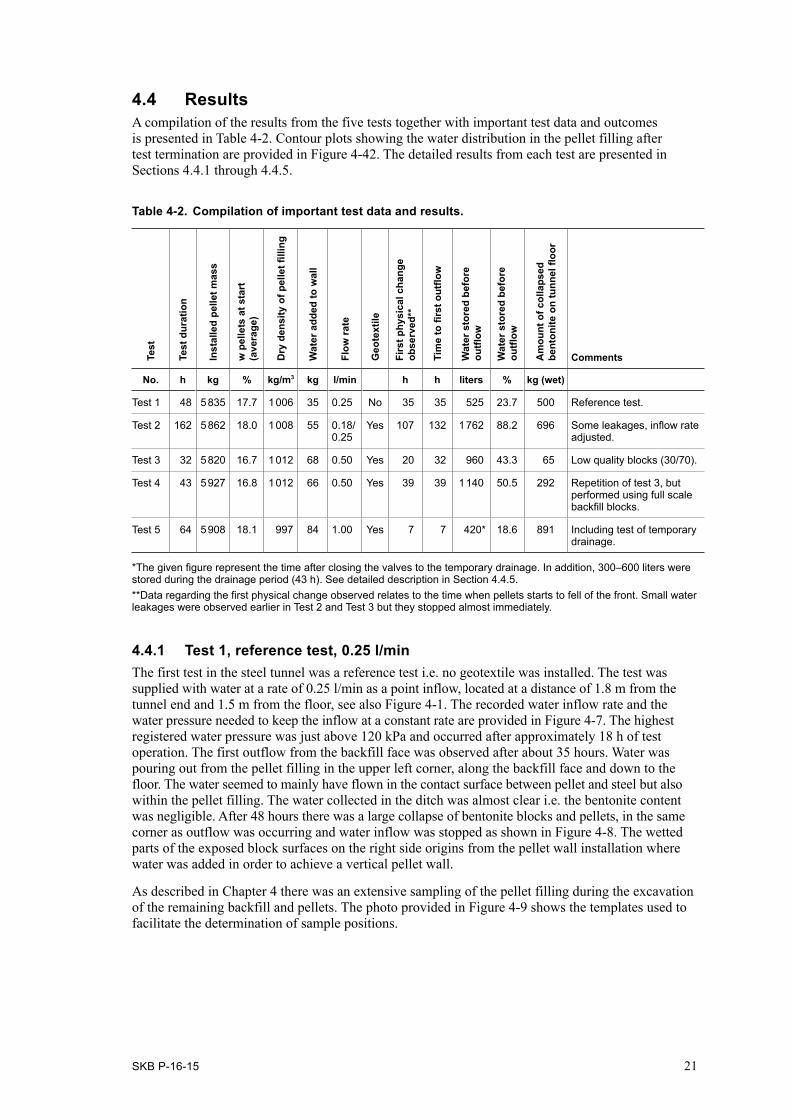
4.4 ResultsA compilation of the results from the five tests together with important test data and outcomes is presented in Table 4-2. Contour plots showing the water distribution in the pellet filling after test termination are provided in Figure 4-42. The detailed results from each test are presented in Sections 4.4.1 through 4.4.5.
Table 4-2. Compilation of important test data and results.
Test
Test
dur
atio
n
Inst
alle
d pe
llet m
ass
w p
elle
ts a
t sta
rt
(ave
rage
)
Dry
den
sity
of p
elle
t fill
ing
Wat
er a
dded
to w
all
Flow
rate
Geo
text
ile
Firs
t phy
sica
l cha
nge
ob
serv
ed**
Tim
e to
firs
t out
flow
Wat
er s
tore
d be
fore
ou
tflow
Wat
er s
tore
d be
fore
ou
tflow
Am
ount
of c
olla
psed
be
nton
ite o
n tu
nnel
floo
r
Comments
No. h kg % kg/m3 kg l/min h h liters % kg (wet)
Test 1 48 5 835 17.7 1 006 35 0.25 No 35 35 525 23.7 500 Reference test.
Test 2 162 5 862 18.0 1 008 55 0.18/ 0.25
Yes 107 132 1 762 88.2 696 Some leakages, inflow rate adjusted.
Test 3 32 5 820 16.7 1 012 68 0.50 Yes 20 32 960 43.3 65 Low quality blocks (30/70).
Test 4 43 5 927 16.8 1 012 66 0.50 Yes 39 39 1 140 50.5 292 Repetition of test 3, but performed using full scale backfill blocks.
Test 5 64 5 908 18.1 997 84 1.00 Yes 7 7 420* 18.6 891 Including test of temporary drainage.
*The given figure represent the time after closing the valves to the temporary drainage. In addition, 300–600 liters were stored during the drainage period (43 h). See detailed description in Section 4.4.5.**Data regarding the first physical change observed relates to the time when pellets starts to fell of the front. Small water leakages were observed earlier in Test 2 and Test 3 but they stopped almost immediately.
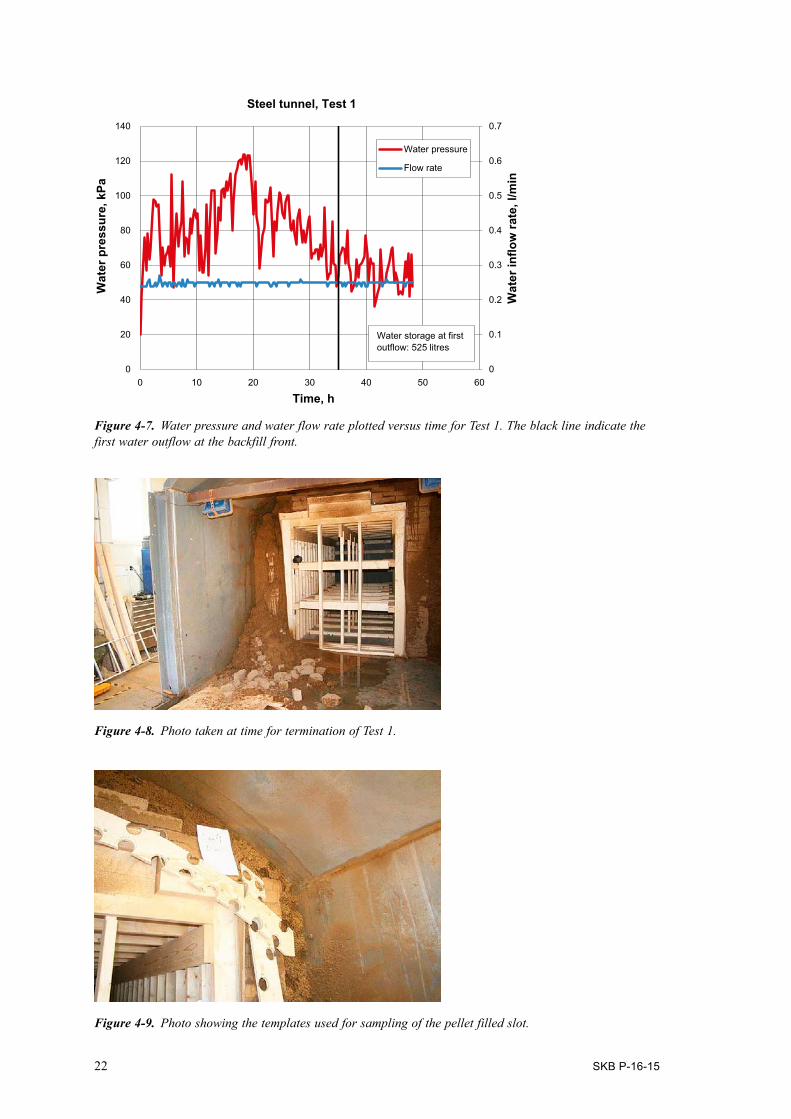
4.4.1 Test 1, reference test, 0.25 l/minThe first test in the steel tunnel was a reference test i.e. no geotextile was installed. The test was supplied with water at a rate of 0.25 l/min as a point inflow, located at a distance of 1.8 m from the tunnel end and 1.5 m from the floor, see also Figure 4-1. The recorded water inflow rate and the water pressure needed to keep the inflow at a constant rate are provided in Figure 4-7. The highest registered water pressure was just above 120 kPa and occurred after approximately 18 h of test operation. The first outflow from the backfill face was observed after about 35 hours. Water was pouring out from the pellet filling in the upper left corner, along the backfill face and down to the floor. The water seemed to mainly have flown in the contact surface between pellet and steel but also within the pellet filling. The water collected in the ditch was almost clear i.e. the bentonite content was negligible. After 48 hours there was a large collapse of bentonite blocks and pellets, in the same corner as outflow was occurring and water inflow was stopped as shown in Figure 4-8. The wetted parts of the exposed block surfaces on the right side origins from the pellet wall installation where water was added in order to achieve a vertical pellet wall.
As described in Chapter 4 there was an extensive sampling of the pellet filling during the excavation of the remaining backfill and pellets. The photo provided in Figure 4-9 shows the templates used to facilitate the determination of sample positions.
22 SKB P-16-15
Figure 4‑7. Water pressure and water flow rate plotted versus time for Test 1. The black line indicate the first water outflow at the backfill front.
Figure 4‑8. Photo taken at time for termination of Test 1.
Figure 4‑9. Photo showing the templates used for sampling of the pellet filled slot.
0
0.1
0.2
0.3
0.4
0.5
0.6
0.7
0
20
40
60
80
100
120
140
0 10 20 30 40 50 60
Wat
er in
flow
rate
, l/m
in
Time, h
Wat
er p
ress
ure,
kPa
Steel tunnel, Test 1
Water pressure
Flow rate
Water storage at first outflow: 525 litres
SKB P-16-15 23
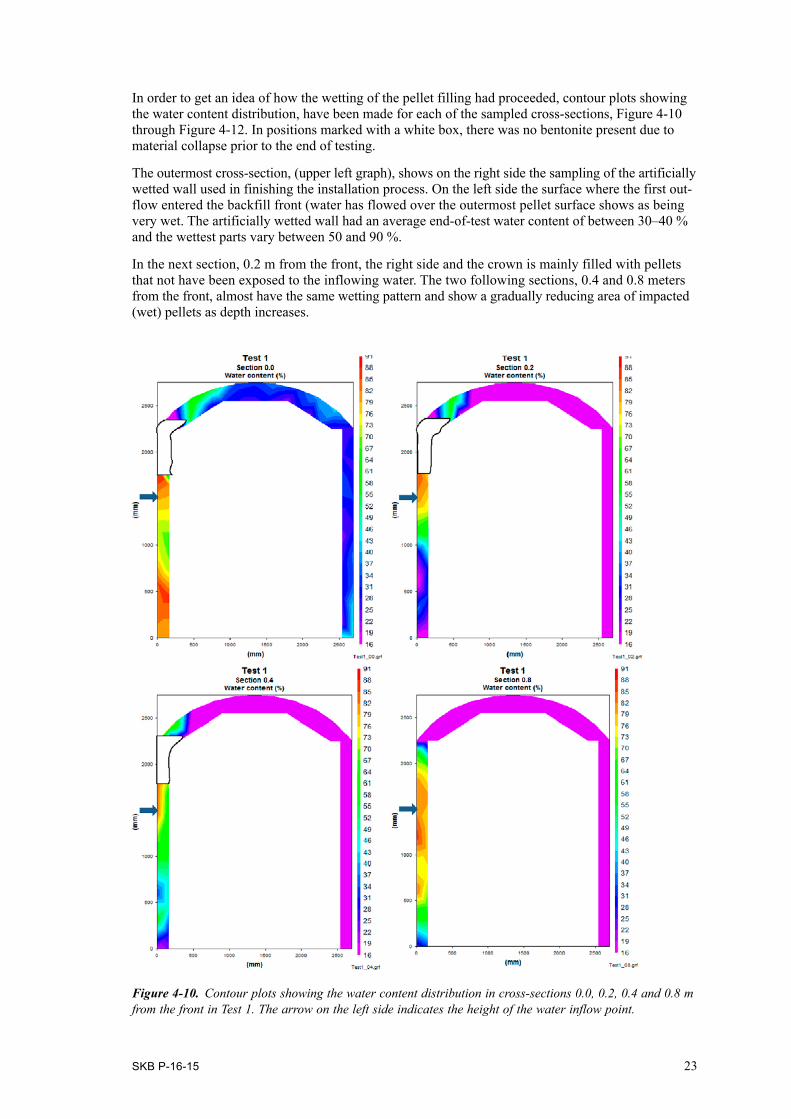
In order to get an idea of how the wetting of the pellet filling had proceeded, contour plots showing the water content distribution, have been made for each of the sampled cross-sections, Figure 4-10 through Figure 4-12. In positions marked with a white box, there was no bentonite present due to material collapse prior to the end of testing.
The outermost cross-section, (upper left graph), shows on the right side the sampling of the artificially wetted wall used in finishing the installation process. On the left side the surface where the first out-flow entered the backfill front (water has flowed over the outermost pellet surface shows as being very wet. The artificially wetted wall had an average end-of-test water content of between 30–40 % and the wettest parts vary between 50 and 90 %.
In the next section, 0.2 m from the front, the right side and the crown is mainly filled with pellets that not have been exposed to the inflowing water. The two following sections, 0.4 and 0.8 meters from the front, almost have the same wetting pattern and show a gradually reducing area of impacted (wet) pellets as depth increases.
Figure 4‑10. Contour plots showing the water content distribution in cross-sections 0.0, 0.2, 0.4 and 0.8 m from the front in Test 1. The arrow on the left side indicates the height of the water inflow point.
24 SKB P-16-15
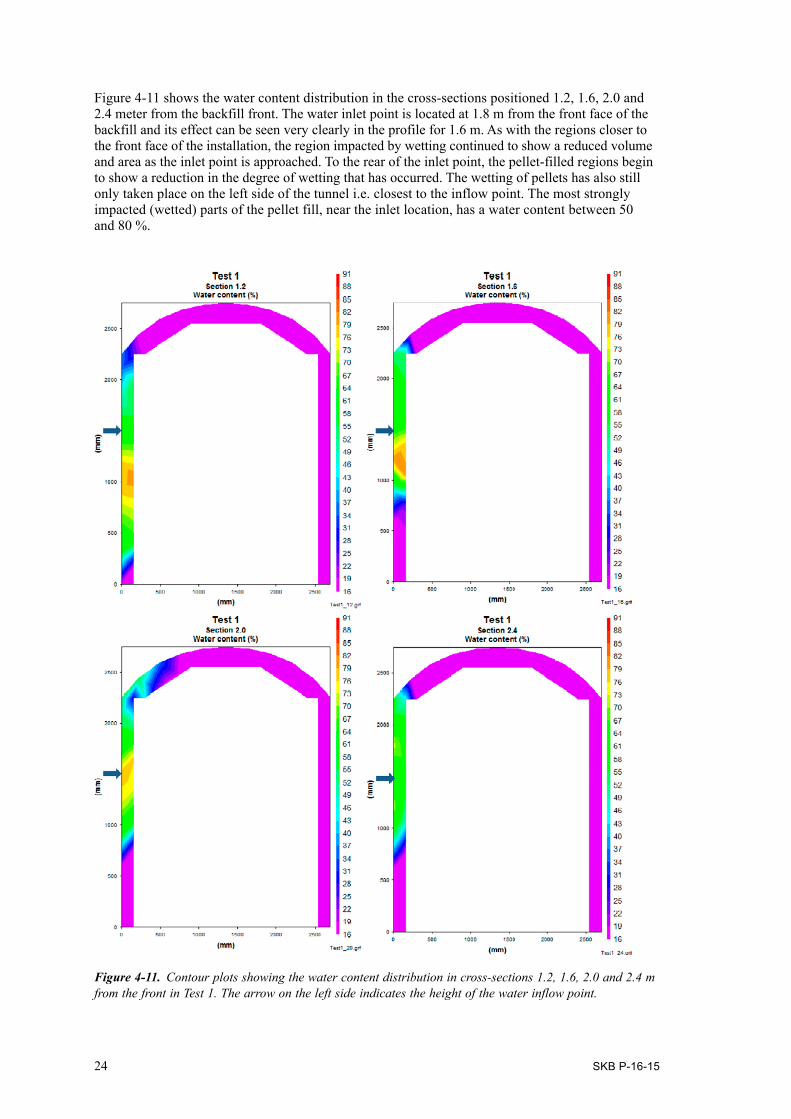
Figure 4-11 shows the water content distribution in the cross-sections positioned 1.2, 1.6, 2.0 and 2.4 meter from the backfill front. The water inlet point is located at 1.8 m from the front face of the backfill and its effect can be seen very clearly in the profile for 1.6 m. As with the regions closer to the front face of the installation, the region impacted by wetting continued to show a reduced volume and area as the inlet point is approached. To the rear of the inlet point, the pellet-filled regions begin to show a reduction in the degree of wetting that has occurred. The wetting of pellets has also still only taken place on the left side of the tunnel i.e. closest to the inflow point. The most strongly impacted (wetted) parts of the pellet fill, near the inlet location, has a water content between 50 and 80 %.
Figure 4‑11. Contour plots showing the water content distribution in cross-sections 1.2, 1.6, 2.0 and 2.4 m from the front in Test 1. The arrow on the left side indicates the height of the water inflow point.
SKB P-16-15 25
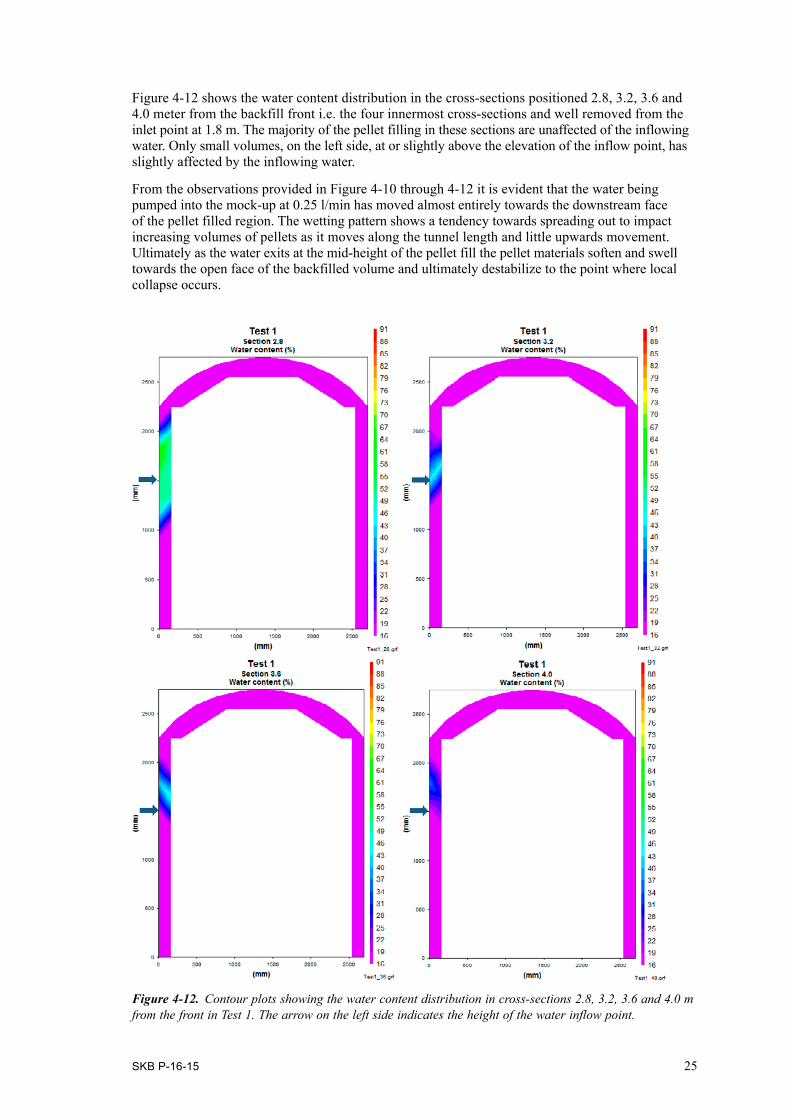
Figure 4-12 shows the water content distribution in the cross-sections positioned 2.8, 3.2, 3.6 and 4.0 meter from the backfill front i.e. the four innermost cross-sections and well removed from the inlet point at 1.8 m. The majority of the pellet filling in these sections are unaffected of the inflowing water. Only small volumes, on the left side, at or slightly above the elevation of the inflow point, has slightly affected by the inflowing water.
From the observations provided in Figure 4-10 through 4-12 it is evident that the water being pumped into the mock-up at 0.25 l/min has moved almost entirely towards the downstream face of the pellet filled region. The wetting pattern shows a tendency towards spreading out to impact increasing volumes of pellets as it moves along the tunnel length and little upwards movement. Ultimately as the water exits at the mid-height of the pellet fill the pellet materials soften and swell towards the open face of the backfilled volume and ultimately destabilize to the point where local collapse occurs.
Figure 4‑12. Contour plots showing the water content distribution in cross-sections 2.8, 3.2, 3.6 and 4.0 m from the front in Test 1. The arrow on the left side indicates the height of the water inflow point.
26 SKB P-16-15
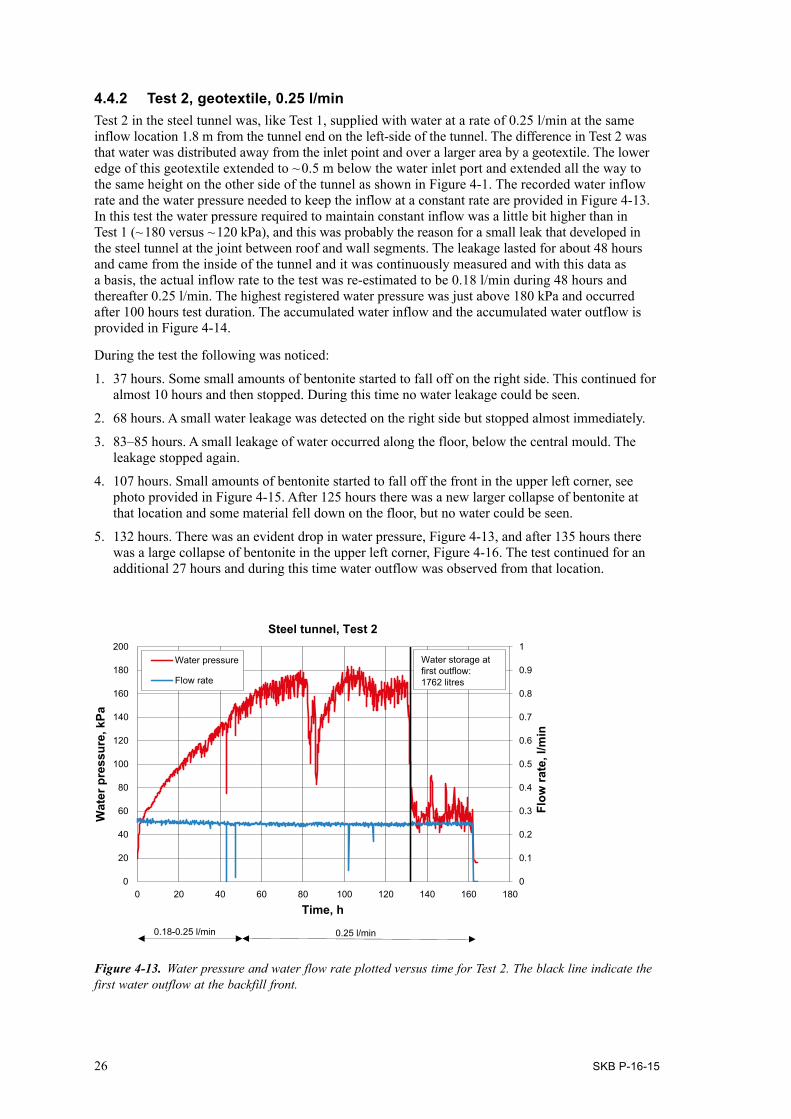
4.4.2 Test 2, geotextile, 0.25 l/minTest 2 in the steel tunnel was, like Test 1, supplied with water at a rate of 0.25 l/min at the same inflow location 1.8 m from the tunnel end on the left-side of the tunnel. The difference in Test 2 was that water was distributed away from the inlet point and over a larger area by a geotextile. The lower edge of this geotextile extended to ~ 0.5 m below the water inlet port and extended all the way to the same height on the other side of the tunnel as shown in Figure 4-1. The recorded water inflow rate and the water pressure needed to keep the inflow at a constant rate are provided in Figure 4-13. In this test the water pressure required to maintain constant inflow was a little bit higher than in Test 1 (~ 180 versus ~ 120 kPa), and this was probably the reason for a small leak that developed in the steel tunnel at the joint between roof and wall segments. The leakage lasted for about 48 hours and came from the inside of the tunnel and it was continuously measured and with this data as a basis, the actual inflow rate to the test was re-estimated to be 0.18 l/min during 48 hours and there after 0.25 l/min. The highest registered water pressure was just above 180 kPa and occurred after 100 hours test duration. The accumulated water inflow and the accumulated water outflow is provided in Figure 4-14.
During the test the following was noticed:
1. 37 hours. Some small amounts of bentonite started to fall off on the right side. This continued for almost 10 hours and then stopped. During this time no water leakage could be seen.
2. 68 hours. A small water leakage was detected on the right side but stopped almost immediately.
3. 83–85 hours. A small leakage of water occurred along the floor, below the central mould. The leakage stopped again.
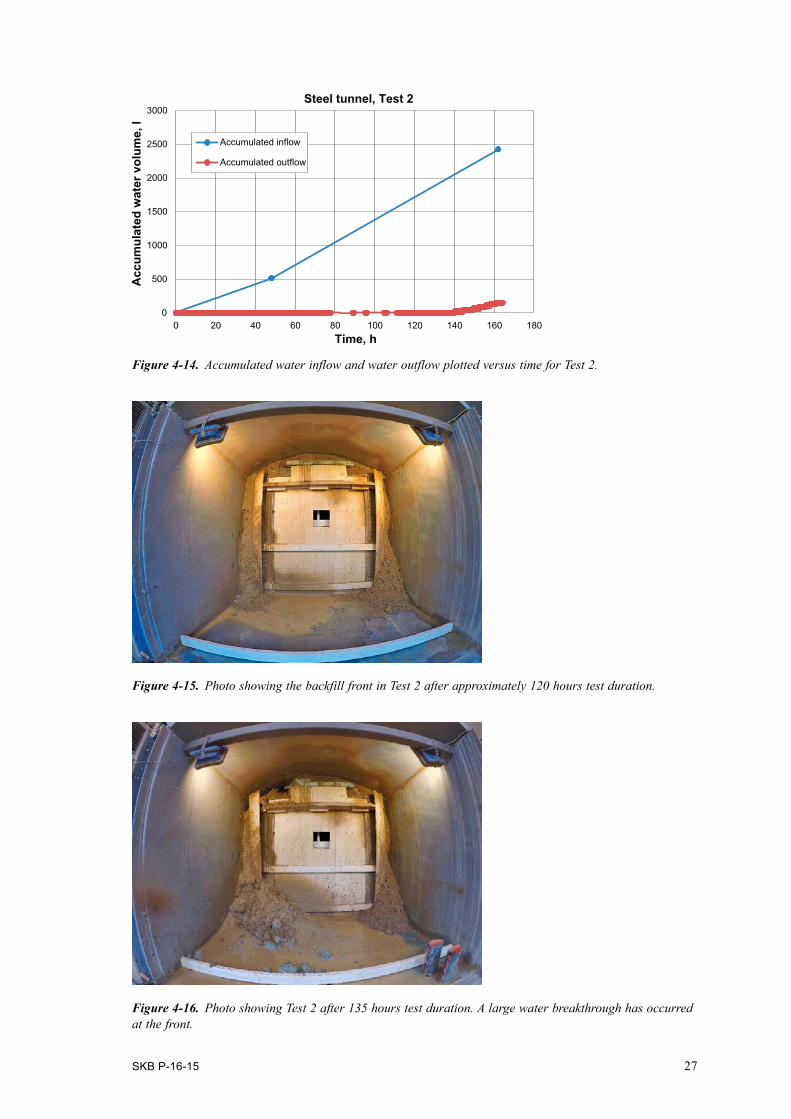
4. 107 hours. Small amounts of bentonite started to fall off the front in the upper left corner, see photo provided in Figure 4-15. After 125 hours there was a new larger collapse of bentonite at that location and some material fell down on the floor, but no water could be seen.
5. 132 hours. There was an evident drop in water pressure, Figure 4-13, and after 135 hours there was a large collapse of bentonite in the upper left corner, Figure 4-16. The test continued for an additional 27 hours and during this time water outflow was observed from that location.
Figure 4‑13. Water pressure and water flow rate plotted versus time for Test 2. The black line indicate the first water outflow at the backfill front.
0
0.1
0.2
0.3
0.4
0.5
0.6
0.7
0.8
0.9
1
0
20
40
60
80
100
120
140
160
180
200
0 20 40 60 80 100 120 140 160 180
Flow
rate
, l/m
in
Time, h
Wat
er p
ress
ure,
kPa
Steel tunnel, Test 2
Water pressure
Flow rate
Water storage at
1762 litresfirst outflow:
0.18-0.25 l/min 0.25 l/min
SKB P-16-15 27
Figure 4‑15. Photo showing the backfill front in Test 2 after approximately 120 hours test duration.
Figure 4‑16. Photo showing Test 2 after 135 hours test duration. A large water breakthrough has occurred at the front.
0
500
1000
1500
2000
2500
3000
0 20 40 60 80 100 120 140 160 180Time, h
Acc
umul
ated
wat
er v
olum
e, l
Steel tunnel, Test 2
Accumulated inflow
Accumulated outflow
Figure 4‑14. Accumulated water inflow and water outflow plotted versus time for Test 2.
28 SKB P-16-15
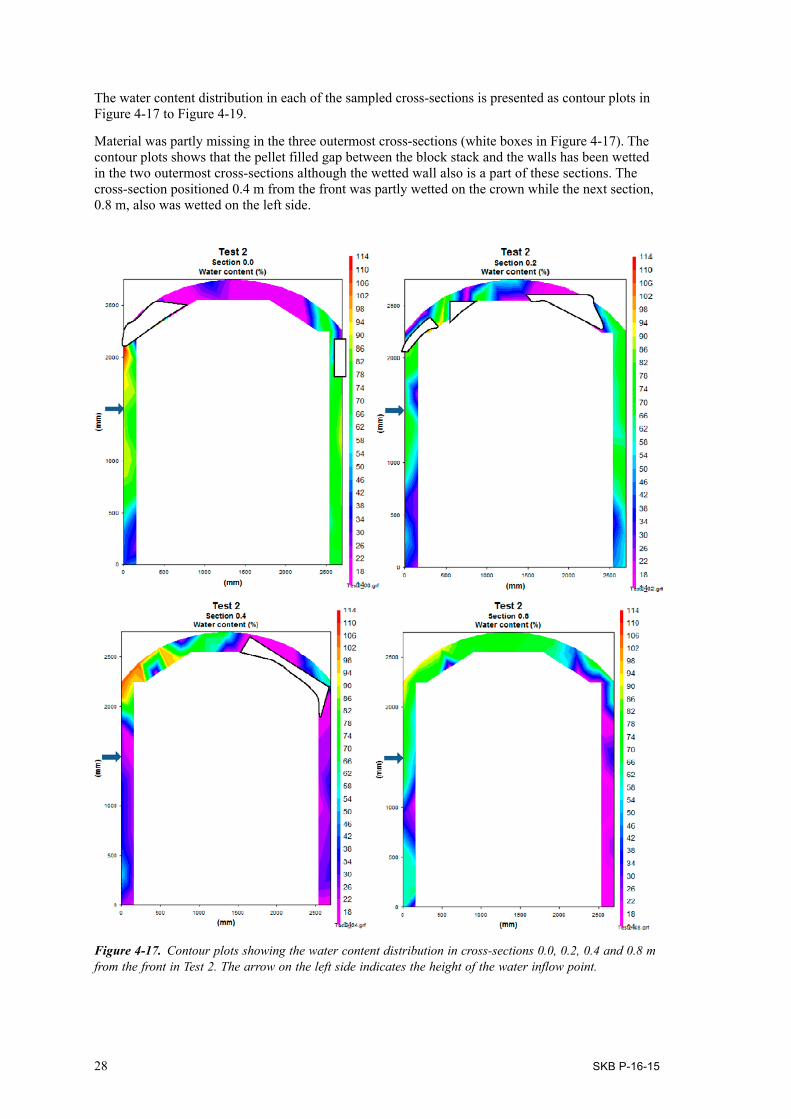
The water content distribution in each of the sampled cross-sections is presented as contour plots in Figure 4-17 to Figure 4-19.
Material was partly missing in the three outermost cross-sections (white boxes in Figure 4-17). The contour plots shows that the pellet filled gap between the block stack and the walls has been wetted in the two outermost cross-sections although the wetted wall also is a part of these sections. The cross-section positioned 0.4 m from the front was partly wetted on the crown while the next section, 0.8 m, also was wetted on the left side.
Figure 4‑17. Contour plots showing the water content distribution in cross-sections 0.0, 0.2, 0.4 and 0.8 m from the front in Test 2. The arrow on the left side indicates the height of the water inflow point.
SKB P-16-15 29
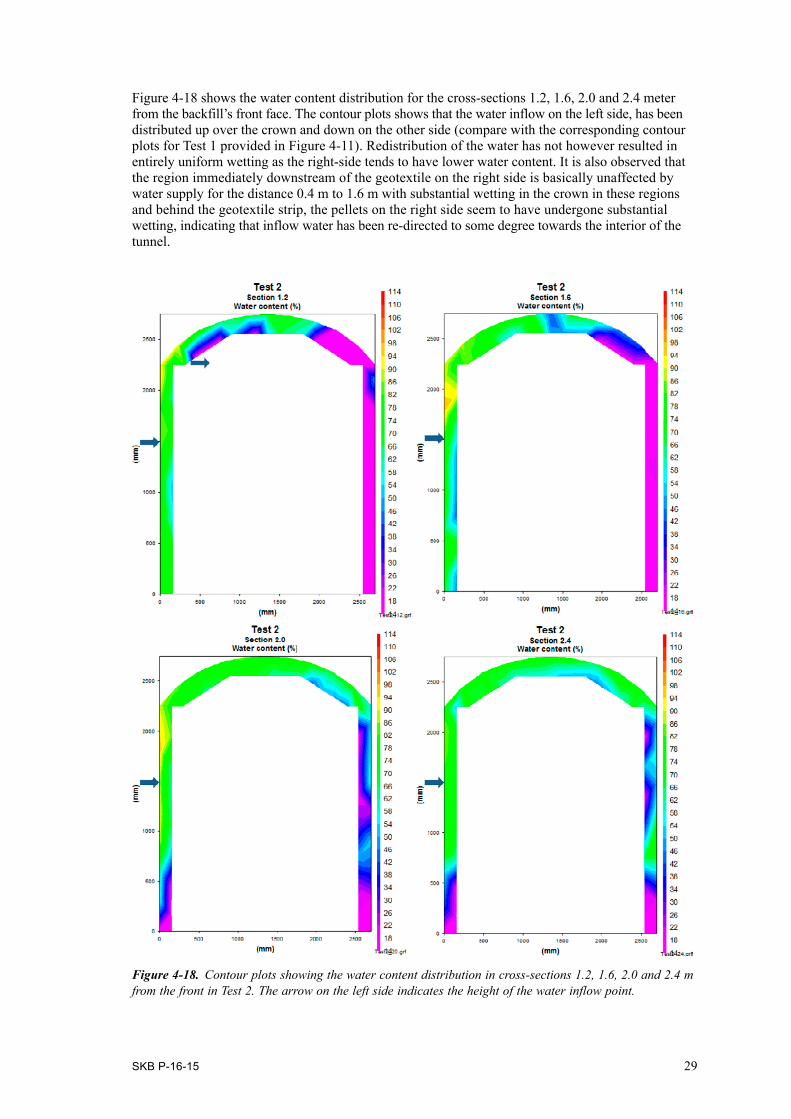
Figure 4-18 shows the water content distribution for the cross-sections 1.2, 1.6, 2.0 and 2.4 meter from the backfill’s front face. The contour plots shows that the water inflow on the left side, has been distributed up over the crown and down on the other side (compare with the corresponding contour plots for Test 1 provided in Figure 4-11). Redistribution of the water has not however resulted in entirely uniform wetting as the right-side tends to have lower water content. It is also observed that the region immediately downstream of the geotextile on the right side is basically unaffected by water supply for the distance 0.4 m to 1.6 m with substantial wetting in the crown in these regions and behind the geotextile strip, the pellets on the right side seem to have undergone substantial wetting, indicating that inflow water has been re-directed to some degree towards the interior of the tunnel.
Figure 4‑18. Contour plots showing the water content distribution in cross-sections 1.2, 1.6, 2.0 and 2.4 m from the front in Test 2. The arrow on the left side indicates the height of the water inflow point.
30 SKB P-16-15
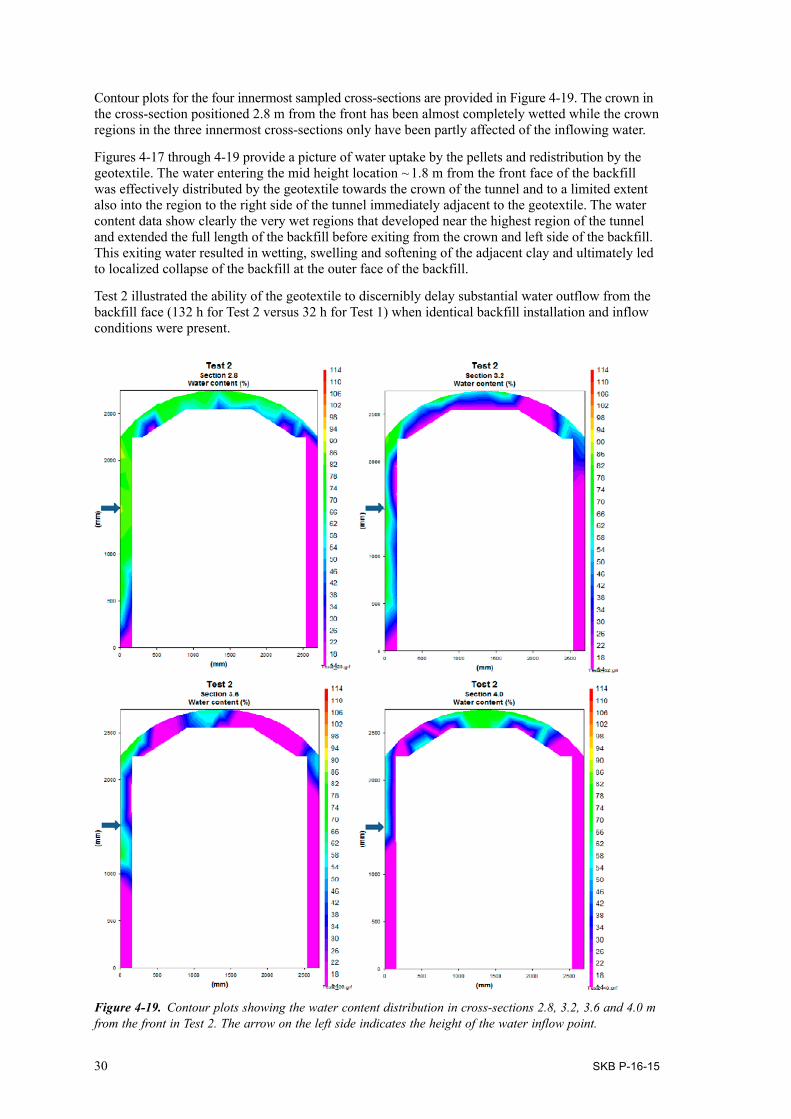
Contour plots for the four innermost sampled cross-sections are provided in Figure 4-19. The crown in the cross-section positioned 2.8 m from the front has been almost completely wetted while the crown regions in the three innermost cross-sections only have been partly affected of the inflowing water.
Figures 4-17 through 4-19 provide a picture of water uptake by the pellets and redistribution by the geotextile. The water entering the mid height location ~ 1.8 m from the front face of the backfill was effectively distributed by the geotextile towards the crown of the tunnel and to a limited extent also into the region to the right side of the tunnel immediately adjacent to the geotextile. The water content data show clearly the very wet regions that developed near the highest region of the tunnel and extended the full length of the backfill before exiting from the crown and left side of the backfill. This exiting water resulted in wetting, swelling and softening of the adjacent clay and ultimately led to localized collapse of the backfill at the outer face of the backfill.
Test 2 illustrated the ability of the geotextile to discernibly delay substantial water outflow from the backfill face (132 h for Test 2 versus 32 h for Test 1) when identical backfill installation and inflow conditions were present.
Figure 4‑19. Contour plots showing the water content distribution in cross-sections 2.8, 3.2, 3.6 and 4.0 m from the front in Test 2. The arrow on the left side indicates the height of the water inflow point.
SKB P-16-15 31
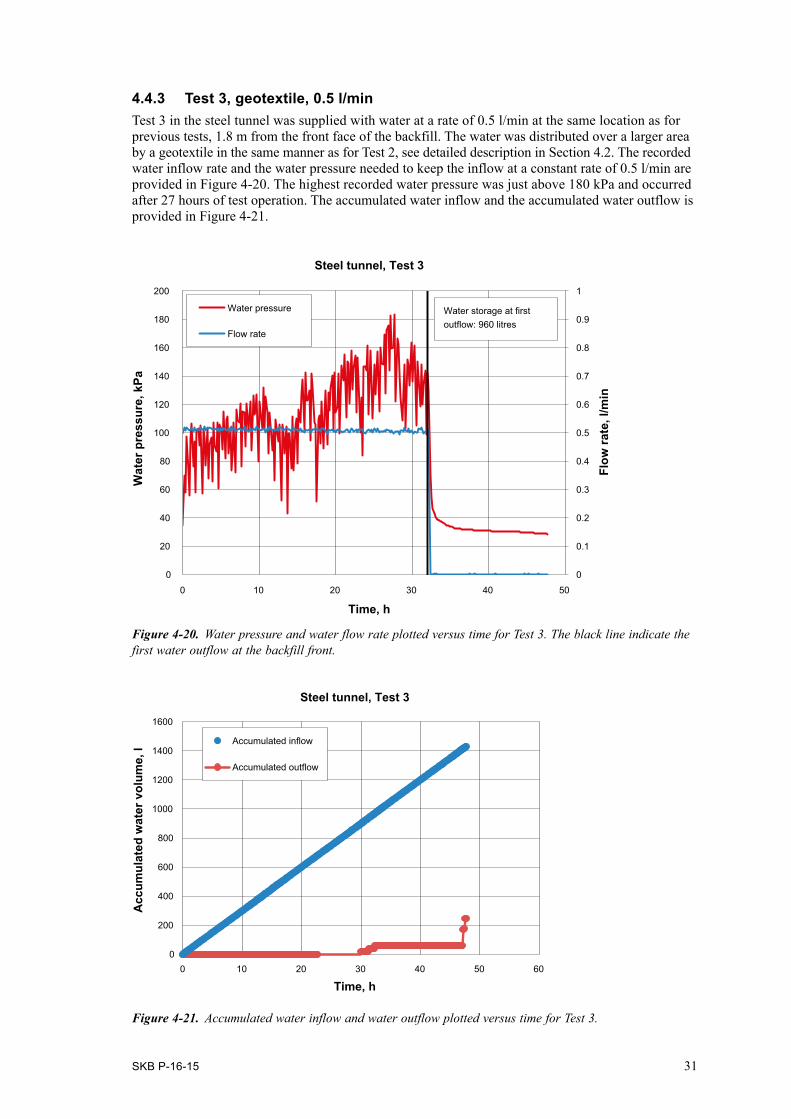
4.4.3 Test 3, geotextile, 0.5 l/minTest 3 in the steel tunnel was supplied with water at a rate of 0.5 l/min at the same location as for previous tests, 1.8 m from the front face of the backfill. The water was distributed over a larger area by a geotextile in the same manner as for Test 2, see detailed description in Section 4.2. The recorded water inflow rate and the water pressure needed to keep the inflow at a constant rate of 0.5 l/min are provided in Figure 4-20. The highest recorded water pressure was just above 180 kPa and occurred after 27 hours of test operation. The accumulated water inflow and the accumulated water outflow is provided in Figure 4-21.
Figure 4‑21. Accumulated water inflow and water outflow plotted versus time for Test 3.
0
0.1
0.2
0.3
0.4
0.5
0.6
0.7
0.8
1
0.9
0
20
40
60
80
100
120
140
160
180
200
0 10 20 30 40 50Fl
ow ra
te, l
/min
Time, h
Wat
er p
ress
ure,
kPa
Steel tunnel, Test 3
Water pressure
Flow rate
Water storage at first outflow: 960 litres
Figure 4‑20. Water pressure and water flow rate plotted versus time for Test 3. The black line indicate the first water outflow at the backfill front.
0
200
400
600
800
1000
1200
1400
1600
0 10 20 30 40 50 60
Time, h
Acc
umul
ated
wat
er v
olum
e, l
Steel tunnel, Test 3
Accumulated inflow
Accumulated outflow
32 SKB P-16-15
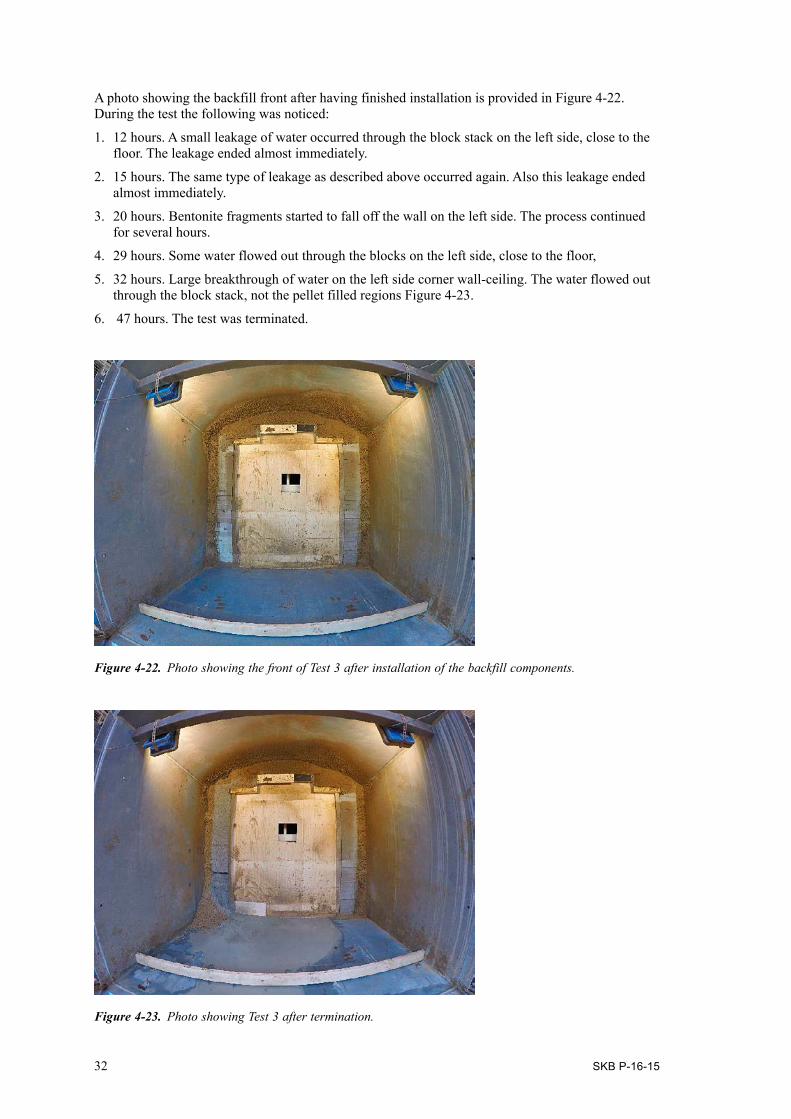
A photo showing the backfill front after having finished installation is provided in Figure 4-22. During the test the following was noticed:
1. 12 hours. A small leakage of water occurred through the block stack on the left side, close to the floor. The leakage ended almost immediately.
2. 15 hours. The same type of leakage as described above occurred again. Also this leakage ended almost immediately.
3. 20 hours. Bentonite fragments started to fall off the wall on the left side. The process continued for several hours.
4. 29 hours. Some water flowed out through the blocks on the left side, close to the floor,
5. 32 hours. Large breakthrough of water on the left side corner wall-ceiling. The water flowed out through the block stack, not the pellet filled regions Figure 4-23.
6. 47 hours. The test was terminated.
Figure 4‑22. Photo showing the front of Test 3 after installation of the backfill components.
Figure 4‑23. Photo showing Test 3 after termination.
SKB P-16-15 33
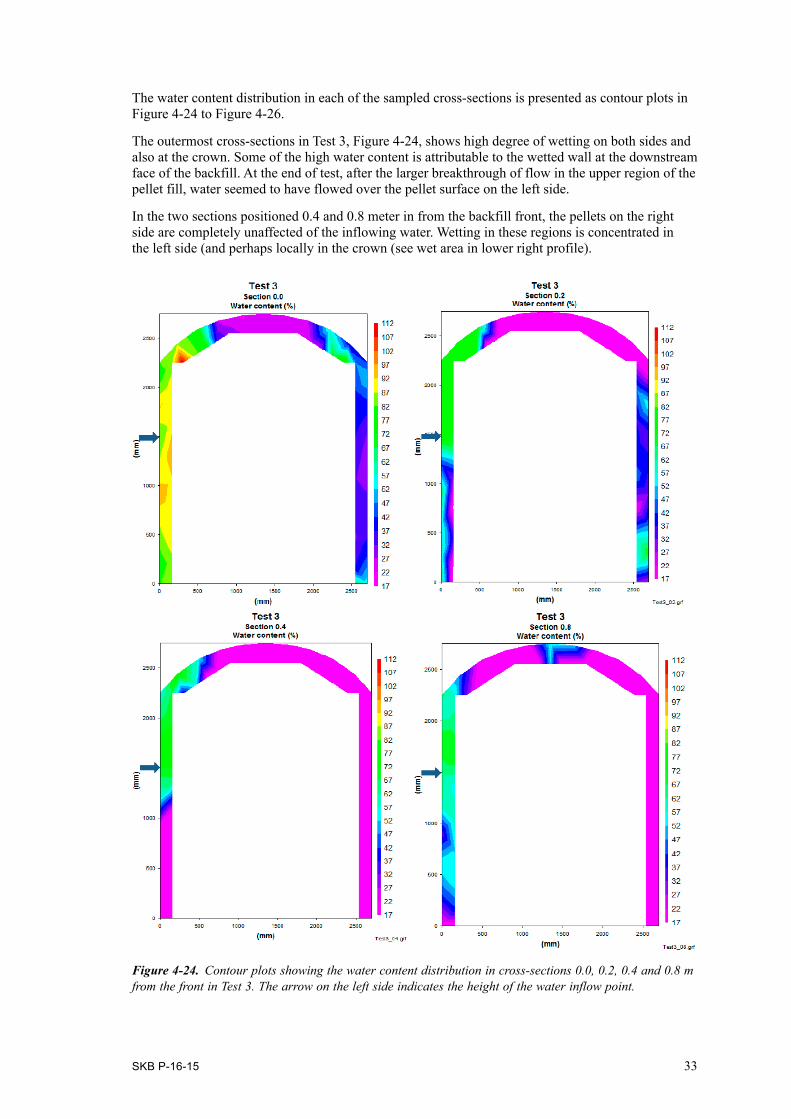
The water content distribution in each of the sampled cross-sections is presented as contour plots in Figure 4-24 to Figure 4-26.
The outermost cross-sections in Test 3, Figure 4-24, shows high degree of wetting on both sides and also at the crown. Some of the high water content is attributable to the wetted wall at the downstream face of the backfill. At the end of test, after the larger breakthrough of flow in the upper region of the pellet fill, water seemed to have flowed over the pellet surface on the left side.
In the two sections positioned 0.4 and 0.8 meter in from the backfill front, the pellets on the right side are completely unaffected of the inflowing water. Wetting in these regions is concentrated in the left side (and perhaps locally in the crown (see wet area in lower right profile).
Figure 4‑24. Contour plots showing the water content distribution in cross-sections 0.0, 0.2, 0.4 and 0.8 m from the front in Test 3. The arrow on the left side indicates the height of the water inflow point.
34 SKB P-16-15
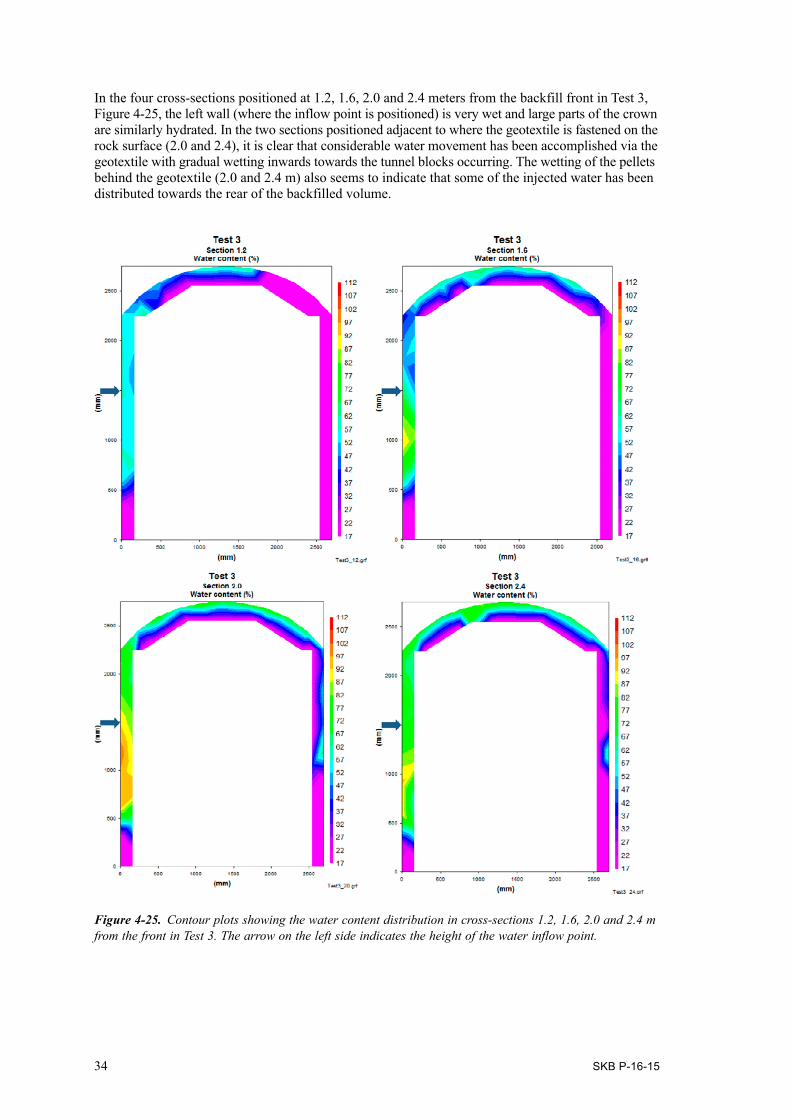
In the four cross-sections positioned at 1.2, 1.6, 2.0 and 2.4 meters from the backfill front in Test 3, Figure 4-25, the left wall (where the inflow point is positioned) is very wet and large parts of the crown are similarly hydrated. In the two sections positioned adjacent to where the geotextile is fastened on the rock surface (2.0 and 2.4), it is clear that considerable water movement has been accomplished via the geotextile with gradual wetting inwards towards the tunnel blocks occurring. The wetting of the pellets behind the geotextile (2.0 and 2.4 m) also seems to indicate that some of the injected water has been distributed towards the rear of the backfilled volume.
Figure 4‑25. Contour plots showing the water content distribution in cross-sections 1.2, 1.6, 2.0 and 2.4 m from the front in Test 3. The arrow on the left side indicates the height of the water inflow point.
SKB P-16-15 35
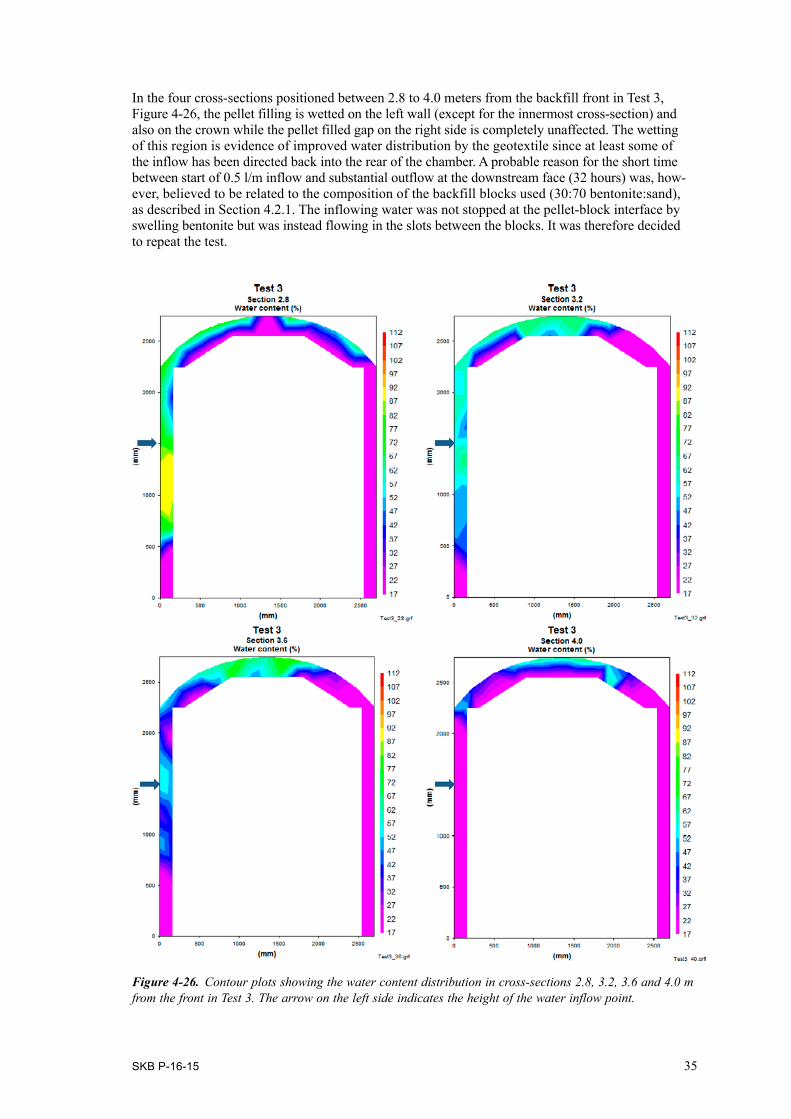
In the four cross-sections positioned between 2.8 to 4.0 meters from the backfill front in Test 3, Figure 4-26, the pellet filling is wetted on the left wall (except for the innermost cross-section) and also on the crown while the pellet filled gap on the right side is completely unaffected. The wetting of this region is evidence of improved water distribution by the geotextile since at least some of the inflow has been directed back into the rear of the chamber. A probable reason for the short time between start of 0.5 l/m inflow and substantial outflow at the downstream face (32 hours) was, how-ever, believed to be related to the composition of the backfill blocks used (30:70 bentonite:sand), as described in Section 4.2.1. The inflowing water was not stopped at the pellet-block interface by swelling bentonite but was instead flowing in the slots between the blocks. It was therefore decided to repeat the test.
Figure 4‑26. Contour plots showing the water content distribution in cross-sections 2.8, 3.2, 3.6 and 4.0 m from the front in Test 3. The arrow on the left side indicates the height of the water inflow point.
36 SKB P-16-15
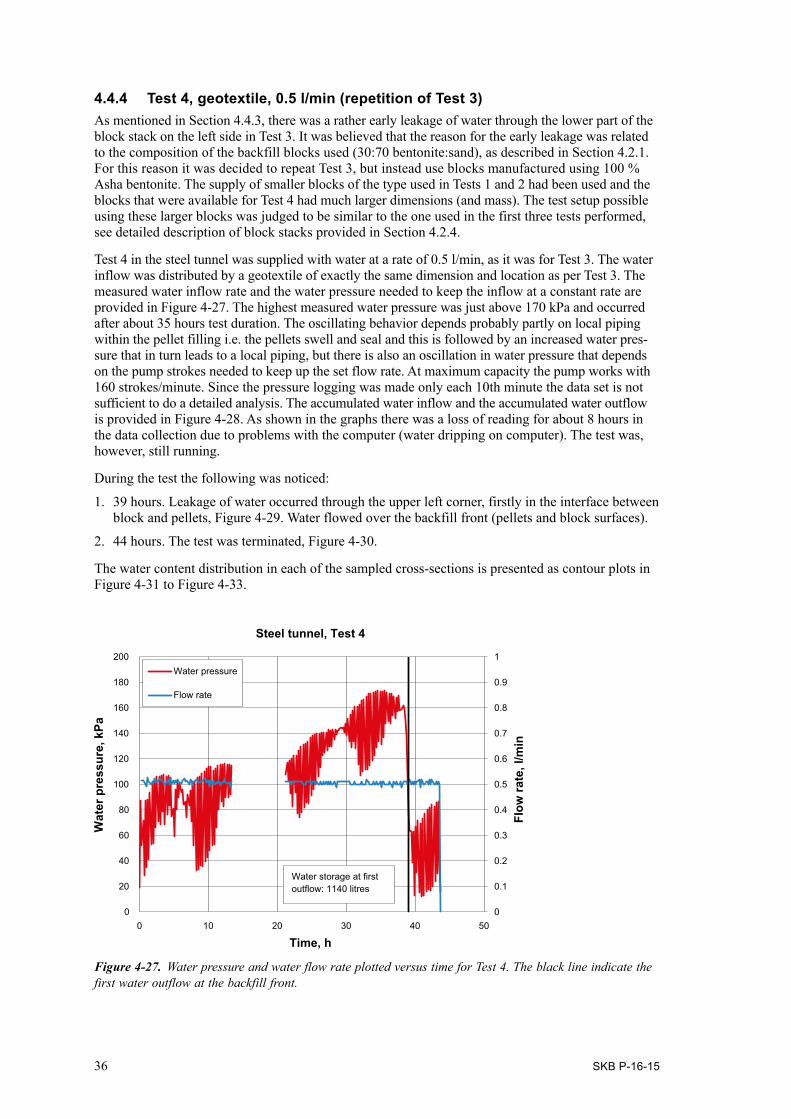
4.4.4 Test 4, geotextile, 0.5 l/min (repetition of Test 3)As mentioned in Section 4.4.3, there was a rather early leakage of water through the lower part of the block stack on the left side in Test 3. It was believed that the reason for the early leakage was related to the composition of the backfill blocks used (30:70 bentonite:sand), as described in Section 4.2.1. For this reason it was decided to repeat Test 3, but instead use blocks manufactured using 100 % Asha bentonite. The supply of smaller blocks of the type used in Tests 1 and 2 had been used and the blocks that were available for Test 4 had much larger dimensions (and mass). The test setup possible using these larger blocks was judged to be similar to the one used in the first three tests performed, see detailed description of block stacks provided in Section 4.2.4.
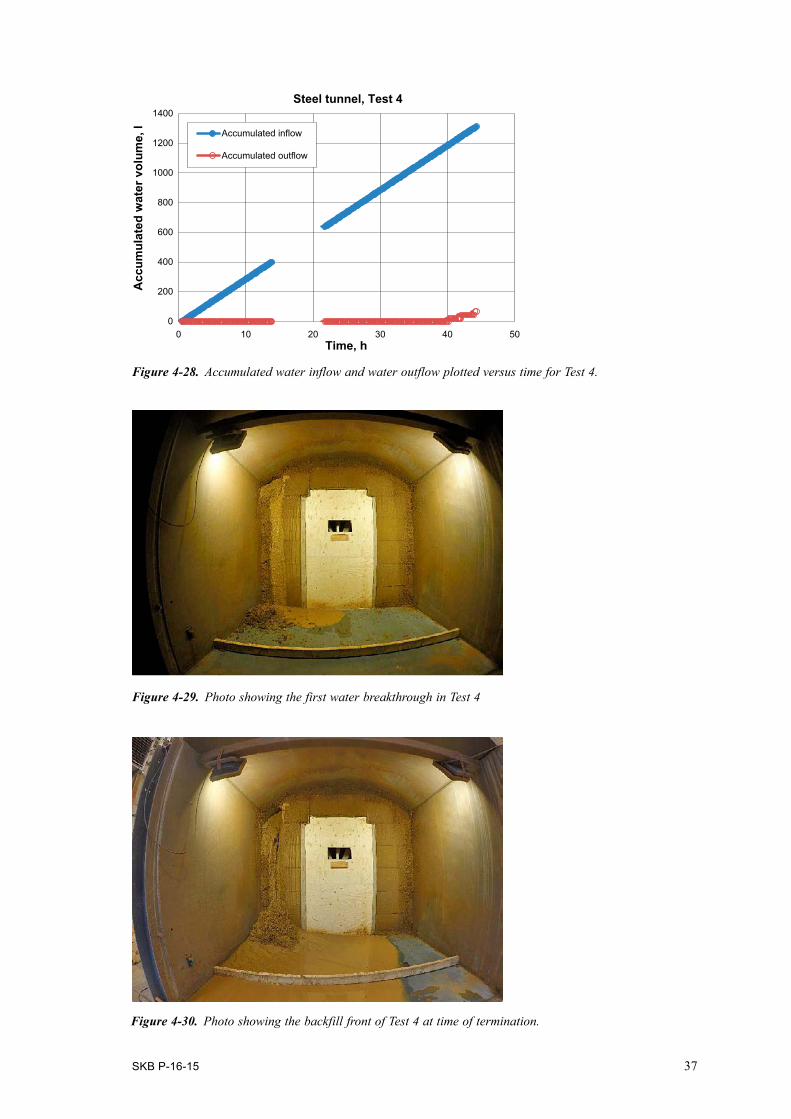
Test 4 in the steel tunnel was supplied with water at a rate of 0.5 l/min, as it was for Test 3. The water inflow was distributed by a geotextile of exactly the same dimension and location as per Test 3. The measured water inflow rate and the water pressure needed to keep the inflow at a constant rate are provided in Figure 4-27. The highest measured water pressure was just above 170 kPa and occurred after about 35 hours test duration. The oscillating behavior depends probably partly on local piping within the pellet filling i.e. the pellets swell and seal and this is followed by an increased water pres-sure that in turn leads to a local piping, but there is also an oscillation in water pressure that depends on the pump strokes needed to keep up the set flow rate. At maximum capacity the pump works with 160 strokes/minute. Since the pressure logging was made only each 10th minute the data set is not sufficient to do a detailed analysis. The accumulated water inflow and the accumulated water outflow is provided in Figure 4-28. As shown in the graphs there was a loss of reading for about 8 hours in the data collection due to problems with the computer (water dripping on computer). The test was, however, still running.
During the test the following was noticed:
1. 39 hours. Leakage of water occurred through the upper left corner, firstly in the interface between block and pellets, Figure 4-29. Water flowed over the backfill front (pellets and block surfaces).
2. 44 hours. The test was terminated, Figure 4-30.
The water content distribution in each of the sampled cross-sections is presented as contour plots in Figure 4-31 to Figure 4-33.
Figure 4‑27. Water pressure and water flow rate plotted versus time for Test 4. The black line indicate the first water outflow at the backfill front.
0
0.1
0.2
0.3
0.4
0.5
0.6
0.7
0.8
1
0.9
0
20
40
60
80
100
120
140
160
180
200
0 10 20 30 40 50
Flow
rate
, l/m
in
Time, h
Wat
er p
ress
ure,
kPa
Steel tunnel, Test 4
Water pressure
Flow rate
Water storage at first outflow: 1140 litres
SKB P-16-15 37
Figure 4‑28. Accumulated water inflow and water outflow plotted versus time for Test 4.
Figure 4‑29. Photo showing the first water breakthrough in Test 4
Figure 4‑30. Photo showing the backfill front of Test 4 at time of termination.
0
200
400
600
800
1000
1200
1400
0 10 20 30 40 50Time, h
Acc
umul
ated
wat
er v
olum
e, l
Steel tunnel, Test 4
Accumulated inflow
Accumulated outflow
38 SKB P-16-15
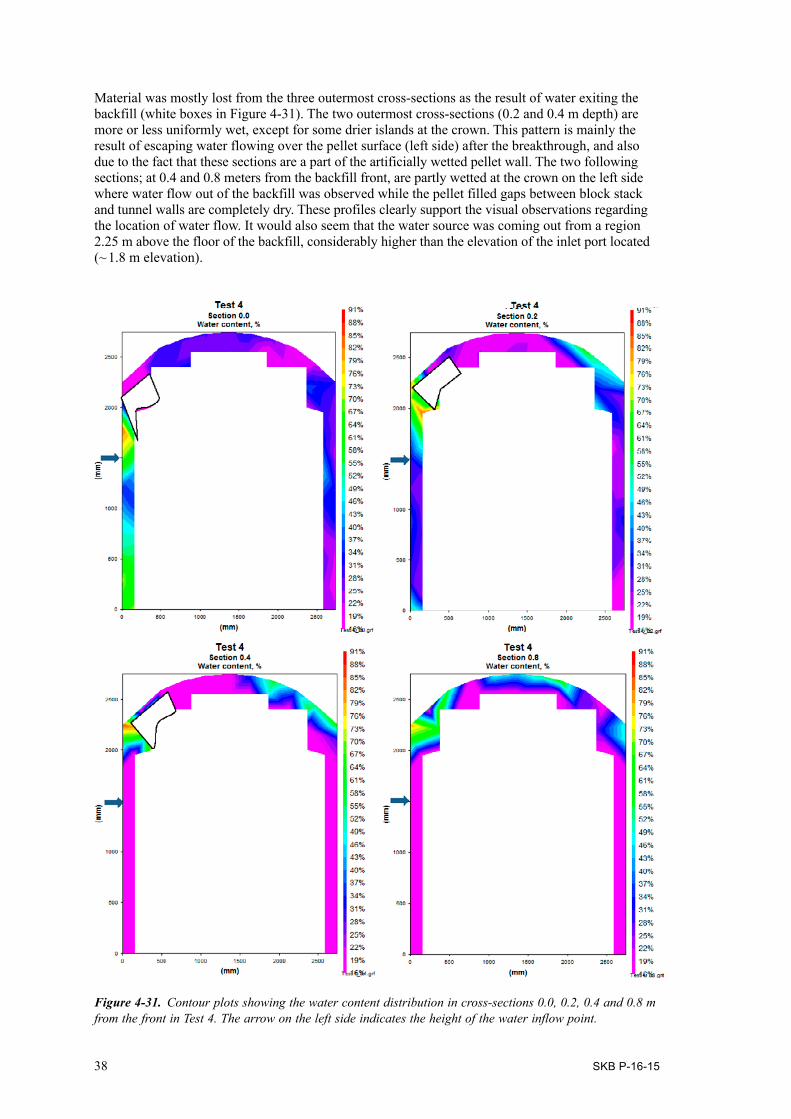
Material was mostly lost from the three outermost cross-sections as the result of water exiting the backfill (white boxes in Figure 4-31). The two outermost cross-sections (0.2 and 0.4 m depth) are more or less uniformly wet, except for some drier islands at the crown. This pattern is mainly the result of escaping water flowing over the pellet surface (left side) after the breakthrough, and also due to the fact that these sections are a part of the artificially wetted pellet wall. The two following sections; at 0.4 and 0.8 meters from the backfill front, are partly wetted at the crown on the left side where water flow out of the backfill was observed while the pellet filled gaps between block stack and tunnel walls are completely dry. These profiles clearly support the visual observations regarding the location of water flow. It would also seem that the water source was coming out from a region 2.25 m above the floor of the backfill, considerably higher than the elevation of the inlet port located (~ 1.8 m elevation).
Figure 4‑31. Contour plots showing the water content distribution in cross-sections 0.0, 0.2, 0.4 and 0.8 m from the front in Test 4. The arrow on the left side indicates the height of the water inflow point.

SKB P-16-15 39
At 1.2 m depth in the backfill the material in the upper left corner shows similar wetting pattern to what was seen downstream of it (Figure 4-32). Additionally there seems to have been considerable wetting in the crown region on the right side of the assembly.
The next two, 1.6 and 2.0 m from the front are very wet. These locations are immediately in front of and behind the geotextile respectively and have clearly been impacted by water supplied by it. Water has also clearly moved upwards into the crown via the geotextile and has been taken up by the underlying pellet materials. Uniform water uptake in the crown region is evidenced by the smooth contours of decreasing water content with distance from the crown.
At 2.0 and 2.4 m there is also evidence of greater water uptake in the regions behind (towards rear of tunnel), the geotextile than in front of it with extensive wetting of the crown and right side of the tunnel backfill.
Figure 4‑32. Contour plots showing the water content distribution in cross-sections 1.2, 1.6, 2.0 and 2.4 m from the front in Test 4. The arrow on the left side indicates the height of the water inflow point.

40 SKB P-16-15
The four last (interior) sections of backfill have mainly been wetted at the crown, with the greatest degree of wetting being to the left side, Figure 4-33. The water distribution in these regions is consistent with a system that is absorbing water from a wetted interface above it (along tunnel roof-pellet interface), as indicated by the pattern of decreasing water content with depth in the pellet fill. The sampling section located 2.8 meters from the front shows the same water distribution pattern as for those regions deeper in the tunnel (3.0–4.0 m), but also shows considerable wetting along the left side of the tunnel, as seen in this region at shorter distance from the geotextile (e.g. 1.6–2.4 m).
The water uptake patterns observed for Test 4 are very similar to those observed in Test 2 and Test 3. The geotextile seems to have been at least somewhat effective in distributing inflowing water over a larger volume of pellets, it did not however result in a substantial delay in water reaching the front face of the backfill with disruptive outflow occurring within 39 hours of test initiation.
Figure 4‑33. Contour plots showing the water content distribution in cross-sections 2.8, 3.2, 3.6 and 4.0 m from the front in Test 4. The arrow on the left side indicates the v of the water inflow point.

SKB P-16-15 41
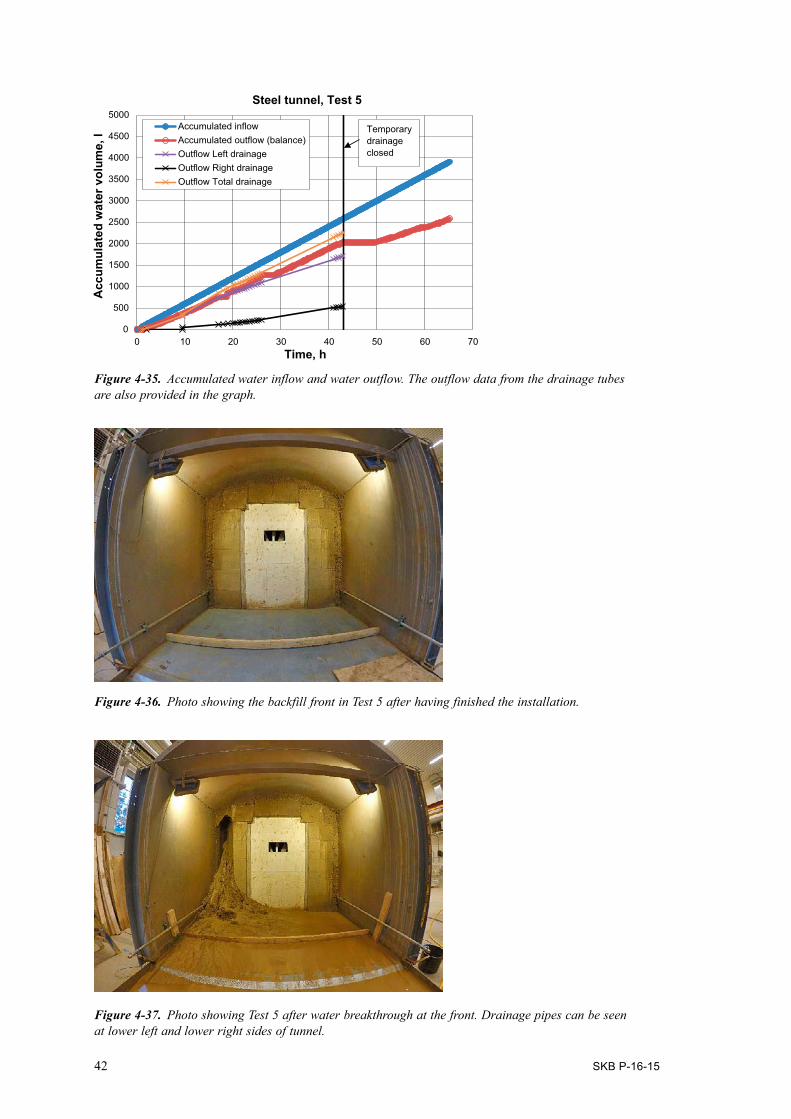
4.4.5 Test 5, geotextile, 1.0 l/min including test of temporary drainageTest 5 in the steel tunnel was supplied with water at a rate of 1.0 l/min. The water inflow was distributed by a geotextile of the same type, dimension and location as in previous tests. In addition to the higher inflow rate of this test, there were water collection and drainage pipes installed, one on each side of the tunnel, at the ends of the geotextile sheet installed. The recorded water inflow rate and the water pressure needed to keep the inflow at a constant rate are provided in Figure 4-34. During the test time of Test 5, the pressure sensor stopped working after about 18 hours. The highest recorded water pressure was close to 200 kPa and occurred after about 40 hours of test operation. The accumulated water inflow and the accumulated water outflow data is provided in Figure 4-35. It should be noted that in Figure 4-35 the outflow recorded by the balance during the first 43 hours (red line) and the quantity collected by the drainage pipes are also provided. These provide a double check of the manual measurements from the individual drainage pipes (black and purple).
Test 5 also included a functionality test of this suggested solution for temporary drainage of a very high inflow feature. This was accomplished by leaving the two drainage pipes open for handling water outflow via the geotextile. The water collector and the drainage pipes were left open for 43 hours before the drainage was closed and the water was then forced to flow into the pellet fill-ing. A detailed description and evaluation of the function of the temporary drainage pipe is provided in Chapter 5.
A photo showing the backfill front after having finished installation but before water is supplied is provided in Figure 4-36. During the test the following was noticed:
1. 1 hour. Water starts to flow out from the left drainage pipe (side where inflow occurs).
2. 9.5 hours. Water starts to flow out from the right drainage pipe.
3. 43 hours. The two drainage pipes are closed (valves are mounted at the ends).
4. 46 hours. Small water outflow on the floor at the left side of the test setup. The outflow stops almost immediately.
5. 50 hours. Large breakthrough of water on the upper left side.
6. 65 hours. The test was terminated. The photo provided in Figure 4-37 shows the backfill front at time for termination.
Figure 4‑34. Water pressure and water flow rate plotted versus time for Test 5. The black line indicate the first water outflow at the backfill front.
0
0.2
0.4
0.6
0.8
1
1.2
1.4
1.6
1.8
2
0
50
100
150
200
250
0 10 20 30 40 50 60 70 80
Flow
rate
, l/m
in
Time, h
Wat
er p
ress
ure,
kPa
Steel tunnel, Test 5
Water pressure
Flow rate
Water storage at first outflow: 420 litres
42 SKB P-16-15
Figure 4‑35. Accumulated water inflow and water outflow. The outflow data from the drainage tubes are also provided in the graph.
Figure 4‑36. Photo showing the backfill front in Test 5 after having finished the installation.
Figure 4‑37. Photo showing Test 5 after water breakthrough at the front. Drainage pipes can be seen at lower left and lower right sides of tunnel.
0
500
1000
1500
2000
2500
3000
3500
4000
4500
5000
0 10 20 30 40 50 60 70Time, h
Acc
umul
ated
wat
er v
olum
e, l
Steel tunnel, Test 5
Accumulated inflowAccumulated outflow (balance)Outflow Left drainageOutflow Right drainage
Temporary
Outflow Total drainage
drainage closed
SKB P-16-15 43
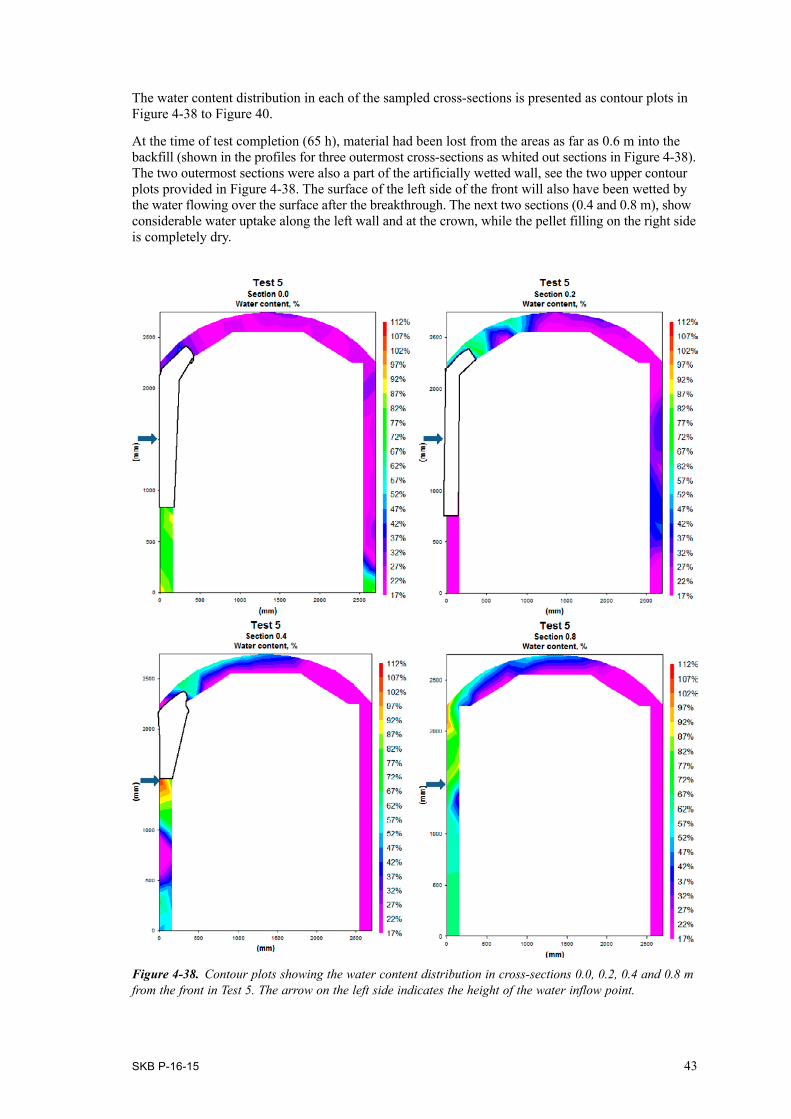
The water content distribution in each of the sampled cross-sections is presented as contour plots in Figure 4-38 to Figure 40.
At the time of test completion (65 h), material had been lost from the areas as far as 0.6 m into the backfill (shown in the profiles for three outermost cross-sections as whited out sections in Figure 4-38). The two outermost sections were also a part of the artificially wetted wall, see the two upper contour plots provided in Figure 4-38. The surface of the left side of the front will also have been wetted by the water flowing over the surface after the breakthrough. The next two sections (0.4 and 0.8 m), show considerable water uptake along the left wall and at the crown, while the pellet filling on the right side is completely dry.
Figure 4‑38. Contour plots showing the water content distribution in cross-sections 0.0, 0.2, 0.4 and 0.8 m from the front in Test 5. The arrow on the left side indicates the height of the water inflow point.
44 SKB P-16-15
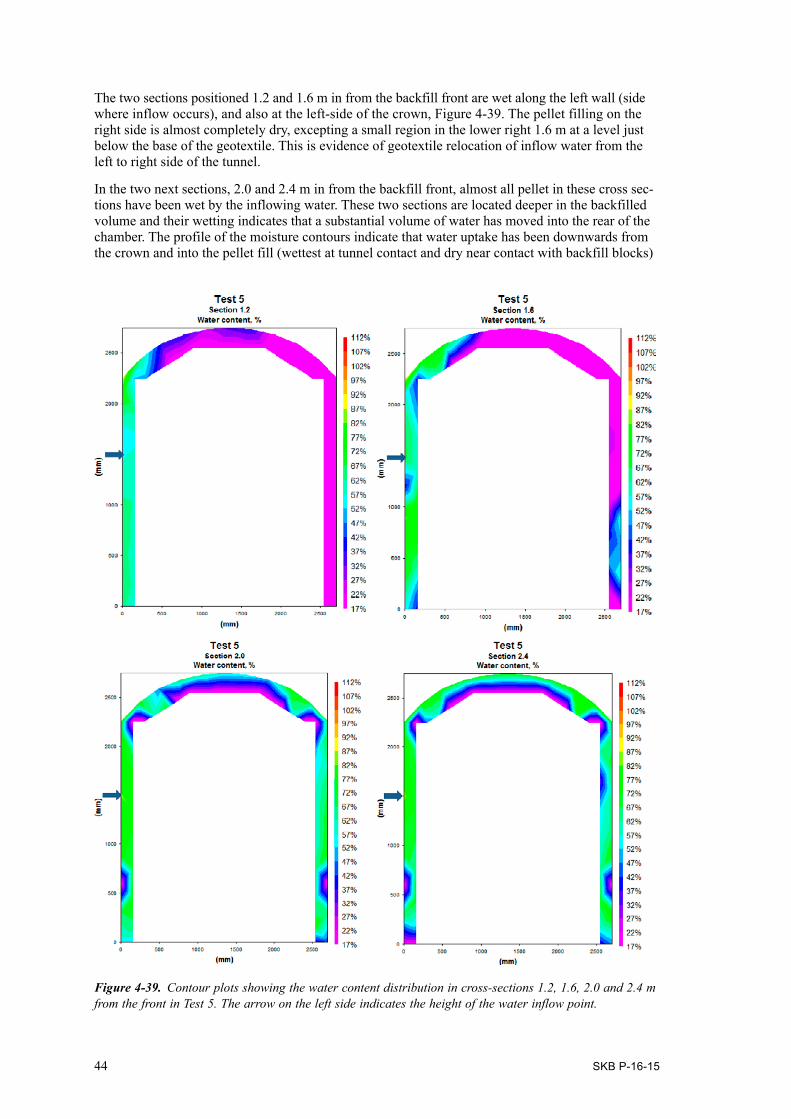
The two sections positioned 1.2 and 1.6 m in from the backfill front are wet along the left wall (side where inflow occurs), and also at the left-side of the crown, Figure 4-39. The pellet filling on the right side is almost completely dry, excepting a small region in the lower right 1.6 m at a level just below the base of the geotextile. This is evidence of geotextile relocation of inflow water from the left to right side of the tunnel.
In the two next sections, 2.0 and 2.4 m in from the backfill front, almost all pellet in these cross sec-tions have been wet by the inflowing water. These two sections are located deeper in the backfilled volume and their wetting indicates that a substantial volume of water has moved into the rear of the chamber. The profile of the moisture contours indicate that water uptake has been downwards from the crown and into the pellet fill (wettest at tunnel contact and dry near contact with backfill blocks)
Figure 4‑39. Contour plots showing the water content distribution in cross-sections 1.2, 1.6, 2.0 and 2.4 m from the front in Test 5. The arrow on the left side indicates the height of the water inflow point.
SKB P-16-15 45
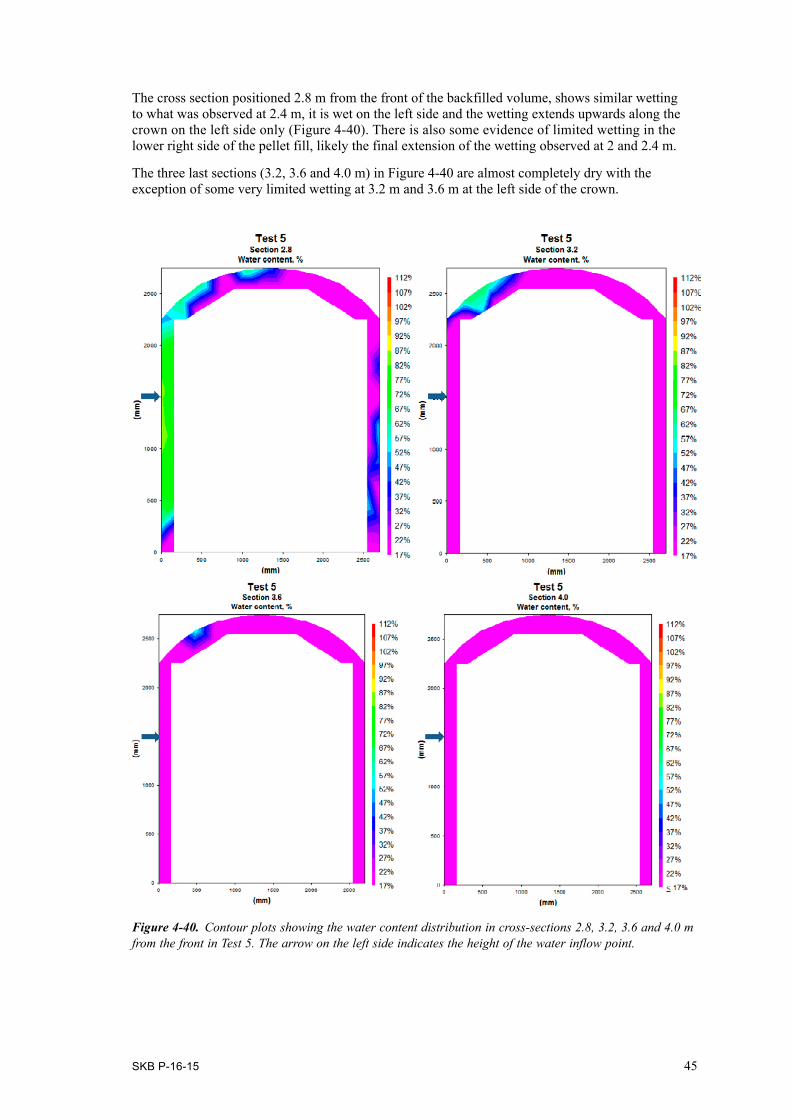
The cross section positioned 2.8 m from the front of the backfilled volume, shows similar wetting to what was observed at 2.4 m, it is wet on the left side and the wetting extends upwards along the crown on the left side only (Figure 4-40). There is also some evidence of limited wetting in the lower right side of the pellet fill, likely the final extension of the wetting observed at 2 and 2.4 m.
The three last sections (3.2, 3.6 and 4.0 m) in Figure 4-40 are almost completely dry with the exception of some very limited wetting at 3.2 m and 3.6 m at the left side of the crown.
Figure 4‑40. Contour plots showing the water content distribution in cross-sections 2.8, 3.2, 3.6 and 4.0 m from the front in Test 5. The arrow on the left side indicates the height of the water inflow point.

46 SKB P-16-15
Test 5 is judged to provide a good simulation of a situation where the backfilling process must pass through a fractured zone with a rather high water inflow rate. The use the geotextile and the temporary drainage lines will provide some extra time for the backfilling before water will penetrate into filled volume. It is estimated from this test that approximately 43 hours of operational time can be gained through use of this type of drainage. During this time it is estimated that for the SKB backfilling schedule, an additional 12 meters of backfill can be installed, which means that the water storing capacity of the backfill will have substantially increased, reducing the risk of disruptive water outflow events.
4.5 Comments and conclusions4.5.1 Water pressure developmentThe required water pressure in order to keep the inflow rate at a constant level was regularly measured in all tests, Figure 4-41. The maximum pressure varies between 170 kPa (Test 1) and up to 200 kPa (Test 5). There is a trend in all five tests that the pressure increases somewhat with time, but the variation in pressure during test time is large. The oscillating behavior depends probably partly on local piping within the pellet filling i.e. the pellets swell and seal and this is followed by an increased water pressure that in turn leads to a local piping, but there is also an oscillation in water pressure that depends on the pump strokes needed to keep up the set flow rate. At maximum capacity the pump works with 160 strokes/minute. Since the pressure logging was made only each 10th minute the data set is not sufficient to do a detailed analysis. In Test 2, Test 3 and Test 4, there were very evident drops in pressure in conjunction with the water breakthroughs. During the test time of Test 5, the pressure sensor stopped working after about 18 hours.
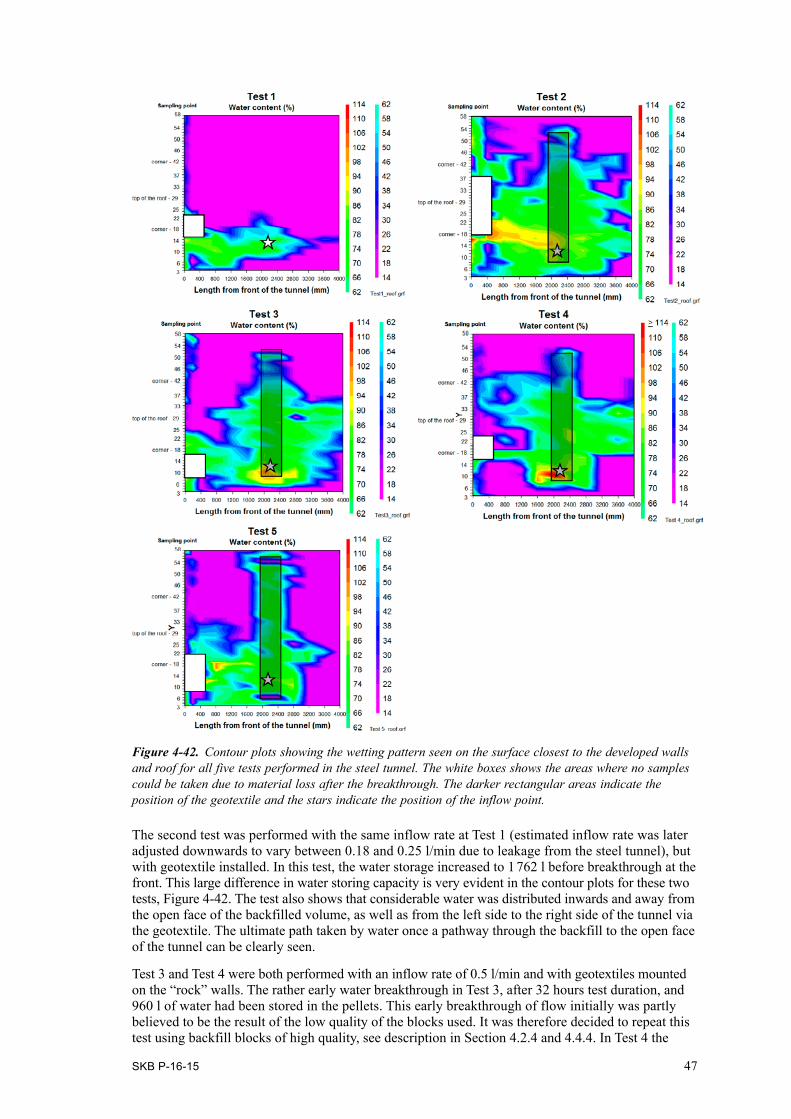
4.5.2 Water storage capacityWater storage data from the performed tests were provided in Table 4-2. Figure 4-42 shows contour plots of the wetting pattern seen on the surface closest to the developed walls and roof for all five tests performed in the steel tunnel. The darker rectangular areas indicate the position of the geotextile and the stars indicate the position of the inflow point. The white areas shows where no samples were taken due to bentonite collapse (bentonite fell down on floor).
The first test in this test series was a reference tests, performed with an inflow rate of 0.25 l/min and without any geotextile installed. In this test 525 liters were stored before outflow occurred. Water uptake by the pellets was limited to the left-side where the water inlet was located and showed only limited water movement inwards in the backfill.
Figure 4‑41. Water pressure plotted versus time for all five tests performed in the steel tunnel.
0
50
100
150
200
250
0 10 20 30 40 50 60 70 80 90 100 110 120 130 140 150 160 170Time, h
Wat
er p
ress
ure,
kPa
1: 0.25 l/min 2: 0.2 l/min 3: 0.5 l/min 4: 0.5 l/min 5: 1 l/min
SKB P-16-15 47
The second test was performed with the same inflow rate at Test 1 (estimated inflow rate was later adjusted downwards to vary between 0.18 and 0.25 l/min due to leakage from the steel tunnel), but with geotextile installed. In this test, the water storage increased to 1 762 l before breakthrough at the front. This large difference in water storing capacity is very evident in the contour plots for these two tests, Figure 4-42. The test also shows that considerable water was distributed inwards and away from the open face of the backfilled volume, as well as from the left side to the right side of the tunnel via the geotextile. The ultimate path taken by water once a pathway through the backfill to the open face of the tunnel can be clearly seen.
Test 3 and Test 4 were both performed with an inflow rate of 0.5 l/min and with geotextiles mounted on the “rock” walls. The rather early water breakthrough in Test 3, after 32 hours test duration, and 960 l of water had been stored in the pellets. This early breakthrough of flow initially was partly believed to be the result of the low quality of the blocks used. It was therefore decided to repeat this test using backfill blocks of high quality, see description in Section 4.2.4 and 4.4.4. In Test 4 the
Figure 4‑42. Contour plots showing the wetting pattern seen on the surface closest to the developed walls and roof for all five tests performed in the steel tunnel. The white boxes shows the areas where no samples could be taken due to material loss after the breakthrough. The darker rectangular areas indicate the position of the geotextile and the stars indicate the position of the inflow point.
48 SKB P-16-15
water breakthrough occurred after 38 hours test. During this time, 1 140 liters inflowing water were stored in the pellet filling of Test 4. It would therefore seem that the block quality was not the cause of rapid development of outflow. The similarity of the time to outflow in these two systems would seem to indicate that the water storage capacity decreases fast when increasing the water inflow rate. It should, however, be noted that the water storage was still about twice as much in Test 3 and Test 4 as in the reference test, Test 1, where the inflow rate was 0.25 l/min and no geotextile was used. When using this water storage capacity of the pellets to handle inflowing water it should also be noticed that a full scale deposition tunnel (SKB type) contains almost six times as much pellets in a six meter long section as the steel tunnel test setup.
The last test, Test 5, was performed with an inflow rate of 1 l/min and with geotextile mounted on the “rock” wall. This test also included a function test of equipment for temporary drainage. The drainage phase did last for 43 hours and during this time approximately 2 000–2 250 liters were drained away. It is estimated that 300–600 liters of water were stored in the pellet filling during the drainage phase, see graph provided in Figure 4-35. The estimated water volume is based on the difference between injected water volume after 43 hours (blue line) and the outflow registered both with the balance (red line) and by manually measurements from the drainage pipes (orange line), i.e. not all of the inflowing water was drained out. When the valves to the drainage pipes were closed, all inflowing water was stored in the pellet filling. At this high inflow rate it took about seven hours before a breakthrough occurred in the backfill front. During these seven hours, 420 liters were stored in the pellet filling.
The tests have shown that the use of geotextile as a water distributor in order to increase the water storing capacity of a pellet filling, works well. At low inflow rates, < 0.25 l/min, the geotextile is very effective in increasing the water storage. When the inflow rate is doubled to 0.5 l/min (Test 3 and Test 4), also the water storage is doubled (compare with the results from Test 1). With an inflow rate of 1.0 l/min (Test 5), the inflowing water is evidently distributed along the geotextile but then it seems as if the pellets cannot swell and seal fast enough in order to prevent channel flow towards the backfill front. The water pressure needed in order to keep the inflow rate at a certain level also increases, see Figure 4-41, and this will also affect the pellet fillings possibility to seal and direct the water in different directions.
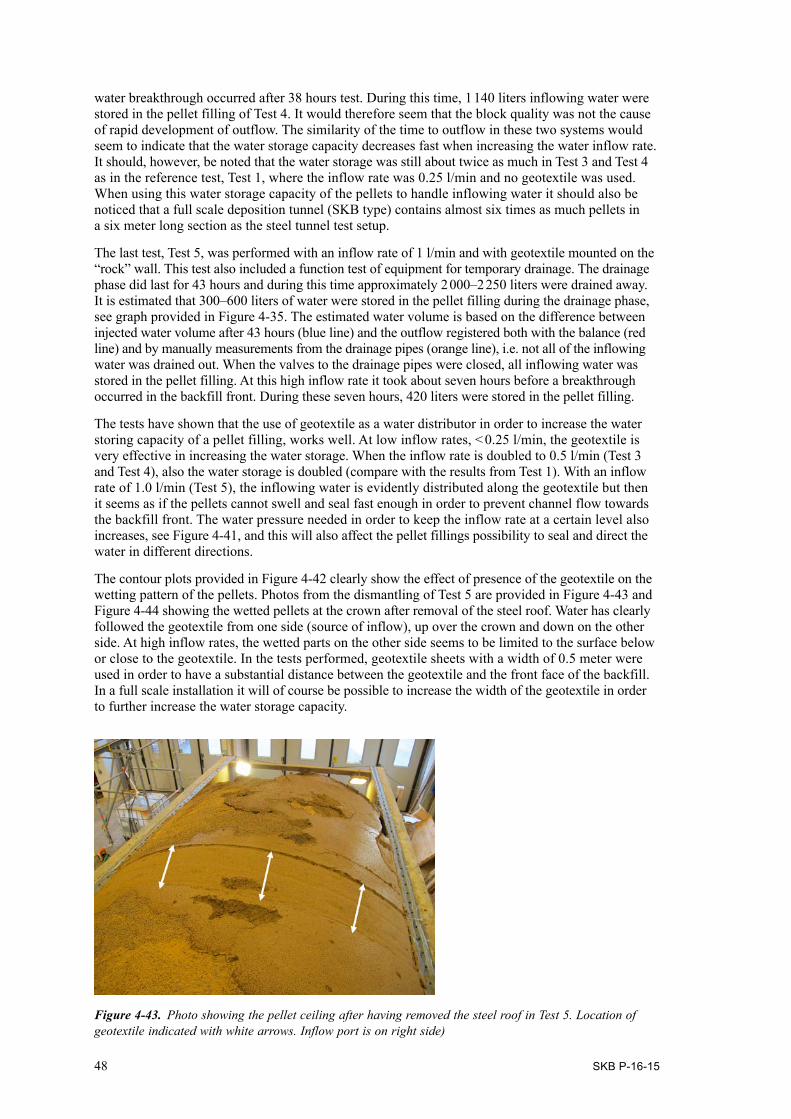
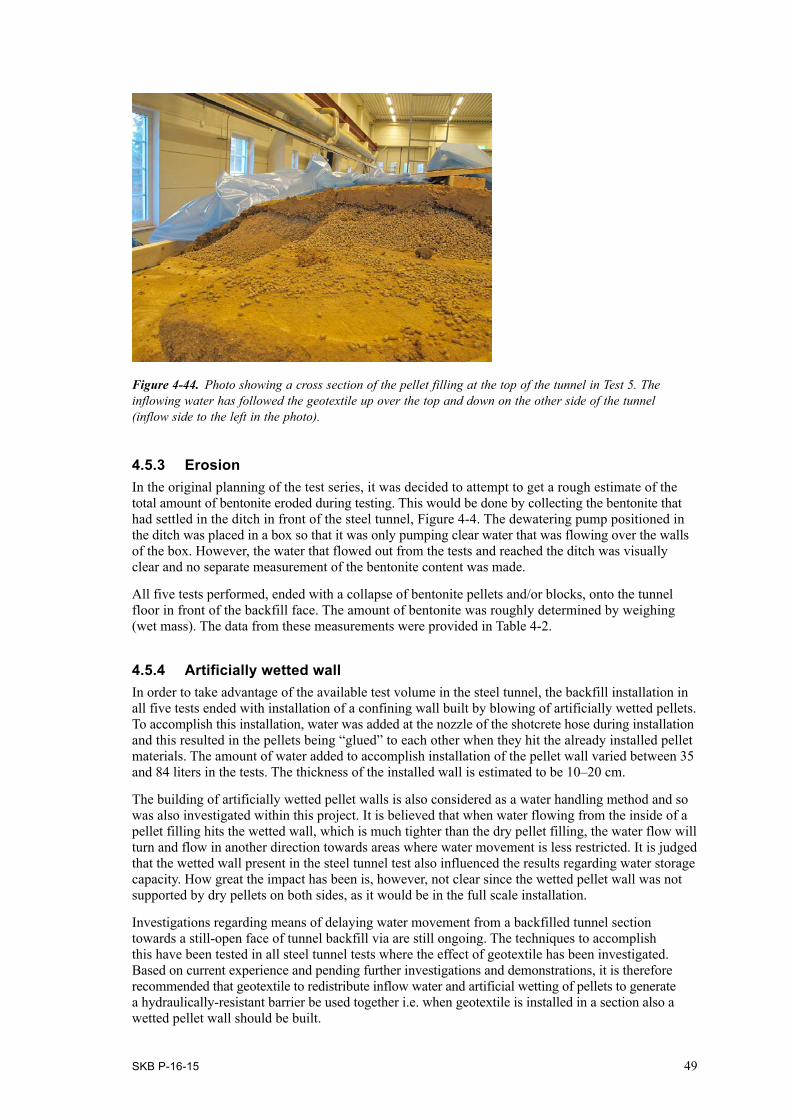
The contour plots provided in Figure 4-42 clearly show the effect of presence of the geotextile on the wetting pattern of the pellets. Photos from the dismantling of Test 5 are provided in Figure 4-43 and Figure 4-44 showing the wetted pellets at the crown after removal of the steel roof. Water has clearly followed the geotextile from one side (source of inflow), up over the crown and down on the other side. At high inflow rates, the wetted parts on the other side seems to be limited to the surface below or close to the geotextile. In the tests performed, geotextile sheets with a width of 0.5 meter were used in order to have a substantial distance between the geotextile and the front face of the backfill. In a full scale installation it will of course be possible to increase the width of the geotextile in order to further increase the water storage capacity.
Figure 4‑43. Photo showing the pellet ceiling after having removed the steel roof in Test 5. Location of geotextile indicated with white arrows. Inflow port is on right side)
SKB P-16-15 49
4.5.3 ErosionIn the original planning of the test series, it was decided to attempt to get a rough estimate of the total amount of bentonite eroded during testing. This would be done by collecting the bentonite that had settled in the ditch in front of the steel tunnel, Figure 4-4. The dewatering pump positioned in the ditch was placed in a box so that it was only pumping clear water that was flowing over the walls of the box. However, the water that flowed out from the tests and reached the ditch was visually clear and no separate measurement of the bentonite content was made.
All five tests performed, ended with a collapse of bentonite pellets and/or blocks, onto the tunnel floor in front of the backfill face. The amount of bentonite was roughly determined by weighing (wet mass). The data from these measurements were provided in Table 4-2.
4.5.4 Artificially wetted wallIn order to take advantage of the available test volume in the steel tunnel, the backfill installation in all five tests ended with installation of a confining wall built by blowing of artificially wetted pellets. To accomplish this installation, water was added at the nozzle of the shotcrete hose during installation and this resulted in the pellets being “glued” to each other when they hit the already installed pellet materials. The amount of water added to accomplish installation of the pellet wall varied between 35 and 84 liters in the tests. The thickness of the installed wall is estimated to be 10–20 cm.
The building of artificially wetted pellet walls is also considered as a water handling method and so was also investigated within this project. It is believed that when water flowing from the inside of a pellet filling hits the wetted wall, which is much tighter than the dry pellet filling, the water flow will turn and flow in another direction towards areas where water movement is less restricted. It is judged that the wetted wall present in the steel tunnel test also influenced the results regarding water storage capacity. How great the impact has been is, however, not clear since the wetted pellet wall was not supported by dry pellets on both sides, as it would be in the full scale installation.
Investigations regarding means of delaying water movement from a backfilled tunnel section towards a still-open face of tunnel backfill via are still ongoing. The techniques to accomplish this have been tested in all steel tunnel tests where the effect of geotextile has been investigated. Based on current experience and pending further investigations and demonstrations, it is therefore recommended that geotextile to redistribute inflow water and artificial wetting of pellets to generate a hydraulically-resistant barrier be used together i.e. when geotextile is installed in a section also a wetted pellet wall should be built.
Figure 4‑44. Photo showing a cross section of the pellet filling at the top of the tunnel in Test 5. The inflowing water has followed the geotextile up over the top and down on the other side of the tunnel (inflow side to the left in the photo).

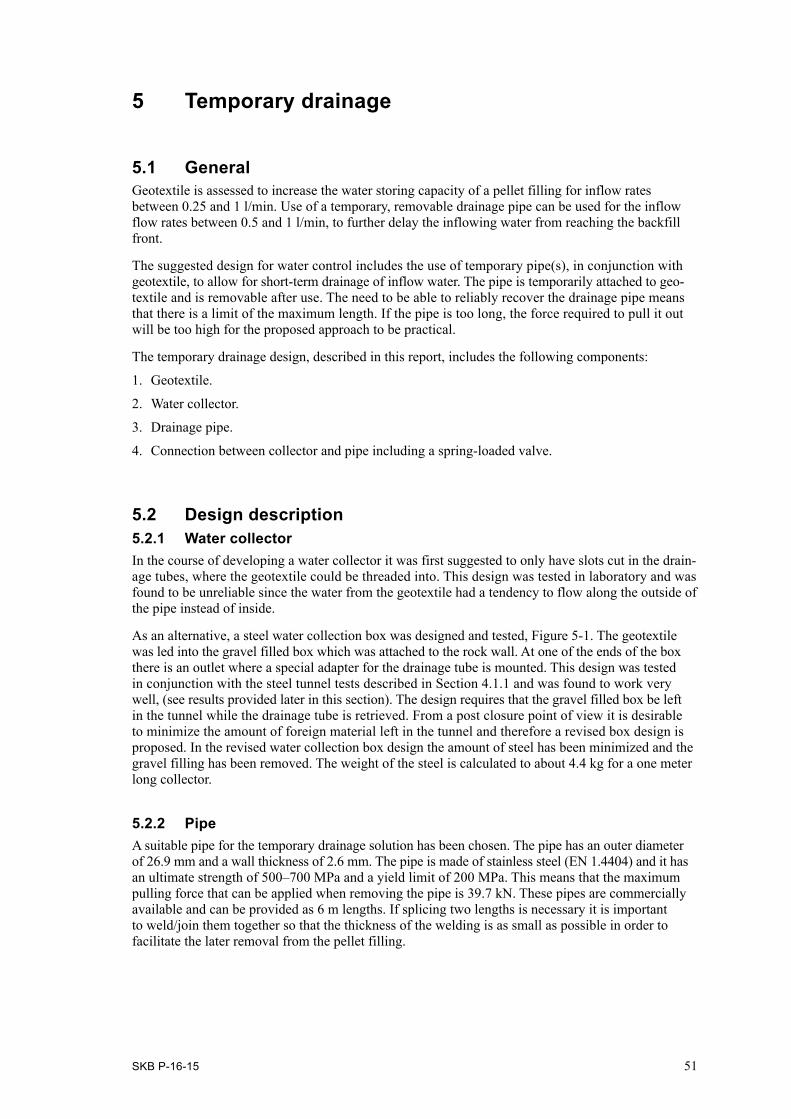
SKB P-16-15 51
5 Temporary drainage
5.1 GeneralGeotextile is assessed to increase the water storing capacity of a pellet filling for inflow rates between 0.25 and 1 l/min. Use of a temporary, removable drainage pipe can be used for the inflow flow rates between 0.5 and 1 l/min, to further delay the inflowing water from reaching the backfill front.
The suggested design for water control includes the use of temporary pipe(s), in conjunction with geotextile, to allow for short-term drainage of inflow water. The pipe is temporarily attached to geo-textile and is removable after use. The need to be able to reliably recover the drainage pipe means that there is a limit of the maximum length. If the pipe is too long, the force required to pull it out will be too high for the proposed approach to be practical.
The temporary drainage design, described in this report, includes the following components:
1. Geotextile.
2. Water collector.
3. Drainage pipe.
4. Connection between collector and pipe including a spring-loaded valve.
5.2 Design description5.2.1 Water collectorIn the course of developing a water collector it was first suggested to only have slots cut in the drain-age tubes, where the geotextile could be threaded into. This design was tested in laboratory and was found to be unreliable since the water from the geotextile had a tendency to flow along the outside of the pipe instead of inside.
As an alternative, a steel water collection box was designed and tested, Figure 5-1. The geotextile was led into the gravel filled box which was attached to the rock wall. At one of the ends of the box there is an outlet where a special adapter for the drainage tube is mounted. This design was tested in conjunction with the steel tunnel tests described in Section 4.1.1 and was found to work very well, (see results provided later in this section). The design requires that the gravel filled box be left in the tunnel while the drainage tube is retrieved. From a post closure point of view it is desirable to minimize the amount of foreign material left in the tunnel and therefore a revised box design is proposed. In the revised water collection box design the amount of steel has been minimized and the gravel filling has been removed. The weight of the steel is calculated to about 4.4 kg for a one meter long collector.
5.2.2 PipeA suitable pipe for the temporary drainage solution has been chosen. The pipe has an outer diameter of 26.9 mm and a wall thickness of 2.6 mm. The pipe is made of stainless steel (EN 1.4404) and it has an ultimate strength of 500–700 MPa and a yield limit of 200 MPa. This means that the maximum pulling force that can be applied when removing the pipe is 39.7 kN. These pipes are commercially available and can be provided as 6 m lengths. If splicing two lengths is necessary it is important to weld/join them together so that the thickness of the welding is as small as possible in order to facilitate the later removal from the pellet filling.

52 SKB P-16-15
5.2.3 Pipe supportsThe drainage pipe should be provided with several supports on its way out to the backfill front. The supports can be very simple e.g. angle brackets bolted onto the rock wall. These supports ensure that the pipes are not deformed through loads applied by the subsequently installed pellet materials and also that their removal is a straight pull.
5.3 Functional test in steel tunnel5.3.1 General test descriptionIn order to test the temporary drainage equipment and verify their functionality, a pre-test was performed in the steel tunnel. The test did not include any backfill blocks, only dry pellets that filled one side of the tunnel, see drawing and photo provided in Figure 5-2 and Figure 5-3.
The water collector was mounted on the steel tunnel wall. The geotextile was led down in the gravel filled water collector and a sheet of geotextile was used to cover the top of the gravel filling. A drain-age tube extended out through the pellet filling along the wall, Figure 5-3. After having completed the installation, a constant point water inflow of 0.5 l/min was applied on the geotextile for a period of approximately 48 hours.
Figure 5‑1. Mounting of water collector prototype in the steel tunnel.
Figure 5‑2. Schematic drawing of the Functional test of temporary drainage equipment.
Geotextile, width=500 mm
Bentonite pellets
Wooden frame covered with plastic sheet and bentonite geotextile
1800
Water inlet, 1.8 m from tunnel end
2250
Water collector

SKB P-16-15 53
5.3.2 ResultsThe applied water inflow rate and water pressure needed in order to keep the inflow at a constant rate is provided in Figure 5-4. The cyclic variation in measured water pressure is believed to mainly depend on the pump strokes. The inflow rate was set to 0.5 l/min for about 48 hours and was then increased to 1 l/min for a couple of hours before the test was terminated.
Figure 5-5 shows the accumulated inflow and outflow registered during the test. The outflow from the drainage tube was monitored by manual measurements at a regular interval. In order to calculate the total accumulated water outflow, it was assumed that the outflow rate determined during a measure-ment period (e.g. 5 minutes), was the constant between measurements. In addition to these manual measurements, the total outflow from the drainage tube was collected and pumped to a container that was weighed every ten minute (red line in Figure 5-5).
Figure 5‑3. Photo showing the drainage pipe that was led out from the pellet filling.
Figure 5‑4. Water pressure and flow rate plotted versus time for the functional test of the temporary drainage equipment
0
0.1
0.2
0.3
0.4
0.5
0.6
0.7
0.8
1
0.9
0
20
40
60
80
100
120
140
160
180
200
0 10 20 30 40 50 60
Flow
rate
, l/m
in
Time, h
Wat
er p
ress
ure,
kPa
WaterpressureFlow rate
Steel tunnel, Functional test of temp. drainage
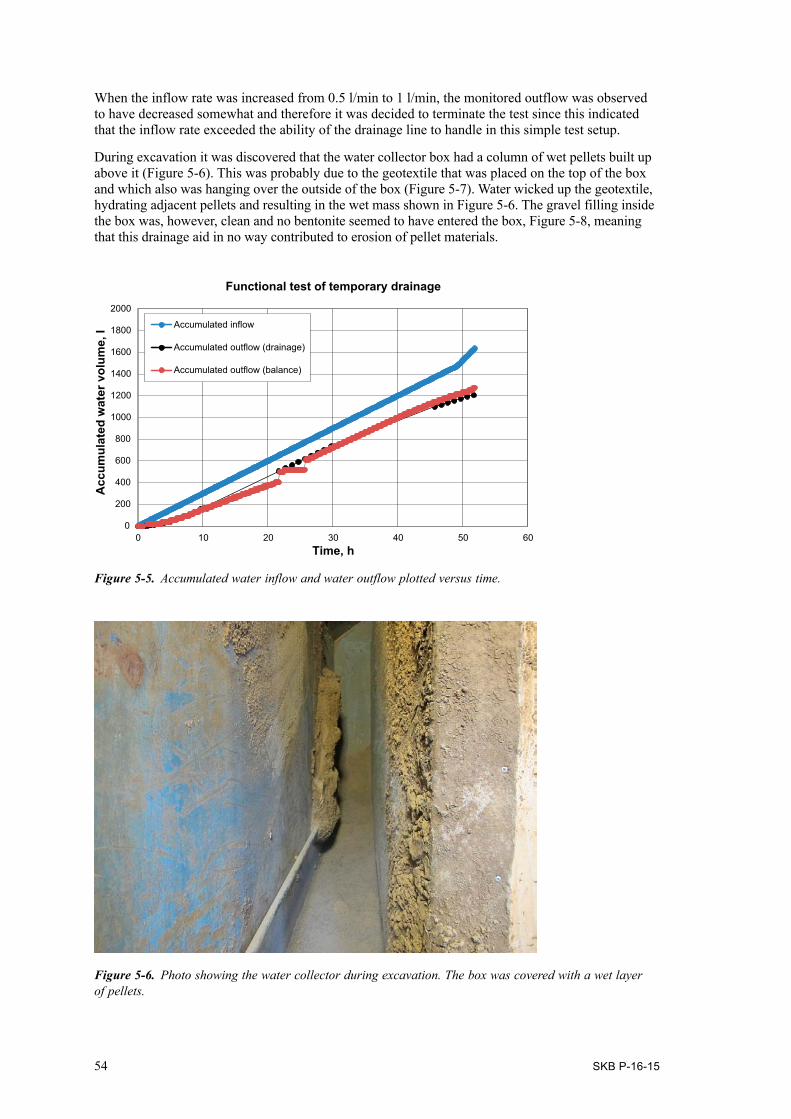
54 SKB P-16-15
Figure 5‑5. Accumulated water inflow and water outflow plotted versus time.
Figure 5‑6. Photo showing the water collector during excavation. The box was covered with a wet layer of pellets.
0
200
400
600
800
1000
1200
1400
1600
1800
2000
0 10 20 30 40 50 60Time, h
Acc
umul
ated
wat
er v
olum
e, l
Functional test of temporary drainage
Accumulated inflow
Accumulated outflow (drainage)
Accumulated outflow (balance)
When the inflow rate was increased from 0.5 l/min to 1 l/min, the monitored outflow was observed to have decreased somewhat and therefore it was decided to terminate the test since this indicated that the inflow rate exceeded the ability of the drainage line to handle in this simple test setup.
During excavation it was discovered that the water collector box had a column of wet pellets built up above it (Figure 5-6). This was probably due to the geotextile that was placed on the top of the box and which also was hanging over the outside of the box (Figure 5-7). Water wicked up the geotextile, hydrating adjacent pellets and resulting in the wet mass shown in Figure 5-6. The gravel filling inside the box was, however, clean and no bentonite seemed to have entered the box, Figure 5-8, meaning that this drainage aid in no way contributed to erosion of pellet materials.
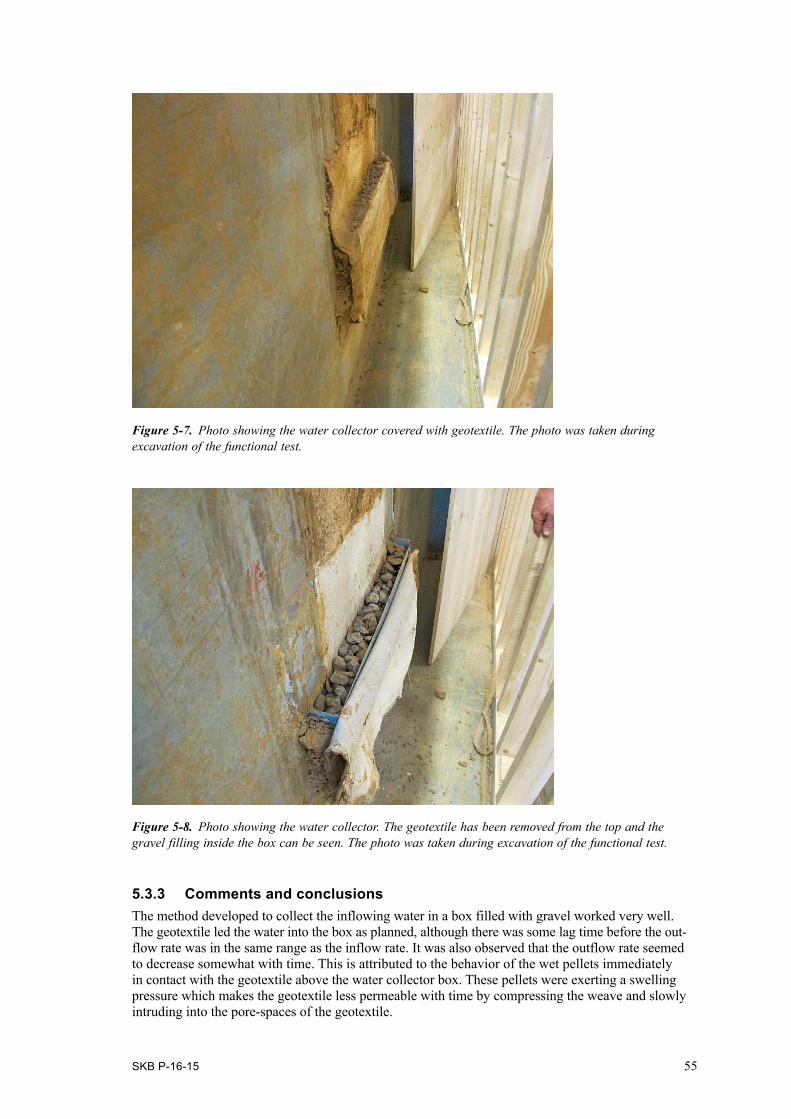
SKB P-16-15 55
Figure 5‑7. Photo showing the water collector covered with geotextile. The photo was taken during excavation of the functional test.
Figure 5‑8. Photo showing the water collector. The geotextile has been removed from the top and the gravel filling inside the box can be seen. The photo was taken during excavation of the functional test.
5.3.3 Comments and conclusionsThe method developed to collect the inflowing water in a box filled with gravel worked very well. The geotextile led the water into the box as planned, although there was some lag time before the out-flow rate was in the same range as the inflow rate. It was also observed that the outflow rate seemed to decrease somewhat with time. This is attributed to the behavior of the wet pellets immediately in contact with the geotextile above the water collector box. These pellets were exerting a swelling pressure which makes the geotextile less permeable with time by compressing the weave and slowly intruding into the pore-spaces of the geotextile.
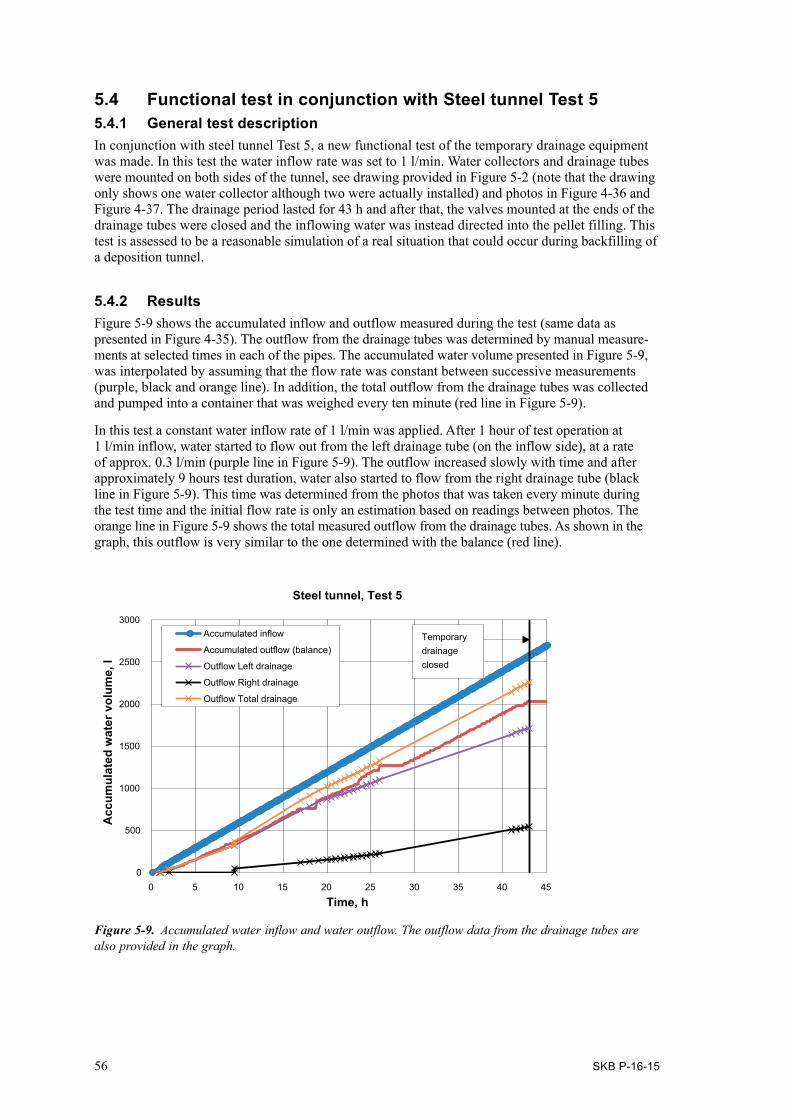
56 SKB P-16-15
5.4 Functional test in conjunction with Steel tunnel Test 55.4.1 General test descriptionIn conjunction with steel tunnel Test 5, a new functional test of the temporary drainage equipment was made. In this test the water inflow rate was set to 1 l/min. Water collectors and drainage tubes were mounted on both sides of the tunnel, see drawing provided in Figure 5-2 (note that the drawing only shows one water collector although two were actually installed) and photos in Figure 4-36 and Figure 4-37. The drainage period lasted for 43 h and after that, the valves mounted at the ends of the drainage tubes were closed and the inflowing water was instead directed into the pellet filling. This test is assessed to be a reasonable simulation of a real situation that could occur during backfilling of a deposition tunnel.
5.4.2 ResultsFigure 5-9 shows the accumulated inflow and outflow measured during the test (same data as presented in Figure 4-35). The outflow from the drainage tubes was determined by manual measure-ments at selected times in each of the pipes. The accumulated water volume presented in Figure 5-9, was interpolated by assuming that the flow rate was constant between successive measurements (purple, black and orange line). In addition, the total outflow from the drainage tubes was collected and pumped into a container that was weighed every ten minute (red line in Figure 5-9).
In this test a constant water inflow rate of 1 l/min was applied. After 1 hour of test operation at 1 l/min inflow, water started to flow out from the left drainage tube (on the inflow side), at a rate of approx. 0.3 l/min (purple line in Figure 5-9). The outflow increased slowly with time and after approximately 9 hours test duration, water also started to flow from the right drainage tube (black line in Figure 5-9). This time was determined from the photos that was taken every minute during the test time and the initial flow rate is only an estimation based on readings between photos. The orange line in Figure 5-9 shows the total measured outflow from the drainage tubes. As shown in the graph, this outflow is very similar to the one determined with the balance (red line).
Figure 5‑9. Accumulated water inflow and water outflow. The outflow data from the drainage tubes are also provided in the graph.
0
500
1000
1500
2000
2500
3000
0 5 10 15 20 25 30 35 40 45
Time, h
Acc
umul
ated
wat
er v
olum
e, l
Steel tunnel, Test 5
Accumulated inflow
Accumulated outflow (balance)Temporary drainage closedOutflow Left drainage
Outflow Right drainage
Outflow Total drainage

SKB P-16-15 57
5.4.3 Comments and conclusionsThe temporary drainage design worked very well in this test. The water supplied at the rather high inflow rate of 1 l/min was largely drained away through the water collector and the pipes during 43 hours of testing. The extra working time gained by this method of water control could in a real situation be very valuable in order to prevent water from reaching the backfill front. During 43 hours almost two new sections of backfill can be installed i.e. 12 meters.
The test also showed that at these rather high flow rates it will be favorable to install water collectors and drainage pipes on both sides of the tunnel.
5.5 Pipe removalThe force needed to retrieve the drainage pipes from the pellet filling has been calculated for two different cases:
1. Dry pellet filling. The drainage pipes are pulled out from a dry pellet filling. It is only the weight of the pellet filling that is acting on the drainage pipe.
2. Wet pellet filling. The drainage pipes are pulled out from a wet pellet filling where a swelling pressure has started to act on the drainage pipe.
5.5.1 Dry pellet fillingThe theoretical pressure, generated by a dry pellets filling in a slot has been calculated in two different ways:
1. As earth pressure at rest.
2. As silo pressure.
In the following calculations the theoretical lateral pressure has been evaluated according to Avén et al. (1984).
If the friction against the side walls is neglected the horizontal pressure can be evaluated according to Equation 5-1.
Earth pressure at restP0 = K0σv (Equation 5-1)
whereP0 = earth pressure at rest,K0 = pressure coefficient ≈ 1-sin φ (φ = internal angle of friction for the material). An angle of 36° has been used in the calculations (Glamheden et al. 2010).
σv = ρgz
whereg = constant of gravitation,ρ = density (ca 1 100 kg/m3),z = depth.
This gives a maximum pressure:
P0 (z = 5 m) ≈ 22 kPa
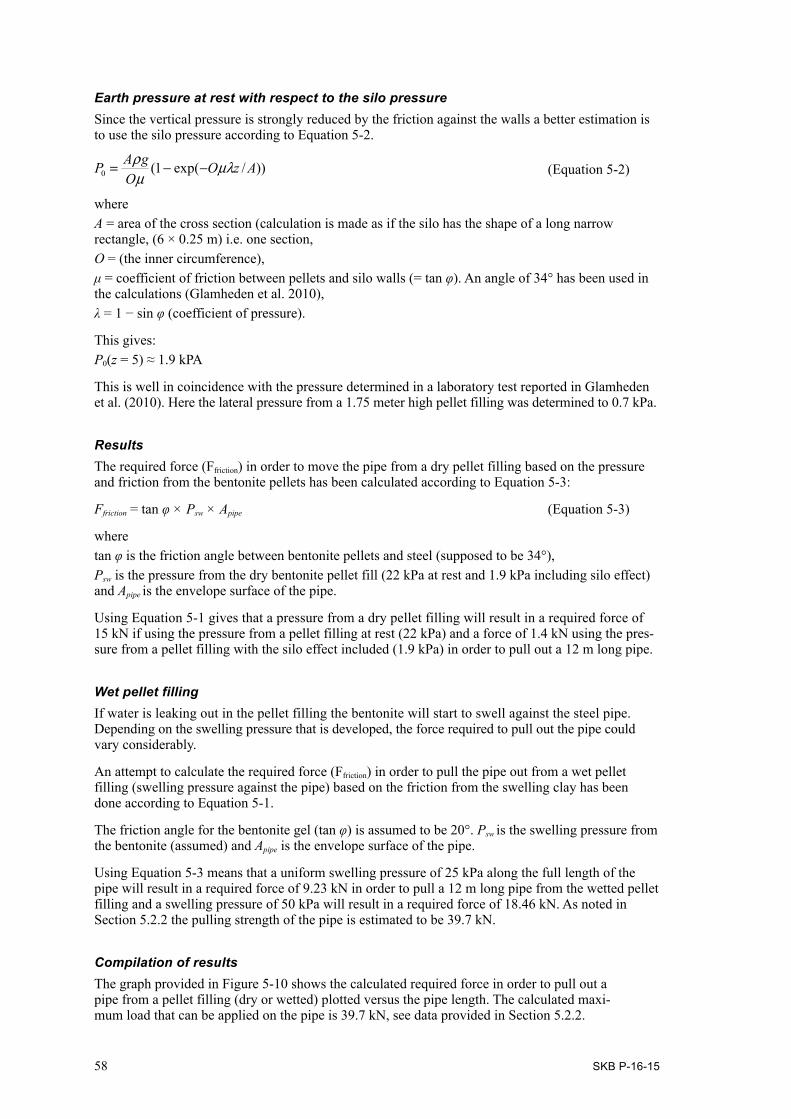
58 SKB P-16-15
Earth pressure at rest with respect to the silo pressureSince the vertical pressure is strongly reduced by the friction against the walls a better estimation is to use the silo pressure according to Equation 5-2.
))0 (1− exp(Oρg −Oµλz /AP = Aµ (Equation 5-2)
whereA = area of the cross section (calculation is made as if the silo has the shape of a long narrow rectangle, (6 × 0.25 m) i.e. one section,O = (the inner circumference),μ = coefficient of friction between pellets and silo walls (= tan φ). An angle of 34° has been used in the calculations (Glamheden et al. 2010), λ = 1 − sin φ (coefficient of pressure).
This gives:P0(z = 5) ≈ 1.9 kPA
This is well in coincidence with the pressure determined in a laboratory test reported in Glamheden et al. (2010). Here the lateral pressure from a 1.75 meter high pellet filling was determined to 0.7 kPa.
ResultsThe required force (Ffriction) in order to move the pipe from a dry pellet filling based on the pressure and friction from the bentonite pellets has been calculated according to Equation 5-3:
Ffriction = tan φ × Psw × Apipe (Equation 5-3)
wheretan φ is the friction angle between bentonite pellets and steel (supposed to be 34°), Psw is the pressure from the dry bentonite pellet fill (22 kPa at rest and 1.9 kPa including silo effect) and Apipe is the envelope surface of the pipe.
Using Equation 5-1 gives that a pressure from a dry pellet filling will result in a required force of 15 kN if using the pressure from a pellet filling at rest (22 kPa) and a force of 1.4 kN using the pres-sure from a pellet filling with the silo effect included (1.9 kPa) in order to pull out a 12 m long pipe.
Wet pellet fillingIf water is leaking out in the pellet filling the bentonite will start to swell against the steel pipe. Depending on the swelling pressure that is developed, the force required to pull out the pipe could vary considerably.
An attempt to calculate the required force (Ffriction) in order to pull the pipe out from a wet pellet filling (swelling pressure against the pipe) based on the friction from the swelling clay has been done according to Equation 5-1.
The friction angle for the bentonite gel (tan φ) is assumed to be 20°. Psw is the swelling pressure from the bentonite (assumed) and Apipe is the envelope surface of the pipe.
Using Equation 5-3 means that a uniform swelling pressure of 25 kPa along the full length of the pipe will result in a required force of 9.23 kN in order to pull a 12 m long pipe from the wetted pellet filling and a swelling pressure of 50 kPa will result in a required force of 18.46 kN. As noted in Section 5.2.2 the pulling strength of the pipe is estimated to be 39.7 kN.
Compilation of resultsThe graph provided in Figure 5-10 shows the calculated required force in order to pull out a pipe from a pellet filling (dry or wetted) plotted versus the pipe length. The calculated maxi-mum load that can be applied on the pipe is 39.7 kN, see data provided in Section 5.2.2.
SKB P-16-15 59
This should be compared to the maximum load needed if a 24 m long pipe should be pulled out from a wetted pellet filling (worst expected case since it is assessed that longer pipes will be impractical to handle), exerting a swelling pressure of 50 kPa, is 36.9 kN, still slightly below the nominal pull strength.
5.5.2 CommentsThe calculations provided above in Section 5.5.1 show that it should be possible to retrieve the drainage pipes if their maximum length is set to 24 meters. The required force can, however, be as high as 36 kN (50 kPa swelling pressure) which means that it will be necessary to use a mechanical means e.g. a vehicle to perform the pull.
The drainage pipe chosen as the reference size has an outer diameter of 26.9 mm i.e. it is rather small. This means that if the pipe is pulled out from a dry pellet filling, the remaining volume after the pipe will almost immediately be filled with pellets. However, in sections where the pipe pass through wet pellets there will probably be a remaining empty space but it is expected that this will soon be filled by swelling bentonite. This is however a topic that requires investigation to confirm.
5.6 Comments and conclusionsThe tests performed have shown that the suggested design for a temporary drainage of a water bearing fracture zone works very well. In both tests there was a short delay before water starts to flow out through the drainage pipe. This depends probably on the fact that the pellets closest to the inflow point is wetted in the beginning of the test, but as the wetting proceeds, the bentonite swells and seals the geotextile-pellet contact. The result is that the flow resistance across this contact increases, which means that it is easier for the water to flow through the geotextile into the water collector and further out through the drainage pipe.
It is required from a long term safety point of view that the design allows for retrieval of the drain-age pipe since it is not allowed to have a highly conductive zone along the deposition tunnel. The maximum length of a drainage pipe that could be retrieved is estimated to be 24 meters (An SKB deposition tunnel, includes that in average 5.5 m3 pellets will be installed every meter. A porosity of approximately 45 % gives an available macro void volume of 2.5 m3. In practice, only parts of this
Figure 5‑10. The required force to pull out a pipe from a pellet filling plotted versus the pipe length.
0
5
10
15
20
25
30
35
40
45
0 5 10 15 20 25 30
Forc
e, k
N
Pipe length, m
Maximum load on pipe (yield limit 200 MPa)
Dry pellets (rest)
Dry pellets (silo effect)
Wet pellets (25 kPa)
Wet pellets (50 kPa)

60 SKB P-16-15
theoretical volume are used for water storage since the bentonite swell and seal and thereby prevent flow in all directions). With this length it should be possible to retrieve the pipe without risking any rupture of the pipe. It is judged that the drainage pipe could be reused several time after having performed a check of the joints. The pipe can be pulled out from the adapter (O-ring seal around the outside of the drainage pipe). The water collector box including pipe adapter must, however, be left in the repository. The amount of steel introduced by the collection box is very small, approximately 4.4 kg for one box with a length of 1.0 m.
SKB P-16-15 61
References
SKB’s (Svensk Kärnbränslehantering AB) publications can be found at www.skb.com/publications.
Andersson L, Sandén T, 2012. Optimization of backfill pellet properties. ÅSKAR DP2. Laboratory tests. SKB R-12-18, Svensk Kärnbränslehantering AB.
Avén S, Stål T, Wedel P O (eds), 1984. Handboken Bygg. G, Geoteknik. Stockholm: Liber Förlag. (In Swedish.)
Glamheden R, Fälth B, Jacobsson L, Harrström J, Berglund J, Bergkvist L, 2010. Counterforce applied to prevent spalling. SKB TR-10-37, Svensk Kärnbränslehantering AB.
Hartley L, Hoek J, Swan D, Roberts D, 2010. Hydrological discrete fracture network modelling of groundwater flow under open repository conditions. Posiva Working Report 2010-51, Posiva Oy, Finland.
Joyce S, Swan D, Hartley L, 2013. Calculation of open repository inflows for Forsmark. SKB R-13-21, Svensk Kärnbränslehantering AB.
Koskinen V, Sandén T, 2014. System design of backfill. Distribution of inflowing water by using geotextile. SKB R-14-10, Svensk Kärnbränslehantering AB.
Sandén T, Börgesson L, 2014. System design of backfill. Methods for water handling. SKB R-14-09, Svensk Kärnbräsnlehantering AB.

SVENSK KÄRNBRÄNSLEHANTERING
Arkite
ktkop
ia AB
, Bro
mm
a, 20
18
SKB is responsible for managing spent nuclear fuel and radioactive
waste produced by the Swedish nuclear power plants such that man
and the environment are protected in the near and distant future.
skb.se