geothermal development in kenya - climate … · geothermal development in kenya ... philippines...
TRANSCRIPT
GEOTHERMAL DEVELOPMENT IN
KENYA
Presented by
Cyrus Karingithi
Asst Manager Resource Development
SREP SUB COMMITTEE VISIT – 10th
March 2012

1
Introduction
Geothermal energy utilizes natural
steam from the earth
Geothermal electricity generation
in OlkariaTotal installed capacity - 202 MW
KenGen Operates two power
plantsOlkaria I - 45 MWe
Olkaria II - 105 MWe additional
Plannned; Install 280 MWe at Olkaria I and IV
Wellhead Generation – 5 MW under
construction
IPPs generate 52 MW at Olkaria
JOH-KGN001-20070825-JvW-P1
2
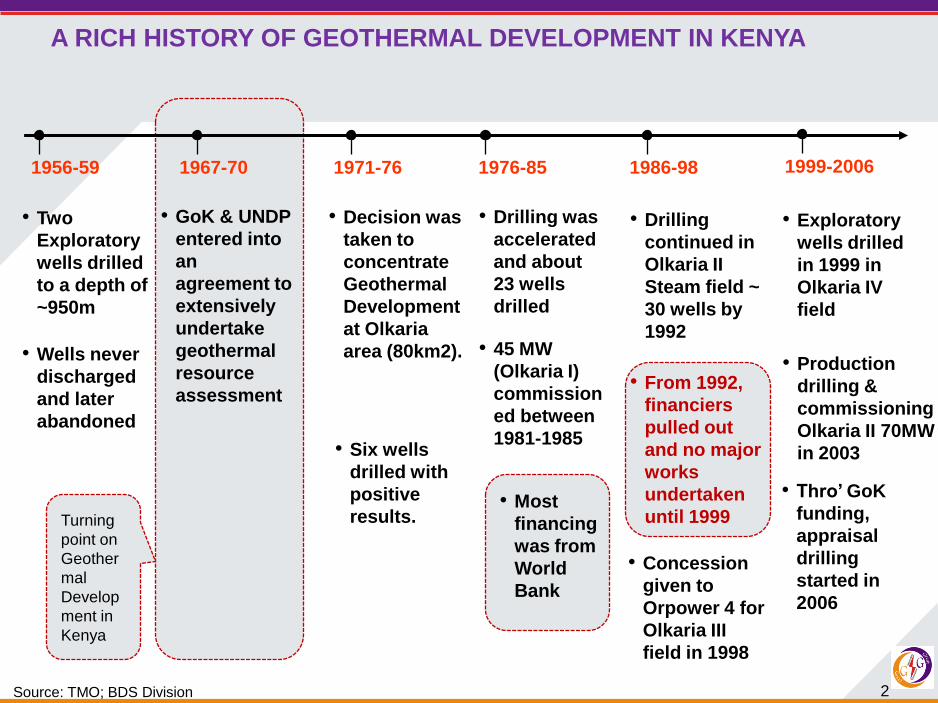
A RICH HISTORY OF GEOTHERMAL DEVELOPMENT IN KENYA
Source: TMO; BDS Division
1956-59 1967-70 1971-76 1976-85 1986-98
• Two
Exploratory
wells drilled
to a depth of
~950m
• GoK & UNDP
entered into
an
agreement to
extensively
undertake
geothermal
resource
assessment
• Wells never
discharged
and later
abandoned
1999-2006
Turning
point on
Geother
mal
Develop
ment in
Kenya
• Six wells
drilled with
positive
results.
• Decision was
taken to
concentrate
Geothermal
Development
at Olkaria
area (80km2).
• Drilling was
accelerated
and about
23 wells
drilled
• 45 MW
(Olkaria I)
commission
ed between
1981-1985
• Most
financing
was from
World
Bank
• Drilling
continued in
Olkaria II
Steam field ~
30 wells by
1992
• From 1992,
financiers
pulled out
and no major
works
undertaken
until 1999
• Exploratory
wells drilled
in 1999 in
Olkaria IV
field
• Production
drilling &
commissioning
Olkaria II 70MW
in 2003
• Thro‟ GoK
funding,
appraisal
drilling
started in
2006
• Concession
given to
Orpower 4 for
Olkaria III
field in 1998

3
GEOTHERMAL DEVELOPMENT IN KENYA
Source: KenGen;
2007 - date
• Production drilling
started in Olkaria I&IV
(over 50 wells drilled ~
300MWe)
• Olkaria I&IV 280MW
planned for 2014
• GDC formed in 2009
and drilling in
Menengai field
started in 2011
• Olkaria II 3rd Unit
35MW commissioned
The balance has been
contributed by Government
of Kenya, UNDP and KenGen
Olkaria I
(45MW)
[1981-85]
Olkaria II
(70MW)
[2003]
Olkaria II
3rd Unit
(35MW)
[2010] Total
IDA (US$ 'm) 118 108 29 255
EIB (US$ 'm) 8.8 39 50 98
KfW (US$ 'm) 11 12 - 23
CDC(£ 'm) 15.5 - - 15.5
AfD (US$ 'm) - - 28 28
Power plant
~US$ 61m
•Olkaria Optimization
study

4
Ministry of Energy (MoE)
(responsible for policy matters)
Generation functionTransmission and
Distribution function
UETCL Imports
(<1%)
* - KenGen manages the Emergency Power Project (EPP) on behalf of the GoK
** - More Independent Power Producers (IPPs) expected in thermal, wind , solar and geothermal
*** - GDC is 100% owned by GoK to drill geothermal wells in Kenya’s Rift Valley
IPPs **
(22% Inst. Cap)
Thermal
(187MW)
Geothermal
(48 MW)
EPP *
(250 MW)
KenGen
(78% Inst. Cap.)
Hydro
(761 MW)
Thermal
(259 MW)Wind
(5.3 MW)
Geothermal
(150 MW)
70% GoK &
30% Public
Energy Regulatory Commission(ERC)(responsible for regulating the entire energy sector)
KENYA POWER SUB-SECTOR –YEAR 2010 (REFORMS STARTED
IN 1996)
Other IPPs
expected
Pursuant to Energy Act 2006, a
Geothermal Development
Company (GDC)*** was
established in 2009 to
accelerate geothermal
development – geothermal is
the future base-load source of
electricity for Kenya
Generation function
was separated from
transmission and
distribution
Source: KenGen;

5
Ministry of Energy (MoE)
(responsible for policy matters)
Generation function Transmission and
Distribution function
* - KETRACO is a 100% owned by GoK and will implement all new transmission lines.
** - KPLC will retain the existing transmission network and remain a single buyer for sometime before further unbundling
*** - REA was established to accelerate rural electrification and works with KPLC in implementing the rural programme
Energy Regulatory Commission(ERC)(responsible for regulating the entire energy
sector)
KENYA POWER SUB-SECTOR –YEAR 2010 (REFORMS STARTED
IN 1996)
Kenya Electricity Transmission Company
(KETRACO)* has been established to expand
transmission infrastructure before unbundling
transmission and distribution functions
Generation function
was separated from
transmission and
distribution
KPLC**
RETAIL CUSTOMERS
Rural Electrification
Authority (REA)***
Source: KenGen;

6
Peak Demand (MW)
Source: Update of Kenya’s Least Cost Power Development Plan 2010-2030
Significant Kenya‟s generation
potential exist
Kenya has significant natural
power potential in form of :
(i) Geothermal(~ 7,000MW);
(ii) Hydro (~1,500MW);
(iii) Wind (~4,400 MW); and
(iv) Potentially Coal and Gas.
Vision 2030 ~
15,000MW
In 2018 Kenya must have at
least 30-35 % electricity
penetration to reach the
Vision 2030 target
Vision 2030 demand
Forecast of 8-10 %
NATIONAL PEAK DEMAND FORECAST – 2010 to 2030
1,482
3,141
4,659
8,226
12,141
17,764
1,2782,038
3,474
6,768
10,097
15,066
0
2,000
4,000
6,000
8,000
10,000
12,000
14,000
16,000
18,000
20,000
20
10
20
11
20
12
20
13
20
14
20
15
20
16
20
17
20
18
20
19
20
20
20
21
20
22
20
23
20
24
20
25
20
26
20
27
20
28
20
29
20
30
Total Capacity (MW)
Peak Demand (MW)
2026/272018/19 2029/302023/242014/152009/10
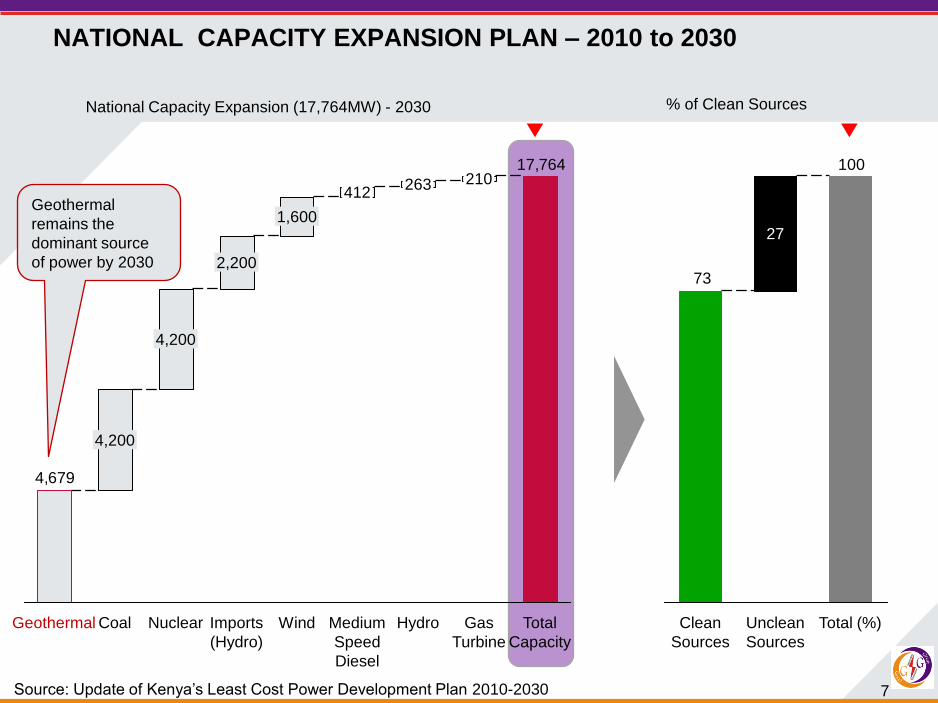
7Source: Update of Kenya’s Least Cost Power Development Plan 2010-2030
NATIONAL CAPACITY EXPANSION PLAN – 2010 to 2030
17,764
4,679
Total
Capacity
Gas
Turbine
210
Hydro
263
Medium
Speed
Diesel
412
Wind
1,600
Imports
(Hydro)
2,200
Nuclear
4,200
Coal
4,200
Geothermal
100
73
Total (%)Unclean
Sources
27
Clean
Sources
Geothermal
remains the
dominant source
of power by 2030
National Capacity Expansion (17,764MW) - 2030 % of Clean Sources
8
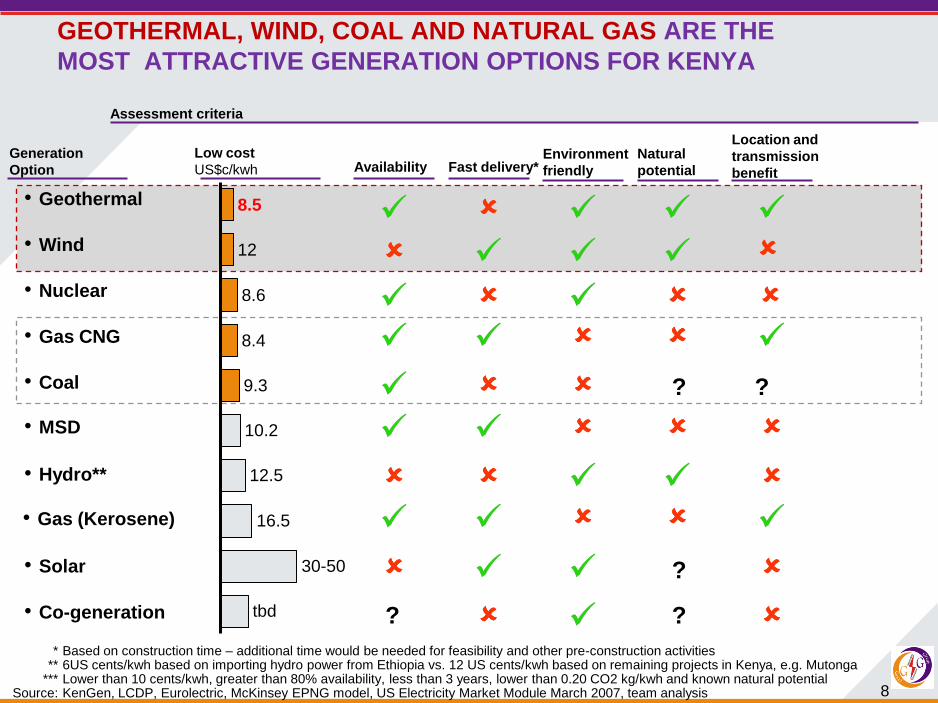
GEOTHERMAL, WIND, COAL AND NATURAL GAS ARE THE
MOST ATTRACTIVE GENERATION OPTIONS FOR KENYA
* Based on construction time – additional time would be needed for feasibility and other pre-construction activities ** 6US cents/kwh based on importing hydro power from Ethiopia vs. 12 US cents/kwh based on remaining projects in Kenya, e.g. Mutonga
*** Lower than 10 cents/kwh, greater than 80% availability, less than 3 years, lower than 0.20 CO2 kg/kwh and known natural potential Source: KenGen, LCDP, Eurolectric, McKinsey EPNG model, US Electricity Market Module March 2007, team analysis
• Wind
• Coal
• MSD
• Nuclear
• Gas CNG
• Hydro**
• Gas (Kerosene)
• Solar
• Co-generation
12.5
10.2
tbd
16.5
30-50
9.3
8.4
8.6
12
8.5
Assessment criteria
Generation
Option
Low cost
US$c/kwh Availability Fast delivery*Environment
friendly
Natural
potential
• Geothermal
Location and
transmission
benefit
? ?
?
??

9
Benefits of Geothermal Energy
• Indigenous resource
• Provides clean and safe energy using little
land
• Is renewable and sustainable
• Generates continuous, reliable “base load”
power
• Conserves fossil fuels and contributes to
diversity in energy sources
• Offers modular, incremental development and
village power to remote sites

JOH-KGN001-20070825-JvW-P1
World Wide Development
Geothermal Energy
Development and technology

11
WHAT IS GEOTHERMAL?
Geothermal is energy from the Earth‟s interior!

12
High Potential Geothermal Areas
13
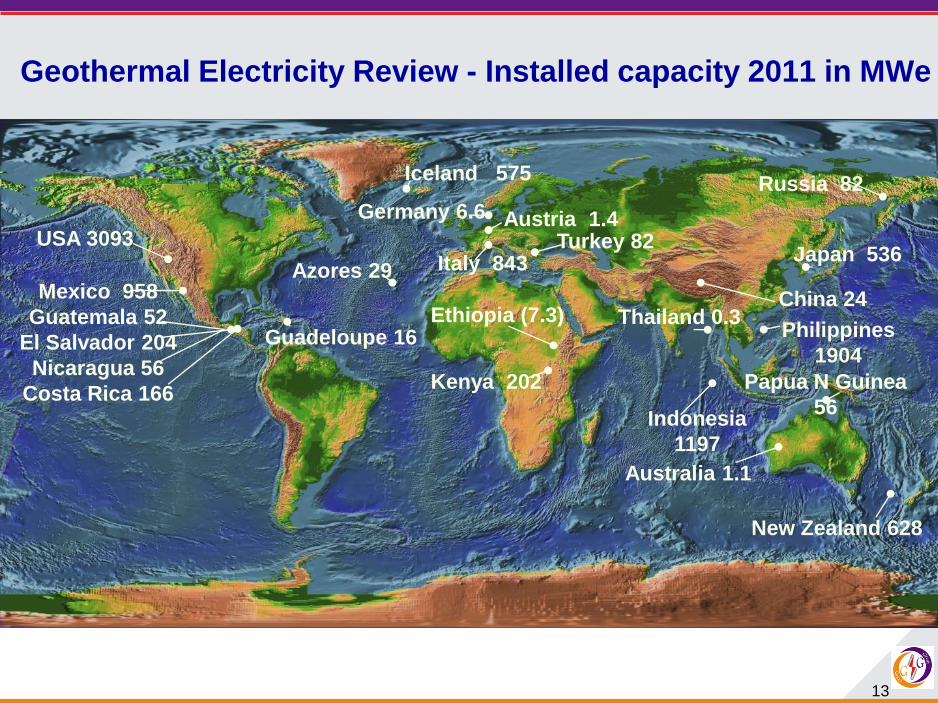
Geothermal Electricity Review - Installed capacity 2011 in MWe
Kenya 202
Mexico 958
Guatemala 52
El Salvador 204
Nicaragua 56
Costa Rica 166
China 24
Russia 82
Philippines
1904
Indonesia
1197
Turkey 82
New Zealand 628
Thailand 0.3
USA 3093
Ethiopia (7.3)
Italy 843
Iceland 575
Azores 29Japan 536
Australia 1.1
Guadeloupe 16
Austria 1.4Germany 6.6
Papua N Guinea
56

14

15
Geothermal Development Stages
Stage I: Planning and logistics
Stage II: Surface exploration
Stage III: Exploratory drilling
Stage IV: Appraisal drilling and feasibility Studies
Stage V: Production drilling and power plan construction
Stage VI: Power Generation & Reservoir and steamfield
Management

16
Geothermal Well Drilling Profiles
Well Programme
Deep drilling to 3000m
Production casing shoe 500
-1200m
Average depth Olkaria I =
1200
Average Depth Olkaria II =
2200m
Current average Depth
3000m (Directional &
Vertical)
Reservoir bottom not yet
reached
JOH-KGN001-20070825-JvW-P1

17
Geothermal Manifestations (indicators)
Sulfur
Hot Springs
Hot Ground
Geysers
Fumaroles

Geothermal Baseload Strategy
JOH-KGN001-20070825-JvW-P1
KENGEN‟S STRATEGIC PLANS
2008-2018
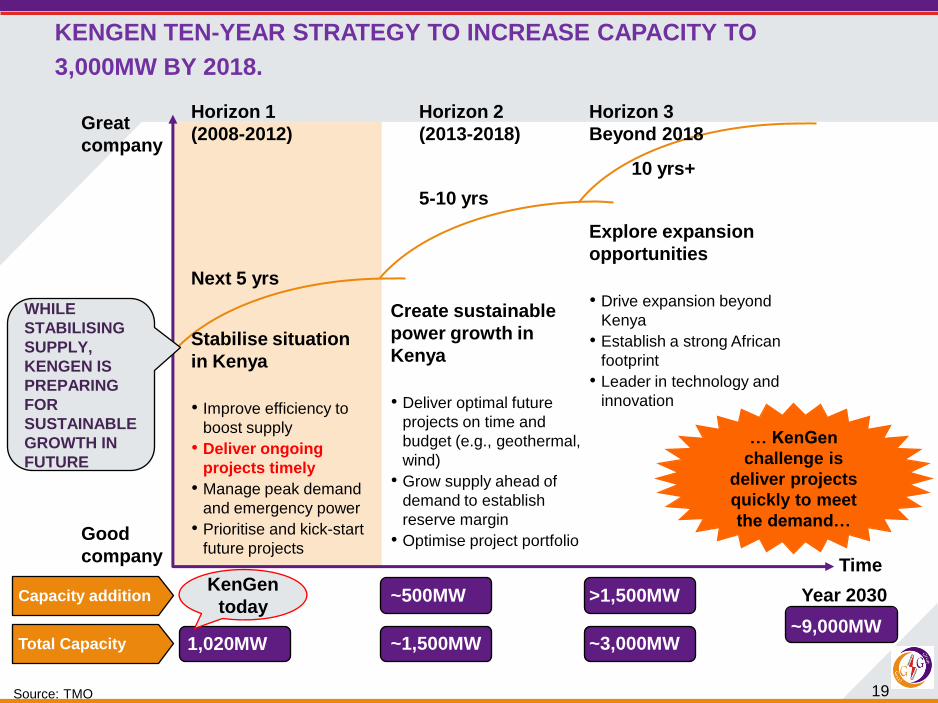
19Source: TMO
KENGEN TEN-YEAR STRATEGY TO INCREASE CAPACITY TO
3,000MW BY 2018.
5-10 yrs
Create sustainable
power growth in
Kenya
• Deliver optimal future
projects on time and
budget (e.g., geothermal,
wind)
• Grow supply ahead of
demand to establish
reserve margin
• Optimise project portfolio
Horizon 2
(2013-2018)
~500MW
~1,500MW
Good
company
Great
company
Next 5 yrs
Stabilise situation
in Kenya
• Improve efficiency to
boost supply
• Deliver ongoing
projects timely
• Manage peak demand
and emergency power
• Prioritise and kick-start
future projectsTime
Horizon 1
(2008-2012)
Capacity addition
Total Capacity 1,020MW
KenGen
today
WHILE
STABILISING
SUPPLY,
KENGEN IS
PREPARING
FOR
SUSTAINABLE
GROWTH IN
FUTURE
~9,000MW
Year 2030
10 yrs+
Explore expansion
opportunities
• Drive expansion beyond
Kenya
• Establish a strong African
footprint
• Leader in technology and
innovation
Horizon 3
Beyond 2018
>1,500MW
~3,000MW
… KenGen
challenge is
deliver projects
quickly to meet
the demand…

20
Horizon 1: > 500MW
H-1
…HORIZON I CAPACITY EXPANSION PROJECTS…
•Geothermal~318MW
• Thermal ~120MW
• Hydro ~157MW
• Wind ~ 20MW
2014
2012
2011
2010
2009Tana ~20MW
Kiambere ~12MW
Sondu ~60MW
Ngong Wind ~ 5MW
Kiambere ~12MW
2013Kindaruma ~32MW
Kipevu III ~120MW
Olkaria II 3rdUnit ~35MW
Eburru ~2.5MW
Raising Masinga ~81GWh
Ngong Wind ~15MW
Olkaria IV ~140MW
Olkaria I ~140MW
Wind ~50MW
Coal Plant ~600MW
1022 MW
Sang‟oro ~21MW
Total in the next 5 years ~
615MW
Estimated
project cost is
~US$ 1.68 billion
Early Generation Strategy –Install Wellhead Generators
Olkaria I and IV = 75 MW 2010/2011

21
Geothermal Expansion
H-2
…OUR PLANNED HORIZON II CAPACITY EXPANSION
PROJECTS…
140
160
2013
1402014
140 602014
140 1002015
140 150 2902016
2802017
2802018
1 260 1 570150Additional
Capacity
2018
Menengai I
Menengai II
Menengai III
Karura Hydro
Menengai IV
Marsabit wind
Menengai IV
Mombasa Coal *
& CNG
Longonot I & II
North Rift I & II
Horizon 2 project capacity
MW
Mombasa CNG
provide for the
possibility of Kenya
discovering Natural
Gas
Geothermal
Wind & Hydro
Thermal (Gas/Coal)
A 600 MW coal plant is planned by
2013/14 to provide breathing space for
the geothermal ramp up
OLKARIA 560 MW -75 MW wellhead Generators – 2012/13
-Olkaria IV expansion - U 3,4,5 =265 MW
by 2016
--Olkaria I U6 = 85 MW - 2014
-- Olkaria V = 140 MW - 2016

22
OUR GENERATION MIX TODAY TO MEET DEMAND
Hydro
Thermal
Geothermal
Wind
KenGen
Capacity
Mix 2010
68.0%
18.0%
13.5%
0.5%
Gearing-up to
transform from
hydro to
geothermal
150
139
1,115
761
Hydro TotalEPPThermal
60
WindGeothermal
5
KenGen is managing the
60MW Emergency Power
Project on behalf of GoK

23
2003
2004
2005
2006
2007
2008
2004
2010
BY 2018 WE ENVISION A GREEN KENGEN EARNING CARBON
CREDITS
75
45
28
5
0
10
20
30
40
50
60
70
80
90
100
Hydro
Thermal
Geothermal
Wind
2018
18
49
2013
30
24
1
2009
14
11
1
… the target is a
green KenGen
by 2018 with
49%
geothermal. A
strategic shift for
the better with
stable revenue
base…
% share of generation modes
2018
2009
3,189MW1,020MWExpected CER eq
= 5.24 m

24
Early Generation Strategy:
Installation of Wellhead Generators
• Concept; –to utilize existing wells before construction of main
plants = Early revenue
–Use makeup wells for early generation = Early revenue
–Use of wells that cannot be connected to main steam
system due to low/high pressure = maximize output
• KenGen intends to install 15 wellhead generators
= 75 MW
• Pilot plant already under construction
• Currently Going to tender for more generator
options??
JOH-KGN001-20070825-JvW-P1

• Power Generation
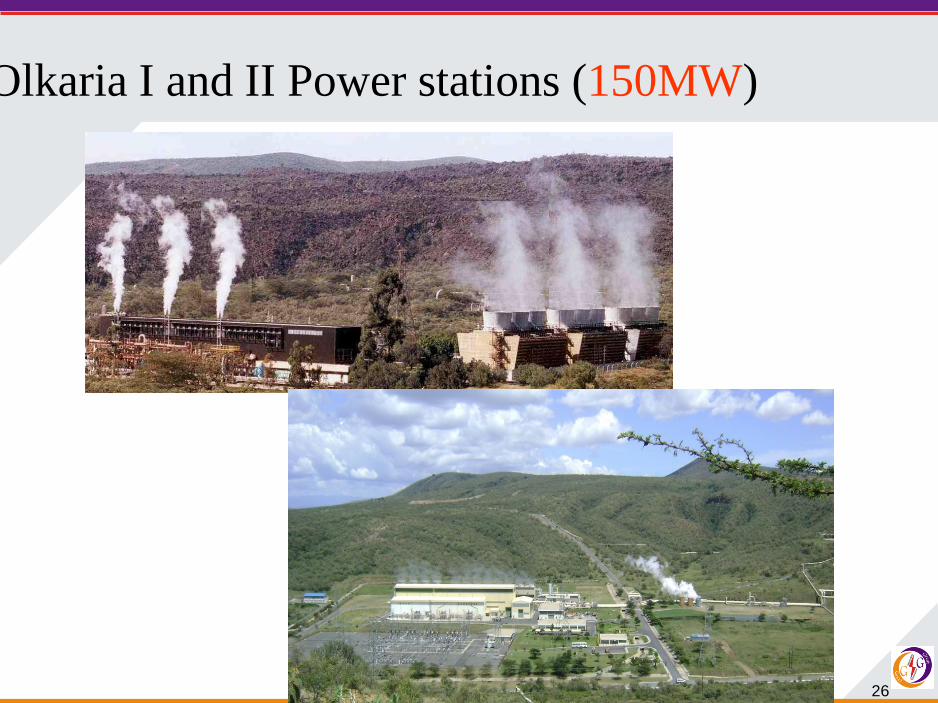
26
Olkaria I and II Power stations (150MW)

27
Condensing Flash Steam Plant
(Olkaria I & II)
PRODUCTIONWELL
GA
S E
XT
RA
CT
OR
COOLING TOWERS
CHF
IntermediateTemperature
Cold Surface Water
Surface Rock
High TemperatureReservoir
GASES
CONDENSER
HOT CONDENSATE
PUMP
PUMP
TURBINEGENERATOR
SEPARATOR
WATER
STEAM
MAIN STEAM
COOLEDCCONDENSATE
STEAM FROMOTHER WELLS
FLOW DIAGRAM
POWER TRANSMISSION(TO NATIONAL GRID)
GENERATED ELECTRICITY
CHF
Intermediate
Temperature
Cold Surface Water
Surface Rock
High TemperatureReservoir
CHF
Intermediate
Temperature
Cold Surface Water
Surface Rock
High Temperature
Reservoir
RE-INJECTIONWELL
RE-INJECTIONWELL
STATIONTRANSFORMER

28
Condensing Steam Power Plant
TurbineGenerator
SteamCondensed
Steam (Water)
Electricity
Steam

29
Binary vapor outto turbine
Hot geothermalwater in from
production well
Geothermal water out to injection well
Binary liquid infrom condenser
Binary Cycle Power Plant:
Heat Exchanger

JOH-KGN001-20070825-JvW-P1
World Wide Development
GEOTHERMAL DEVELOPMENT
Kenya‟s Potential

31
Kenya‟s Geothermal Potential
Geothermal potential areas
(>20 fields > 7,000 MW)
within Kenya Rift.
Current installed geothermalpower: KenGen 150 MW
IPP‟s 52 MW.
Planned 280 MW
Only a small fraction of theestimated resource potentialhas been developed.
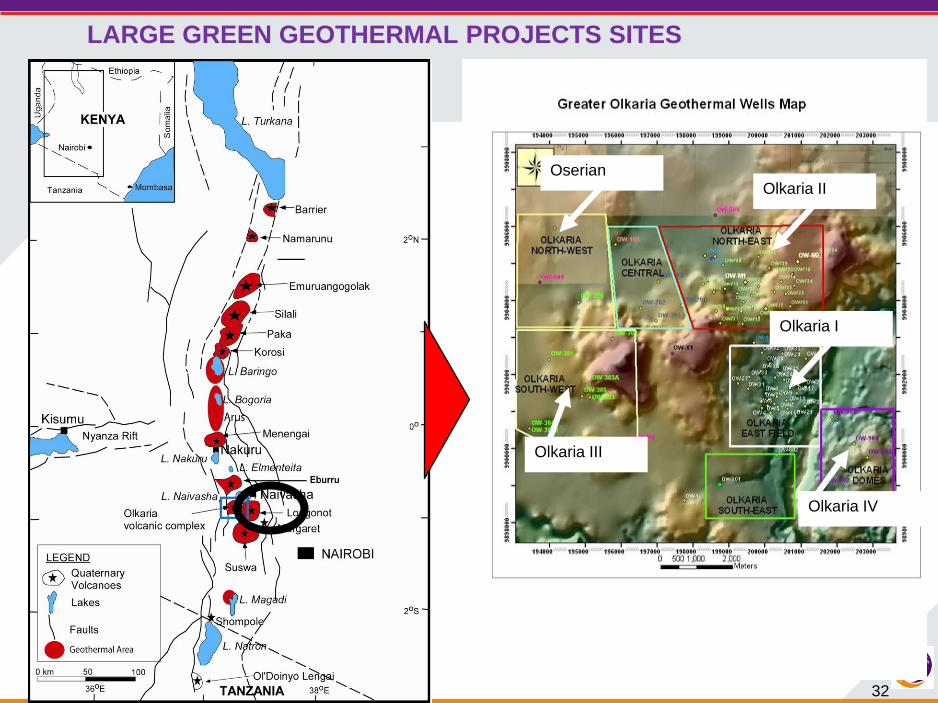
32
LARGE GREEN GEOTHERMAL PROJECTS SITES
Olkaria II
Olkaria I
Olkaria IV
Olkaria III
Oserian
•
280 MW Olkaria I and IV
Development
KENYA ELECTRICITY EXPANSION PROJECT (KEEP)

34
FINANCING PLAN FOR OLKARIA I & IV 280MW
Million US$
Items GOK KenGen JICA WB AFD EIB KfW TTL
Drilling Costs 313 15 328
Steam fields 7 107 54 168
Power Plant 35 323 210 135 703
Substation &
Transmission 3.4 31.6 35
Consulting
Services 30 30
Admin 29 12 41
Resettlement
Action Plan 10 10
BoC 1 1
IDC 57 57
TOTAL 316.4 138 323 120 210 166.6 99 1,373
1 Euro = 1.4 US$
1 US$=KES76.5=JPY.91.5
Exchange Rate

35
Over 100% of steam available
at wellhead – 168 MW (tested
wells)
Drilling ongoing with hired rigs
(3 GDC rigs & 1 Hired) together
with KenGen N370 rig and 2
new KenGen Rigs
Well testing in progress for the
drilled wells
Olkaria IV Project
Over 100% of the required
steam already available –
194 MW (tested wells)
Well testing ongoing for the
remainder of the drilled wells
Re-injection well drilling to
be drilled by August 2012
Olkaria I Unit 4&5 Project
280MW PROJECT: DRILLING STATUS

36
280MW Project: PROJECT MANAGEMENT STRUCTURE
Lot A
Lot B1
Lot B2
Lot C

37
Lot A
Component
Steam Field Development
Financier
IDA
KfW
KenGen
Lot CHigh Voltage Substations &
Transmission Lines
EIB
GoK/KenGen
280MW Project : PROJECT INTERNATIONAL LOTS
ConsultancyKfW
KenGen
Lot B
Olkaria I – Unit 4 & 5 (2x70 =
140MW)
JICA
KenGenLot B1
Lot B2Olkaria IV (2 or 3 Units a total
of >140MW)
AfD
EIB
KenGen
Lots

38
FINANCING PLAN OF OLKARIA I&IV 280MW – AFTER LOT B
EVALUATION
Euro = 1.4 US$; US$=KES 76.5 = JPY 91.5
Exchange Rate
Source: KenGen;
US$ „millionFinancing Breakdown
Olkaria I
(140MW)
Olkaria IV
(140MW) Total GoK KenGen IDA JICA KFW EIB AFD
Total
Funds
Drilling Costs 142 186 328 313 15 328
Steam Field 100 68 168 7 107 54 168
Power Plant 201 194 395 201 76 118 395
Substation &
Transmission 22 13 35 3 32 35
Consultancy 16 14 30 30 30
Administration 20 21 41 29 12 41
Resettlement Action
Plan - 10 10 10 10
Board of Consultants 1 1 1 1 1
IDC 24 33 57 57 57
Total 526 540 1,065 316 103 120 201 99 108 118 1,065
39
1
2
Status
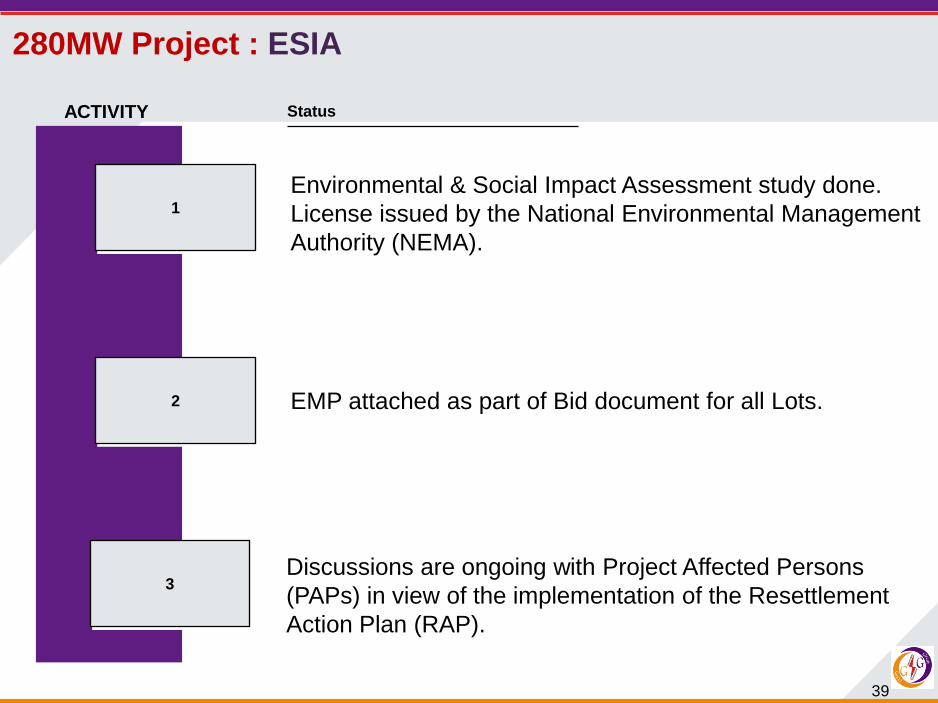
Environmental & Social Impact Assessment study done.
License issued by the National Environmental Management
Authority (NEMA).
ACTIVITY
280MW Project : ESIA
EMP attached as part of Bid document for all Lots.
3Discussions are ongoing with Project Affected Persons
(PAPs) in view of the implementation of the Resettlement
Action Plan (RAP).

40
2009 2010 2011 2012 2013 2014
01.06.2009 - 02.01.20101. Procure Consultant
30.06.2011
09.08.20113. Procurement of Contractors
31.12.20124. Local infrastructure (roads, water, electricity)
01.03.20125. Drill balance of Olkaria IV wells
30.06.2012
2. Project Design & Tender
6. Drill balance of Olkaria I Unit 4&5 Wells
30.04.20147. Build Olkaria IV Unit 1
& Olkaria I Unit 4
30.04.20148. Build Olkaria IV Unit 2
& Olkaria I Unit 5
Activity
10th Aug 2011
GEOTHERMAL DEVELOPMENT IN KENYA – THE NEXT BIG
PROJECT FOR US – OLKARIA I&IV 280MW (TIMELINES)

Olkaria 560 MW Development
Olkaria Optimized Development

42
Olkaria Expansion – 560 MW
Olkaria Optimization –Current licence area =
204 Km2
Area under utilization by
2013 ( after 280MW) = 24
sq km
Propose to develop
additional 560 MW Update conceptual model
Update Reservoir Model
Optimization study
ESIA study
JOH-KGN001-20070825-JvW-P1
Estimated Resource Size = 80 km2
~ 1,200 MW

43
JOH-KGN001-20070825-JvW-P1
Completion and submission of reports
Months Start Finish Dura tion 0
Inception report - -
Revised conceptual model. - -
Short report on results of volumetric assessment and lumped
parameter modelling
Preliminary assessment of the electrical generating capacity
of greater Olkaria geothermal system
Report on the numerical model and model predictions. - -
Report on field development plan. - -
Short report on evaluation of physical constraints
Report on feasibility study for stabilizing power generation
with an optimized capacity of the existing plants and
environmetal project report - -
Report on feasibility study of additional generating units and
environmetal project report - -
Final reports - -
116 7 8 9 101 2 3 4 5
Optimization Study 2011 Schedule
44
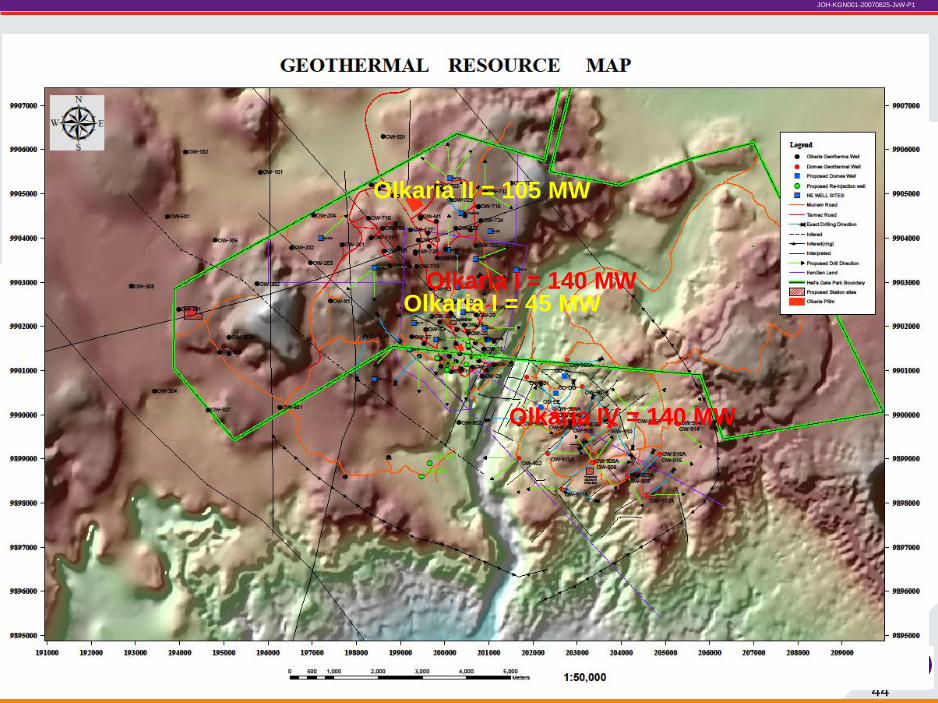
JOH-KGN001-20070825-JvW-P1
Olkaria II = 105 MW
Olkaria IV = 140 MW
Olkaria I = 45 MWOlkaria I = 140 MW

45
GRD MAJOR PROJECTS & DUE DATES
Plant Capacity, MW Due date
Eburru 25 2014
Olkaria IV (units 3, 4 & 5) 240 2015
Olkaria I (unit 6 70 2016
Olkaria V 110 2016
Olkaria II Unit 4 & 5 140 2017
Total 585 2017
JOH-KGN001-20070825-JvW-P1

46
DRILLING PLAN
JOH-KGN001-20070825-JvW-P1
The plan requires 3 Kengen Rigs and 3 hired rigs to be actualized
Eburru to be drilled first to get returns earlier
KenGen Rig 1 & 2 have rigged up
PLANT Proj. Mwe 2011/12 2012/13 2013/14 2014/15 2015/16 2016/17 2017/18 Balance WELLS
280 MW Development
Olkaria IV Unit 1 & 22
80
M
W
140 2 Comm 2
Olkaria I Unit 4 & 5 140 19 Comm 19545 MW Development
Eburru 25
M
W
25 5 2 Comm 7Olkaria IV Unit 3 (Wellhead)
52
0 M
We
75 4 18 Comm 22Olkaria IV Unit 4 & 5 165 6 24 18 Comm 48Olkaria I unit 6 70 3 8 10 Comm 17Olkaria V 110 3 13 17 Comm 33Olkaria II Unit 4 & 5 100 6 12 13 Comm 41Menengai I 400 Comm Total 1262 18 25 30 36 42 42 33
No of Rig required 3 5 6 6 7 7 6
47
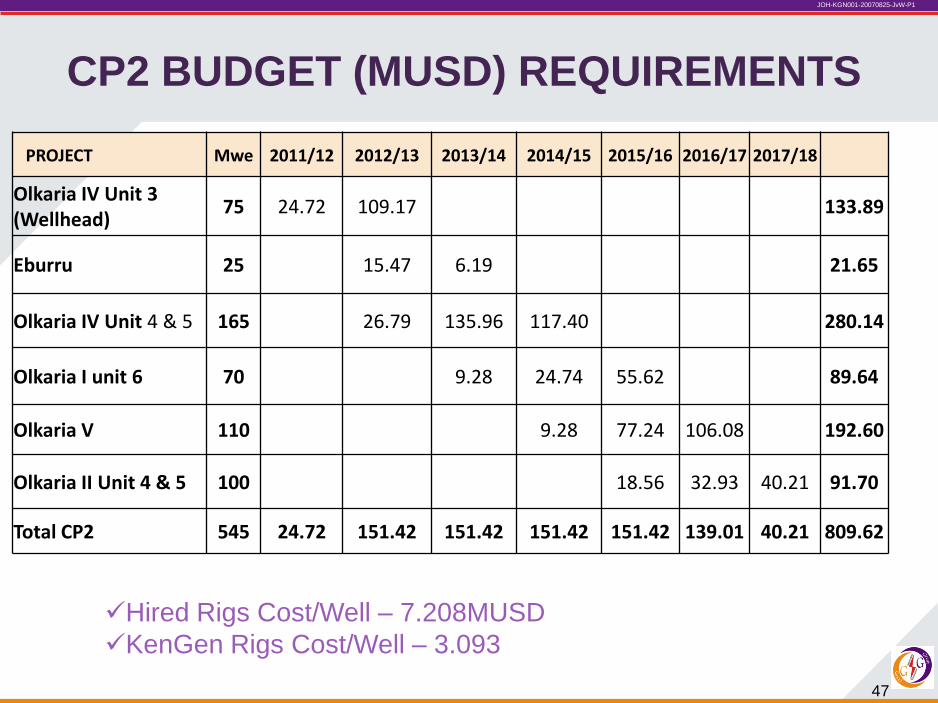
CP2 BUDGET (MUSD) REQUIREMENTS
JOH-KGN001-20070825-JvW-P1
Hired Rigs Cost/Well – 7.208MUSD
KenGen Rigs Cost/Well – 3.093
PROJECT Mwe 2011/12 2012/13 2013/14 2014/15 2015/16 2016/17 2017/18
Olkaria IV Unit 3 (Wellhead)
75 24.72 109.17 133.89
Eburru 25 15.47 6.19 21.65
Olkaria IV Unit 4 & 5 165 26.79 135.96 117.40 280.14
Olkaria I unit 6 70 9.28 24.74 55.62 89.64
Olkaria V 110 9.28 77.24 106.08 192.60
Olkaria II Unit 4 & 5 100 18.56 32.93 40.21 91.70
Total CP2 545 24.72 151.42 151.42 151.42 151.42 139.01 40.21 809.62

• Direct Uses

49
Geothermal Energy Utilization:
Direct Use –Oserian Green houses (Kenya)
i) Cut Roses Greenhouse Heating, ii) Refrigeration of cut flowers
storage and processing stores, iii) Injection of CO2 to aid in
photosynthesis, iv) Fumigation of soils and sterilization of liquid
recycled plant fertilizers

50
Geothermal and the Environment
• Geothermal energy is clean energy and renewable• Geothermal power stations emit less greenhouse gases
compared to other sources of energy
0
500
1000
Co
al
Oil
Gas
Geo
CO2
0
5
10
Co
al
Oil
Gas
Geo
SO2
Emissions (kg/MWhr). From Reed and Renner,
1995
51
Environmental Management 1
Exploration Stage:Carry out Baseline Environmental conditions assessment -
Determine the in-situ condition-High-light and assess the sensitivity of the area to development-Cost the possible environment impact and mitigation measures-Determine the potential Social Economic Impacts of the project-Gather data on the potential Volcano Seismic hazards of the area-Use the data as a basis for a GO or NO GO decision making
Feasibility study stage:
Carry out a full ESIA with disclosure
-Use it as a basis for planning, monitoring and management
-Requirement for licensing of the project by NEMA
-Part of the feasibility study
52
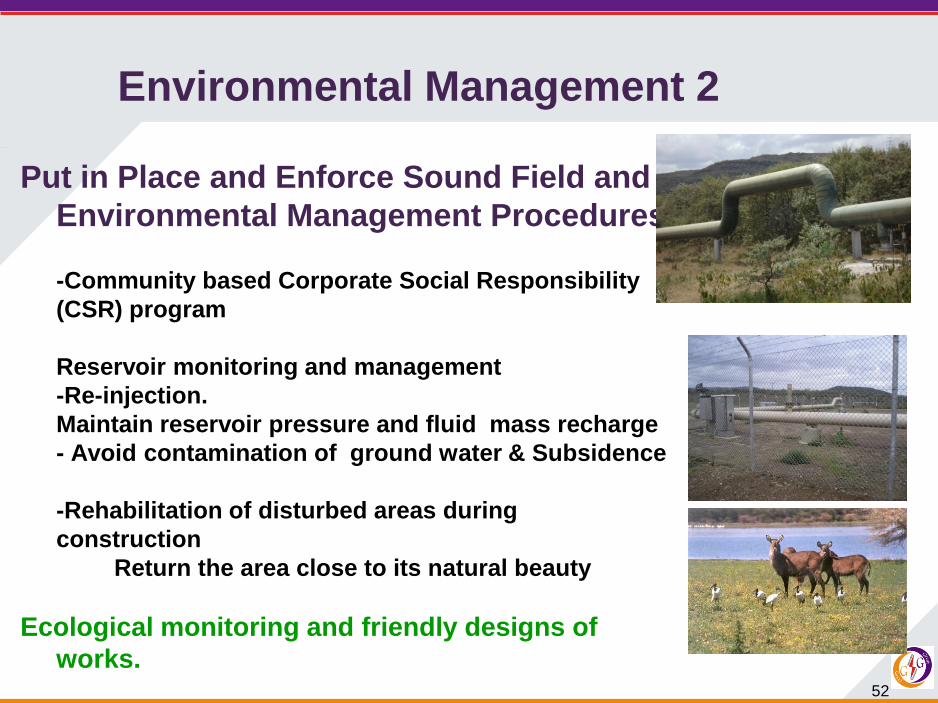
Environmental Management 2
Put in Place and Enforce Sound Field and
Environmental Management Procedures
-Community based Corporate Social Responsibility
(CSR) program
Reservoir monitoring and management
-Re-injection.
Maintain reservoir pressure and fluid mass recharge
- Avoid contamination of ground water & Subsidence
-Rehabilitation of disturbed areas during
construction
Return the area close to its natural beauty
Ecological monitoring and friendly designs of
works.

53
THANK YOU