gep i-xii.qxd 11/2/05 9:40 am page i global economic prospects - world bank€¦ · global economic...
TRANSCRIPT
GlobalEconomicProspects
Overview andGlobal Outlook
2006
GEP_i-xii.qxd 11/2/05 9:40 AM Page i
© 2006 The International Bank for Reconstruction and Development / The World Bank1818 H Street, NWWashington, DC 20433Telephone: 202-473-1000Internet: www.worldbank.orgE-mail: [email protected]
1 2 3 4 09 08 07 06
This volume is a product of the staff of the World Bank. The findings, interpretations, andconclusions expressed herein do not necessarily reflect the views of the Board of ExecutiveDirectors of the World Bank or the governments they represent.
The World Bank does not guarantee the accuracy of the data included in this work. Theboundaries, colors, denominations, and other information shown on any map in this work donot imply any judgment on the part of the World Bank concerning the legal status of anyterritory or the endorsement or acceptance of such boundaries.
Rights and PermissionsThe material in this work is copyrighted. Copying and/or transmitting portions or all of thiswork without permission may be a violation of applicable law. The World Bank encouragesdissemination of its work and will normally grant permission promptly.
For permission to photocopy or reprint any part of this work, please send a request withcomplete information to the Copyright Clearance Center, Inc., 222 Rosewood Drive, Danvers,MA 01923, USA, telephone 978-750-8400, fax 978-750-4470, www.copyright.com.
All other queries on rights and licenses, including subsidiary rights, should be addressed tothe Office of the Publisher, World Bank, 1818 H Street NW, Washington, DC 20433, USA,fax 202-522-2422, e-mail [email protected].
Cover design: Naylor DesignCover photo: Panos
GEP_i-xii.qxd 11/2/05 9:40 AM Page ii

Acknowledgments v
Overview vii
Chapter 1 Prospects for the Global Economy 1Global growth 3Long-term prospects and poverty forecast 8International finance 10Commodity markets 14World trade 16Risks and uncertainties 18Notes 22References 23
Appendix Regional Economic Prospects 25East Asia and Pacific regional prospects 25Europe and Central Asia regional prospects 27Latin America and Caribbean regional prospects 41Middle East and North Africa regional prospects 35South Asian regional prospects 38Sub-Saharan Africa regional prospects 41Notes 45
Figures1.1 Industrial production 31.2 A sharp slowdown 51.3 Regional growth 61.4 Dollar-euro interest rate differentials 101.5 Financing of the U.S. current account deficit 111.6 Emerging market spreads 111.7 Real long-term interest rates in G-7 countries 121.8 World savings rate 121.9 Inflation rates 131.10 Cumulative real increase in housing prices, 2005 141.11 Commodity prices 14
iii
Contents
GEP_i-xii.qxd 11/2/05 9:40 AM Page iii

1.12 Levels of spare oil capacity 151.13 World trade volumes 161.14 Change in textile exports to the developed world, first half of 2005 171.15 Estimated change in textile exports as share of total merchandise exports 181.16 Some countries are particularly at risk 20
A.1 Contributions to China’s growth 26A.2 Signs of a turnaround in global high-tech markets 27A.3 External positions could come under pressure with rising interest rates 30A.4 Impact of high oil prices: estimated loss in terms of trade, given a $30 oil price
increase 31A.5 Regional interest rate spreads remain low 33A.6 Oil export earnings balloon, lofting worker remittances in MENA 35A.7 Impact of ATC quota removal 36A.8 Estimated change in textile and clothing exports to the European Union and United
States during the first half of 2005 39A.9 Impact of high oil prices: estimated loss in terms of trade, given a $30 oil price
increase 40A.10 Growth performance in Sub-Saharan Africa 43A.11 Current account balance in Sub-Saharan Africa 43
Tables1.1 The global outlook in summary 41.2 Long-term prospects 81.3 Regional breakdown of poverty in developing countries 91.4 Terms-of-trade impacts of commodity price changes 161.5 Impact of a 2 million bpd negative supply shock 191.6 Interest rate scenarios 20
A.1 East Asia and Pacific forecast summary 25A.2 Europe and Central Asia forecast summary 28A.3 Latin America and Caribbean forecast summary 32A.4 Latin America and Caribbean debt ratios 33A.5 Middle East and North Africa forecast summary 36A.6 South Asia forecast summary 38A.7 Sub-Saharan Africa forecast summary 42
C O N T E N T S
iv
GEP_i-xii.qxd 11/2/05 9:40 AM Page iv
THIS REPORT WAS prepared by the Development Prospects Group (DECPG). The lead authorsof this report were Dilip Ratha and William Shaw, with direction by Uri Dadush. Theprincipal authors of the chapters were Andrew Burns (chapter 1), Dominique van der
Mensbrugghe (chapter 2), William Shaw (chapter 3), and Dilip Ratha (chapters 4, 5, and 6). Thereport was prepared under the general guidance of François Bourguignon, chief economist andsenior vice president of the World Bank.
The main macroeconomic forecasts in chapter 1 were prepared by the Global Trends Team ofDECPG led by Hans Timmer and including John Baffes, Andrew Burns, Maurizio Bussolo,Annette de Kleine, Betty Dow, Himmat Kalsi, Fernando Martel Garcia, Donald Mitchell, GaureshShailesh Rajadhyaksha, Mick Riordan, Cristina Savescu, Shane Streifel, and Shuo Tan. The out-look for the East Asia and Pacific region was carried out with the cooperation of Milan Brahmb-hatt and Louis Kuijs. The team also benefitted from in-depth consultations and comments fromthe regional chief economists and their staff, as well as country economists. The long-term growthand poverty forecasts were prepared by Dominique van der Mensbrugghe, Shaohua Chen, andMartin Ravallion. The companion Prospects for the Global Economy web site was prepared byAndrew Burns, Sarah Crow, and Cristina Savescu, in collaboration with Reza Farivari, SaurabhGupta, David Hobbs, Shahin Outadi, Raja Reddy Komati Reddy, Malarvizhi Veerappan, andCherin Verghese.
Maddalena Honorati and Prabal De provided research assistance. Chapter 2 benefitted fromcollaboration with Hans Timmer and from comments received from seminar participants, no-tably Lindsay Lowell and Susan Martin. Special thanks are due for the background materialprovided by Riccardo Faini, Robert Lucas, Julia Nielson, Kathleen Newland, and Irena Omela-niuk for chapter 3; Swaminathan S. Aiyar, Ralph Chami, Neil Fantom, Caroline Freund, GaryMcMahon, Irena Omelaniuk, Serdar Sayan, Nikola Spatafora, and K. M. Vijayalakshmi forchapter 4; John McHale for chapter 5; John Gibson, David McKenzie, George Kalan, DilekAykut, Nikos Passas, and Jan Riedberg for chapter 6. Ole Andreassen, Jose de Luna Martinez,Raul E. Hernandez-Coss, Massimo Cirasino, and Roger Ballard also contributed backgroundnotes for chapter 6. Thanks also to colleagues in the International Organization for Migrationwho helped collect information on remittance-related government policies (for chapter 4) usingtheir extensive international network, and Bernd Balkenhol of the International Labour Organi-zation for preparing a background paper on forced remittances.
v
Acknowledgments
GEP_i-xii.qxd 11/2/05 9:40 AM Page v
Many colleagues provided excellent comments at various stages of the report’s preparation. L. Alan Winters provided comments on the report and guidance throughout its preparation. LucaBarbone, Kevin Barnes, Augusto de la Torre, Shantayanan Devarajan, Mustapha Nabli, JohnPage, Bryan Roberts, John Whalley, and Dean Yang were peer reviewers at the Bankwide review.Richard Adams, William Easterly, Isaku Endo, Jose Maria Fanelli, Shahrokh Fardoust, IanGoldin, Daria Goldstein, Yevgeny Kuznetsov, Ali Mansoor, Phil Martin, Maria Soledad MartinezPeria, Fernando Montes-Negret, Nayantara Mukerji, Latifah Osman Merican, Christopher Par-sons, Guillermo Perry, Sonia Plaza, S. Ramachandran, and Terrie Walmsley also provided usefulcomments. Johan Mistiaen and Romeo Matsas provided excellent help in designing and imple-menting a survey of migrant remitters from Congo, Nigeria, and Senegal residing in Belgium.Maria Amparo Gamboa, Araceli Jimeno, Katherine Rollins, Sarah Crow, and Michael Paul pro-vided invaluable administrative support, including the collection of remittance fee data from allover the world.
The report team held consultations in July 2005 in Accra, Brussels, Geneva, London, andParis. Thanks are due to Haleh Bridi, Barbara Genevaz, Carlos Braga, Sonia Plaza, MichelleBailly, and other colleagues in these country offices for efficiently and enthusiastically arrangingconsultations with several international, academic, financial, and non-governmental institutions.Thanks are also due to the International Organization for Migration for assistance with organiz-ing consultations in Geneva and to the International Labour Organization, the Global Commis-sion on International Migration, the European Commission, and the Commonwealth Secretariatfor participating in consultations and providing useful feedback.
This report also benefitted from the comments of the Bank’s executive directors made at aninformal board meeting on October 20, 2005.
Marilou Uy, Alan Gelb, Jeff Lewis, Amar Bhattacharya, Shaida Badiee, Robert Keppler, andMisha Belkindas provided guidance and encouragement to the team at various stages. Dorota A.Nowak managed production and dissemination activities by DECPG. Steven Kennedy’s contri-bution as an editor is gratefully acknowledged. Book design, editing, and production were coor-dinated by the World Bank Office of the Publisher.
A C K N O W L E D G M E N T S
vi
GEP_i-xii.qxd 11/2/05 9:40 AM Page vi

THE THEMES OF this year’s Global Eco-nomic Prospects are international re-mittances and migration, their eco-
nomic consequences, and how policies canincrease their role in reducing poverty. Interna-tional migration can generate substantial wel-fare gains for migrants and their families andfor the countries involved (countries of originand destination). The money that migrantssend home—remittances—is an importantsource of extra income for migrants’ familiesand for developing countries: in aggregate, re-mittances are more than twice as the size of in-ternational aid flows. However, migrationshould not be viewed as a substitute for eco-nomic development in the origin country—development ultimately depends on sounddomestic economic policies.
Over the past two decades, barriers tocross-border trade and financial transactionshave fallen significantly, while barriers to thecross-border movement of people remainhigh. Despite its economic benefits, migrationremains controversial and, for some people,threatening. In part, this is because migration,like trade and capital movements, has distrib-utional consequences, whereby net gains forsociety may mask important losses for someindividuals and groups. But migration alsosparks resistance because the movement ofpeople has economic, psychological, social,and political implications that the movementof goods or money do not.
This publication has two goals. The first isto explore the gains and losses from interna-tional migration from the perspective of devel-oping countries, with special attention to themoney that migrants send home. The secondgoal is to consider policy initiatives that couldimprove the developmental impact of migra-tion, again with particular attention to remit-tances. Our focus (for economic purposes) ison international migration from developingcountries to high-income countries. Despitetheir importance, internal migration, migra-tion among developing countries, and the po-litical and social impacts of migration arebeyond the scope of this work.
It is important to keep in mind three basicprinciples. First, migration is a diverse phe-nomenon, and its economic impact in onelocation or another depends heavily on the par-ticular circumstances involved. Second, basicdata on migration and remittances are lacking,so predicting the impact of policy changes canbe problematic. This underlines the need forbetter data and more research. Third, migra-tion has social and political implications thatmay be just as important as the economicanalysis provided here. These are ably andcomprehensively discussed in the recent reportof the United Nations’ Global Commission onInternational Migration. For all of these rea-sons, the analysis and policy recommendationsfor migration must remain qualified. Thisreport draws conclusions where they can be
vii
Overview
GEP_i-xii.qxd 11/2/05 9:40 AM Page vii
supported by adequate data and points to anagenda for research where they cannot.
Global economic prospects
The slowdown among industrial economiesthat began in the second half of 2004 con-
tinued in 2005, with GDP growth expected tocome in at 2.5 percent, down from 3.1 percentthe year before. The pace of the expansion inthe high-income countries is forecast to in-crease slightly over the next two years, with ac-celeration in Europe offsetting a modest slow-ing in Japan and stable growth in the UnitedStates. Economic activity also slowed in devel-oping economies during 2005. Higher oilprices, domestic capacity constraints, andslower demand for their exports brought GDPgrowth down from a very strong 6.8 percent in2004 to an estimated 5.9 percent this year.While GDP growth has remained robust,higher oil prices have sharply slowed real in-come growth among oil importers from 6.4 to3.7 percent. Looking forward, continued highoil prices, coupled with inflationary pressures,are expected to restrain growth in most devel-oping countries over the next two years. Nev-ertheless, GDP in these economies shouldexpand by around 5.5 percent—much morequickly than during the past two decades.
This relatively positive outlook is subject toimportant downside risks. The outlook for oilprices is particularly uncertain. Low excess ca-pacity has introduced a risk premium into oilprices and will make it more difficult to con-tain the impact of a future supply shock,should one arise. As a result, a significant sup-ply disruption could slow global growth, withlarge negative consequences for global eco-nomic prospects. The future path of interestrates, which despite recent increases are stilllow, is another source of uncertainty. Persis-tent global imbalances, signs of rising infla-tion, and concerns about the sustainability ofgovernment finances in industrialized coun-tries are all factors that could push rateshigher and possibly provoke a much more se-rious slowdown.
The impact of remittancesand migration
The impact on migrantsThe bulk of the economic gains from migra-tion accrue to migrants and their families, andthese gains are often large. Wage levels (ad-justed for purchasing power) in high-incomecountries are approximately five times those oflow-income countries for similar occupations,generating an enormous incentive to emigrate.Moreover, to the extent that migrants devotea portion of their income to remittances, thegains are even greater. Essentially migrants canearn salaries that reflect industrial-countryprices and spend the money in developingcountries, where the prices of nontraded goodsare much lower. Migrants, however, incur sub-stantial costs, including psychological costs,and immigrants (particularly irregular mi-grants) sometimes run high risks; many sufferfrom exploitation and abuse. The decision tomigrate is often made with inaccurate infor-mation. Given the high costs of migration—including the risks of exploitation and the ex-orbitant fees paid to traffickers—the netbenefit in some cases may be low or even neg-ative. There are costs, too, for family membersleft behind—particularly children—althoughthese costs must be balanced against the bene-fits of the extra income that migrants sendback home to their families.
The impact on destination countriesDestination countries can enjoy significant eco-nomic gains from migration. The increasedavailability of labor boosts returns to capitaland reduces the cost of production. A model-based simulation performed for this study indi-cates that a rise in migration from developingcountries sufficient to raise the labor force ofhigh-income countries by 3 percent could boostincomes of natives in high-income countries by0.4 percent. In addition, high-income countriesmay benefit from increased labor-market flexi-bility, an increased labor force due to lowerprices for services such as child care, and per-haps economies of scale and increased diversity.
O V E R V I E W
viii
GEP_i-xii.qxd 11/2/05 9:40 AM Page viii

Nevertheless, there are losers within destina-tion countries. Some workers may see an ero-sion of wages or employment, although this ef-fect is found to be small in most empiricalstudies. In the model-based simulation of theimpact of increased migration, earlier migrantssuffer significant income losses, while the im-pact on natives’ wages is small. (The differentialimpact is reduced if foreign-born workers areviewed as closer substitutes for natives.) Easingrules that limit labor-market flexibility, andstrengthening institutions that provide educa-tion and training, will help workers displacedby immigration (both natives and resident mi-grants) to find work. Note that the simulationresults are not intended to incorporate all of theeconomic impacts of migration, nor do theycapture important social and political implica-tions. The goal is not to forecast the overall im-pact of increased migration, but rather to giveus insights into the economic gains that mightbe expected from changes in policy or circum-stances, as well as insights into the channelsthrough which migration affects welfare.
The impact on origin countriesMigration also generates economic benefits fororigin countries, the largest being remittances.International remittances received by develop-ing countries—expected to reach $167 billionin 2005—have doubled in the past five years asa result of (a) the increased scrutiny of flowssince the terrorist attacks of September 2001,(b) changes in the industry that support remit-tances (lower costs, expanding networks), (c)improvements in data recording, (d) the depre-ciation of the dollar (which raises the dollarvalue of remittances denominated in other cur-rencies), and (e) growth in the migrant stockand incomes. However, records still underesti-mate the full scale of remittances, because pay-ments made through informal, unrecordedchannels are not captured. Econometric analy-sis and available household surveys suggest thatunrecorded flows through informal channelsmay conservatively add 50 percent (or more) ofrecorded flows. Several countries with signifi-cant migrant populations do not report data on
remittances at all, even those sent through for-mal channels, or they report remittances underother balance of payments entries.
Despite the prominence given to remit-tances from developed countries, South-Southremittance flows make up between 30 and 45percent of total remittances received by devel-oping countries, reflecting the fact that overhalf of migrants from developing countriesmigrate to other developing countries.
While the impact of remittances on growthis unclear, remittances do play an importantrole in reducing the incidence and severity ofpoverty (with no significant effect on incomeinequality). Remittances directly increase theincome of the recipient and can help smoothhousehold consumption, especially in responseto adverse events, such as crop failure or ahealth crisis. In addition to bringing the directbenefit of higher wages earned abroad, migra-tion helps households diversify their sources ofincome (and thus reduce their vulnerability torisks) while providing a much needed source ofsavings and capital for investment. Remit-tances appear to be associated with increasedhousehold investments in education, entrepre-neurship, and health—all of which have a highsocial return in most circumstances.
Measuring the poverty impact of remit-tances is difficult: data are scarce, and calcu-lating the income gains from remittances re-quires assumptions concerning what migrantswould have earned if they had stayed at home.Careful analyses of the available householdsurvey data indicate that remittances havebeen associated with declines in the povertyheadcount ratio in several low-incomecountries—by 11 percentage points inUganda, 6 in Bangladesh, and 5 in Ghana, forexample. In Guatemala, remittances may havereduced the severity of poverty by 20 percent.Cross-country regressions and simulationsalso indicate that increases in remittances helpto reduce the incidence of poverty.
By generating a steady stream of foreignexchange earnings, remittances can improve acountry's creditworthiness for external bor-rowing and, through innovative financing
O V E R V I E W
ix
GEP_i-xii.qxd 11/2/05 9:40 AM Page ix

mechanisms (such as securitization of remit-tance flows), they can expand access to capitaland lower borrowing costs. While large andsustained remittance inflows can contribute tocurrency appreciation, this outcome may beless severe than it is in the case of natural re-source earnings, because remittances are dis-tributed more widely and may avoid exacer-bating strains on institutional capacity that areoften associated with natural resource booms.
Migration has economic implications for ori-gin countries beyond remittances. The small sizeof migration flows relative to the labor force sug-gests that the effects of South–North migrationon working conditions for low-skilled workersin the developing world as a whole must be smallas well. However, in some countries low-skilledemigration can raise demand for the remaininglow-skilled workers (including poor workers) atthe margin, leading to some combination ofhigher wages, lower unemployment, less under-employment, and greater labor force participa-tion. Thus low-skilled emigration can offer avaluable safety valve for insufficient employ-ment at home. In the long run, however, devel-oping country policies should aim to generateadequate employment and rapid growth, ratherthan relying on migration as an alternative to de-velopment opportunities.
High-skilled emigration has more compleximplications. Like low-skilled migration, itcan greatly benefit migrants and their familiesand help relieve labor market pressures. How-ever, a well-educated diaspora can improve ac-cess to capital, technology, information, for-eign exchange, and business contacts for firmsin the country of origin. The return of expa-triates and the maintenance of close contactswith high-skilled emigrants have played animportant role in the transfer of knowledge toorigin countries. At the same time, large out-flows of high-skilled workers can reducegrowth in the origin country for these reasons:(a) the productivity of colleagues, employees,and other workers may suffer because theylose the opportunity for training and mutuallybeneficial exchanges of ideas; (b) the provisionof key public services with positive externali-
ties, such as education and health (particularlyfor the control of transmissible diseases), maybe impaired; (c) opportunities to achieveeconomies of scale in skill-intensive activitiesmay be reduced; (d) society loses its return onhigh-skilled workers trained at public ex-pense; and (e) the price of technical servicesmay rise. Highly educated citizens, if theystayed in their countries, could help to im-prove governance, improve the quality of de-bate on public issues, encourage education ofchildren, and strengthen the administrativecapacity of the state—contributions thatwould be lost through high-skilled emigration.
It is impossible to reliably estimate the netbenefit, or cost, to origin countries of high-skilled emigration because data are limitedand a myriad of individual country circum-stances enter into the calculus of that benefitor loss. We can only offer two rough observa-tions, which reflect the wide variation in high-skilled emigration rates among countries:
• Very high rates of high-skilled emigra-tion are found in countries that representa small share of the population of the de-veloping world. Many of those countrieshave poor investment climates that likelylimit the productive employment of high-skilled workers. Of course, the loss ofhigh-skilled workers may aggravate thepoor investment climate and limit thepotential benefits of economic reform.
• Some countries find it difficult to pro-vide productive employment for manyhigh-skilled workers because of theirsmall economic scale or because mis-guided educational policies have resultedin a large supply of university graduatesfor whom no suitable jobs exist.
Policies to improve thedevelopmental impact ofremittances and migration
Migration policiesGreater emigration of low-skilled emigrantsfrom developing to industrial countries could
O V E R V I E W
x
GEP_i-xii.qxd 11/2/05 9:40 AM Page x
make a significant contribution to poverty re-duction. The most feasible means of increas-ing such emigration would be to promotemanaged migration programs between originand destination countries that combine tem-porary migration of low-skilled workers withincentives for return. Temporary programshave several advantages, and some disadvan-tages, relative to permanent migration. Fromthe perspective of the destination country,managed, temporary migration programs easesocial tensions by limiting permanent settle-ment; they limit the potential burden on pub-lic expenditures because immigrants are guar-anteed a job and are less likely to bringdependents; and they allow for controlledvariation of the number of immigrants in re-sponse to changes in labor-market conditions,thus limiting adverse effects on low-skilled na-tive workers. However, temporary migrationcan be less efficient than permanent migrationfor firms in destination countries because ofhigh training costs. From the origin-countryperspective, managed, temporary migrationmay be the only means of securing deliberateincreases in low-skilled emigration and mayraise remittances and improve the skills of re-turning workers. On the other hand, managedmigration programs do not guarantee futureaccess to labor markets (and thus to remit-tances), because it is easier for destinationcountries to suspend temporary programsthan to expel immigrants. Overall, however,such programs do represent a feasible ap-proach to capturing the efficiency gains fromlabor migration.
Origin countries that are adversely affectedby high-skilled emigration face challenges inmanaging it better. Service requirements foraccess to publicly financed education can beevaded and are likely to discourage return;and proposals for the taxation of emigrants tothe benefit of the origin country have made lit-tle progress. Origin countries can help to re-tain key workers by improving working con-ditions in public employment and by investingin research and development. Origin countriescan also take steps to encourage educated em-
igrants to return by identifying job opportuni-ties for them, cooperating with destinationcountries that have programs to promote re-turn, permitting dual nationality, and helpingto facilitate the portability of social insurancebenefits.
By providing authoritative information onmigration opportunities and risks, govern-ments could help avoid unfortunate, costly-to-reverse migration decisions and limit the abuseof vulnerable migrants. Labor recruiters canplay a valuable role in promoting migration,but emigrants’ lack of information often en-ables recruiters to capture the lion’s share of therents generated by constraints on immigrationand imperfect information. Origin countrieswith effective public sector institutions mightconsider the regulation of recruitment agentsto limit rents and improve transparency.
Remittance policiesGovernments in destination and origin coun-tries can sharpen the developmental impact ofremittances through the application of appro-priate policies. Access of poor migrants andtheir families to formal financial services forsending and receiving remittances could beimproved through public policies that encour-age expansion of banking networks, allowdomestic banks from origin countries to oper-ate overseas, provide identification cards tomigrants, and facilitate the participation ofmicrofinance institutions and credit unions inproviding low-cost remittance services. Remit-tances, in turn, can be used to support finan-cial products—housing and consumer loansand insurance—for poor people.
A second set of promising policies couldimprove competition in the remittance trans-fer market and thereby lower fees. The priceof remittance transactions is often unnecessar-ily high for the small transfers typically madeby poor migrants. The cost of such transac-tions is often well below the fees paid by cus-tomers. Reducing transaction charges in-creases the disposable income of poormigrants and increases their incentives toremit, because the net receipts of recipients
O V E R V I E W
xi
GEP_i-xii.qxd 11/2/05 9:40 AM Page xi
increase. The overall result would be strongerremittance flows to developing countries.
Competition among providers of remittanceservices could be increased by lowering capitalrequirements on remittance services and open-ing up postal, banking, and retail networks tononexclusive partnerships with remittanceagencies. Disseminating data on remittancefees in important remittance corridors and es-tablishing a voluntary code of conduct for de-livering fair-value transfers would improvetransparency and reduce prices for remittancetransactions. Governments could help reducecosts by supporting the introduction of mod-ern technology in payment systems. Alleviatingliquidity constraints by providing a credit lineeither to the sender or the recipient, based onpast remittance activity, would enable sendersto take advantage of the lower fee rates avail-able only for larger remittances. Reducing ex-change-rate distortions could also lower thecost of remittance transactions. Finally, regula-tory regimes need to strike a better balance be-tween preventing financial abuse and facilitat-ing the flow of funds through formal channels.
Several origin countries have attempted toimprove the developmental impact of remit-tances by introducing incentives to increaseflows and to channel them to more productiveuses. Such policies are more problematic thanefforts to expand access to financial servicesor reduce transaction costs, because they poseclear risks. Tax incentives to attract remittanceinflows, for example, may also encourage taxevasion, while matching-fund programs to at-tract remittances from migrant associationsmay divert funds from other local funding pri-orities. Efforts to channel remittances to in-vestment, meanwhile, have met with little suc-cess. Fundamentally, remittances are privatefunds that should be treated like other sourcesof household income. Efforts to increase sav-
ings and improve the allocation of expendi-tures should be accomplished through im-provements in the overall investment climate,rather than by targeting remittances. Similarly,because remittances are private funds, theyshould not be viewed as a substitute for offi-cial development aid.
Organization of this study
As is customary in this report, chapter 1reviews recent developments in and
prospects for the global economy and theirimplications for developing countries. Chapter2 uses a model-based simulation to evaluatethe potential global welfare gains and distribu-tional impact from a hypothetical increase of 3percent in high-income countries’ labor forcecaused by migration from developing coun-tries. Chapter 3 surveys the economic literatureon the benefits and costs of migration for mi-grants and their countries of origin, focusingon economically motivated migration from de-veloping to high-income countries. We thenturn to remittances, the main theme of the re-port. Chapter 4 investigates the size of remit-tance flows to developing countries, the use offormal and informal channels, the role of gov-ernment policies in improving the developmentimpact of remittances, and, for certain coun-tries, their macroeconomic impact. Chapter 5addresses the impact of remittances at thehousehold level, in particular their role in re-ducing poverty, smoothing consumption, pro-viding working capital for small-scale enter-prises, and increasing household expendituresin areas considered to have a high social value.The last chapter investigates policy measuresthat could lower the cost of remittance trans-actions for poor households and measures tostrengthen the financial infrastructure support-ing remittances.
O V E R V I E W
xii
GEP_i-xii.qxd 11/2/05 9:40 AM Page xii

Following very strong growth, the worldeconomy slowed in late 2004 and into 2005 asoutput began to push against capacity con-straints. High oil prices cut into the incomes ofoil importers, but the expansion remainedstrong, partly because of favorable conditionsin financial markets, including still low infla-tion, interest rates, and interest-rate spreads.Tightness in the oil market, the threat of evenhigher fuel prices, and the possibility that in-terest rates may rise pose major threats to theexpansion.
Slower but still strong growthWorld GDP is estimated to have increased by3.2 percent in 2005, down from 3.8 in 2004.Growth is projected to be stable in 2006, be-fore strengthening somewhat in 2007. Theslowdown that began in the second half of2004 was experienced throughout the indus-trialized world, with growth in Europe stillunderperforming its potential. In contrast, theeconomies of the United States and Japan, de-spite having slowed, are expanding at close totheir maximum sustainable rates.
Among large developing economies, GDPin 2005 continued to expand rapidly in Chinaand India (in excess of 9 percent and about7 percent, respectively), but slowed in Russiaas growth in oil production weakened. Highoil prices, in combination with domestic ca-pacity constraints and slower import demandfrom high-income countries, are estimated to
have reduced growth among oil-importing de-veloping countries from 6.9 percent to 6.1percent. In terms of real incomes, the slow-down was much sharper—from 6.4 percent to3.7 percent. Despite still growing oil revenues,reduced opportunities to expand productionin the petroleum sector meant that outputgrowth in oil-exporting developing countriesalso eased, from 6.6 percent to 5.6 percent.
During 2006 the expansion among high-income countries is projected to be stable, atabout 2.5 percent, before picking up a bit in2007. This reflects a combination of improvedperformance in Europe and stable growth inthe United States and Japan. In the UnitedStates, higher oil prices and tighter monetarypolicy are expected to offset the positive stim-ulus to growth from past depreciations. Theprojected pickup in Europe occurs despite asignificant drag on growth from high oil priceswhose effects are expected to be more thanoffset by low interest rates, pent up investmentdemand, and a dissipation of most of the neg-ative consequences following the euro’s real-effective appreciation. In Japan, strengtheningdomestic demand and supportive macroeco-nomic policies should enable growth to re-main close to potential, despite high oil prices.
Growth in developing economies is pro-jected to slow modestly from an estimated5.9 percent in 2005 to 5.5 percent by 2007.In East and South Asia, the expansion isprojected to moderate somewhat but remain
1
Prospects for the Global Economy1
GEP_001-024.qxd 11/1/05 2:17 PM Page 1

very strong, particularly in China and India.In the Middle East and in both North andSub-Saharan Africa, strong oil revenuesshould buoy internal demand among oil ex-porters and partially offset capacity con-straints that will slow production growth. Theprojected easing of growth in Latin Americaand the Caribbean reflects weaker non-oilcommodity prices as well as a return to trendgrowth in several countries that reboundedvery strongly in 2004. In Europe and CentralAsia, the waning of the growth bonus follow-ing EU accession and capacity constraints in oil-producing countries are expected to con-tribute to a modest slowing of the expansion.
Tight commodity marketsWeaker global growth should reduce thestrain in non-oil commodity markets. Alreadythere are signs of stabilization, and even ofdecline, in the prices of agricultural products,where supply has responded to high prices.Metals and shipping prices also show signs ofeasing, although to a lesser extent.
In oil markets, the projected slowdown isnot expected to be sufficient to generate a sub-stantial easing of prices. While crude oil supplyis growing marginally faster than demand,supply conditions are expected to remain tight.As a result, crude oil prices, which currentlyembody a large risk premium, are not expectedto fall rapidly. The baseline assumes that nomajor supply disruptions occur and that therewill be a gradual decline in oil prices toward$40 per barrel by 2010. This implies an aver-age price of $56 for a barrel of oil in 2006 and$52 in 2007.
Future spikes in oil prices form a potentialrisk to global prospects. A price hike gener-ated by a sustained negative supply shockwould be particularly disruptive, because out-put would be constrained directly by the re-duced availability of oil and petroleum-basedinputs. This would be in contrast to the recentpast, when prices rose in the context of rapidlygrowing supply. A supply shock that reducedoil deliveries by 2 million barrels per day
could push prices to more than $90 a barrelfor more than a year, resulting in a 1.5 percentreduction in global growth by the second yearfollowing the shock. The terms-of-trade im-pact for low-income oil-importing economieswould reduce incomes in these countries bymore than 4 percent of their GDP (much morethan for high-income countries) because theireconomies are relatively oil intensive, and be-cause a supply shock–induced increase in oilprices is unlikely to be accompanied by highernon-oil commodity prices.
Global imbalances remain an issueGlobal current account imbalances and theU.S. current account deficit (which is exp-ected to exceed $750 billion in 2005) remainimportant medium-term problems. Duringlate 2004 and early 2005 tensions easedsomewhat. Rising interest rate differentialsrelative to European short- and long-term as-sets made private sector purchases of dollar–denominated assets more attractive. As a re-sult, the dollar appreciated some 2.5 percentin real-effective terms during the first sevenmonths of 2005, and reserve accumulation byforeign central banks became less important inthe financing of the current account deficit.
This respite appears to have been short-lived. To some extent, the increased privateflows represented a one-off portfolio adjust-ment toward U.S. assets by investors. Begin-ning in the second quarter of 2005, the flowsdiminished, and the dollar faced reneweddownward pressure. As a result, foreign re-serve accumulation once again became a criti-cal component in the financing of the U.S. cur-rent account deficit, restoring the risk that achange in behavior on the part of foreign cen-tral bankers could prove destabilizing. Recentdecisions by China and Malaysia to widen therange of currencies to which their own cur-rencies are pegged could help ease future pres-sures, especially if the scope for appreciationincluded in the regime is exercised in practice.Globally, policy should continue to focus onincreasing public and private savings in deficit
G L O B A L E C O N O M I C P R O S P E C T S 2 0 0 6
2
GEP_001-024.qxd 11/1/05 2:17 PM Page 2

countries and increasing spending (notably oninvestment goods) in surplus countries.
Low interest rates are a sourceof uncertaintyThe future path of long-term interest rates andspreads, which have been at historically lowlevels for an extended period, is an importantuncertainty. A number of factors have helpedmaintain interest rates at low levels, includingseveral years of very loose monetary policythroughout the developed world; increasedaging-related savings in Europe; balance-sheetconsolidation in the United States andAsia; and a low inflationary environment—thanks, in part, to increased competition fol-lowing the entry into global markets of Chinaand members of the former Soviet bloc. Mostof these factors are temporary and are expectedto gradually abate, resulting in a steady rise inlong-term rates in the baseline. Indeed, yieldson 10-year U.S. Treasuries have risen 50 basispoints since September.
However, these temporary factors couldcontinue to hold sway, reversing or bringingto a halt the recent increase in long-term rates(as they have in the past). This would promptstronger-than-projected demand, but also ex-acerbate capacity constraints. As a result, oilprices could get pushed higher, which wouldprovoke a more brutal inflationary cycle, andultimately, a recession.
Alternatively, these forces could dissipatemore rapidly, causing long-term interest ratesto rise more quickly toward long-term equilib-rium levels, which would provoke a more pro-nounced slowdown. While not the most likelyscenario, the recent rise in long-term yieldsand inflation suggest that a higher interest-rate scenario is a real possibility.
Finally, this environment of slowinggrowth and global imbalances raises the riskof rising protectionism. In this regard, policy-makers need to make a concerted effort to en-sure that the Doha round reaches a successfulconclusion so that developing countries spe-cializing in the export of agricultural productscan benefit from trade liberalization in the
same way that other countries have profitedfrom freer trade in the manufacturing and rawmaterials sectors.
Global growth
The global economy slowed markedly in2005, but still continued to expand at an
estimated 3.2 percent pace, compared with3.8 percent in 2004 (table 1.1). The slowdownwas widespread, reaching virtually every eco-nomic region. It was precipitated by higher oilprices, resource-sector capacity constraints,tightening monetary policy in the UnitedStates, and in some countries, the maturationof the investment cycle following a year ofvery fast growth.
Outturns and prospects in high-income countriesGrowth among industrialized economies in2005 is estimated at 2.5 percent, substantiallylower than the 3.1 percent recorded the yearbefore. Industrial production and trade flowsamong high-income countries were particu-larly weak. Growth rates of the former de-clined from over 5 percent in mid-2004 to lessthan 1.5 percent in the middle of 2005 (figure1.1). High oil prices, rising short-term interestrates, and an unusually disruptive hurricaneseason1 slowed growth in the United States to
P R O S P E C T S F O R T H E G L O B A L E C O N O M Y
3
Figure 1.1 Industrial production
�10
�5
0
1997 200520042001 2002 2003200019991998
5
10
15
% change, monthly, year over year
Source: World Bank.
Developing countries
World(excluding China)
Developingcountries
(excluding China)
GEP_001-024.qxd 11/1/05 2:17 PM Page 3
an estimated 3.5 percent, compared with4.2 percent the year before. The slowdownwas not as marked as it could have been,because low long-term interest rates boosteddomestic demand, and the cumulative effectof past dollar depreciations improved netexports.
In Europe, the growth slowdown was lesspronounced, but the expansion, at an estimated
1.2 percent (1.1 percent in the euro zone), wasmuch weaker. The relatively low oil-intensityof European economies and relaxed macro-economic policy stance help explain why theslowdown in Europe was not more pro-nounced. In Japan, GDP is estimated to haveincreased 2.3 percent. Rising domestic de-mand and household incomes, as a result oftighter labor market conditions and reduced
G L O B A L E C O N O M I C P R O S P E C T S 2 0 0 6
4
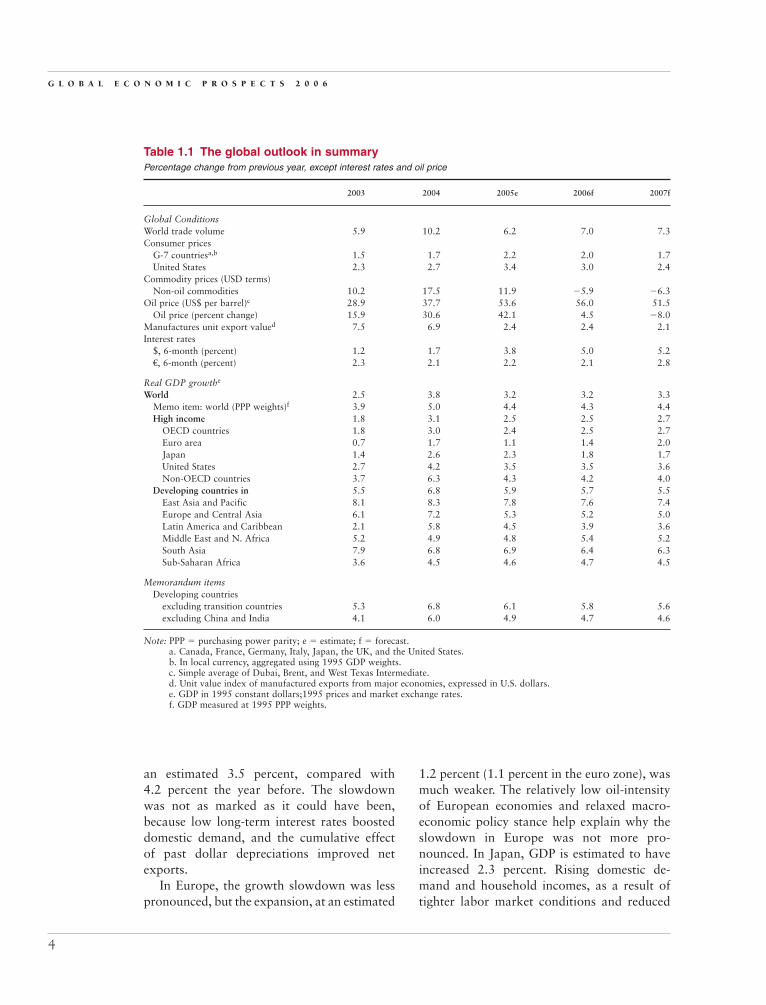
Table 1.1 The global outlook in summaryPercentage change from previous year, except interest rates and oil price
2003 2004 2005e 2006f 2007f
Global ConditionsWorld trade volume 5.9 10.2 6.2 7.0 7.3Consumer prices
G-7 countriesa,b 1.5 1.7 2.2 2.0 1.7United States 2.3 2.7 3.4 3.0 2.4
Commodity prices (USD terms)Non-oil commodities 10.2 17.5 11.9 �5.9 �6.3
Oil price (US$ per barrel)c 28.9 37.7 53.6 56.0 51.5Oil price (percent change) 15.9 30.6 42.1 4.5 �8.0
Manufactures unit export valued 7.5 6.9 2.4 2.4 2.1Interest rates
$, 6-month (percent) 1.2 1.7 3.8 5.0 5.2€, 6-month (percent) 2.3 2.1 2.2 2.1 2.8
Real GDP growthe
World 2.5 3.8 3.2 3.2 3.3Memo item: world (PPP weights)f 3.9 5.0 4.4 4.3 4.4High income 1.8 3.1 2.5 2.5 2.7
OECD countries 1.8 3.0 2.4 2.5 2.7Euro area 0.7 1.7 1.1 1.4 2.0Japan 1.4 2.6 2.3 1.8 1.7United States 2.7 4.2 3.5 3.5 3.6Non-OECD countries 3.7 6.3 4.3 4.2 4.0
Developing countries in 5.5 6.8 5.9 5.7 5.5East Asia and Pacific 8.1 8.3 7.8 7.6 7.4Europe and Central Asia 6.1 7.2 5.3 5.2 5.0Latin America and Caribbean 2.1 5.8 4.5 3.9 3.6Middle East and N. Africa 5.2 4.9 4.8 5.4 5.2South Asia 7.9 6.8 6.9 6.4 6.3Sub-Saharan Africa 3.6 4.5 4.6 4.7 4.5
Memorandum itemsDeveloping countries
excluding transition countries 5.3 6.8 6.1 5.8 5.6excluding China and India 4.1 6.0 4.9 4.7 4.6
Note: PPP � purchasing power parity; e � estimate; f � forecast.a. Canada, France, Germany, Italy, Japan, the UK, and the United States.b. In local currency, aggregated using 1995 GDP weights.c. Simple average of Dubai, Brent, and West Texas Intermediate.d. Unit value index of manufactured exports from major economies, expressed in U.S. dollars.e. GDP in 1995 constant dollars;1995 prices and market exchange rates.f. GDP measured at 1995 PPP weights.
GEP_001-024.qxd 11/1/05 2:17 PM Page 4
industrial restructuring, compensated formuch slower Chinese import demand.
Looking forward, the increase in oil pricesobserved in 2005 is expected to slow globalgrowth by about one quarter of a percentagepoint in 2006, compared with what it wouldhave been had prices remained stable. In theUnited States, the pace of the expansion isprojected to remain broadly stable, becausethe negative effects of further expected in-creases in interest rates and high oil prices willbe partly offset by a deficit-financed pickup inpost-hurricane investment and additional in-creases in the contribution of the external sec-tor to growth. In Europe, economic activity isprojected to accelerate despite a significantdrag on growth from high oil prices, becauseof low interest rates, pent up investmentdemand, and a dissipation of most of thenegative consequences following the euro’sreal-effective appreciation. Meanwhile, inJapan, the negative consequences of higher oilprices are expected to be substantially offsetby strengthening domestic demand and con-tinued supportive macroeconomic policies.
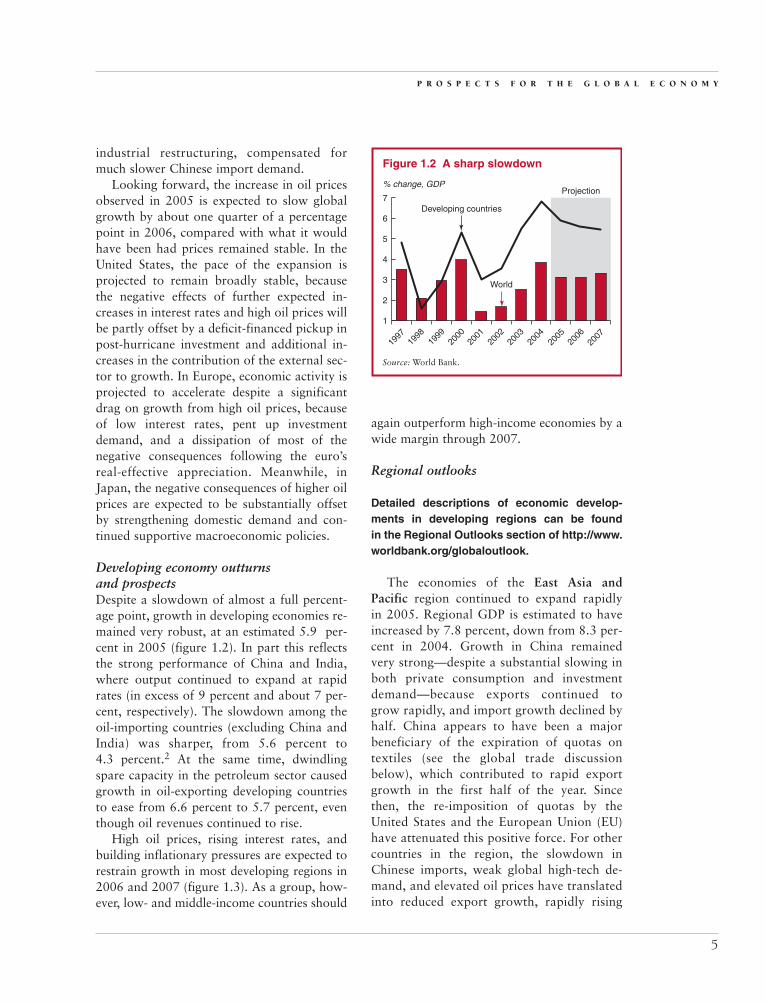
Developing economy outturnsand prospectsDespite a slowdown of almost a full percent-age point, growth in developing economies re-mained very robust, at an estimated 5.9 per-cent in 2005 (figure 1.2). In part this reflectsthe strong performance of China and India,where output continued to expand at rapidrates (in excess of 9 percent and about 7 per-cent, respectively). The slowdown among theoil-importing countries (excluding China andIndia) was sharper, from 5.6 percent to4.3 percent.2 At the same time, dwindlingspare capacity in the petroleum sector causedgrowth in oil-exporting developing countriesto ease from 6.6 percent to 5.7 percent, eventhough oil revenues continued to rise.
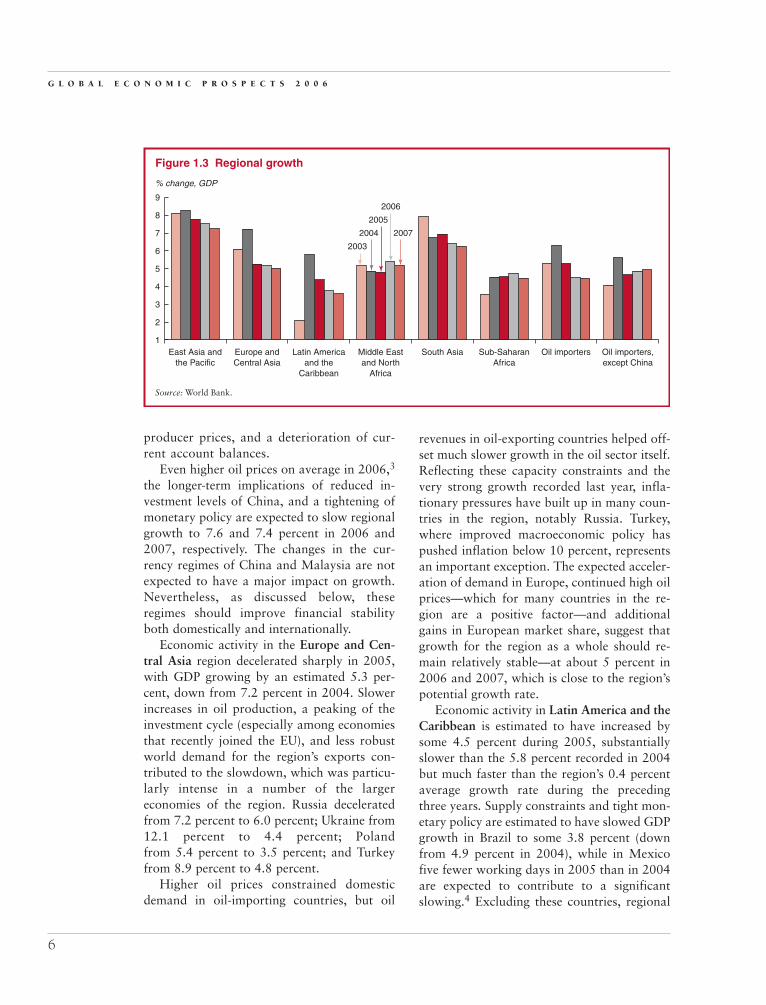
High oil prices, rising interest rates, andbuilding inflationary pressures are expected torestrain growth in most developing regions in2006 and 2007 (figure 1.3). As a group, how-ever, low- and middle-income countries should
again outperform high-income economies by awide margin through 2007.
Regional outlooks
Detailed descriptions of economic develop-ments in developing regions can be foundin the Regional Outlooks section of http://www.worldbank.org/globaloutlook.
The economies of the East Asia andPacific region continued to expand rapidlyin 2005. Regional GDP is estimated to haveincreased by 7.8 percent, down from 8.3 per-cent in 2004. Growth in China remainedvery strong—despite a substantial slowing inboth private consumption and investmentdemand—because exports continued togrow rapidly, and import growth declined byhalf. China appears to have been a majorbeneficiary of the expiration of quotas ontextiles (see the global trade discussionbelow), which contributed to rapid exportgrowth in the first half of the year. Sincethen, the re-imposition of quotas by theUnited States and the European Union (EU)have attenuated this positive force. For othercountries in the region, the slowdown inChinese imports, weak global high-tech de-mand, and elevated oil prices have translatedinto reduced export growth, rapidly rising
P R O S P E C T S F O R T H E G L O B A L E C O N O M Y
5
Figure 1.2 A sharp slowdown
% change, GDP
Source: World Bank.
1
1997
1998
1999
2000
2001
2002
2003
2004
2005
2006
2007
World
Projection
2
3
4
5
6
7Developing countries
GEP_001-024.qxd 11/1/05 2:17 PM Page 5
producer prices, and a deterioration of cur-rent account balances.
Even higher oil prices on average in 2006,3
the longer-term implications of reduced in-vestment levels of China, and a tightening ofmonetary policy are expected to slow regionalgrowth to 7.6 and 7.4 percent in 2006 and2007, respectively. The changes in the cur-rency regimes of China and Malaysia are notexpected to have a major impact on growth.Nevertheless, as discussed below, theseregimes should improve financial stabilityboth domestically and internationally.
Economic activity in the Europe and Cen-tral Asia region decelerated sharply in 2005,with GDP growing by an estimated 5.3 per-cent, down from 7.2 percent in 2004. Slowerincreases in oil production, a peaking of theinvestment cycle (especially among economiesthat recently joined the EU), and less robustworld demand for the region’s exports con-tributed to the slowdown, which was particu-larly intense in a number of the largereconomies of the region. Russia deceleratedfrom 7.2 percent to 6.0 percent; Ukraine from12.1 percent to 4.4 percent; Polandfrom 5.4 percent to 3.5 percent; and Turkeyfrom 8.9 percent to 4.8 percent.
Higher oil prices constrained domesticdemand in oil-importing countries, but oil
revenues in oil-exporting countries helped off-set much slower growth in the oil sector itself.Reflecting these capacity constraints and thevery strong growth recorded last year, infla-tionary pressures have built up in many coun-tries in the region, notably Russia. Turkey,where improved macroeconomic policy haspushed inflation below 10 percent, representsan important exception. The expected acceler-ation of demand in Europe, continued high oilprices—which for many countries in the re-gion are a positive factor—and additionalgains in European market share, suggest thatgrowth for the region as a whole should re-main relatively stable—at about 5 percent in2006 and 2007, which is close to the region’spotential growth rate.
Economic activity in Latin America and theCaribbean is estimated to have increased bysome 4.5 percent during 2005, substantiallyslower than the 5.8 percent recorded in 2004but much faster than the region’s 0.4 percentaverage growth rate during the precedingthree years. Supply constraints and tight mon-etary policy are estimated to have slowed GDPgrowth in Brazil to some 3.8 percent (downfrom 4.9 percent in 2004), while in Mexicofive fewer working days in 2005 than in 2004are expected to contribute to a significantslowing.4 Excluding these countries, regional
G L O B A L E C O N O M I C P R O S P E C T S 2 0 0 6
6
Figure 1.3 Regional growth
% change, GDP
Source: World Bank.
1
2
East Asia andthe Pacific
Europe andCentral Asia
Latin Americaand the
Caribbean
Middle Eastand North
Africa
South Asia Sub-SaharanAfrica
Oil importers Oil importers,except China
3
4
5
6
7
8
9
2003
2004
2005
2006
2007
GEP_001-024.qxd 11/1/05 2:17 PM Page 6
growth in 2005 is estimated at a robust5.9 percent, boosted by both strong worlddemand for the region’s exports (particularlyoil, coffee, and copper, which account for 65percent of the regions’ commodity exports)and low interest rates. Domestic factors thatcontributed to the strong performance includepast efforts to open the region up to interna-tional trade, more responsible budget policy,the introduction of more flexible exchangerate regimes, and lower inflation.
Slower global growth is already easing ten-sions in the non-oil commodity markets thathave driven the recovery in the Latin Americaand Caribbean region, and this trend is ex-pected to continue. Moreover, while manycountries in the region benefit from high oilprices, many others, particularly those in theCaribbean, are heavily oil dependent and facesubstantial income losses.5 As a result, re-gional GDP growth is projected to decline to3.6 percent by 2007.
High oil prices and strong oil demand con-tinue to be key drivers for the economies ofthe Middle East and North Africa, where GDPis estimated to have increased by 4.8 percentin 2005. Very high oil revenues generateddouble-digit advances in public spending,which have helped to increase GDP in oil-producing economies by an estimated 5.4 per-cent. Strong demand from these economiesspilled over to the labor-abundant economiesof the region through higher remittances andincreased intraregional tourism flows. How-ever, weak growth in Europe, high oil bills,and a one-off negative effect from the removalof quotas under the Agreement on Textilesand Clothing (ATC) reduced growth of re-gional oil-importing countries from 4.6 per-cent in 2004 to about 4.0 percent in 2005.
Looking forward, high oil prices are ex-pected to continue feeding demand in oil-producing countries, whose economies shouldexpand by 5.4 percent in 2006 and 5.1 percentin 2007. In the oil-importing economies,growth is expected to accelerate to about thesame level, supported by stronger Europeangrowth and a weaker negative effect from
the ATC. The region’s strong performance re-flects, in part, past reforms, such as steps toimprove transparency in the oil sector inAlgeria, as well as banking-sector reform, re-ductions in customs duties, privatization, andregulatory reform in other Maghreb countries.These efforts, and in particular, the substantialreforms underway in Egypt, help to raise theregion’s growth potential by improving bothinfrastructure and the overall investment cli-mate. While heartening, the pace of reformoutside of Egypt appears to have waned, per-haps because high oil prices have reducedthe sense of urgency attached to reform in oil-exporting countries.
In contrast to the slowdown elsewhere inthe world economy, growth in South Asia isestimated to have picked up a bit in 2005,coming in at 6.9 percent, compared with6.8 percent in 2004. This mainly reflects im-proved performance in Pakistan, where GDPis estimated to have increased 8.4 percent (upfrom 6.6 percent in 2004), thanks to a broad-based acceleration in the manufacturing andagricultural sectors. Like Pakistan, othercountries in the region have enjoyed verystrong export performance, in part because ofthe recent removal of ATC quotas. However,the sharp rise in oil prices and solid regionalgrowth over the past several years havecontributed to an acceleration of inflation.Addressing this issue will require a furthertightening of monetary policy, which, in com-bination with rising oil bills, is expected toresult in a modest deceleration of economicactivity to about 6.3 percent by 2007.
GDP in Sub-Saharan Africa is estimated tohave increased 4.6 percent in 2005, bolsteredby very strong growth among resource-richcountries. Output in South Africa, the region’slargest economy, is estimated to have acceler-ated to 4.2 percent, lifted by high metal prices,strong confidence, low nominal interestrates and the rand’s recent depreciation.The economies of oil-exporting countries,including Nigeria (the region’s second largesteconomy), grew an estimated 5.5 percent in2005, reflecting rapid increases in petroleum
P R O S P E C T S F O R T H E G L O B A L E C O N O M Y
7
GEP_001-024.qxd 11/1/05 2:17 PM Page 7

production and investment inflows. Growthin some oil-exporting countries may exceed25 percent in 2006 and 2007, as new oil fieldscome on stream. However, the pace of theexpansion will taper off in other countries asthey reach capacity constraints.
In West Africa, strong commodity prices in2005, improved rainfall, and more vigoroususe of insecticides are expected to lift regionalgrowth. In East and Southern Africa the ex-pansion is projected to slow somewhat, partlybecause the removal of quotas under the ATCwill continue to put textile exports under pres-sure. Political strife and insecurity in Côted’Ivoire and the Great Lakes region are likelyto impact growth there. Countries are increas-ingly passing higher crude-oil prices throughto consumers with the aim of containing bud-get deficits but will cut into consumer demandand add to inflationary pressures.
The balance of payments and economicconsequences of higher oil prices are expectedto intensify over the next year as other com-modity prices, which have attenuated theterms-of-trade impact of high oil prices, ease.Despite higher oil prices and increased pass-through, inflation is expected to remain in the
single digits as a result of lower food pricesand prudent monetary policies. Recent eco-nomic reforms, and increased donor sup-port—as more countries reach the Heavily In-debted Poor Country (HIPC) completionpoint—will also help support growth, which isprojected to be at or above 4.5 percent overthe medium term.
Long-term prospects and povertyforecast
The recent strong economic performance ofdeveloping economies and the relatively
rapid growth projected for these economiesover the medium term owe much to the eco-nomic reforms undertaken over the past sev-eral years. Improved macroeconomic policies,reflected in lower inflation, trade liberalization(average tariffs have fallen from 30 percent toless than 10 percent since the 1980s), moreflexible exchange rate regimes, and lower fiscaldeficits have reduced uncertainty and im-proved the overall investment environment.More microeconomic structural reforms, suchas privatization and regulatory reform initia-tives, have also played a key role.
G L O B A L E C O N O M I C P R O S P E C T S 2 0 0 6
8
Table 1.2 Long-term prospectsReal GDP per capita, annual average percentage change
Forecast
Medium-term Long-term 1980s 1990s 2001–06 2006–15
World Total 1.3 1.2 1.5 2.1
High-income countries 2.5 1.8 1.6 2.4OECD 2.5 1.8 1.6 2.4United States 2.3 2.0 1.8 2.5Japan 3.4 1.1 1.1 1.9European Union 2.1 1.8 1.4 2.3Non-OECD 3.5 4.0 2.0 3.5
Developing economies 0.7 1.5 3.7 3.5East Asia & Pacific 5.8 6.3 6.4 5.3Europe & Central Asia 0.9 �1.8 5.0 3.5Latin America & Caribbean �0.9 1.6 1.2 2.3Middle East & North Africa �1.1 1.0 2.5 2.6South Asia 3.3 3.2 4.5 4.2Sub-Saharan Africa �1.1 �0.5 1.8 1.6
Source: World Bank.
GEP_001-024.qxd 11/1/05 2:17 PM Page 8
P R O S P E C T S F O R T H E G L O B A L E C O N O M Y
9
Table 1.3 Regional breakdown of poverty in developing countries
Millions of people living on
less than $1 per day less than $2 per day
Region 1990 2002 2015 1990 2002 2015
East Asia and the Pacific 472 214 14 1,116 748 260China 375 180 11 825 533 181Rest of East Asia and the Pacific 97 34 2 292 215 78
Europe and Central Asia 2 10 4 23 76 39Latin America and the Caribbean 49 42 29 125 119 106Middle East and North Africa 6 5 3 51 61 40South Asia 462 437 232 958 1,091 955Sub-Saharan Africa 227 303 336 382 516 592
Total 1,218 1,011 617 2,654 2,611 1,993Excluding China 844 831 606 1,829 2,078 1,811
Percent of population living on
less than $1 per day less than $2 per day
Region 1990 2002 2015 1990 2002 2015
East Asia and the Pacific 29.6 14.9 0.9 69.9 40.7 12.7China 33.0 16.6 1.2 72.6 41.6 13.1Rest of East Asia and the Pacific 21.1 10.8 0.4 63.2 38.6 11.9
Europe and Central Asia 0.5 3.6 0.4 4.9 16.1 8.2Latin America and the Caribbean 11.3 9.5 6.9 28.4 22.6 17.2Middle East and North Africa 2.3 2.4 0.9 21.4 19.8 10.4South Asia 41.3 31.3 12.8 85.5 77.8 56.7Sub-Saharan Africa 44.6 46.4 38.4 75.0 74.9 67.1
Total 27.9 21.1 10.2 60.8 49.9 32.8Excluding China 26.1 22.5 12.9 56.6 52.6 38.6
Source: World Bank.
These factors are expected to contributeto better long-term growth performanceas compared with past decades (table 1.2).Consistent with recent improvements in eco-nomic performance, per capita incomes in de-veloping countries are projected to growsome 3.5 percent a year, more than twice asfast as the 1.5 percent growth rates recordedduring the 1990s. Projected future growthrates are higher than during the 1980s and1990s in every developing region except EastAsia, where they are expected to declinesomewhat due to an aging population.
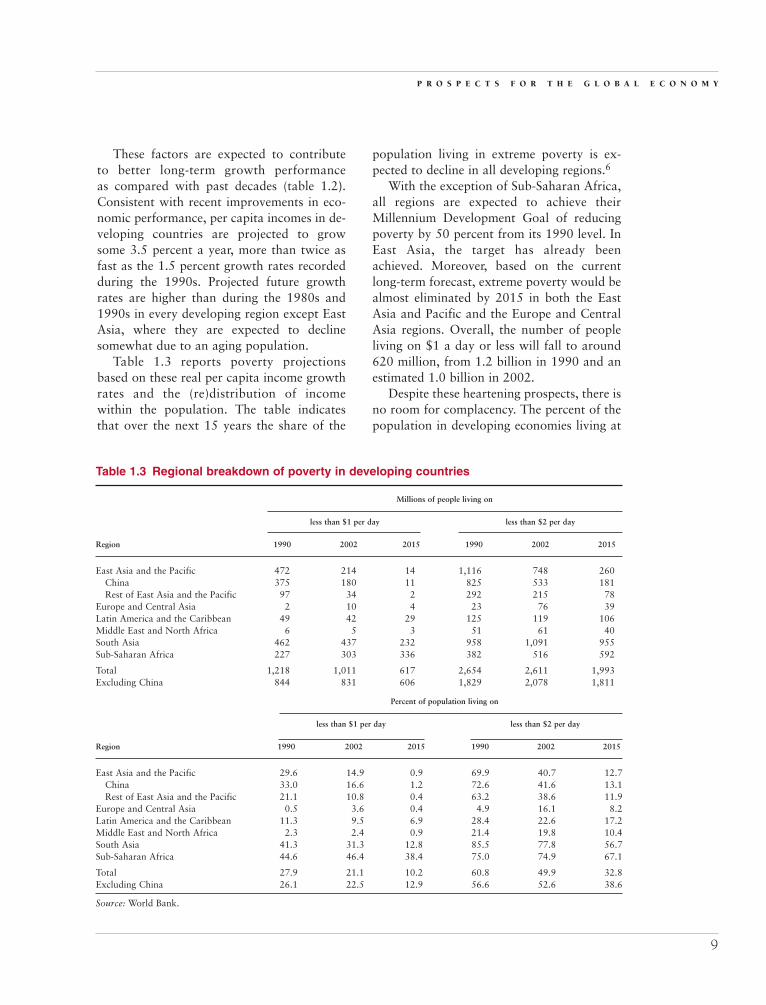
Table 1.3 reports poverty projectionsbased on these real per capita income growthrates and the (re)distribution of incomewithin the population. The table indicatesthat over the next 15 years the share of the
population living in extreme poverty is ex-pected to decline in all developing regions.6
With the exception of Sub-Saharan Africa,all regions are expected to achieve theirMillennium Development Goal of reducingpoverty by 50 percent from its 1990 level. InEast Asia, the target has already beenachieved. Moreover, based on the currentlong-term forecast, extreme poverty would bealmost eliminated by 2015 in both the EastAsia and Pacific and the Europe and CentralAsia regions. Overall, the number of peopleliving on $1 a day or less will fall to around620 million, from 1.2 billion in 1990 and anestimated 1.0 billion in 2002.
Despite these heartening prospects, there isno room for complacency. The percent of thepopulation in developing economies living at
GEP_001-024.qxd 11/1/05 2:17 PM Page 9

or below $2 per day is projected to remain dis-turbingly high. Moreover, notwithstandingthat inroads have been made recently, the inci-dence of extreme poverty in Sub-SaharanAfrica in 2002 was actually higher than in1990. While current projections suggest 8 per-cent of the subcontinent’s population will belifted above the extreme poverty line by 2015,some 38 percent of Africans will still be livingin extreme poverty. Worse, the absolute num-ber of Africans living at or below the $1-a-daylevel is projected to increase. And, because percapita incomes elsewhere are projected togrow faster, the continent will continue to fallfarther behind the rest of the world—unlesssteps are taken to greatly improve economicgrowth in Africa.
International finance
The significant adjustments of internationalexchange rates over the past several years
paused in 2005. In particular, notwithstandingthe persistence of the U.S. current accountdeficit (expected to exceed $750 billion thisyear), the dollar’s trend decline with respect tomajor currencies came to an end. Initially, thecurrency appreciated against its trading part-ners by some 3.5 percent in real-effective termsas of July 2005. It then lost value in Augustand September, before showing signs ofstrengthening in October.
The strengthening of the dollar during thefirst seven months of 2005 is partly explainedby rising U.S. short-term interest rates (as theFederal Reserve Bank continued its policy ofgradual tightening) and falling long-term ratesin Europe (possibly in response to the conti-nent’s relatively weaker economic perfor-mance). By July, these developments hadgenerated a 300 basis-point swing in the dif-ference between U.S. and European shortrates, along with a 75 basis-point gap in favorof long-term U.S. bonds (figure 1.4).
These growing interest rate differentials in-creased the financial incentive to hold dollar-versus euro-denominated assets, temporarilyproducing stronger net private sector capital
inflows in the first quarter of 2005 as in-vestors adjusted their portfolios. Not only didthese inflows help strengthen the dollar, theyalso financed a large share of the U.S. currentaccount deficit (figure 1.5). As a result, thedollar was much less reliant on the accumula-tion of reserves by foreign central banks (for-eign official asset purchases) than in 2004.
In the second quarter of 2005, however,private inflows eased, and foreign centralbanks once again assumed a large role in thefinancing of the dollar. Moreover, toward theend of July the dollar came under reneweddownward pressure and depreciated some1.7 percent in real-effective terms duringAugust and September. The dollar began toappreciate again only after the long-terminterest rate started to rise again. By October2005, the long-term interest rate differentialhad widened to about 120 basis points.
The apparent sensitivity of the dollar andthe financing of the U.S. current accountdeficit to interest-rate differentials highlightthe problems posed by the large financingrequirements of the U.S. current accountdeficit.
Until global imbalances are resolved, thedollar is likely to continue to come under
G L O B A L E C O N O M I C P R O S P E C T S 2 0 0 6
10
Figure 1.4 Dollar-euro interest ratedifferentials
�2.0
Jan.
2003
Apr. 2
003
July
2003
Oct. 2
003
Jan.
2004
Apr. 2
004
July
2004
Oct. 2
004
Jan.
2005
Apr. 2
005
July
2005
2.0
1.5
1.0
0.5
0
�0.5
�1.0
�1.5
Percentage points
Source: World Bank.
Short-termdifference
Long-termdifference
GEP_001-024.qxd 11/1/05 2:17 PM Page 10

downward pressure, unless foreign centralbanks accumulate substantial quantities ofdollars or interest-rate differentials widen fur-ther. In the baseline, interest rate differentialsare projected to widen further, and the dollaris projected to decline gradually, falling byabout 5 percent per year. Should central bankscease to be willing to accumulate reserves atcurrent rates, there could be a disruptive hikein interest rates or a more precipitous fall inthe dollar (World Bank 2005).
The recent decision of the Chinese andMalaysian authorities to move from an ex-change rate regime linked to the dollar aloneto one focusing on a basket of currencies rep-resents a major and welcome move toward amore flexible currency regime. While it willnot resolve current account imbalances, itshould increase the stability of the renminbiand ringitt with respect to the currencies oftheir trading partners (other than the UnitedStates) and reduce the amount by which thedollar would have to depreciate relative toother currencies to achieve a given level of ad-justment.7 How effective the new regimes willbe, depends importantly on how they are
managed. While technically the announcedrules could allow the renminbi to depreciate asmuch as 9 percent per month, similar possibil-ities for flexibility existed under the formerregime but were not exercised.
Interest rates and spreads remain lowThe recent period of very low real interestrates has been particularly beneficial to devel-oping economies. Together with narrowerrisk premia (figure 1.6), low rates have al-lowed developing countries to reduce theirfinancing costs, restructure their debt, andpursue strong investment growth. Early re-payment of Paris Club debt has alreadyreached $22 billion in 2005, and amongemerging-market economies, virtually allfinancing requirements for this year had beenmet by August.8
Short-term rates have been rising, andthey can be expected to continue to rise asmonetary policy tightens, initially in theUnited States, but eventually in Europe aswell. In contrast and notwithstanding re-cent increases, longer-term interest rateshave remained low longer than expected(figure 1.7), while spreads on more riskyemerging market and corporate assets havefallen even further.
P R O S P E C T S F O R T H E G L O B A L E C O N O M Y
11
Figure 1.5 Financing of the U.S. currentaccount deficit
�300
0
300
2004 2005Q1
2005Q2
600
900
$ billions, annualized
Source: U.S. Department of Commerce; BEA; U.S.Treasury Bulletin.
Other private flows Private sectortreasury bills
Official assets(reserves)
Net equity and FDI
Basis points
Source: World Bank; Datastream.
Figure 1.6 Emerging market spreads
200
400
July
2002
800
1,000
EMBI global bond spreads
600
Jan.
2003
July
2003
Jan.
2004
July
2004
Jan.
2005
July
2005
GEP_001-024.qxd 11/1/05 2:17 PM Page 11

Many reasons for these low interest rateshave been proposed (see IMF 2005 for a re-cent overview), including the following:
• Excess liquidity stemming from an ex-tended period of very low short-terminterest rates in almost all developedeconomies.
• A low inflation environment, thanks toimproved credibility of monetary policy,and the disinflationary impact of in-creased competition following the entryinto global markets of China and mem-bers of the former Soviet bloc.
• An increase in global savings, due to– increased savings in Europe following
heightened recognition of the need toprepare for the impending retirementof the baby-boom generation; and
– increased corporate savings in dy-namic East Asia (caused by corporaterestructuring following the currencycrisis) and in the United States (follow-ing the stock market decline in 2000).
However, while global savings have in-creased recently, this follows a period wherethey declined substantially, making it difficultto argue that the world savings rate is currentlytoo high (figure 1.8). Rather, investment
activity, principally in the developed world, hasfailed to keep pace with savings as they havereturned to historical levels (see IMF 2005).
Most of these explanations for lower long-term rates involve temporary factors, imply-ing that long-term rates will eventually risetoward their long-run equilibrium level9 (fre-quently defined as the long-run potentialgrowth rate of the economy). In this context,the question is not so much why long-termrates are low, but how much longer they willremain so. In the baseline, increased invest-ment in Europe and tighter monetary policyresult in a gradual rise in interest rates, whichwill nevertheless remain below recent esti-mates of the long-term growth potential of theU.S. economy. The final section of this chapterexplores some of the economic implicationsshould interest rates stay low for an extendedperiod of time or, alternatively, should theyrise more quickly than anticipated.
Signs of rising inflationLow interest rates have contributed directly tothe strong economic performance of recentyears. Growth has, in turn, provoked a pickupin inflation in many developing countries. Thelargest hikes have been in commodity prices(see below). However, producer price inflation
G L O B A L E C O N O M I C P R O S P E C T S 2 0 0 6
12
Percent
Source: World Bank.
Figure 1.7 Real long-term interest rates inG-7 countries
�6
�4
4
2
6
1975
8
0
�2
1980 1985 1990
GDP-weighted averageof the 10-yeara government
bond yields
1995 2000 20051970
Note: For data prior to 1972, exclude Italy, a 10-year ornearest government bond yields.
Periodaverage
% of nominal GDPa
Source: World Bank.
Figure 1.8 World savings rate
Globalsavings rate
Averagesavings rate
23
24
1986
25
22
21
201991 1996 2001 20051981
a. Sum of national savings divided by the sum of nationalGDP expressed in U.S. dollars at market exchange rates.
GEP_001-024.qxd 11/1/05 2:17 PM Page 12

has jumped by more than 4 percentage pointsin some regions and exceeds 5 percent inevery developing region except Sub-SaharanAfrica.10
Consumer price inflation has also beenrising (if less spectacularly). Weighted byGDP, aggregate inflation among developingeconomies increased from 4.0 percent in thefourth quarter of 2003 to 5.4 percent by Julyof 2005. It has since eased somewhat. Region-ally, inflation has picked up strongly in SouthAsia, Sub-Saharan Africa, and East Asia (fig-ure 1.9). Inflation in developing countriesis projected to continue rising in 2005, asgrowth remains at or above trend rates, andthe pass-through from high oil prices contin-ues to exert upward pressure on prices.
In high-income countries, there are onlylimited signs of rising inflation. In the UnitedStates, where output is close to potential, in-flation has been rising steadily. It jumped to4.7 percent in September 2005, but the in-crease is not expected to be permanent, be-cause it reflects very high gasoline prices thatmonth, which have since declined. Neverthe-less, data pointing to rising wages and lower
productivity growth suggest that core infla-tion, which has been more stable, may beginto rise soon. In Europe, high oil prices havelimited disinflation despite significant slackand the appreciation of the euro.
These same factors should continue to limitprice inflation in Europe. However, in theUnited States, high oil prices plus the pro-jected further depreciation of the dollar areexpected to generate additional upward pricepressure.
Low interest rates have resulted in higherprices of interest-sensitive assets in marketswith strong financial intermediation—notablyin the United States and some Europeancountries—contributing to strong consumerdemand (World Bank 2005, IMF 2005). As in-terest rates rise, housing prices are expected toplateau and even decline, which has alreadybegun in the United Kingdom. As they do so,the rate at which household wealth increaseswill moderate and its contribution to con-sumer demand should abate.11
Data indicate that house prices have alsobeen rising rapidly in a number of middle-income countries, such as Bulgaria, India,
P R O S P E C T S F O R T H E G L O B A L E C O N O M Y
13
Figure 1.9 Inflation rates
East Asiaand Pacific
Annual % change
0
1
2
3
4
5
6
7
9
8
Source: World Bank.
a. Data concern August 2005, except for East Asia (September), the Middle East and North Africa (June), and Sub-Saharan Africa(March).
Europe andCentral Asia
2002
2003
2004
Most recent available dataa
Latin Americaand the Caribbean
Middle East andNorth Africa
South Asia Sub-SaharanAfrica
OECD
GEP_001-024.qxd 11/1/05 2:17 PM Page 13

Indonesia, Malaysia, and South Africa (fig-ure 1.10). While fast economic growth andchanges in the regulatory environment havecertainly played a role in these countries, sohave low interest rates. Unfortunately, datalimitations prevent a thorough analysis of thecauses and consequences of rising housingprices in low- and middle-income economies.12
Commodity markets
After several years of rising commodityprices, there are indications of a stabiliza-
tion and even reversal of gains in the marketsfor agricultural products and for metals andminerals (figure 1.11).
Agricultural prices have been decliningmost of this year and are down 5 percent sinceMarch 2005. However, prices of agriculturalraw materials are rising, partly because ofhigher prices for commodities that are closesubstitutes for crude oil-based products (forexample, natural rubber prices are up 41 per-cent because of increases in synthetic rubbercosts).
Although metals and minerals prices roseduring the first months of the year, they havesince stabilized, and in October 2005, theywere at the same level as in March 2005.Conditions in some metals and minerals mar-kets remain tight, due to low inventories. Inthe case of copper and aluminum, prices re-main elevated (partly reflecting higher energycontent in the production of these goods).Demand has weakened markedly for lead, tin,and zinc.
Analysis of past non-oil commodity cyclessuggests that this one may have run its course.Already it distinguishes itself from previousepisodes by having lasted longer, in part,because energy prices have also been high,which was not always the case during previ-ous episodes. In so far as high fuel prices in-crease production costs in both agricultureand metals and minerals, they may have re-duced the supply response, keeping priceshigher longer.
In line with the projected slowdown inglobal growth and increased supply, prices ofagricultural products and metals and mineralsare projected to decline somewhat in 2006.
Limited spare capacity to keep oil prices highIn contrast with other commodity prices,oil prices continued to strengthen during the
G L O B A L E C O N O M I C P R O S P E C T S 2 0 0 6
14
Source: World Bank; BIS.
India
(Mum
bai)
a. Data for Russia and China reflect increases between 2000and 2004; data for other countries reflect increases between2000 and 2005.
Figure 1.10 Cumulative real increase in housing prices, 2005
Percent
0
20
40
60
100
80
South
Afri
ca
Bulgar
ia
Russia
a
Thaila
nd
(Ban
gkok
)
United
Sta
tes
Shang
hai
Chinaa
Index, 1990 � 100
Source: World Bank.
2000
Figure 1.11 Commodity prices
2001 2002 2003 2004 2005 2006
Energy
50
250
150
300
200
100
Metals andminerals
Agriculturalproducts
GEP_001-024.qxd 11/1/05 2:17 PM Page 14

first nine months of 2005. During this period,they averaged some $52 per barrel, a 38 per-cent increase compared with the average for2004. These increases occurred despite an eas-ing of conditions in the oil market. Demandgrowth slowed from more than 3.5 percent in2004 (the highest growth since the late 1970s)to a 1.4 percent annualized rate during thefirst three quarters of 2005. As a result, supplyis actually increasing faster than demand,13
and inventories have begun to accumulate,although they remain low.14
Rising prices over the first eight months ofthe year reflected the market’s concern thatexisting spare capacity was insufficient to dealwith a major disruption to supply or an in-crease in demand (figure 1.12). In some sense,hurricane Katrina was the kind of seriousshock the market feared. Although oil pricesspiked briefly to more than $70 a barrel, theyare back below $60, following the release ofsome 29 million barrels of crude oil from thestockpiles of the International Energy Agencyand the U.S. government. Moreover, gasolineprices in the United States have returned to thelevels observed before hurricane Katrina, andmarket concerns have switched from a focuson inadequate oil supply to insufficient
refining capacity, particularly of lower-qualitycrude oil.
Spare production capacity is now about2 million barrels per day (mbpd), comparedwith almost 6 mbpd three years ago, and ca-pacity will remain tight over the near term.This reflects long lags in bringing significantnew quantities of oil into production15 andshorter lags before demand substitution canhave an effect.16 Moreover, approximatelyhalf of the expected new capacity is being pro-duced by OPEC, suggesting that the organiza-tion will continue to exercise significant mar-ket power over the near term.
In this environment, prices are likely to re-main volatile, as small events or even minorchanges in expectations may provoke signifi-cant price swings. As a result, the World Bankhas adopted a technical assumption for thefuture path of oil prices based on a slow de-cline toward $40 per barrel by 2010. Thisimplies an average price of $56 in 2006 and$52 in 2007, which is somewhat higher thanthe current consensus forecast. The economicconsequences of alternative scenarios, notablya sharp negative supply shock, are discussed inthe final section of this chapter.
The impact of oil prices on developing economiesThe world economy in general and developingcountries in particular have shown consider-able resilience to higher oil prices. This reflectsincreases in non-oil commodity prices and avery robust global economy, which have, untilrecently, muted the impact of higher oil prices.
The first round of oil price hikes (1999–2000) adversely affected low- and middle-income countries. The price increase was verylarge in percentage terms (rising from justunder $12 to almost $30 per barrel between thefirst quarter of 1999 and the end of 2000) butsmaller than the most recent increases in dollarterms (table 1.4). Current account deficitsamong low-income oil-importing Africancountries increased by 0.5 percent of GDP onaverage.17 Moreover, government deficits inthose countries that did not pass on the price
P R O S P E C T S F O R T H E G L O B A L E C O N O M Y
15
Source: World Bank.
Jan.2002
Figure 1.12 Levels of spare oil capacity
Million barrels per day
July2002
Jan.2003
July2003
Jan.2004
July2004
Jan.2005
0
1
2
3
8
7
6
5
4
July2005
GEP_001-024.qxd 11/1/05 2:17 PM Page 15

hikes rose by about the same amount.18 Amongthose countries with limited access to interna-tional finance, non-oil imports fell by 3.8 per-cent in 2000, partly because insufficient foreignexchange was available to finance imports atprevious levels.
During the second bout of (more gradual)price increases (2001–3) the same countriesperformed much better. Current account posi-tions actually improved as a percent of GDP,and there were no discernible slowdown innon-oil imports. Part of this improved perfor-mance is explained by real exchange ratemovements (which diminished the domesticcurrency cost of the oil-price hike) and by anumber of non-oil commodity prices that alsoincreased rapidly during that time, thus pro-viding the necessary foreign currency to meetthe additional oil burden without cutting intonon-oil imports. On average, high non-oilcommodity prices reduced the negative terms-of-trade shock from higher energy costs bymore than half.
Drawing from this experience, the impactof the latest hike in oil prices on poor oil im-porters is a concern, principally because it hasnot been accompanied by as much strength in
non-oil commodity prices. Indeed, the esti-mated terms-of-trade shock from price move-ments since January 2004 is more than threetimes as large for various groups of low-income countries than the cumulativeshock over the preceding three years. As a re-sult, non-oil imports from poor, currentaccount–constrained countries are expected tocome under pressure in the coming months.Moreover, the impact on oil-importing poorcountries could be significantly aggravated ifoil prices remain at or close to current levelsand if non-energy commodity prices return topre-shock levels.
World trade
The expansion of world trade slowed sig-nificantly during 2005 (figure 1.13).
While merchandise exports were growing at a16 percent or more annualized pace in themiddle of 2004, they subsequently slowed andwere expanding at an 8.5 percent pace duringthe third quarter of 2005.
G L O B A L E C O N O M I C P R O S P E C T S 2 0 0 6
16
Table 1.4 Terms-of-trade impactsof commodity price changes
1999–00 2001–03 2004–05
Cumulative price changeOil 120.3 18.9 88.0Agricultural products 0.3 15.7 8.9Metals and minerals 25.0 10.2 47.9Manufactures �5.0 3.0 10.4
Total terms-of-trade effect (% of GDP)
Oil ImportersLow and Middle income �1.8 �0.1 �0.9
Low income �3.8 �0.9 �2.9Sub-Saharan Africa �2.5 1.4 �1.2South Asia �3.9 �1.5 �2.7Highly indebted �4.3 1.5 �3.3
poor countries
Source: World Bank.
Note: Periods Jan. 1999–Dec. 2000, Dec. 2000–Dec. 2003,Dec. 2003–July 2005.
Source: World Bank.
Figure 1.13 World trade volumes
Annual growth rates, 6-month moving average
0
4
40
28
32
36
24
16
12
8
20
Jan.2003
July2003
World
High-incomecountries
Other developingcountries
China
Jan.2004
July2004
Jan.2005
July2005
GEP_001-024.qxd 11/1/05 2:17 PM Page 16

Most of the deceleration concerned the ex-ports of high-income economies, volumes ofwhich grew by less than 4 percent (annualized)in the first quarter of 2005, before strengthen-ing more recently. Merchandise export volumesof developing countries (excluding China) wererelatively robust, increasing at an estimated12 percent pace toward the middle of 2005.Chinese exports, boosted by the removal ofATC quotas, grew at a 24 percent pace.
Commodity markets have significantlyshaped developments in world trade. The mer-chandise exports of oil-exporting countries,which had been rising at some 5.8 percent in2004, increased by an estimated 5.2 percentin 2005. The deceleration among developingoil importers (excluding China) was steeper inpercentage terms (from 15 percent to 11 per-cent), but growth rates remained much higher.Growth in the production of non-oil com-modities in general is moderating, both be-cause demand is easing and because of supplyconstraints.
As a reflection of the slowdown already ob-served, international trade is forecast to slowdown relative to 2004 as a whole. Merchan-dise trade volumes are expected to increaseby around 7.7 percent. The goods and servicetrade is expected to increase 6.2 percent in2005 before strengthening somewhat in2006–7.
Exports of developing economies continueto be heavily influenced by developments in thevolatile high-tech market. After falling sharplyin the third quarter of 2004, global sales ofsemiconductors and other high-tech productspicked up before weakening once again in thesecond quarter of 2005. This volatility is ap-parent in East Asian export volumes (high-techproducts represent as much as two-thirds of theexports of some economies in this region).19
High-frequency data suggest a strengthening ofdemand for these products, implying a pick upin export flows from the region.
Trade growth for some countries washeavily influenced by the removal of quotasunder the ATC of the Multifiber agreement in
January 2005 (figure 1.14). While the removalof quotas was done in phases, and ten years ofadjustment time provided, backloading of theremoval of quotas meant that they were stillbinding when they were finally removed. As aresult, there were significant changes in pat-terns of trade among affected goods in 2005,most notably in the form of increased exportsfrom China (and other countries, whose mar-ket share had been artificially held back underthe old quota scheme) to the detriment of
P R O S P E C T S F O R T H E G L O B A L E C O N O M Y
17
Figure 1.14 Change in textile exports tothe developed world, first half of 2005
% change, year over year, $ values
Source: World Bank, IMF, U.S. Department of Commerce,and EuroStat.
a. Data refer to the first five months of each year only.b. Data for China include Hong Kong and Macao.
TajikistanMyanmar
NepalKenyaa
PhilippinesMexico
MongoliaMauritius
South AfricaVietnam
TunisiaLesothoa
MadagascarMoldovaAlbania
Macedonia, FYRPakistanMoroccoThailand
Swazilandb
IndonesiaRomaniaBulgaria
Lao PDREgypt
BangladeshCambodia
Perua
JordanTurkey
�60 �40 �20 0 20 40 60
Sri LankaIndia
Chinab
GEP_001-024.qxd 11/1/05 2:17 PM Page 17
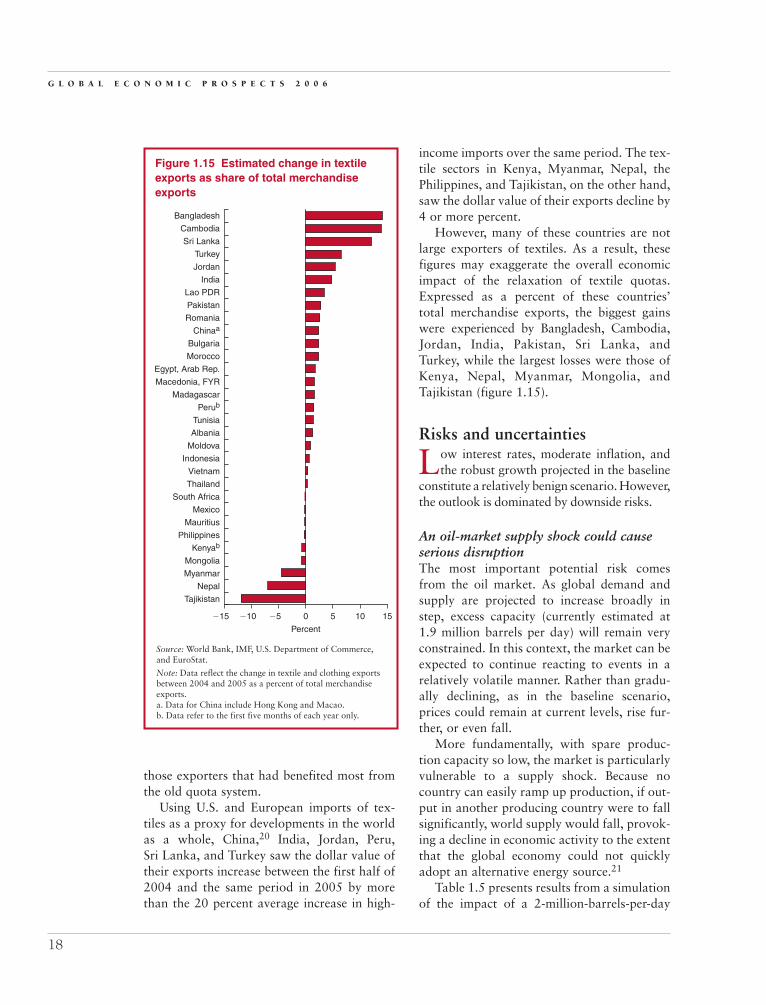
those exporters that had benefited most fromthe old quota system.
Using U.S. and European imports of tex-tiles as a proxy for developments in the worldas a whole, China,20 India, Jordan, Peru,Sri Lanka, and Turkey saw the dollar value oftheir exports increase between the first half of2004 and the same period in 2005 by morethan the 20 percent average increase in high-
income imports over the same period. The tex-tile sectors in Kenya, Myanmar, Nepal, thePhilippines, and Tajikistan, on the other hand,saw the dollar value of their exports decline by4 or more percent.
However, many of these countries are notlarge exporters of textiles. As a result, thesefigures may exaggerate the overall economicimpact of the relaxation of textile quotas.Expressed as a percent of these countries’total merchandise exports, the biggest gainswere experienced by Bangladesh, Cambodia,Jordan, India, Pakistan, Sri Lanka, andTurkey, while the largest losses were those ofKenya, Nepal, Myanmar, Mongolia, andTajikistan (figure 1.15).
Risks and uncertainties
Low interest rates, moderate inflation, andthe robust growth projected in the baseline
constitute a relatively benign scenario. However,the outlook is dominated by downside risks.
An oil-market supply shock could causeserious disruptionThe most important potential risk comesfrom the oil market. As global demand andsupply are projected to increase broadly instep, excess capacity (currently estimated at1.9 million barrels per day) will remain veryconstrained. In this context, the market can beexpected to continue reacting to events in arelatively volatile manner. Rather than gradu-ally declining, as in the baseline scenario,prices could remain at current levels, rise fur-ther, or even fall.
More fundamentally, with spare produc-tion capacity so low, the market is particularlyvulnerable to a supply shock. Because nocountry can easily ramp up production, if out-put in another producing country were to fallsignificantly, world supply would fall, provok-ing a decline in economic activity to the extentthat the global economy could not quicklyadopt an alternative energy source.21
Table 1.5 presents results from a simulationof the impact of a 2-million-barrels-per-day
G L O B A L E C O N O M I C P R O S P E C T S 2 0 0 6
18
Figure 1.15 Estimated change in textileexports as share of total merchandiseexports
Percent
Source: World Bank, IMF, U.S. Department of Commerce,and EuroStat.
Note: Data reflect the change in textile and clothing exportsbetween 2004 and 2005 as a percent of total merchandiseexports.a. Data for China include Hong Kong and Macao.b. Data refer to the first five months of each year only.
Bangladesh
Cambodia
Sri Lanka
Turkey
Jordan
India
Lao PDR
Pakistan
Romania
Chinaa
Bulgaria
Morocco
Egypt, Arab Rep.
Macedonia, FYR
Madagascar
Perub
Tunisia
Albania
Moldova
Indonesia
Vietnam
Thailand
South Africa
Mexico
Mauritius
Philippines
Kenyab
Mongolia
�15 �10 �5 0 5 10 15
Myanmar
Nepal
Tajikistan
GEP_001-024.qxd 11/1/05 2:17 PM Page 18
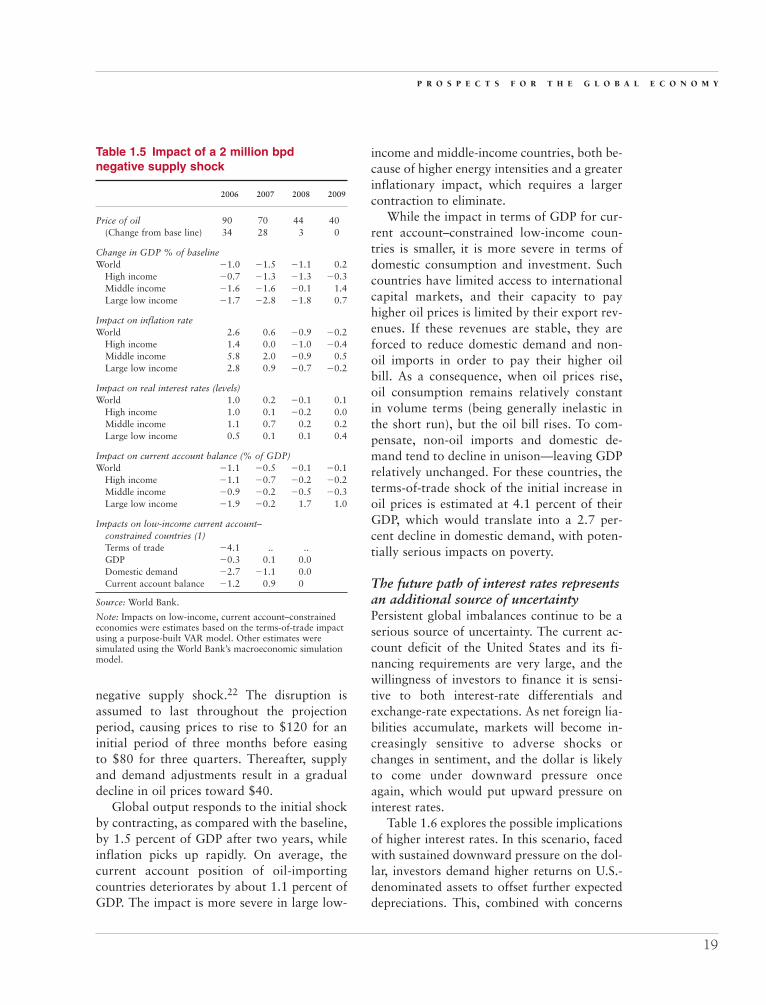
negative supply shock.22 The disruption isassumed to last throughout the projectionperiod, causing prices to rise to $120 for aninitial period of three months before easingto $80 for three quarters. Thereafter, supplyand demand adjustments result in a gradualdecline in oil prices toward $40.
Global output responds to the initial shockby contracting, as compared with the baseline,by 1.5 percent of GDP after two years, whileinflation picks up rapidly. On average, thecurrent account position of oil-importingcountries deteriorates by about 1.1 percent ofGDP. The impact is more severe in large low-
income and middle-income countries, both be-cause of higher energy intensities and a greaterinflationary impact, which requires a largercontraction to eliminate.
While the impact in terms of GDP for cur-rent account–constrained low-income coun-tries is smaller, it is more severe in terms ofdomestic consumption and investment. Suchcountries have limited access to internationalcapital markets, and their capacity to payhigher oil prices is limited by their export rev-enues. If these revenues are stable, they areforced to reduce domestic demand and non-oil imports in order to pay their higher oilbill. As a consequence, when oil prices rise,oil consumption remains relatively constantin volume terms (being generally inelastic inthe short run), but the oil bill rises. To com-pensate, non-oil imports and domestic de-mand tend to decline in unison—leaving GDPrelatively unchanged. For these countries, theterms-of-trade shock of the initial increase inoil prices is estimated at 4.1 percent of theirGDP, which would translate into a 2.7 per-cent decline in domestic demand, with poten-tially serious impacts on poverty.
The future path of interest rates representsan additional source of uncertainty Persistent global imbalances continue to be aserious source of uncertainty. The current ac-count deficit of the United States and its fi-nancing requirements are very large, and thewillingness of investors to finance it is sensi-tive to both interest-rate differentials andexchange-rate expectations. As net foreign lia-bilities accumulate, markets will become in-creasingly sensitive to adverse shocks orchanges in sentiment, and the dollar is likelyto come under downward pressure onceagain, which would put upward pressure oninterest rates.
Table 1.6 explores the possible implicationsof higher interest rates. In this scenario, facedwith sustained downward pressure on the dol-lar, investors demand higher returns on U.S.-denominated assets to offset further expecteddepreciations. This, combined with concerns
P R O S P E C T S F O R T H E G L O B A L E C O N O M Y
19
Table 1.5 Impact of a 2 million bpd negative supply shock
2006 2007 2008 2009
Price of oil 90 70 44 40(Change from base line) 34 28 3 0
Change in GDP % of baselineWorld �1.0 �1.5 �1.1 0.2
High income �0.7 �1.3 �1.3 �0.3Middle income �1.6 �1.6 �0.1 1.4Large low income �1.7 �2.8 �1.8 0.7
Impact on inflation rateWorld 2.6 0.6 �0.9 �0.2
High income 1.4 0.0 �1.0 �0.4Middle income 5.8 2.0 �0.9 0.5Large low income 2.8 0.9 �0.7 �0.2
Impact on real interest rates (levels)World 1.0 0.2 �0.1 0.1
High income 1.0 0.1 �0.2 0.0Middle income 1.1 0.7 0.2 0.2Large low income 0.5 0.1 0.1 0.4
Impact on current account balance (% of GDP)World �1.1 �0.5 �0.1 �0.1
High income �1.1 �0.7 �0.2 �0.2Middle income �0.9 �0.2 �0.5 �0.3Large low income �1.9 �0.2 1.7 1.0
Impacts on low-income current account–constrained countries (1)Terms of trade �4.1 .. ..GDP �0.3 0.1 0.0Domestic demand �2.7 �1.1 0.0Current account balance �1.2 0.9 0
Source: World Bank.
Note: Impacts on low-income, current account–constrainedeconomies were estimates based on the terms-of-trade impactusing a purpose-built VAR model. Other estimates weresimulated using the World Bank’s macroeconomic simulationmodel.
GEP_001-024.qxd 11/1/05 2:17 PM Page 19

about rising debt and pension liabilities inindustrialized countries, and a more rapid dis-sipation of the temporary factors depressinglong-term interest rates, causes them to in-crease by some 200 basis points in high-income countries. Risk premia in developingeconomies increase by an additional 200 basispoints as investors’ appetites for risk decline.
The world economy reacts to the substan-tial tightening of monetary conditions by re-ducing global growth by half for a periodof two years, as higher interest rates cut intoinvestment and consumption demand, boththrough classic transmission mechanisms andvia the impact of interest rates on housing
prices and consumer wealth. Slower growtheases inflationary pressure and global ten-sions, including in the oil market. As mone-tary policy loosens in response to increasingoutput gaps, growth starts to pick up again,bringing output back to the levels in the base-line by the end of the simulation period.
Higher interest rates would also affect fi-nancing conditions for developing countriesby increasing future borrowing costs. Formany countries this will not pose a seriousshort-term risk, because they have taken ad-vantage of low rates to reduce the share ofshort-term debt relative to their overall debtand to prefinance some of their future bor-rowing needs. For others, particularly thosewith large debt-to-GDP ratios or those thathave accumulated large short-term debt posi-tions (figure 1.16), a rapid rise in interest rates
G L O B A L E C O N O M I C P R O S P E C T S 2 0 0 6
20
Table 1.6 Interest rate scenarios
2005 2006 2007 2008 2009
A. A 200 basis-point increase in interest rates and in spreads
Interest rates (change of Q4 level from baseline)World 1.8 1.4 �0.6 0.2 1.3
High income 1.7 1.1 �1.1 �0.3 0.9Low and middle
income 2.0 2.7 1.9 2.6 3.1
GDP (% change from baseline)World �0.1 �1.7 �2.9 �1.9 �0.6
High income 0.0 �1.5 �2.7 �2.5 �1.0Low and middle
income �0.2 �2.4 �3.5 �3.0 �1.5
Inflation (change in inflation rate)World 0.0 �0.3 �1.1 �1.1 �0.3
High income 0.0 �0.3 �1.5 �1.6 �0.5Low and middle
income 0.0 �0.3 0.7 1.2 0.9
B. Persistently low interest rates
Interest rates (change of Q4 level from baseline)World �0.7 �0.5 0.6 0.1 �0.6
High income �0.7 �0.5 0.8 0.1 �0.6Low and middle
income �0.8 �0.8 �0.1 �0.1 �0.7
GDP (% change from baseline)World 0.0 0.8 1.4 0.3 �0.5
High income 0.0 0.8 1.4 0.4 �0.5Low and middle
income 0.0 1.0 1.4 �0.1 �0.7
Inflation (change in inflation rate)World 0.0 0.2 0.6 0.6 0.1
High income 0.0 0.2 0.8 0.8 0.2Low and middle
income 0.0 0.1 �0.2 �0.5 �0.3
Source: World Bank.
Figure 1.16 Some countries are particularlyat risk
Debt/GNI ratio
Short-term debt/Total debt
35
200
Source: World Bank.
Guatemala
302520151050
Dominican Rep.
Ukraine
R.B. de Venezuela
Pakistan
Brazil
Paraguay
Bolivia
Jamaica
Philippines
Turkey
Ecuador
Indonesia
Uruguay
Papua New Guinea
Lebanon
Belize
Argentina
150100500
GEP_001-024.qxd 11/1/05 2:17 PM Page 20

could pose a real threat—particularly if therise in base interest rates also provokes a re-turn of spreads to more usual levels.
Alternatively, if excess liquidity and globalsavings prevent long-term interest rates fromrising as quickly as in the baseline scenario,the resulting higher levels of demand could in-crease tensions in commodity markets, includ-ing the oil market. In addition, lower interestrates could cause a number of economies, in-cluding the United States, to overheat, gener-ating additional inflation that forces a furthertightening of monetary policy. As a result,while growth would be initially higher, thesubsequent tightening of policy could provokea stronger-than-projected slowdown.
The depth of the cycle would depend im-portantly on the extent of the wealth effectgenerated by low interest rates on housingprices. The more pronounced, the deeper thecycle. Moreover, because asset prices becomeeven more out of step with their long-runlevels, an even longer period of slow growthcould be required to re-establish equilibrium.
Policy challengesPolicy can help reduce both the economicseverity of such unfavorable outturns and thelikelihood that they will materialize.
High oil prices will naturally induce substi-tution toward alternative energy sources andconservation. In the current context, wherethe increase in oil prices is expected to endure,countries that have not passed on recent pricehikes to consumers (and industry) may wishto revise their policies. Not only are the bud-getary costs of such subsidies likely to be dif-ficult to support, but these policies also im-pede adjustment.
Moreover, countries with restrictive rulesconcerning the exploitation of oil reservesmight wish to re-examine them. Such policiesmay deny these countries access to technicalexpertise and financial capital, thereby pre-venting them from investing in new produc-tion to the extent that they might otherwise.This may slow the aggregate supply responseand encourage greater conservation and sub-
stitution toward alternative energy sources—to the ultimate detriment of oil-producingcountries.
In the developed world, efforts to increaseenergy efficiency by developing more fuel-efficient technologies, such as hybrid cars,could well pay important dividends. Thesetechnologies are already economic in somecountries, where gasoline is heavily taxed, andcould generate substantial savings in overallfuel demand.23 In addition to the ecologicalbenefits, making such technology available indeveloping economies, where the increase intransportation-related energy demand is high-est, would be particularly effective in limitingoverall demand.
Finally, efforts to improve cooperation be-tween users and suppliers concerning the qual-ity and transparency of oil market data couldhelp reduce unwarranted volatility and per-haps contribute to lower prices by reducingthe oil-price risk premia.
To further dissipate the risk from globalimbalances, policies need to promote bothpublic and private savings in countries withlarge current account deficits. Recent mea-sures to tighten fiscal policy in the UnitedStates are headed in this direction, but moretightening is required. Tighter monetary pol-icy is helping. Higher interest rates in theUnited States promote private sector financingof the deficit but also promote private sectorsaving. In Europe, policymakers should seekto maintain low interest rates in an effort tostimulate demand. As output picks up, fiscalpolicy (rather than monetary policy) should beused to restrict demand, if necessary. Indeed,given unfunded public pension liabilities inthese countries, such a fiscal tightening is nec-essary in its own right.
Developing economies should react flexibly,seeking to maintain real effective exchangerates in line with their fundamentals, ratherthan a particular alignment with any one cur-rency. In this regard, recent steps by somecountries to adopt an exchange rate regimethat reflects their overall trade patterns arepositive and could be emulated by other
P R O S P E C T S F O R T H E G L O B A L E C O N O M Y
21
GEP_001-024.qxd 11/1/05 2:17 PM Page 21
countries. Petro-dollars could help reduce thelikelihood of a disruptive resolution of globalimbalances if they are recycled into the globaleconomy in a way that reduces tensions. Inparticular, the financing of investment expen-ditures both domestically and in other devel-oping countries would help stimulate demandoutside of the United States, reducing thatcountry’s current account deficit. To the extentthat these funds are invested in U.S. financialsecurities, they could also help finance the U.S.current account deficit.
Finally, global weakness could trigger in-creased protectionism or a slowing of tradeliberalization (which has been the basis formuch of developing countries’ recent success).The supply disruptions in Europe provoked bythe re-imposition of quotas on Chinese im-ports of textiles, following their liberalizationat the beginning of this year, is a good illus-tration of how trade restrictions work to thedetriment of both exporting and importingcountries. Not only should countries resist thetemptation to intervene in already liberalizeddomains, concerted efforts need to be made toachieve meaningful liberalization in the agri-cultural and service sectors in the Dohaprocess. To date, liberalization has largelyomitted the politically sensitive agriculturalsector, depriving many developing countriesof the benefits from trade liberalization thatmore manufacturing-oriented economies haveenjoyed.
Notes1. The Congressional Budget Office (2005) esti-
mates that hurricane Katrina reduced growth in theUnited States by 0.4 and 0.9 percent (annual rates) inthe third and fourth quarters.
2. The importance of China to aggregate statisticsis also visible in the industrial production data. Growthrates for all developing countries showed little slowing,but excluding China, annualized growth rates declinedfrom about 7.5 percent in mid 2004 to less than 5 per-cent a year later.
3. Although oil prices are projected to decline dur-ing 2006, they will be higher, on average, than in 2005.
4. The number of working days each year varies,generally because certain holidays do or do not fall on
weekends. Occasionally, these fluctuations can have animportant impact on annual GDP growth. While fivefewer days corresponds to roughly a 2.5 percent re-duction in working time, in general, the actual reduc-tion in production is less pronounced.
5. These losses are estimated at more than 5 per-cent of GDP for Antigua and Barbuda, Belize, Guyana,Honduras, Nicaragua, and Jamaica.
6. This year’s projections differ somewhat from2004’s partly because of a shift in the base year for cal-culations from 2001 to 2002, which reduces thepoverty level of the starting year in all regions thathave experienced positive per capita growth. In addi-tion, new survey data was employed for a large num-ber of countries (more than half in the Europe andCentral Asia region), including important new house-hold surveys in a number of Latin American countriesin the place of labor force survey data used in the past.Finally, revisions to national income estimates ofGDP, inflation, and consumption play a role. For moreinformation concerning the changes to the povertyforecast, please visit the Long-term Prospects andPoverty Forecasts section of http://www.worldbank.org/globaloutlook.
7. The extent to which the new regime will con-tribute to increased stability in world markets will alsodepend on the extent to which other Asian currenciesfollow suit, and how much flexibility is permitted inpractice.
8. As of August 2005, overall financing for emerg-ing market sovereign debt was already 74 percentfunded; this share reached 93 percent for emergingEurope and Turkey, and 100 percent for Latin America.
9. Long-term interest rates tend to be determinedby the long-term growth potential of the economy andexpected inflation. Historically, temporary factors havecaused them to deviate from this measure, sometimesfor extended periods of time. However, they have al-ways tended to return to this level.
10. In the first half of 2005, producer price infla-tion exceeded 15 percent in the Europe and CentralAsia region, was more than 9 percent in Latin Americaand the Caribbean, about 7 percent in the MiddleEast and North Africa, and around 6 percent in bothEast and South Asia.
11. The stock of housing in the United States is es-timated by the Federal Reserve Bank to be equal to$15.2 trillion, or about 138 percent of GDP. A 10 per-cent change in the value of that stock would represent13.8 percent of GDP, or 19 percent of consumption.Econometric estimates suggest that the long-term mar-ginal propensity to consume from housing wealth is0.05 (see, for example Catte and others 2004 andBenjamin, Chinloy, and Jud 2004), implying a reduc-tion in consumption of 1.35 percent.
G L O B A L E C O N O M I C P R O S P E C T S 2 0 0 6
22
GEP_001-024.qxd 11/1/05 2:17 PM Page 22
12. Very few low- and middle-income countrieshave housing data similar to the data available in high-income countries; and what does exist tends to belimited to wealthy neighborhoods in single cities.Moreover, there is little information on home owner-ship ratios, and mortgage-market completeness—allcritical components in determining housing-marketwealth effects.
13. The U.S. Department of Energy estimates thatboth oil and gasoline consumption fell by 2.5 or morepercent in September 2005.
14. In the second quarter, stocks equaled 54 daysworth of consumption versus an average of more than58 days during the first half of the 1990s.
15. Some oil fields can be brought into productionwithin 1 year, but others would take as long as 10 years.Three to five years would be needed to bring in two mil-lion barrels per day over and above expected increasesin demand.
16. Opportunities for demand substitution may beless plentiful than in the 1970s because of the substan-tial conservation steps undertaken then. Nevertheless,use of fuel-efficient cars and less intensive use ofexisting cars can have substantial impacts on overalldemand.
17. Simple average of 32 oil-importing Sub-Saharan economies.
18. Among countries that did not pass pricesthrough fully, fuel subsidy spending rose substantially,for instance in the Central African Republic, GuineaBissau, Malawi, and the Seychelles.
19. In 2003, high-tech products represented 13 per-cent of Thailand’s exports, but more than 50 percent ofTaiwanese, Malaysian, and Philippine exports.
20. China here is taken as the sum of Hong Kong,Macao, and China, based on the assumption that priorto liberalization some of the exports from Hong Kongand Macao had actually originated in China, andtherefore, the changes in their market share reported inofficial statistics are exaggerated.
21. During the 1980s (and before), OPEC acted asa swing producer, stepping up production in responseto shortfalls elsewhere. With its spare capacity nowmeasured at less than 2 million barrels per day, itscapacity to act as a swing producer is limited.
22. Beccue and Huntington (2005) estimate thatthe probability of such a disruption occurring duringthe next 10 years is high (70 percent for one lasting6 months and 35 percent for one of 18 months).
23. In the United States, for example, hybrid carscurrently offer approximately an 80 percent improve-ment in fuel efficiency. Were these vehicles to gain a10 percent share of new car sales, new energy demandwould be reduced by about 12 percent (c. 0.3 percent-age points) per year for about seven years.
ReferencesBeccue, Phillip C., and Hillard G. Huntington. 2005.
“An Assessment of Oil Market DisruptionRisks.” In Final Report EMF SR 8. Energy Mod-eling Forum. October.
Benjamin, J.D., P. Chinloy, and G.D. Jud. 2004. “RealEstate versus Financial Wealth in Consumption.”Journal of Real Estate Finance and Economics29(3): 341–54.
Catte, P., N. Girouard, R. Price, and C. André. 2004.“Housing Markets, Wealth and the BusinessCycle.” Economics Department Working Paper394. OECD, Paris.
Congressional Budget Office. 2005. “Macroeconomicand Budgetary Effects of Hurricane Katrina.”Report. September 6. Washington, DC.
Huntington, Hillard G. 2005. “The Economic Conse-quences of Higher Crude Oil Prices.” In FinalReport EMF SR 9. Energy Modeling Forum,October.
International Energy Agency. 2004. World EnergyOutlook. Paris.
IMF (International Monetary Fund). 2005. WorldEconomic Outlook. Washington, DC.
OECD (Organisation for Economic Co-operation andDevelopment). 2004. Economic Outlook, no. 74.Paris.
World Bank. 2005. Global Development Finance2005. Washington, DC.
P R O S P E C T S F O R T H E G L O B A L E C O N O M Y
23
GEP_001-024.qxd 11/1/05 2:17 PM Page 23

East Asia and Pacific regionalprospects
Recent developmentsGDP in the East Asia and Pacific regionincreased about 7.8 percent in 2005, downfrom 8.3 percent the year before (table A.1).This robust growth at the aggregate level masksdivergent performance among individual coun-tries, with economic activity in China havinggrown 9.3 percent and countries in the rest ofthe region up a more moderate 5.1 percent.
Responding to administrative controls oninvestments, domestic demand in Chinaslowed during the first half of 2005. However,GDP growth remained strong, because importdemand increased by only 14 percent in dollarterms, while exports maintained their rapidgrowth of 29 percent. In the third quarter, do-mestic demand growth recovered. As a result,import growth picked up, which, combinedwith slower exports, reduced the contributionof net exports to growth. Nevertheless, net ex-ports were responsible for more than one-third
25
AppendixRegional Economic Prospects
Table A.1 East Asia and Pacific forecast summaryAnnual percent change (unless otherwise indicated)
Estimate Forecast
1991–2000a 2002 2003 2004 2005 2006 2007 2007–2015a
GDP at market prices (1995 US$)b 7.6 7.0 8.1 8.3 7.8 7.6 7.4 6.1GDP per capita (units in US$) 6.6 6.0 7.2 7.3 7.0 6.8 6.5 5.3PPP GDPc 8.2 7.4 8.6 8.7 8.4 8.0 7.7
Private consumption 6.7 5.4 6.0 7.2 5.1 6.4 6.3Public consumption 7.7 7.4 5.5 6.0 1.5 4.1 3.6Fixed investment 8.8 13.5 16.3 7.2 6.7 12.0 10.2Exports, GNFSd 10.7 14.8 17.4 20.5 16.6 11.6 11.0Imports, GNFSd 10.1 15.9 16.9 19.0 12.1 13.4 11.8
Net exports, contribution to growth 0.3 0.2 0.8 1.4 2.7 0.0 0.4Current account balance/GDP (%) 0.8 3.5 3.5 3.9 4.8 4.7 4.0GDP deflator (median, LCU) 5.9 4.1 3.2 4.4 5.2 4.3 4.3Fiscal balance/GDP (%) �1.4 �3.3 �2.6 �1.7 �1.5 �1.2 �0.9
Memorandum items: GDP
East Asia, excluding China 4.2 4.8 5.6 6.0 5.1 5.5 5.7
Source: World Bank.Notes: a. Growth rates over intervals are compound averages; growth contributions, ratios, and the GDP deflator are averages.
b. GDP measured in constant 1995 U.S. dollars.c. GDP measured at PPP exchange rates.d. Exports and imports of goods and non-factor services.
GEP_25-46.qxd 11/1/05 2:35 PM Page 25

of total growth in 2005 (figure A.1), and thecurrent account surplus is expected to reachmore than 6 percent of GDP, or about $120billion.
A slowdown in global demand for high-tech products and the more moderate expan-sion in demand from China had major impactson other East Asian developing economies.Chinese import growth (in dollar terms) fromthese economies fell from 35–40 percent, toabout 15 percent in the first half of 2005,yielding a substantial reduction in the contri-bution of net exports to growth.
Higher oil prices also played a role in theslowdown in regional domestic demand andcontributed to more than a 3 percent of GDP de-terioration in the current account balance ofregional oil importers (excluding China). Highoil prices generated cumulative terms-of-tradelosses of 1–2 percent of East Asian GDP in2004–5, or approximately 0.5–1 percent a year.Several oil importers (Cambodia, Korea, LaoPDR, Philippines, and Thailand) experiencedmore significant losses of between 1.5–2 percentof GDP in each of the two years. The impacts ongrowth, while significant, were more mutedthan these first-order effects. Thailand, for ex-ample, estimates that high oil prices reduced its2005 growth by half a percentage point.
Consumer and business confidence in theregion have generally held up. While centralbanks have gradually tightened monetary pol-icy, interest rates in real terms remain low byhistorical standards. Private consumption andinvestment growth did not slow as sharply asduring previous oil price shocks. In part, thisreflects government interventions that limitedthe pass-through of higher oil prices via vari-ous forms of explicit and implicit subsidy.However, as the fiscal burden of these subsidieshas increased, several governments have un-dertaken adjustments to bring domestic hydro-carbon prices in line with market prices. Themost significant adjustment was made byIndonesia on September 30. Price increasesranged from 88 percent for gasoline to 186 per-cent for kerosene. A cash compensation pro-gram softened the impact on the poor.
Medium-term outlookGrowth in the region is projected to slow fur-ther over the next two years, with GDP ex-panding by about 7.4 percent in 2007. Thepace of the Chinese expansion is projected toease somewhat, as a result of both more rapiddomestic demand and a return of exportgrowth to more sustainable levels as the tran-sitional boost to trade, reforms, and invest-ment associated with accession to the WorldTrade Organization wears off. Within the restof the region, economic activity is expected tostrengthen somewhat. GDP should expand byabout 5.7 percent in 2007, as a projected up-turn in world demand for the region’s exports,notably high-tech goods1 (see figure A.2), par-tially offsets the dampening effect of high oilprices.
It is anticipated that high oil prices andstrong import demand in China will result ina deterioration of the region’s current accountposition from a 4.8 percent of GDP surplusthis year to 4.0 percent in 2007. While high oilprices are projected to increase regionalinflation to around 5.2 percent this year, pru-dent monetary policy and flexible marketsshould prevent an inflationary spiral fromdeveloping.
G L O B A L E C O N O M I C P R O S P E C T S 2 0 0 6
26
% of previous year’s GDP
Source: World Bank.
2002
Figure A.1 Contributions to China’sgrowth
2003 2004 2005�4
�2
0
8
4
12
6
2
10
Consumption Investment
Net exports GDP
GEP_25-46.qxd 11/1/05 2:35 PM Page 26

Risks and uncertaintiesThis relatively benign outlook is subject tosignificant risks. Further substantial oil priceincreases would likely pose a more significantdrag on growth by depressing confidence andby inducing more substantial monetary tight-ening. Although East Asia’s reliance on theUnited States as an export market has declinedover the last decade, the dependence remainssignificant. A severe adjustment of globalmacroeconomic imbalances involving reces-sion in the United States would have a seriousimpact on East Asian exports and growth.
China’s economy is projected to continuegrowing strongly. However, the recent oscilla-tions in investment demand and the large con-tribution of the external sector to growth thisyear raise some concerns about the sustain-ability of this high growth over the mediumterm. The resurgence of domestic demand,particularly consumer demand, contained inthe baseline scenario may be difficult toachieve. Without it, given the already high lev-els of investment, a sharp cyclical downswingcannot be ruled out. Such a downswing wouldbe painful, both for China and for its majortrading partners in the region.
Longer-term prospectsRegional growth prospects for the next decaderemain very favorable. Since the 1997 financialcrisis, GDP has expanded 6.8 percent a year onaverage, and real per capita incomes have risenby more than 6 percent a year. While much ofthis strength reflects the very rapid growth inChina (8.1 percent on average), the rest of theregion also enjoyed robust per capita incomegrowth of about 4.5 percent. Over the period2006–15, regional per capita incomes are pro-jected to continue rising rapidly, by about5.3 percent a year in real terms.
While China is likely to see a rebalancingof aggregate demand from investment towarda greater reliance on consumption, there isscope for increasing investment rates in manyother economies within the region. Here,structural reforms could improve the invest-ment climate by increasing the transparencyand predictability of government policies, sim-plifying business regulations, improving cost-effective delivery of infrastructure and logis-tics services, and strengthening institutions forupgrading worker skills. Financial market in-struments, such as local government bonds,corporate debt, asset securitization, and ven-ture capital funds, have seen strong growthsince the crisis. These could be further fos-tered by reforms that strengthen market infra-structure, raise accounting and auditing stan-dards, and rationalize the policy, legal, andregulatory frameworks for these types of mar-kets. Ongoing efforts to strengthen insolvencylaws and foreclosure practices remain particu-larly important. Reforms to strengthen publicsector governance could significantly improvestates’ ability to deliver key public goods andservices.
Europe and Central Asia regionalprospectsRecent developmentsGDP in the Europe and Central Asia region in-creased by an estimated 5.3 percent in 2005,close to trend growth, but was much slower
R E G I O N A L E C O N O M I C P R O S P E C T S
27
% change, seasonally adjusted annual rate
Source: World Bank; Semiconductor Industries Assn (SIA),Haver and Datastream.
Figure A.2 Signs of a turnaround in globalhigh-tech markets
�20
�10
0
Jan.
200
3
40
20
60
World semiconductor sales, $
EAP high-tech exports
30
10
50
May
200
3
Sept.
2003
Jan.
200
4
May
200
4
Sept.
2004
Jan.
200
5
May
200
5
GEP_25-46.qxd 11/1/05 2:35 PM Page 27

than in 2004, when it grew 7.2 percent (tableA.2). The slowdown, which began in mid-2004, was most marked in the Ukraine andTurkey, where growth is estimated to havedeclined from unsustainably high rates of 12.1and 8.9 percent, respectively, to still robustrates of 4.4 and 4.8 percent in 2005. Exclud-ing these countries from the aggregate, theslowdown was more modest, from 6.6 to 5.4percent. Two exceptions to the regionwide de-celeration were Azerbaijan, where growth hasbeen underpinned by a rapid rise in oil pro-duction, and the Czech Republic, where strongexport volumes have more than offset sluggishdemand conditions.
High oil prices, an easing of the investmentboom associated with EU accession, and a re-turn to more sustainable growth rates wereamong the most important reasons for theslowing of growth in oil importing countries.These factors contributed to a weakening indomestic demand that was most apparentin Poland, Turkey, and Ukraine. Unrest inUzbekistan and the Kyrgyz Republic had an
additional negative impact on confidence andgrowth in those countries. Overall, growthamong oil importers (excluding Turkey andUkraine) slowed from 5.7 to 4.4 percent.
Capacity constraints, and a less rapid in-crease in oil revenues, served to slow growthin regional oil exporters as well, where GDPincreased 6.3 percent in 2005, down from7.4 percent the year before. In Russia, slowerinvestment in the oil sector compounded theseeffects; however, in aggregate, investmentgrowth has strengthened, which, coupled withrobust private consumption, has maintaineddemand growth at high levels, even as the ex-pansion of exports and industrial productionhas eased.
In Turkey, weaker domestic demand wastied, in part, to higher taxes cutting into con-sumption spending and some dampening ofconfidence following the French and Dutch re-jections of the proposed EU constitution earlyin the year. Since then, Turkey and Croatiahave begun formal accession negotiationswith the EU, which is expected to lift growth
G L O B A L E C O N O M I C P R O S P E C T S 2 0 0 6
28
Table A.2 Europe and Central Asia forecast summaryAnnual percent change (unless otherwise indicated)
Estimate Forecast
1991–2000a 2002 2003 2004 2005 2006 2007 2007–2015a
GDP at market prices (1995 US$)b �1.1 4.7 6.1 7.2 5.3 5.2 5.0 3.5GDP per capita (units in US$) �0.4 4.8 6.2 7.3 5.3 5.2 5.1 3.6PPP GDPc �1.3 4.8 6.4 7.5 5.5 5.4 5.2
Private consumption 0.4 5.9 6.5 8.4 6.8 6.3 6.2Public consumption �0.5 2.5 2.4 2.2 2.9 3.0 2.9Fixed investment �6.7 2.9 10.4 14.7 5.6 7.2 6.7Exports, GNFSd 3.9 8.1 11.5 13.5 9.3 9.5 8.8Imports, GNFSd 2.3 9.4 14.5 14.7 11.3 10.9 9.9
Net exports, contribution to growth 0.6 �0.4 �1.1 �0.5 �1.0 �0.8 �0.7Current account balance/GDP (%) �0.5 0.5 �0.1 0.8 1.8 1.4 1.0GDP deflator (median, LCU) 120.3 4.0 5.1 6.4 6.2 5.3 4.6Fiscal balance/GDP (%) �2.6 �4.5 �4.2 �1.6 �0.2 �0.2 �0.2
Memorandum items: GDP
Transition countries 2.5 4.4 4.6 6.6 4.4 4.6 4.6Central and Eastern Europe 2.5 2.8 4.0 5.4 4.2 4.4 4.7Commonwealth of Independent States �3.2 5.0 7.7 7.9 6.2 5.8 5.4
Source: World Bank.Notes: a. Growth rates over intervals are compound averages; growth contributions, ratios, and the GDP deflator are averages.
b. GDP measured in constant 1995 U.S. dollars.c. GDP measured at PPP exchange rates.d. Exports and imports of goods and non-factor services.
GEP_25-46.qxd 11/1/05 2:35 PM Page 28

in the fourth quarter. Turkey has remained ontrack to meet IMF targets and is expected tocomplete its first review of the IMF’s newstand-by facility by end-2005.
Overall, the regional current account sur-plus has widened to 1.8 percent of GDP in2005, up from 0.8 percent in 2004. Higherrevenues improved the current account posi-tion of oil exporters by some 2.7 percent oftheir GDP, while weaker domestic demandand import growth limited the deteriorationof oil importers’ current account balance toan estimated 0.4 percent of GDP. In Turkey,the current account deficit is expected toreach 6.1 percent of GDP this year, a level as-sociated with past financial crises. However,in addition to oil imports, a significant pro-portion of the deficit reflects imports of in-vestment goods (as opposed to consumption),which augurs better for the longer-term sus-tainability of the deficit.2 While largely fi-nanced by strong FDI inflows, current accountdeficits remain very high in a number of coun-tries across the region, including in Azerbaijan,Bosnia and Herzegovina, Bulgaria, Estonia,Georgia, Hungary, Latvia, Lithuania, FYRMacedonia, and Romania.
Inflationary pressures in the region are gen-erally on the rise, driven by high oil prices,and in some cases by strong private consump-tion growth. In Russia, for instance, inflationwas boosted by social spending (fundedby high oil rents), and is expected to reach10 percent by end-2005, well above the origi-nal target of 8.5 percent. In Turkey, inflationremained stable and on target, and, despitehigh oil prices, core inflation has continueddeclining. The upward trend in prices in manycountries in the region was partially offset bya return to trend inflation rates in the new EUmember states, following a jump in 2004 inbase prices associated with their accession.
Overall, the stance of monetary policyremained stable. Some countries, such asPoland, responded to the weakening ofgrowth by relaxing policy, while in others,such as Russia, rising inflation sparked a mod-est tightening of policy. Exchange rates also
remained broadly stable, with those of thenew member states generally following theeuro. However, changes in current accountpositions were reflected in the movements ofthe Russian ruble (appreciation) and Turkishlira (depreciation).
Medium-term outlookRegional growth is expected to stabilize overthe next two years, slowing moderately toabout 5.0 percent in 2007. Growth among oilimporters is projected to accelerate from4.5 percent to 4.7 percent, as oil prices ease,and the projected expansion in industrializedEurope takes hold. A stabilization and evenfall of oil revenues, as prices ease, will slowthe pace of growth among oil exporters from6.3 percent to 5.5 percent. Moderately loweroil prices should also help improve the currentaccount positions of oil importers and con-tribute to a deceleration of inflation in 2006and 2007.
At the subregional level, growth among theeconomies of the Commonwealth of Indepen-dent States (CIS) is projected at 5.8 and 5.4percent in 2006 and 2007, respectively. Theywill continue to outpace Central and EasternEuropean countries (including Turkey), wheregrowth is forecast to expand by about 4.4 per-cent in 2006 and 4.7 percent in 2007. Thecirculation of oil rents via fiscal linkages isprojected to stimulate strong private consump-tion in Russia, in particular, because there aresignificant pressures to tap into high oil rents.Growth in Azerbaijan and Kazakhstan willbenefit from rapidly expanding oil productionand export volumes. Neighboring countries,including Turkey, are expected to benefit fromcontinued healthy import demand emanatingfrom the region’s oil-exporting economies, andsome, such as Georgia, from a rise in revenuesfrom oil transit fees.
Among the Central and Eastern Europeaneconomies, continued strong investment in-flows, especially for the new EU memberstates, are projected to support growth. Thesecountries will also continue to benefit fromincreased market penetration into the EU,
R E G I O N A L E C O N O M I C P R O S P E C T S
29
GEP_25-46.qxd 11/1/05 2:35 PM Page 29

although this trend is likely to moderate as in-tegration progresses. Similar forces and thebenefits of accession-inspired reforms shouldbolster investment and GDP growth inBulgaria, Croatia, and Romania, which mayjoin the EU in 2007 or 2008. The overall out-look in Turkey remains healthy, and the coun-try remains on track to meet IMF programtargets. Fiscal consolidation and recent re-forms have placed the country on a muchstronger footing, although its current accountdeficit is expected to remain high.
Risks and uncertaintiesFor the middle-income countries of the region,the most serious risk to this relatively benignoutlook stems from the possibility that inter-est rates may rise much more rapidly than pro-jected. Higher interest rates would slow thepace of investment growth and external de-mand, two major drivers of regional growth(figure A.3). In addition, for the highly in-debted countries in the region, higher interestrates would exacerbate already high currentaccount deficits as well as place governments’fiscal positions under strain. This is especiallyworrisome because fiscal policies in manycountries are already under pressure fromhigh social security and pension obligations.
For the less-developed, oil-importingeconomies, which tend to be more energy
intensive, the possibility that oil prices mayrise further could be the more serious risk.Estimates suggest that, for a number of coun-tries,3 a further $30 hike in oil prices couldimpose an additional terms-of-trade shock ofbetween 2 and 8 percent of GDP, implyingsubstantial disruptions in domestic demandand worrisome consequences for poverty alle-viation efforts (figure A.4).
Hydrocarbon-exporting countries, such asAzerbaijan, Kazakhstan, and Russia, face pol-icy challenges tied to their windfall oil rev-enues. They must ensure good governance ofthese revenues and diversify their economicactivity so that they can reduce their depen-dence on extractive industries.
An additional risk is that less supportiveeconomic conditions could strain fragile polit-ical institutions in some Central Asian states,leading to significant economic disruption.
Longer-term prospectsGDP in the Central and Eastern Europeancountries over the next 15 years is projected toexpand much more quickly than during thefirst 10 years of transition. Growth shouldcontinue to be led by high investment rates(both foreign and domestic), rising intrare-gional trade, and expansion in world marketshare as these countries continue to reap thebenefits of the extensive structural reformsthey have implemented. Performance is ex-pected to improve especially in Bulgaria andRomania as they implement structural reformsin preparation for joining the EU—sometimeduring 2007–8. Turkey and Croatia shouldalso benefit, although their accession is not ex-pected before 2010. If implemented, continuedimprovements in the policy environment, in-cluding greater macroeconomic stability,should help to underpin the projected highergrowth rates.
Although the structural reform process inmany CIS countries is progressing, it is stillless advanced than in the Central and EasternEuropean countries. As a result, long-termgrowth prospects for the subregion are lower.Indeed, some CIS countries have demon-
G L O B A L E C O N O M I C P R O S P E C T S 2 0 0 6
30
% of GDP
Source: World Bank.
Bulgar
ia
Figure A.3 External positions could comeunder pressure with rising interest rates
Croat
ia
Hunga
ry
Mold
ova
Roman
ia
Serbia
and
Mon
tene
gro
Turke
y0
20
10
30
External debt service
Current account deficit
Note: Data are for 2004.
GEP_25-46.qxd 11/1/05 2:35 PM Page 30
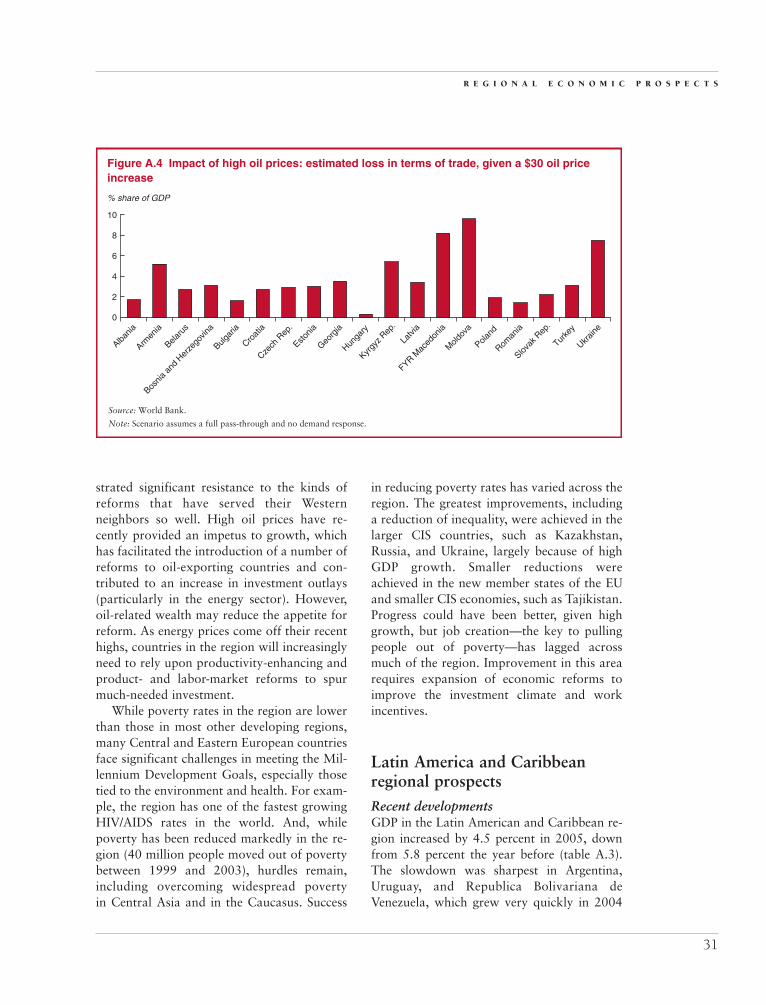
strated significant resistance to the kinds ofreforms that have served their Westernneighbors so well. High oil prices have re-cently provided an impetus to growth, whichhas facilitated the introduction of a number ofreforms to oil-exporting countries and con-tributed to an increase in investment outlays(particularly in the energy sector). However,oil-related wealth may reduce the appetite forreform. As energy prices come off their recenthighs, countries in the region will increasinglyneed to rely upon productivity-enhancing andproduct- and labor-market reforms to spurmuch-needed investment.
While poverty rates in the region are lowerthan those in most other developing regions,many Central and Eastern European countriesface significant challenges in meeting the Mil-lennium Development Goals, especially thosetied to the environment and health. For exam-ple, the region has one of the fastest growingHIV/AIDS rates in the world. And, whilepoverty has been reduced markedly in the re-gion (40 million people moved out of povertybetween 1999 and 2003), hurdles remain,including overcoming widespread povertyin Central Asia and in the Caucasus. Success
in reducing poverty rates has varied across theregion. The greatest improvements, includinga reduction of inequality, were achieved in thelarger CIS countries, such as Kazakhstan,Russia, and Ukraine, largely because of highGDP growth. Smaller reductions wereachieved in the new member states of the EUand smaller CIS economies, such as Tajikistan.Progress could have been better, given highgrowth, but job creation—the key to pullingpeople out of poverty—has lagged acrossmuch of the region. Improvement in this arearequires expansion of economic reforms toimprove the investment climate and workincentives.
Latin America and Caribbeanregional prospectsRecent developmentsGDP in the Latin American and Caribbean re-gion increased by 4.5 percent in 2005, downfrom 5.8 percent the year before (table A.3).The slowdown was sharpest in Argentina,Uruguay, and Republica Bolivariana deVenezuela, which grew very quickly in 2004
R E G I O N A L E C O N O M I C P R O S P E C T S
31
Figure A.4 Impact of high oil prices: estimated loss in terms of trade, given a $30 oil priceincrease
Albania
% share of GDP
Armen
ia
Belaru
s
Bosnia
and
Her
zego
vina
Bulgar
ia
Croat
ia
Czech
Rep
.
Estonia
Georg
ia
Hunga
ry
Kyrgy
z Rep
.
Latvi
a
FYR Mac
edon
ia
Mold
ova
Poland
Roman
ia
Slovak
Rep
.
Turke
y
Ukrain
e0
10
8
6
4
2
Source: World Bank.
Note: Scenario assumes a full pass-through and no demand response.
GEP_25-46.qxd 11/1/05 2:35 PM Page 31

and have now regained much of their lost out-put following deep recessions. Excluding thesecountries, regional growth slowed less, from4.7 to 3.9 percent, with much of the slow-down explained by weak first quarter resultsin Brazil and Mexico (growth in these coun-tries has since picked up). Other countries(Bolivia, Chile, Colombia, Peru, and most ofthose in Central America) continued to growat the same rates as in 2004. Thus, despite themore moderate rate of expansion, growth inthe region remained strong and well above the2.5 percent average growth of the preceding20 years.
This strong performance reflects supportiveexternal conditions and an improved domesticpolicy environment. While down from lastyear’s highs, global GDP and trade growthremain robust at 3.1 and 6.2 percent, respec-tively. This rapid growth and capacity con-straints pushed commodity prices to high lev-els (although some non-oil commodity priceswere easing),4 and these boosted regionalincomes and domestic demand.
Low interest rates and a substantial reduc-tion in investors’ perceptions of the risk asso-ciated with the region also contributed to im-proved investment (up 11.0 percent) andincreased capital inflows. Spreads on LatinAmerican bonds fell to about 300 basis pointsas of October 2005, less than half their aver-age level during 2000–3.
While a global liquidity glut was partly re-sponsible for these declines, reduced financingrequirements, more reliance on domestic debt,trade liberalization, the adoption of more flex-ible exchange rates, and more prudent fiscalmanagement—in addition to falling debt-to-GDP ratios (table A.4)—underpinned thesedeclines in risk premia. Indeed, in contrast toU.S. corporate bonds, whose risk premia in-creased recently, the risk premia on LatinAmerican sovereigns remained broadly stableas the Federal Reserve Bank has tightenedmonetary policy (Figure A.5).
Intense activity levels and high oil priceshave resulted in rising inflation in severalcountries,5 but it is declining in several others.
G L O B A L E C O N O M I C P R O S P E C T S 2 0 0 6
32
Table A.3 Latin America and Caribbean forecast summaryAnnual percent change (unless otherwise indicated)
Estimate Forecast
1991–2000a 2002 2003 2004 2005 2006 2007 2007–2015a
GDP at market prices (1995 US$)b 2.8 �0.6 2.1 5.8 4.5 3.8 3.6 3.6GDP per capita (units in US$) 1.3 �2.0 0.6 4.3 3.1 2.4 2.3 2.4PPP GDPc 3.0 0.1 2.1 5.5 4.4 3.8 3.6
Private consumption 3.6 �2.0 1.2 5.4 3.7 3.5 3.3Public consumption 2.0 �0.3 1.3 1.2 3.8 3.5 2.3Fixed investment 3.2 �7.1 0.5 12.8 11.0 8.3 6.1Exports, GNFSd 7.9 2.2 5.2 12.4 6.2 6.6 7.5Imports, GNFSd 8.9 �6.4 2.3 12.4 9.5 9.0 8.2
Net exports, contribution to growth �0.2 1.9 0.6 0.2 �0.7 �0.5 �0.2Current account balance/GDP (%) �2.8 �0.8 0.7 1.2 0.9 0.0 �0.7GDP deflator (median, LCU) 10.0 5.9 9.0 8.2 7.6 6.3 4.7Fiscal balance/GDP (%) �2.7 �3.0 �2.7 �1.6 �1.8 �1.9 �1.3
Memorandum items: GDP
LAC excluding Argentina 3.1 1.2 1.1 5.2 3.8 3.8 3.6Central America 4.0 2.7 2.2 3.1 3.0 2.9 2.9Caribbean 4.3 4.3 3.0 2.3 3.4 4.6 4.1
Source: World Bank.Notes: a. Growth rates over intervals are compound averages; growth contributions, ratios, and the GDP deflator are averages.
b. GDP measured in constant 1995 U.S. dollars.c. GDP measured at PPP exchange rates.d. Exports and imports of goods and non-factor services.
GEP_25-46.qxd 11/1/05 2:35 PM Page 32

For the region as a whole, inflation has easedover the past six months and stood at around5 percent in September 2005, well below the7.4 percent peak recorded in the second quar-ter of 2003.
Medium-term outlookAcross the region, GDP is projected to slowfurther—to around 3.6 percent by 2007. Thisis partly a reflection of a return to more sus-tainable growth rates (capacity utilizationrates in many countries are at historically highlevels) and partly the influence of external fac-tors. High oil prices are expected to constraindomestic demand in oil importers—especiallyin the Caribbean region, where dependence onimported oil for electrical generation is partic-ularly acute.
The extent of the net income loss associ-ated with high oil prices in this region is ex-pected to be much sharper this year and inyears to come, because non-oil commodityprices are not expected to increase as they didduring 2000–3. In particular, increased globalsupply and liberalization of EU sugar pricesare expected to soften commodity prices andexport earnings for the agricultural exportersin general and especially for the Caribbeancountries.
For metals and minerals exporters, pros-pects are better. Although there are signs ofeasing in world demand for some of thesecommodities, inventories remain tight, andprices are expected to begin easing only in2006. Growth among exporters of these com-modities is projected to slow somewhat, asthe contribution to growth from commodity-sector incomes and production declines.
Economic activity is also expected to slowamong regional oil exporters because ofcapacity constraints in the production of oiland a stabilization of oil revenues. GDP inthese countries, as a group, is projected toexpand by 3.9 and 3.6 percent in 2006 and2007, respectively.
Overall, high oil prices and the easing ofnon-oil commodity prices are expected tocause the current account balances of oilimporters to deteriorate by about 0.8 percentof GDP in 2006, in addition to the estimated1.9 percentage point deterioration in 2005.Rising imports among oil exporters shouldlimit the improvement in their current accountbalances, and as a result, the current account
R E G I O N A L E C O N O M I C P R O S P E C T S
33
Table A.4 Latin America and Caribbeandebt ratios
Debt serv. as % of Debt as % of GDP exports
1995 2000 2004 1995 2000 2004
Argentina 38 52 112 36 87 –Bolivia 79 69 – 30 43 18Brazil 23 40 35 44 100 47Chile 34 50 47 26 29 28Colombia 27 41 39 35 33 42Ecuador 69 86 56 27 32 43El Salvador 27 32 40 14 9 19Guatemala 25 18 19 12 8 9Honduras 121 88 100 18 15Jamaica 79 59 71 20 20 21Mexico 58 26 21 29 33 17Nicaragua 324 174 – 44 26 –Panama 77 55 65 4 11 17Paraguay 29 40 45 6 12 18Peru 57 54 44 18 30 28Uruguay 28 41 87 25 36 50R. B de Ven. 47 33 34 25 18 18Unweighted
Average 67 56 54 25 32 26
Source: World Bank.
Note: – Data not available.
Basis points
Source: Datastream.
Figure A.5 Regional interest rate spreadsremain low
0
200
400
Jan.
2002
1,200
800
1,600
U.S. junk bonds
Latin America sovereign debt
1,000
600
1,400
July
2002
Jan.
2003
July
2003
Jan.
2004
July
2004
Jan.
2005
July
2005
GEP_25-46.qxd 11/1/05 2:35 PM Page 33

deficit of the region as a whole is projected toremain close to balance in 2006 and 2007.
A number of countries (particularly the oilexporters) subsidize various petroleum prices,implying a substantial fiscal cost,6 as energyprices have increased. Therefore, for oil im-porters, general government deficits are pro-jected to deteriorate unless the authoritiesreduce the rate of subsidization. For oil ex-porters, the problem manifests itself more interms of foregone revenues, failure to paydown debt, and (because domestic prices re-main low) an energy inefficient economicstructure.
Political election cycles may affect growthprospects in the medium term. Among majorLatin American countries, Brazil, Colombia,Mexico, and Peru will have elections in 2006(Republica Bolivariana de Venezuela’s electionis scheduled for December 2005; and Bolivia,Costa Rica, Dominican Republic, and ElSalvador will have elections in 2006–7). Whilesome pre-electoral upsurge in governmentspending will probably be observed, the realrisk from the political cycle is that few sub-stantive structural reforms are likely to be ini-tiated or concluded in these countries untilelections are complete.
Risks and uncertaintiesThe future path of interest rates and risk pre-mia represent a key risk for the region, partic-ularly for highly indebted countries and thosealready facing large current account deficits.Such an increase could be triggered by an oilshock (see chapter 1), concerns about the sus-tainability of developed countries’ fiscal poli-cies, or the financing of the U.S. current ac-count deficit. Most countries in the regionhave taken advantage of low interest rates torestructure debt and reduce their exposure tointerest-rate risk. Historically, high reservesto external short-term debt ratios imply greatlyreduced liquidity risks. Lower indebtedness,more reliance on domestic debt, and more de-veloped derivative markets imply that bothcorporate and sovereign balance sheet risks(especially currency risks) are much lower
than what they had been, say, in the mid-1990s. Moreover, there are no credit boomscurrently in the region as there were duringpast expansions. Because the banks are bettercapitalized, regulated, and supervised, aneventual interest rate hike and capital flowsreversal is less likely to lead to financial crisesthan in the past.
Nevertheless, a 200-basis-point rise inworld interest rates, and the accompanyingglobal slowdown, would have serious conse-quences for the region. Simulations suggestthat such a hike in interest rates could cause acontraction of regional GDP (with respect tothe baseline) of around 2 percent for the nextseveral years, with potentially severe conse-quences for regional poverty. The most signif-icant impacts would likely be felt in highly in-debted countries, such as Brazil, Colombia,and Uruguay, where higher interest rateswould generate large additional fiscal costsand require spending cuts that would exacer-bate the slowdown.
While the region as a whole is an oil ex-porter and would experience higher oil pricesas a positive terms-of-trade shock, a furtherincrease in oil prices following a major supplydisruption forms an important risk for oilimporters. Oil exporters are also likely to beaffected, but indirectly. Estimates suggest thata 2-million-barrel per day cut in world oil sup-ply could cause a contraction in globaldemand that would lead to a reduction in re-gional GDP of 1.3 percent as compared withthe baseline, and generate a rapid pickup in in-flation. For the countries of the Caribbean andCentral America that are dependent on oil forelectrical generation, the impacts are likely tobe especially large because non-oil consump-tion and investment would likely be curtailedin order to pay for an increased oil bill—andthe consequences would be serious for povertyalleviation. Current account and fiscal balancesin some of these countries have already beenplaced under serious strain by the rise in oilprices; however, there has been a tendency forincreased remittances to offset some of thesecosts in some countries.
G L O B A L E C O N O M I C P R O S P E C T S 2 0 0 6
34
GEP_25-46.qxd 11/1/05 2:35 PM Page 34

Longer-term prospectsDuring the period 2006–15, regional GDP isprojected to increase by 3.6 percent a year,and per capita incomes are expected to rise by2.3 percent on average. Prospects for achiev-ing this kind of healthy expansion have beenimproved by the substantial reduction overthe past several years of the fiscal imbalancesand perverse price incentives that have heldback growth. As a result, the area is on trackto meet its Millennium Development povertygoals. However, it has been underperformingother developing regions, notably Asia, butalso Europe and Central Asia.
For economic performance to improve fur-ther, governments will need to consolidaterecent policy improvements and put in placekey structural micro-policies (in particular,upgrading infrastructure and education and re-ducing the cost of doing business) to improvecompetitiveness. This will require a continuedemphasis on macroeconomic stabilization poli-cies and structural policy reform. Policy shouldconcentrate on restraining government spend-ing during upturns, such as the current com-modity price boom, and focusing on medium-term budgetary planning. A more stablespending and tax regime will curtail the ten-dency for fiscal policy to respond pro-cyclically in the region with spending risingduring the good times only to be cut backduring periods of slower growth.
Economic growth and resource allocationwould also be improved by increasing theefficiency of public spending and moving re-sources toward growth-enhancing projects,such as infrastructure development, povertyeradication, education, and health enhance-ment.
Middle East and North Africaregional prospectsRecent developments GDP in the Middle East and North Africa re-gion is estimated to have increased by 4.8 per-cent in 2005, down slightly from 4.9 percent
the year before (table A.5). Growth amongdeveloping oil exporters in the region acceler-ated from 5.0 percent to 5.4 percent. Thesegains reflect still rapid increases in oil produc-tion and increased spending from high oil rev-enues, up some 35 percent, reaching $113 bil-lion, or 20 percent of regional GDP7
(figure A.6).Growth among regional oil importers
slowed noticeably from 4.6 to 4.0 percent.Weak demand in Europe and market sharelosses associated with the removal of quotason textiles and clothing slowed export growthin Egypt, Lebanon, and Morocco. In contrast,Jordan and Tunisia appear to have improvedtheir market share following the phase-out ofquotas (figure A.7). In Egypt, economic activ-ity accelerated as a result of strong revenuesfrom remittance inflows, tourism, and SuezCanal dues, while in Jordan, the advance in in-vestment and construction continued, boostedby Gulf-war-related spending. Growth inMorocco was affected by a severe drought.
The boom in oil revenues contributed to in-creased remittance flows to labor-abundanteconomies in the region of 9.2 percent, on theheels of double digit gains (13–14 percent)over 2003–4. In addition, positive spilloversarrived in the form of strong tourism revenuesas Gulf–region visitors took advantage of
R E G I O N A L E C O N O M I C P R O S P E C T S
35
$ billions $ billions
Source: World Bank, IMF, national agencies.
2000
Figure A.6 Oil export earnings balloon,lofting worker remittances in MENA
160
240
200
280
360
400 18
17
16
15
14
13
12
11
320
2001
Hydrocarbon exports(left axis)
Remittance receipts(right axis)
2002 2003 2004 2005
GEP_25-46.qxd 11/1/05 2:35 PM Page 35

tourism opportunities.8 Fiscal deficits roseamong oil-importing countries, notablyJordan, that subsidize petroleum prices.
Medium-term outlookRegional GDP is projected to accelerate in2006, reaching 5.4 percent before easingsomewhat in 2007, reflecting a pickup in eco-nomic activity among oil importers (from 4.0to 5.4 percent) and a broadly stable expansionamong oil exporters at (5.4 percent).
This very strong regional outlook, whichshould help address some of the demographicand labor market pressures in labor-abundantcountries, is mainly a reflection of continuedstrong oil revenues. The projected recovery inEuropean growth and import demand alsoplays a role—especially for oil importers
G L O B A L E C O N O M I C P R O S P E C T S 2 0 0 6
36
Source: World Bank; U.S. Department of Commerce.
Figure A.7 Impact of ATC quota removal
0
Percentage growth
20�20�40�60 40 60 80
Tunisia
Jordan
MENA
Egypt
Lebanon
Morocco
Oman
Growth Jan.–May 05vs
Jan.–May 04
Averagegrowth,2001–4
Growth in U.S. ATC imports from Middle East andNorth African countries
Export marketgrowth (2005)
Table A.5 Middle East and North Africa forecast summaryAnnual percent change (unless otherwise indicated)
Estimate Forecast
1991–2000a 2002 2003 2004 2005 2006 2007 2007–2015a
GDP at market prices (1995 US$)b �0.8 4.6 5.2 4.9 4.8 5.4 5.2 4.5GDP per capita (units in US$) �2.0 2.8 3.4 3.1 3.0 3.6 3.4 2.8PPP GDPc 1.2 4.8 5.3 4.9 4.9 5.4 5.2
Private consumption �0.8 3.8 4.7 4.2 4.0 4.9 4.6Public consumption �4.5 3.3 3.2 3.6 4.2 4.2 4.3Fixed investment 0.2 6.1 7.2 5.6 11.7 10.5 9.3Exports, GNFSd �2.8 0.4 2.8 5.5 6.1 5.7 6.1Imports, GNFSd �3.4 3.7 2.6 11.7 10.6 8.6 7.8
Net exports, contribution to growth 0.3 �0.9 0.0 �1.6 �1.4 �1.0 �0.7Current account balance/GDP (%) 0.0 3.3 4.5 4.6 7.6 8.0 5.9GDP deflator (median, LCU) 6.3 3.0 11.8 7.5 11.0 5.1 6.4Fiscal balance/GDP (%) �1.3 �2.3 �0.8 �0.1 3.4 4.4 3.7
Memorandum items: GDP
MENA geographic regione 3.4 3.0 6.1 5.1 5.2 4.9 4.6Resource poor-labor abundantf 3.9 3.0 4.2 4.6 4.0 5.4 5.3Resource rich-labor abundantg 3.1 6.1 6.2 5.2 5.5 5.3 5.1Resource rich-labor importingh 3.3 0.4 7.4 5.4 5.8 4.2 3.7
Source: World Bank.Notes: a. Growth rates over intervals are compound averages; growth contributions, ratios, and the GDP deflator are averages.
b. GDP measured in constant 1995 U.S. dollars.c. GDP measured at PPP exchange rates.d. Exports and imports of goods and non-factor services.e. Geographic region includes high-income countries: Bahrain, Kuwait, and Saudi Arabia.f. Egypt, Jordan, Morocco, and Tunisia.g. Algeria, Iran, Syria, and Yemen.h. Bahrain, Kuwait, Oman, and Saudi Arabia.
GEP_25-46.qxd 11/1/05 2:35 PM Page 36

(Europe is the destination of 70 percent ofnon-oil exports).
Limited excess capacity and the short-terminelasticity of both energy demand and energysupply are expected to keep oil prices highover the projection period. Nevertheless, theslowing of the global economy should allowprices to ease somewhat to about $56 on av-erage in 2006 and $52 in 2007. Among devel-oping regional oil exporters, the massive In-Salah and In-Amenas gas projects in Algeriaare expected to increase deliveries by a widemargin in 2006 and 2007. In other countriesin the region, declining yields in Iran are ex-pected to slow growth, with expanded outputof natural gas and LNG in Oman providingonly a partial offset.
Despite weaker growth in hydrocarbonproduction, continued high oil prices willmaintain government revenues. These are pro-jected to translate into a rapid expansion infiscal spending (transfers as well as invest-ment), which is expected to sustain growthamong oil exporters at close to 5.5 percent in2006. Current account surpluses for the groupare expected to reach $48 billion, or 11 per-cent of GDP.
Risks and uncertaintiesFor countries in the region, the most impor-tant risks and uncertainties stem from the fu-ture price of oil and the strength of the Euro-pean recovery.
For oil exporters, a much higher-than-projected oil price would benefit revenues andstimulate both investment and consumptionover the projection period. Over the longerterm, higher prices would likely acceleratesupply and demand responses, provoking afaster-than-projected decline in oil prices overthe long term. In particular, a substantiallyhigher oil price could stimulate technical inno-vation, which could in turn lead to a signifi-cant and permanent decline in the energy in-tensity of global production. In the 1970s and1980s this came about as alternatives to hy-drocarbons were found in the generation of
electricity; currently the prospect of substan-tially increasing the fuel efficiency of vehiclesthrough the use of hybrid technologies couldhave a similar effect.
For oil importers, higher oil prices wouldlikely cut into growth. To date, much of thedomestic economic impact of high oil priceshas been forestalled because of the subsidiza-tion of domestic hydrocarbon prices. While itis unclear how sustainable this policy is at cur-rent prices, few oil-importing countries couldcontinue to subsidize at higher oil prices. If thesubsidization were to end, private consump-tion and investment would be affected bothbecause of reduced incomes and becausehigher inflation would likely result in in-creased interest rates.
While slower-than-projected growth inEurope would likely have a smaller impact onregional prospects than higher oil prices, itcould accentuate the current account and fis-cal difficulties of the region’s oil-importingeconomies. The region’s external performancewill also depend on the extent to which localmanufacturers can adapt to lower quotas inthe clothing and textile sector. In the baseline,countries’ market shares are expected to sta-bilize, but this will require firms to find nichesthat they can continue to serve. More gener-ally, industry has to respond flexibly to in-creased competition from the new membercountries of the EU as well as developing Asia.
Longer-term prospects Notwithstanding the current period of rela-tively strong growth, the region faces a daunt-ing menu of structural reform issues related toeconomic policy, as well as governance, gen-der, and resources (e.g., water), against abackground of geopolitical tensions that re-main a central concern for policymakers.9
Long-term projections suggest that real percapita incomes will rise by 2.8 percent a yearover the next decade, unless policy succeeds inimproving employment prospects and overallproductivity growth. To accelerate growthand enhance opportunities, much will need to
R E G I O N A L E C O N O M I C P R O S P E C T S
37
GEP_25-46.qxd 11/1/05 2:35 PM Page 37

be done to improve private-sector job cre-ation, lower unemployment, and diversify thesources of growth.
Recent reforms have moved in this direc-tion, but more needs to be done because, withthe exception of Egypt, relatively littleprogress has been made since 2004. Earlierpositive steps in Morocco and Tunisia in-cluded reforms to improve the business andinvestment climate, and Morocco’s Free TradeAgreement with the United States, which cameinto force in 2005 and offers some promise ofincreased exports and higher FDI inflows.However, additional reforms are needed toimprove the investment climate in the exportsector. Algeria’s Hydrocarbons Reform Billwill make the sector far more transparent forforeign firms, while prospects for passage ofthe country’s Economic Recovery Program IIhave improved. Egypt has embarked upon anambitious and ongoing reform agenda; someof the major elements are tariff reduction, do-mestic tax reforms, and a resuscitation of theprivatization program. Such reform programsneed to be sustained, extended to other coun-tries in the region, and accelerated. If this is
achieved, a shift from public-sector-led tomore rapid private-sector-led growth couldtake shape over the next several years.
A concern regarding oil exporters is thatwindfall revenues diminish reform momen-tum. Oil windfalls should be viewed as tem-porary and should be used to finance neces-sary structural reform. Failure to do so wouldultimately increase oil exporters’ dependenceupon oil and reduce future growth prospects.Moreover, while capacity-enhancing invest-ments in infrastructure, education, and healthcare will likely yield long-term dividends, caremust be taken to avoid creating long-termentitlements that cannot be respected whenrevenues decline.
South Asian regional prospectsRecent developmentsReal GDP growth in South Asia is estimated at6.9 percent in 2005, slightly higher than in2004 (table A.6). This aggregate performancereflects stable growth of about 7.0 percent inIndia (the region’s largest economy), an accel-eration from 5.8 percent to 6.6 percent in
G L O B A L E C O N O M I C P R O S P E C T S 2 0 0 6
38
Table A.6 South Asia forecast summaryAnnual percent change (unless otherwise indicated)
Estimate Forecast
1991–2000a 2002 2003 2004 2005 2006 2007 2007–2015a
GDP at market prices (1995 US$)b 5.5 4.0 7.9 6.8 6.9 6.4 6.3 5.5GDP per capita (units in US$) 3.6 2.3 6.2 5.1 5.3 4.8 4.7 4.1PPP GDPc 5.6 4.0 8.0 6.8 6.9 6.4 6.3
Private consumption 4.5 3.3 6.7 11.0 7.9 7.8 7.5Public consumption 5.4 0.1 4.6 4.9 5.6 5.6 5.0Fixed investment 6.5 4.8 9.9 5.1 8.1 7.3 7.2Exports, GNFSd 10.4 17.3 14.7 10.1 13.2 12.4 12.3Imports, GNFSd 10.6 5.8 15.1 22.6 19.3 16.2 15.1
Net exports, contribution to growth �0.1 1.8 0.2 �2.0 �1.2 �1.0 �1.0Current account balance/GDP (%) �1.4 1.8 1.4 �0.7 �2.0 �2.5 �2.3GDP deflator (median, LCU) 7.5 4.5 4.7 3.1 6.3 5.3 5.9Fiscal balance/GDP (%) �9.8 �9.3 �7.8 �7.7 �7.6 �7.8 �8.0
Memorandum items: GDP
South Asia, excluding India 8.5 3.6 5.5 6.2 6.7 6.0 5.7
Source: World Bank.Notes: a. Growth rates over intervals are compound averages; growth contributions, ratios, and the GDP deflator are averages.
b. GDP measured in constant 1995 U.S. dollars.c. GDP measured at PPP exchange rates.d. Exports and imports of goods and non-factor services.
GEP_25-46.qxd 11/1/05 2:35 PM Page 38

Pakistan, and a deceleration among the re-gion’s smaller economies from 5.9 percent to5.1 percent. The slowdown among the smallercountries reflects higher oil prices, increasedpolitical instability (Bangladesh and Nepal),flooding in Bangladesh, and the after-effects ofthe December 2004 tsunami (Maldives and toa lesser extent Sri Lanka). In Afghanistan, fa-vorable weather has boosted agricultural out-put and GDP.
Growth in the region’s largest economies,India and Pakistan, was broadly based. Con-sumption, investment, and exports, all ex-panded rapidly, and industrial production inboth countries increased at double-digit rates.Strong investment growth reflects an im-proved investment climate, following pro-business reforms. Easier relations between thetwo countries and relatively moderate in-creases in domestic fuel prices (due to implicitand explicit price-subsidy programs) also sup-ported consumer demand, investment, and re-gional tourism. Export growth was especiallystrong, and many countries in the region haveincreased market share following the removalof quotas under the Agreement on Textilesand Clothing (ATC). While the October 2005earthquake in Pakistan had catastrophichuman consequences, its overall economic ef-fects are expected to be small.
The lifting of ATC quotas benefited re-gional trade, at least initially. For Bangladeshand Sri Lanka, increased sales of clothing andtextiles during the first half of 2005 are esti-mated to have represented between 10 and 15percent of their total merchandise exports in2004 (figure A.8). Large, but less important,gains were also registered in India andPakistan. Nepal, however, was hit hard by theincreased competition, and declines in itsclothing and textile exports were equal toabout 5 percent of its total merchandise trade.The region’s good performance may reflect theefforts of importers to maintain a diversity ofsuppliers; however, it also likely reflects effortsby producers to prepare for the new traderegime by improving efficiency and by expand-ing their offerings of high-end products—a
market segment where China’s comparativeadvantage is weaker.
Despite oil price subsidies, inflation10 wasup in most of the countries in the region, andthe median inflation rate has increased from3.1 percent in 2004 to 6.3 percent in 2005.Sri Lanka witnessed the sharpest advance, atan estimated 14.2 percent in 2005 versus7.3 percent the year before, partly because ofthe impact of the tsunami. In Pakistan, ac-commodating monetary policy and very fastgrowth were important factors in the rise ofinflation.
Price subsidies may mute the impact ofhigher oil prices on consumer inflation, butthey do not change the overall oil bill. As a re-sult, the region’s current account balance dete-riorated by 1.3 percent of GDP in 2005. InBangladesh, the authorities reacted to high en-ergy costs by dipping into its reserves, whichby April 2005 covered only 2.6 months of im-ports, down from 3.2 months on average in2004. Elsewhere, better export performancelimited the overall impacts on these countries’current account deficits, and stocks of reserveswere much higher (about 6 months of importsin India, Nepal, and Pakistan).
R E G I O N A L E C O N O M I C P R O S P E C T S
39
Figure A.8 Estimated change in textileand clothing exports to the EuropeanUnion and United States during the firsthalf of 2005
�10
�5
0
5
10
15
Nepal
Pakist
anIn
dia
Sri La
nka
Bangla
desh
% share of total merchandise exports
Source: World Bank; Eurostat; U.S. Department ofCommerce.
GEP_25-46.qxd 11/1/05 2:35 PM Page 39
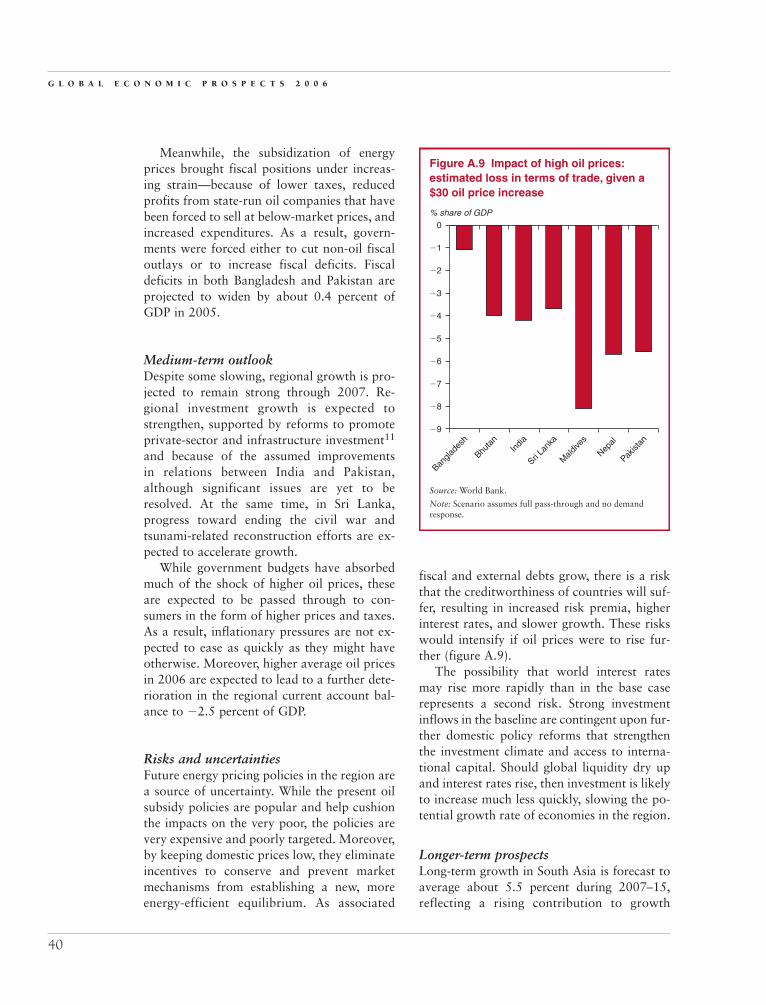
Meanwhile, the subsidization of energyprices brought fiscal positions under increas-ing strain—because of lower taxes, reducedprofits from state-run oil companies that havebeen forced to sell at below-market prices, andincreased expenditures. As a result, govern-ments were forced either to cut non-oil fiscaloutlays or to increase fiscal deficits. Fiscaldeficits in both Bangladesh and Pakistan areprojected to widen by about 0.4 percent ofGDP in 2005.
Medium-term outlook Despite some slowing, regional growth is pro-jected to remain strong through 2007. Re-gional investment growth is expected tostrengthen, supported by reforms to promoteprivate-sector and infrastructure investment11
and because of the assumed improvementsin relations between India and Pakistan,although significant issues are yet to beresolved. At the same time, in Sri Lanka,progress toward ending the civil war andtsunami-related reconstruction efforts are ex-pected to accelerate growth.
While government budgets have absorbedmuch of the shock of higher oil prices, theseare expected to be passed through to con-sumers in the form of higher prices and taxes.As a result, inflationary pressures are not ex-pected to ease as quickly as they might haveotherwise. Moreover, higher average oil pricesin 2006 are expected to lead to a further dete-rioration in the regional current account bal-ance to �2.5 percent of GDP.
Risks and uncertaintiesFuture energy pricing policies in the region area source of uncertainty. While the present oilsubsidy policies are popular and help cushionthe impacts on the very poor, the policies arevery expensive and poorly targeted. Moreover,by keeping domestic prices low, they eliminateincentives to conserve and prevent marketmechanisms from establishing a new, moreenergy-efficient equilibrium. As associated
fiscal and external debts grow, there is a riskthat the creditworthiness of countries will suf-fer, resulting in increased risk premia, higherinterest rates, and slower growth. These riskswould intensify if oil prices were to rise fur-ther (figure A.9).
The possibility that world interest ratesmay rise more rapidly than in the base caserepresents a second risk. Strong investmentinflows in the baseline are contingent upon fur-ther domestic policy reforms that strengthenthe investment climate and access to interna-tional capital. Should global liquidity dry upand interest rates rise, then investment is likelyto increase much less quickly, slowing the po-tential growth rate of economies in the region.
Longer-term prospectsLong-term growth in South Asia is forecast toaverage about 5.5 percent during 2007–15,reflecting a rising contribution to growth
G L O B A L E C O N O M I C P R O S P E C T S 2 0 0 6
40
Bangla
desh
Bhuta
nIn
dia
Sri La
nka
Mald
ives
Nepal
Pakist
an�9
�8
�7
�6
�5
�4
�3
�2
�1
0% share of GDP
Source: World Bank.
Figure A.9 Impact of high oil prices:estimated loss in terms of trade, given a$30 oil price increase
Note: Scenario assumes full pass-through and no demandresponse.
GEP_25-46.qxd 11/1/05 2:35 PM Page 40
from the private sector. Trade reforms,banking-sector liberalization and re-regulation,privatization, and infrastructure developmentare all expected to contribute to improving theinvestment climate, productivity growth, andultimately incomes. Private–sector investment(both domestic and foreign) is expected to con-tribute to improving the growth rate ofpotential output, buoyed by rising privatesavings as dependency ratios decline.
In this context, the incidence of extremepoverty in the region, which had fallen to 31percent of the population in 2002, is expectedto decline to less than 13 percent by 2015. De-spite declining infant mortality rates, fallingbirth rates mean that regional populationgrowth is projected to decelerate, and depen-dency ratios are expected to decline. As a re-sult, per capita incomes will accelerate signifi-cantly (as compared with the 1990s), comingin at a projected 4.1 percent per year for theperiod 2007–15.
Nevertheless, poverty reduction challengesare daunting. More than four hundred millionpeople in the region are currently living on lessthan $1 a day, and despite substantial progresson the extreme poverty measure, more thanhalf of the population is projected to be livingon less than $2 a day by 2015. To improve onthis record, policies should raise educationlevels (at 44 percent, the region has the high-est illiteracy rate in the world) and reduce in-fant mortality rates, which should also boostproductivity and growth.
Substantial segments of the region’s popu-lation remain vulnerable to weather patternsand natural disasters. Building capacity tomitigate their impacts without distorting eco-nomic incentives should be a priority. Recentpeace agreements have eased regional tensionsand are contributing to enhanced stability,improved business confidence, and greaterintraregional trade. However, some interna-tional and domestic tensions remain. Thesetensions and the political climate continue torepresent downside risks to growth outcomes,which could have serious consequences forpoverty reduction.
Sub-Saharan Africa regionalprospects
Recent developmentsGDP growth in Sub-Saharan Africa picked upsomewhat in 2005, reaching 4.6 percent, upfrom 4.5 percent in 2004 (table A.7). This isthe sixth consecutive year of growth in excessof 3 percent for the region, representing a sus-tained period during which per capita GDPhas been rising by an average of 1.8 percent.This strong performance occurred in a (gener-ally) supportive international environment,but it was achieved despite a number of nega-tive factors. In the past, these factors (for in-stance, rapidly rising oil prices, slow growth inEurope, a severe locust infestation in the Sahelregion, drought in southern Africa, and lowinternational cotton prices) might have beenassociated with much weaker performance.
This aggregate performance in 2005 repre-sents the combination of a significant slowingamong oil-exporting countries in the regionfrom 6.1 percent to 5.5 percent and an acceler-ation among oil importers from 4.0 percentgrowth in 2004 to an estimated 4.3 percent thisyear. Excluding South Africa (the region’slargest economy), oil importers growth decel-erated somewhat, from 4.6 to 4.3 percent.
Oil-producing economies (includingNigeria, the region’s second largest economy)have continued expanding at a robust pace.However, growth slowed in most of theseeconomies, reflecting capacity constraints inthe oil sectors and production disruption inNigeria due to localized unrest in the RiversState. The expansion accelerated in a few oilproducers as a result of rapidly rising levels ofinvestment and the coming on stream of newfields. Economic activity in the non-oil sectorscontinued to be robust, boosted by oil rev-enues, an expansionary fiscal stance, andstrong investment spending.
Given the relative weakness of non-oilcommodity prices since the beginning of 2004,the relative strength of oil-importing eco-nomies is particularly encouraging. In part,this strength reflects a recovery in South
R E G I O N A L E C O N O M I C P R O S P E C T S
41
GEP_25-46.qxd 11/1/05 2:35 PM Page 41
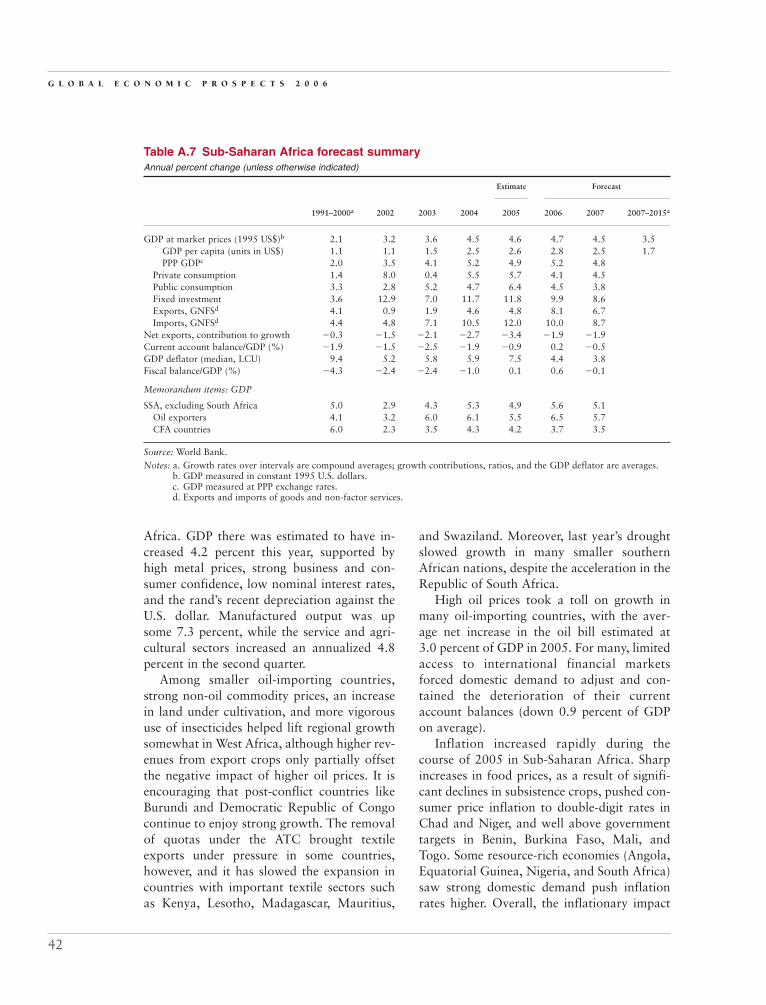
Africa. GDP there was estimated to have in-creased 4.2 percent this year, supported byhigh metal prices, strong business and con-sumer confidence, low nominal interest rates,and the rand’s recent depreciation against theU.S. dollar. Manufactured output was upsome 7.3 percent, while the service and agri-cultural sectors increased an annualized 4.8percent in the second quarter.
Among smaller oil-importing countries,strong non-oil commodity prices, an increasein land under cultivation, and more vigoroususe of insecticides helped lift regional growthsomewhat in West Africa, although higher rev-enues from export crops only partially offsetthe negative impact of higher oil prices. It isencouraging that post-conflict countries likeBurundi and Democratic Republic of Congocontinue to enjoy strong growth. The removalof quotas under the ATC brought textileexports under pressure in some countries,however, and it has slowed the expansion incountries with important textile sectors suchas Kenya, Lesotho, Madagascar, Mauritius,
and Swaziland. Moreover, last year’s droughtslowed growth in many smaller southernAfrican nations, despite the acceleration in theRepublic of South Africa.
High oil prices took a toll on growth inmany oil-importing countries, with the aver-age net increase in the oil bill estimated at3.0 percent of GDP in 2005. For many, limitedaccess to international financial marketsforced domestic demand to adjust and con-tained the deterioration of their currentaccount balances (down 0.9 percent of GDPon average).
Inflation increased rapidly during thecourse of 2005 in Sub-Saharan Africa. Sharpincreases in food prices, as a result of signifi-cant declines in subsistence crops, pushed con-sumer price inflation to double-digit rates inChad and Niger, and well above governmenttargets in Benin, Burkina Faso, Mali, andTogo. Some resource-rich economies (Angola,Equatorial Guinea, Nigeria, and South Africa)saw strong domestic demand push inflationrates higher. Overall, the inflationary impact
G L O B A L E C O N O M I C P R O S P E C T S 2 0 0 6
42
Table A.7 Sub-Saharan Africa forecast summaryAnnual percent change (unless otherwise indicated)
Estimate Forecast
1991–2000a 2002 2003 2004 2005 2006 2007 2007–2015a
GDP at market prices (1995 US$)b 2.1 3.2 3.6 4.5 4.6 4.7 4.5 3.5GDP per capita (units in US$) 1.1 1.1 1.5 2.5 2.6 2.8 2.5 1.7PPP GDPc 2.0 3.5 4.1 5.2 4.9 5.2 4.8
Private consumption 1.4 8.0 0.4 5.5 5.7 4.1 4.5Public consumption 3.3 2.8 5.2 4.7 6.4 4.5 3.8Fixed investment 3.6 12.9 7.0 11.7 11.8 9.9 8.6Exports, GNFSd 4.1 0.9 1.9 4.6 4.8 8.1 6.7Imports, GNFSd 4.4 4.8 7.1 10.5 12.0 10.0 8.7
Net exports, contribution to growth �0.3 �1.5 �2.1 �2.7 �3.4 �1.9 �1.9Current account balance/GDP (%) �1.9 �1.5 �2.5 �1.9 �0.9 0.2 �0.5GDP deflator (median, LCU) 9.4 5.2 5.8 5.9 7.5 4.4 3.8Fiscal balance/GDP (%) �4.3 �2.4 �2.4 �1.0 0.1 0.6 �0.1
Memorandum items: GDP
SSA, excluding South Africa 5.0 2.9 4.3 5.3 4.9 5.6 5.1Oil exporters 4.1 3.2 6.0 6.1 5.5 6.5 5.7CFA countries 6.0 2.3 3.5 4.3 4.2 3.7 3.5
Source: World Bank.Notes: a. Growth rates over intervals are compound averages; growth contributions, ratios, and the GDP deflator are averages.
b. GDP measured in constant 1995 U.S. dollars.c. GDP measured at PPP exchange rates.d. Exports and imports of goods and non-factor services.
GEP_25-46.qxd 11/1/05 2:35 PM Page 42
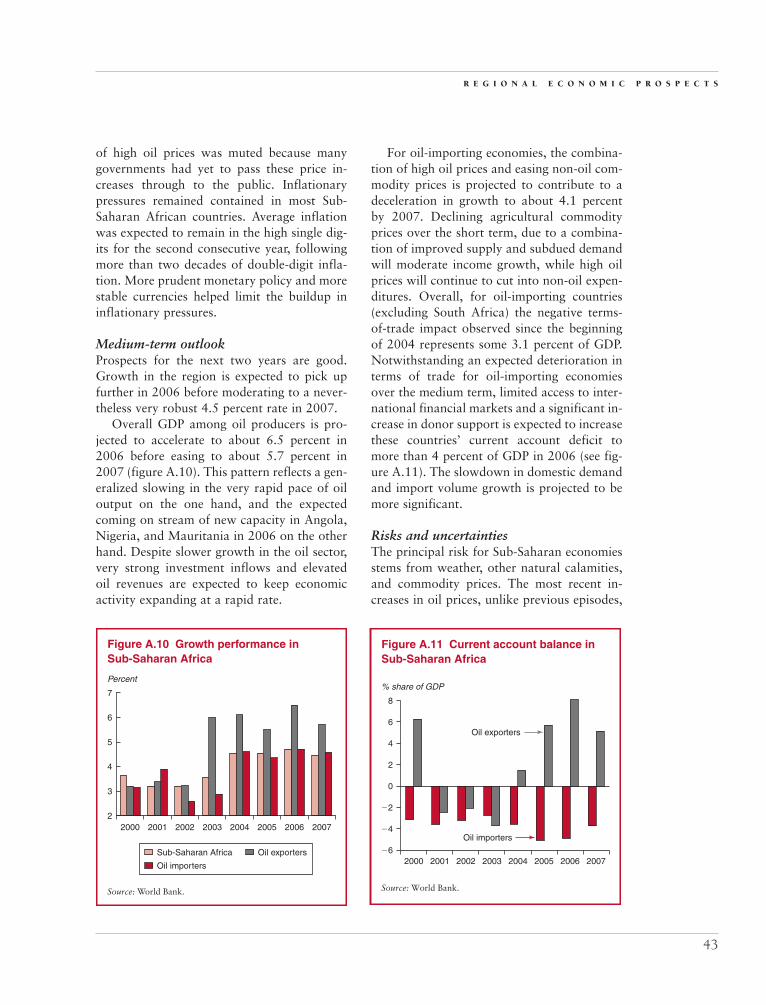
of high oil prices was muted because manygovernments had yet to pass these price in-creases through to the public. Inflationarypressures remained contained in most Sub-Saharan African countries. Average inflationwas expected to remain in the high single dig-its for the second consecutive year, followingmore than two decades of double-digit infla-tion. More prudent monetary policy and morestable currencies helped limit the buildup ininflationary pressures.
Medium-term outlook Prospects for the next two years are good.Growth in the region is expected to pick upfurther in 2006 before moderating to a never-theless very robust 4.5 percent rate in 2007.
Overall GDP among oil producers is pro-jected to accelerate to about 6.5 percent in2006 before easing to about 5.7 percent in2007 (figure A.10). This pattern reflects a gen-eralized slowing in the very rapid pace of oiloutput on the one hand, and the expectedcoming on stream of new capacity in Angola,Nigeria, and Mauritania in 2006 on the otherhand. Despite slower growth in the oil sector,very strong investment inflows and elevatedoil revenues are expected to keep economicactivity expanding at a rapid rate.
For oil-importing economies, the combina-tion of high oil prices and easing non-oil com-modity prices is projected to contribute to adeceleration in growth to about 4.1 percentby 2007. Declining agricultural commodityprices over the short term, due to a combina-tion of improved supply and subdued demandwill moderate income growth, while high oilprices will continue to cut into non-oil expen-ditures. Overall, for oil-importing countries(excluding South Africa) the negative terms-of-trade impact observed since the beginningof 2004 represents some 3.1 percent of GDP.Notwithstanding an expected deterioration interms of trade for oil-importing economiesover the medium term, limited access to inter-national financial markets and a significant in-crease in donor support is expected to increasethese countries’ current account deficit tomore than 4 percent of GDP in 2006 (see fig-ure A.11). The slowdown in domestic demandand import volume growth is projected to bemore significant.
Risks and uncertaintiesThe principal risk for Sub-Saharan economiesstems from weather, other natural calamities,and commodity prices. The most recent in-creases in oil prices, unlike previous episodes,
R E G I O N A L E C O N O M I C P R O S P E C T S
43
Percent
Source: World Bank.
2000
Figure A.10 Growth performance inSub-Saharan Africa
2001 2002 2003 2004 2005 2006 20072
3
7
5
6
4
Sub-Saharan Africa Oil exporters
Oil importers
Figure A.11 Current account balance inSub-Saharan Africa
% share of GDP
�6
�4
�2
0
2000 2001 2002 2003
Oil exporters
Oil importers
2004 2005 2006 2007
2
4
6
8
Source: World Bank.
GEP_25-46.qxd 11/1/05 2:35 PM Page 43

occurred in the context of slowing worldgrowth and easing of non-oil commodityprices to the substantial detriment of the termsof trade of oil-importing African countries.Should oil prices rise further or other com-modity prices ease more quickly than pro-jected, the impacts on domestic demand andpoverty could be much more serious.
So far the inflationary impact of higher oilprices has been muted, in part because of pru-dent monetary policy. However, if furtherprice shocks arise, inflationary pressures couldmount quickly—particularly among thosecountries that have yet to pass through the fullcost of higher world energy prices. In thosecountries the fiscal cost of maintaining subsi-dies will eventually become too high, yieldinghigher domestic price pressures.
Pressures on current account balances areexpected to mount substantially in most oil-importing economies, especially if non-oilcommodities collapse. Higher aid flows(donors have pledged to double official devel-opment assistance to Africa by 2010) will helpto reduce the foreign currency constraintsfaced by many countries. As more Africancountries reach the completion point underthe HIPC Initiative, official grants as share ofGDP are expected to exceed 3 percent of re-gional GDP (excluding South Africa and Nige-ria), with some countries receiving grants inexcess of 5 percent of GDP. For these funds tohave the maximum development benefit, it iscritical that they be used to enhance infra-structure and human capital, not just to payhigh oil bills.
Longer-term prospectsSub-Saharan Africa is projected to continuelagging all other regions in terms of per capitareal GDP growth in the long run. This arises de-spite per capita income growth of 1.7 percent,which represents a marked improvement overthe 1990s and 1980s (when incomes werefalling). While this stronger growth will yielda projected 12 percentage point decline in theshare of the population living in extremepoverty, rapid population growth means that
the absolute number of very poor will actuallyincrease. And, notwithstanding improved per-formance, all other regions will grow faster,implying that unless steps are taken to furtherimprove prospects, Africa will continue to fallbehind.
In this regard, policymakers need to takecareful aim at macroeconomic mismanage-ment and political and social instability,factors that undermine long-term growthprospects in many countries in the region. Sig-nificant progress in this regard has been made,but the quality of institutions remains poor inmany countries, undermining investors’ confi-dence and keeping the cost of doing businessat prohibitively high levels.
Microeconomic reform is also critical.Much of the improved performance over thepast 10 years reflects the impact of first gener-ation reforms undertaken in a number of coun-tries. These countries have created a more sta-ble macroeconomic climate that has allowedseveral economies in the region to diversifyand enjoy sustained strong economic perfor-mance. Such reforms should be extended andimplemented in other countries in the region.The World Bank’s Action Plan for Africa(2005) emphasizes reforms that improve gov-ernments and institutions, promote a vibrantprivate sector, expand exports, raise the qual-ity of both national and international infra-structure (social, educational, and economic),and increase agricultural productivity. A com-prehensive effort along all of these dimensionsshould help reduce poverty by facilitating theaccess of the poor to economic opportunity.
While the region’s export-to-GDP ratio isrelatively high, trade remains heavily depen-dent on commodities. Here success in theDoha round of trade liberalization could bringto the agricultural sector many of the benefitsthat earlier rounds have extended to manufac-turing. The primary sector continues to ac-count for a large share of GDP in Sub-SaharanAfrica, and increasing incomes in this sectorcould improve the lives of the poor membersof society. Infrastructure investments (includ-ing improved irrigation and roads) could also
G L O B A L E C O N O M I C P R O S P E C T S 2 0 0 6
44
GEP_25-46.qxd 11/1/05 2:35 PM Page 44

play a fundamental role by reducing vulnera-bility to the vagaries of weather and reducingtransportation costs.
Malaria and HIV/AIDS along with low-levels of educational attainment present addi-tional major challenges to improving Sub-Saharan African economic performance. Bothdiseases are cutting into the most productivelayers of the society, while low levels of edu-cational attainment reduce both employmentopportunities and productivity growth.
Notes1. Global demand for high-tech goods has recently
been on the upswing; exports of these products accel-erated from Korea, Taiwan (China), Singapore, andThailand in the third quarter.
2. Turkey’s investment to GDP ratio increased from16.5 percent in 2004 to an estimated 21.3 percent in2005.
3. Estimates of the total terms of trade impact as apercent of GDP from commodity price hikes observedsince 1999, plus a an additional $30 hike in oil pricesexceed 7 percent in Armenia, Bosnia and Herzegovina,Belarus, Czech Republic, Estonia, Georgia, Croatia,Kyrgyz Republic, Latvia, Moldova, FYR Macedonia,Turkey, and Ukraine.
4. Shipments of oil, copper, and coffee represent65 percent of the exports of commodities in the region;raw materials in turn account for 31 percent of totalregional exports, or 45 percent if Mexico, a strongmanufactures exporter, is excluded.
5. Inflation is up in Argentina, Chile, Ecuador,Panama, and Paraguay, but has declined in Brazil,Costa Rica, the Dominican Republic, Mexico Peru,Uruguay, and Republica Bolivariana de Venezuela.
6. In the case of oil importers, the increased costmanifests itself as higher expenditures—or lower
revenues if subsidization is achieved through tax policyor by forcing a state-owned enterprise to sell at belowmarket rates; for oil exporters, it materializes as fore-gone revenues.
7. Saudi Arabia is now classified as a high-incomeeconomy, and its revenues (as well as those of Bahrain,Kuwait, Qatar, and the United Arab Emirates) are notincluded in these figures. If these five countries wereincluded—and their collective spending has a notableeffect on economic activity among developing coun-tries in the region—the revenue total for the geogra-phic region would rise to $390 billion, a 38 percentincrease.
8. Tourism revenues jumped 15 percent during2004 for Egypt, Jordan, and Tunisia, and these strongtrends continued in 2005. The share of visitors fromthe Gulf states in total tourism arrivals in Egypt in-creased from 22.7 percent in 2001 to 26.1 percent in2004.
9. See MENA region reports on trade and invest-ment, governance, gender, and employment, producedin 2003–4, that highlight fundamental challenges forthe region at the start of the 21st century. http://publications.worldbank.org/ecommerce/catalog/product?item_id=2430578.
10. Some pass-through of higher cost has occurred,for example, a 7 percent increase in India in September2005.
11. In India, the government is seeking to attract$150 billion in foreign investment in infrastructure inthe coming decade. A number of sectors are being tar-geted, and greater emphasis is being placed on privatesector participation; for example, the expansion of thepower generation capacity, which allows for privateoperators, and the development of the national high-way system, which would use more build-operate-transfer contracts. Pakistan aims to bolster private-sector investment via tax incentives in order to sustainits recent strong growth performance. However, unlikein India, in Pakistan foreign investment is expected toremain somewhat tepid due to the domestic politicaluncertainty.
R E G I O N A L E C O N O M I C P R O S P E C T S
45
GEP_25-46.qxd 11/1/05 2:35 PM Page 45

International migration, the movement of people acrossinternational boundaries to improve economic opportunity,has enormous implications for growth and welfare in bothorigin and destination countries. An important benefit todeveloping countries is the receipt of remittances or transfersfrom income earned by overseas emigrants. Official data
show that developing countries’ remittance receipts totaled $160 billion in 2004, more than twice the size of official aid. This year’s edition of
Global Economic Prospects focuses on remittances and migration. The bulk of the book coversremittances, including their size, determinants, development impact, and steps to strengthenfinancial infrastructure and reduce transaction costs. It also presents available data onmigration flows and examines current thinking on issues pertaining to migration and itsdevelopment impact.
WORLD BANKPublications
Visit our website at www.worldbank.org/publications
See other side for order form.
New! Prospects for the Global Economy onlineYour multilingual source (English, French, Spanish) for:• Macroeconomic indicators and forecast data, from 1980
to 2007• Insightful interactive calculators and simulation tools• One-page PDF briefs summarizing countries’ external
financial position and trade• 16 individual commodity reports and price forecasts• Timely analysis of worldwide economic prospects and risks
Please visit the new interactive Prospects for the Global Economywebsite at www.worldbank.org/globaloutlook
The reference of choice on development
Global Economic Prospects 2006:Economic Implications of Remittances and Migration
The World BankGLOBALECONOMIC PROSPECTS
GEP06_orderform.qxd 11/3/05 10:53 AM Page 1

Name _________________________________________________
Title ___________________________________________________
Organization ____________________________________________
Address________________________________________________
City ___________________________________________________
State __________________________________________________
Zip/Postal Code__________________________________________
Country ________________________________________________
Phone _________________________________________________
Fax ___________________________________________________
E-mail _________________________________________________
� Charge $__________________ to my:
� American Express � Mastercard � Visa
Card no. _______________________________________________
Expiration date _____________ /____________
Name _________________________________________________as it appears on the card
Signature _______________________________________________required for all credit card charges
� Check no._______________
in the amount of $__________________ is enclosed. When ordering
directly from the World Bank, make check payable in U.S. funds drawn on
a U.S. bank to: The World Bank. Please send your check with your order.
Institutional customers in the U.S. only:� Bill me. Please include purchase order.
To Order: World Bank Publications
www.worldbank.org/publicationsBy phone: +1-703-661-1580 or 800-645-7247
By fax: +1-703-661-1501By mail: P.O. Box 960, Herndon, VA 20172-0960, USA
Questions? E-mail us at [email protected]
Order Form
DCGP6
PAYMENT METHODOrders from individuals must be accompanied by payment or credit card information. Credit cards are accepted only for orders addressed to the World Bank. Check with your local distributor about acceptable credit cards. Please do not send cash.
WORLD BANKPublications
Visit our website at www.worldbank.org/publications
* Geographic discounts apply - up to 75% for some countries. Please see our web site for information (http://publications.worldbank.org/discounts).
** Shipping and Handling charges within the US are US$8.00 per order. If a purchase order is used actual shipping will becharged. Outside of the US, customers have the option to choose between non-trackable airmail delivery (US$7.00 perorder plus US$6.00 per item) and trackable courier airmail delivery (US$16.50 per order plus US$8.00 per item).
Title Stock # Price Qty. Total US$
Global Economic Prospects 2006: Economic Implications of Remittances and Migration D16344 US$38November 2005. (ISBN 0-8213-6344-1).
Subtotal
Shipping and Handling*
Total US$
The reference of choice on development
(Please Print)
GEP06_orderform.qxd 11/3/05 10:53 AM Page 2