gert sablon, lms international fundamentals of acoustics
TRANSCRIPT

Gert Sablon, LMS International
Fundamentals of Acoustics

2 copyright LMS International - 2010
Overview
BasicAcoustics
Theory
AcousticHardware:
Microphones
Applications&
Processing
The 6 S’s ofAcousticTesting

The Real world!You’re either meeting the requirements or you’re not
Sound Power Requirement Sound Quality
Source Identification
You have not metyour requirementsand need to solve
them fast
You’ve met yourrequirements and
now want toimprove the
sound quality
Source Ranking
Solution
3 copyright LMS International - 2010

Sound – Why is it important?
Cannot sell your product
EU-US Regulations, Passby Regulations
Example: Construction Equipment (Bulldozers, etc), Printers, Cars
Warranty Costs
Often driven by perceived issues via sound from customers
Competitive Advantage
Distinguish your product from competition
Example: Quietest Washing Machine on Market
Increase Sales
Example: Ice machine that can be in hospital patient rooms, rather than only nursingstation if it is quiet enough not to disturb patients
Military
Helicopter, Submarines, Military Vehicle – Avoid detection by enemy
4 copyright LMS International - 2010
Sound – Why is it important?
Cannot sell your product
EU-US Regulations, Passby Regulations
Example: Construction Equipment (Bulldozers, etc), Printers, Cars
Warranty Costs
Often driven by perceived issues via sound from customers
Competitive Advantage
Distinguish your product from competition
Example: BMW and Lexus are using their sound interior as a brand image
5 copyright LMS International - 2010

6 copyright LMS International - 2010
History
The word "acoustic" is derived from the ancient Greek wordακουστο�ς, meaning able to be heard.
Pythagoras
Aristotle
Leonardo Da Vinci
Vitruvius
Galileo
Marin Mersenne (father of acoustics)
Newton
Helmholtz
Lord Rayleigh
Sabine …

7 copyright LMS International - 2010
Effects of Noise
Pleasant vs. discomfort
Perceived product image
Perceived product quality
Purchasing criteria
Environmental noise
Comfort & Perception Safety HealthFatigue
Reduced sensitivity
Risk for accidents
Reduced balance
Abdominal & chest pain
Lower back pains
Reduced concentration White finger syndrome
Hearing loss
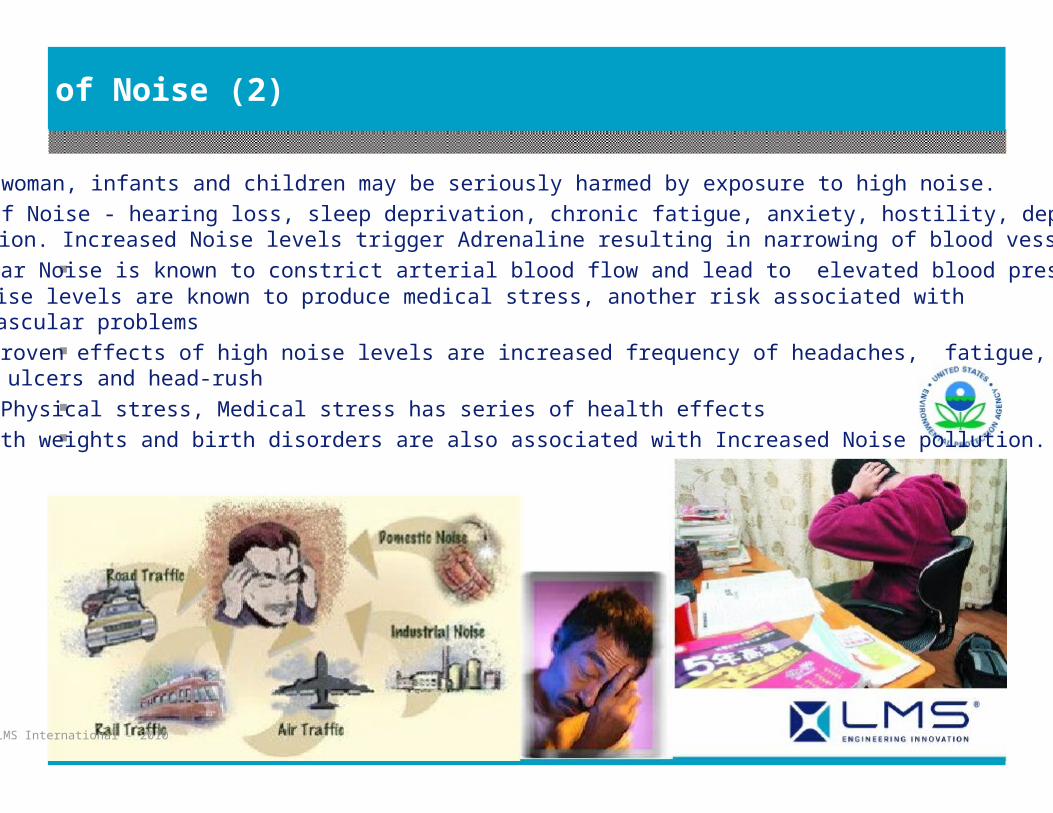
Effects of Noise (2)
Pregnant woman, infants and children may be seriously harmed by exposure to high noise.
Effects of Noise - hearing loss, sleep deprivation, chronic fatigue, anxiety, hostility, depression &hypertension. Increased Noise levels trigger Adrenaline resulting in narrowing of blood vessels
Vehicular Noise is known to constrict arterial blood flow and lead to elevated blood pressure..high noise levels are known to produce medical stress, another risk associated withcardiovascular problems
Other proven effects of high noise levels are increased frequency of headaches, fatigue,stomach ulcers and head-rush
Unlike Physical stress, Medical stress has series of health effects
Low birth weights and birth disorders are also associated with Increased Noise pollution.
8 copyright LMS International - 2010
9 copyright LMS International - 2010
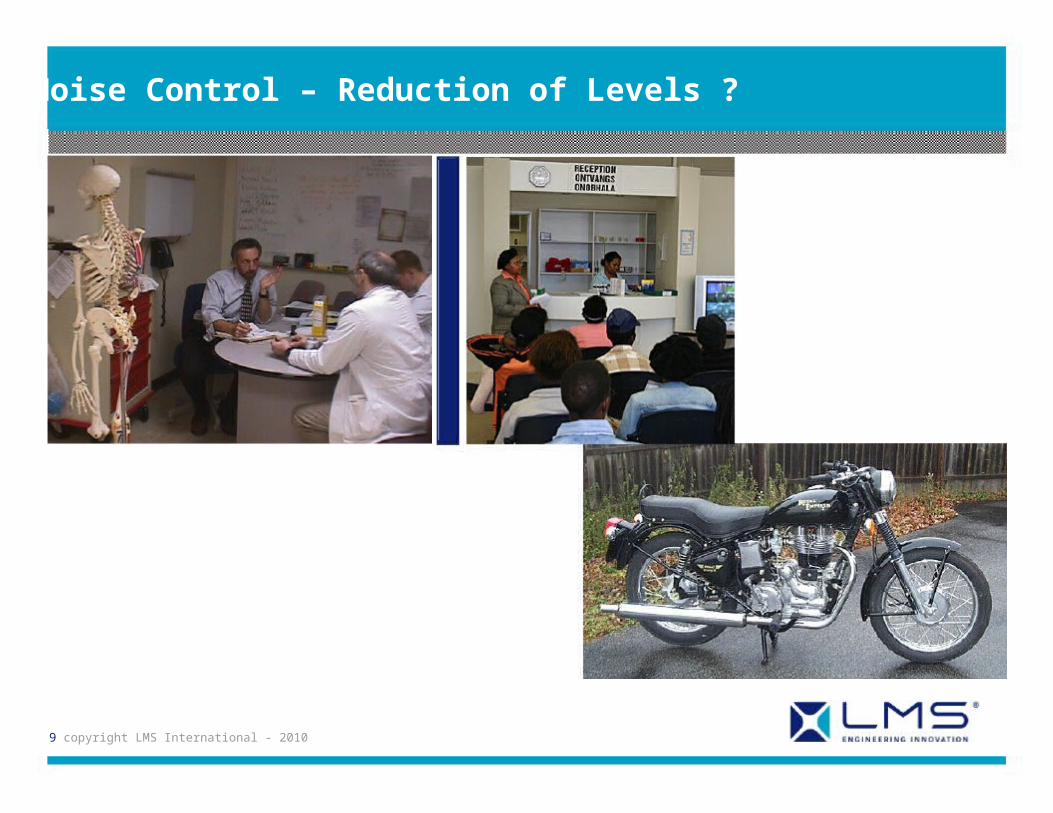
Noise Control – Reduction of Levels ?

Disturbance
(Source)
Propagation
(Path)
Perception
(Receiver)
Sound Power - Cause
10 copyright LMS International - 2010
Sound Intensity - Flow Sound Pressure - Effect
Acoustics in a Nutshell – Source-Path-Receiver

11 copyright LMS International - 2010
Sound Descriptors
Amplitude (Sound Pressure)
Frequency
Wavelength
Phase
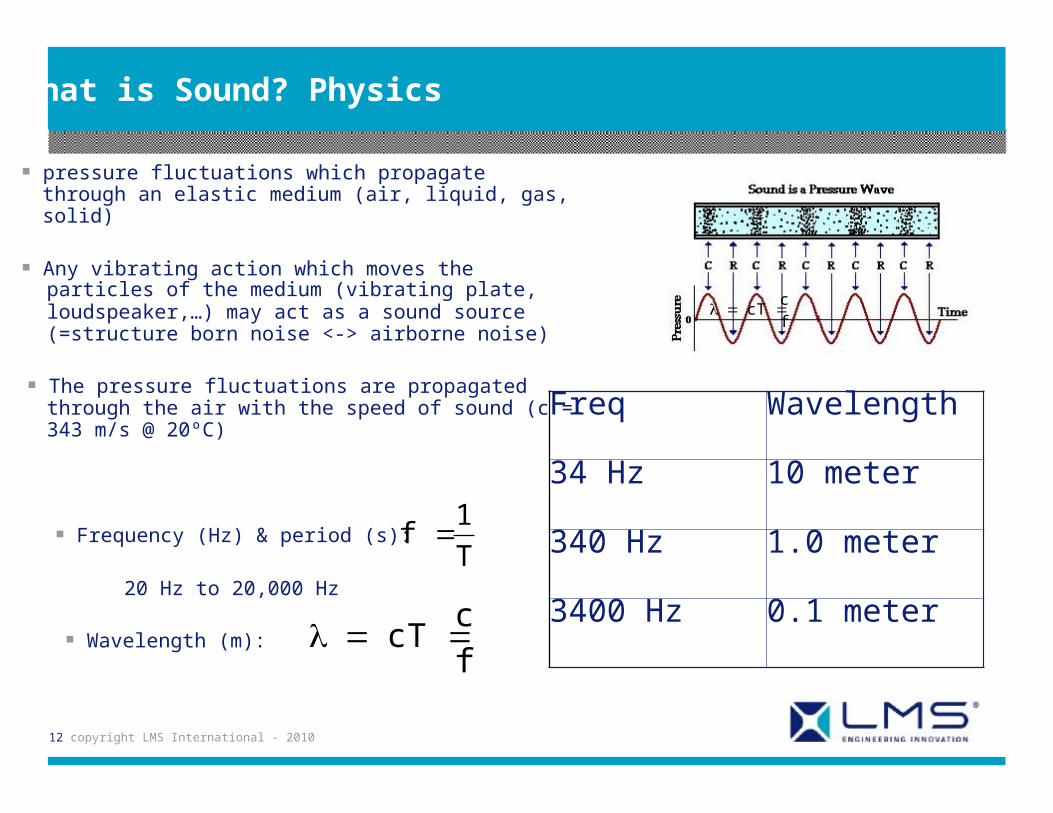
Freq Wavelength
34 Hz 10 meter
340 Hz 1.0 meter
3400 Hz 0.1 meter
What is Sound? Physics
pressure fluctuations which propagatethrough an elastic medium (air, liquid, gas,solid)
Any vibrating action which moves theparticles of the medium (vibrating plate,loudspeaker,…) may act as a sound source(=structure born noise <-> airborne noise)
The pressure fluctuations are propagatedthrough the air with the speed of sound (c =343 m/s @ 20ºC)
Frequency (Hz) & period (s):
20 Hz to 20,000 Hz
Wavelength (m):
12 copyright LMS International - 2010
c
fcT
1
Tf
c
fcT
13 copyright LMS International - 2010
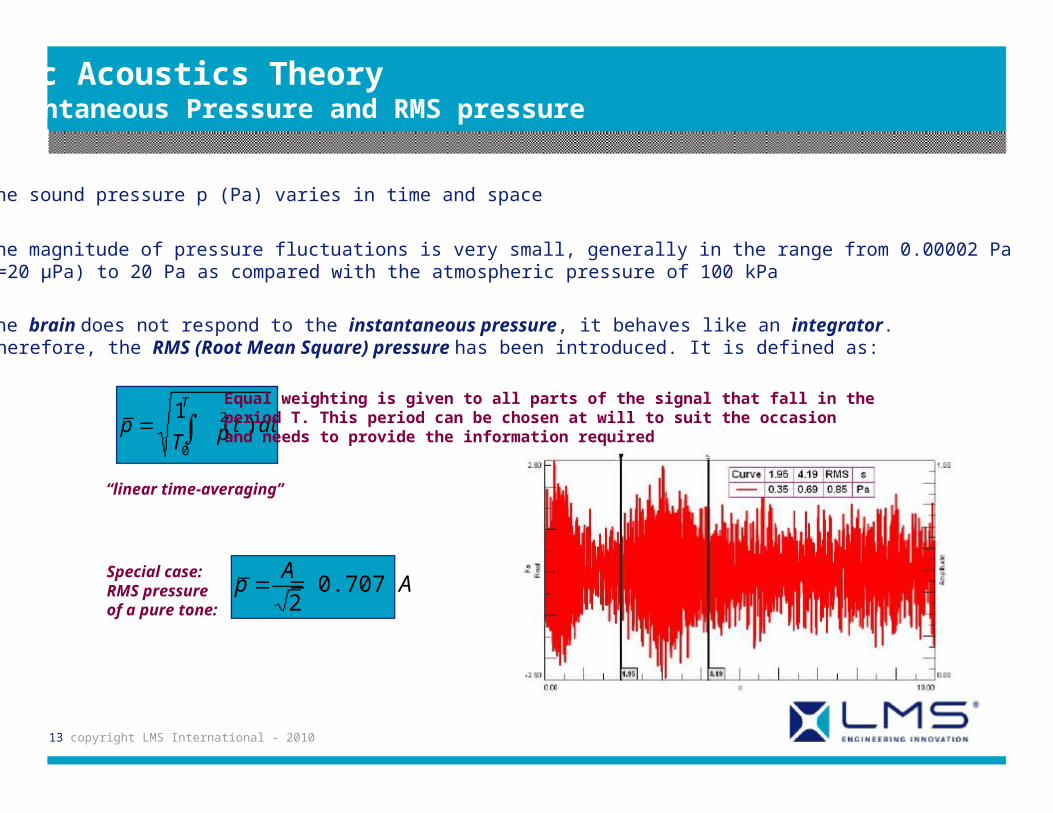
Basic Acoustics TheoryInstantaneous Pressure and RMS pressure
The sound pressure p (Pa) varies in time and space
The magnitude of pressure fluctuations is very small, generally in the range from 0.00002 Pa(=20 μPa) to 20 Pa as compared with the atmospheric pressure of 100 kPa
The brain does not respond to the instantaneous pressure, it behaves like an integrator.Therefore, the RMS (Root Mean Square) pressure has been introduced. It is defined as:
p T
p0
2(t )dt1
T
“linear time-averaging”
Equal weighting is given to all parts of the signal that fall in theperiod T. This period can be chosen at will to suit the occasionand needs to provide the information required
Special case:RMS pressureof a pure tone:
A
20.707 Ap

14 copyright LMS International - 2010
Sound Pressure – Pa or dB ?
Basic unit of Sound Pressure isPascal (Pa). However, SoundPressures are normally representedin dB !!!
Why decibel?
Noise level if expressed in Pascal,the range is
For whisper - 10-5 Pa
For Airplane - 10 Pa
Ratio is – 100000 !!!
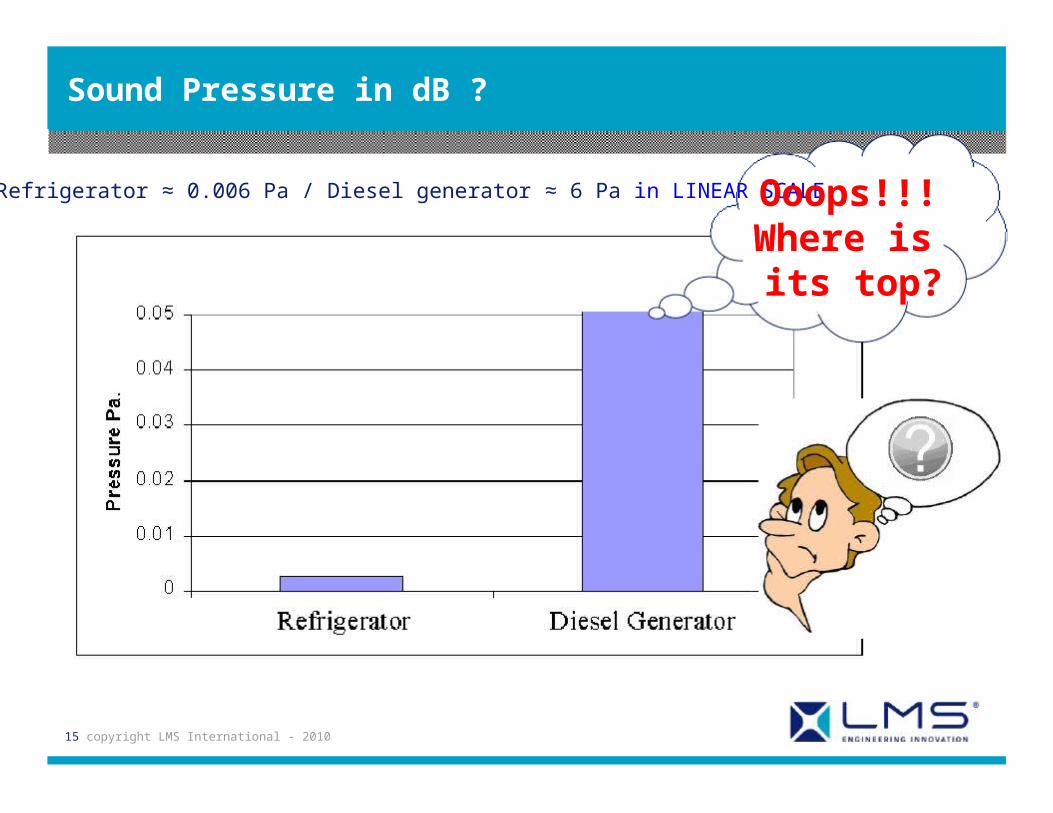
Sound Pressure in dB ?
Refrigerator ≈ 0.006 Pa / Diesel generator ≈ 6 Pa in LINEAR SCALE Ooops!!!Where isits top?
15 copyright LMS International - 2010
16 copyright LMS International - 2010
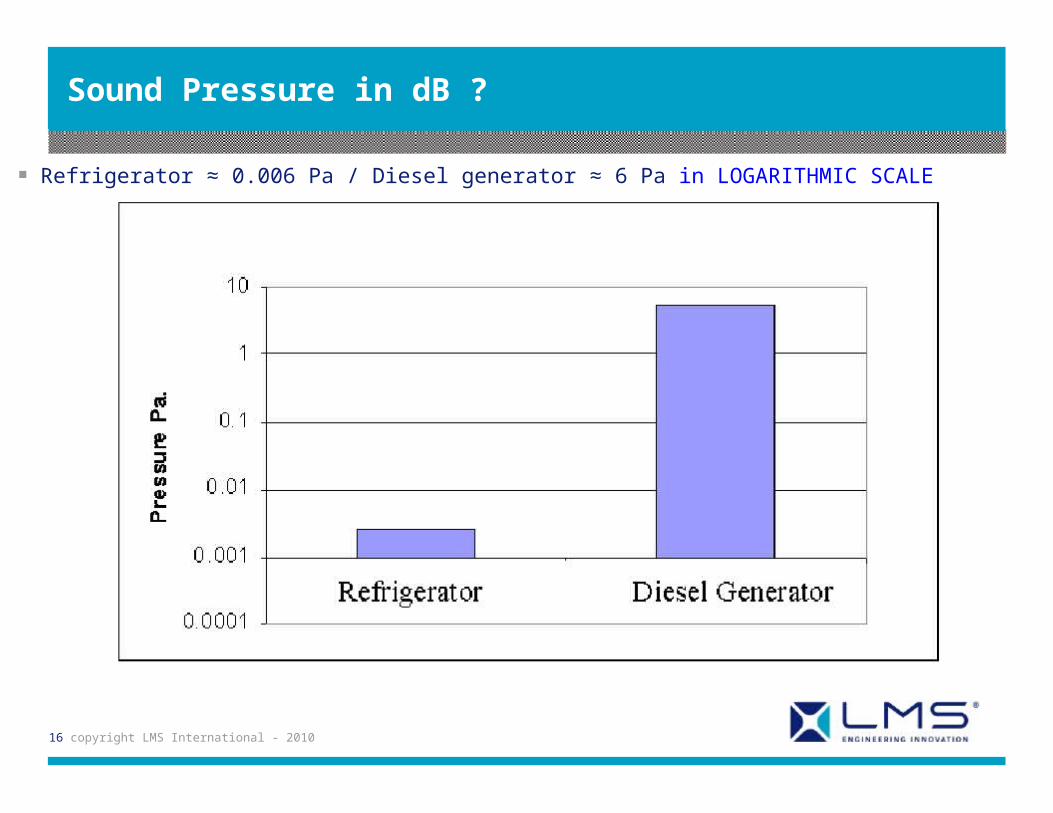
Sound Pressure in dB ?
Refrigerator ≈ 0.006 Pa / Diesel generator ≈ 6 Pa in LOGARITHMIC SCALE

17 copyright LMS International - 2010
Sound Pressure in dB ?
The human ear responds logarithmically rather than linearly to stimuli (pressuredisturbance)
18 copyright LMS International - 2010
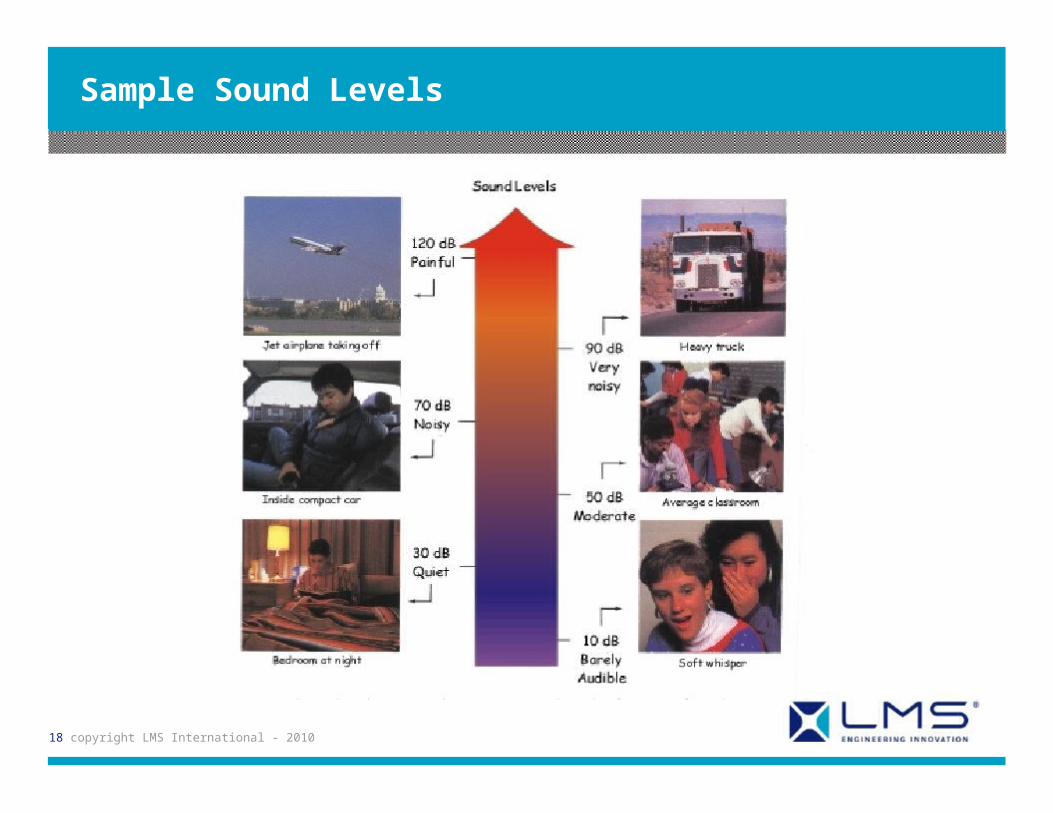
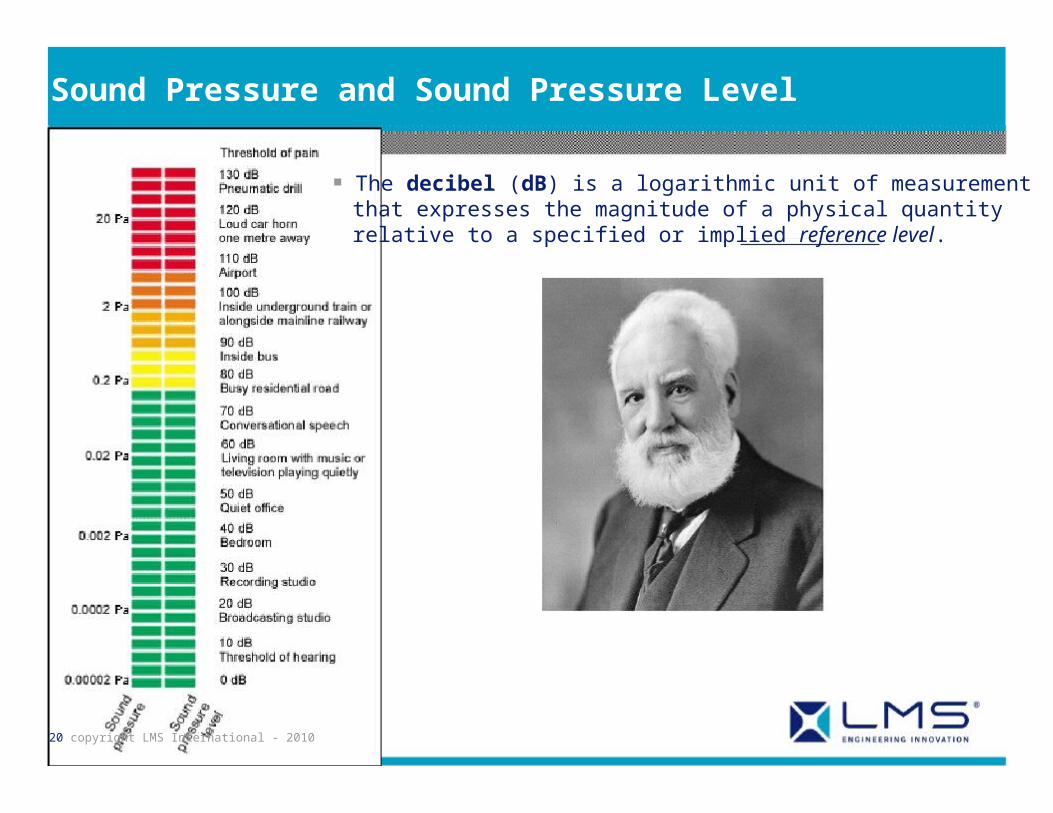
Sample Sound Levels

19 copyright LMS International - 2010
Basic Acoustics TheoryPressure and Decibels
The Bel scale is a logarithmic scale well suited to human hearing,which is rather logarithmic than linear in its behaviour. deciBel, ordB, is 1/10th of a Bel.
The Sound Pressure Level SPL (dB) is defined as:
SPL = 0 dB is the threshold of hearingSPL = 120 dB is the threshold of painSPL = 94 dB = 1PaSymbol used for SPL (e.g. in displays): L, L(dB), L dB
ref ref
reference pressure pref = 2.10-5 (20 μPa) is minimumaudible pressure at 1 kHz
RMS pressure mean square pressure
20 copyright LMS International - 2010
Sound Pressure and Sound Pressure Level
The decibel (dB) is a logarithmic unit of measurementthat expresses the magnitude of a physical quantityrelative to a specified or implied reference level.

21 copyright LMS International - 2010
20 Hz 50 100 200 500 1 k 2 k 5 k 10 k 20 kHz
Basic Acoustics TheoryHuman Auditory Range
L dBPAIN THRESHOLD
HEARING DOMAIN
MUSIC
SPEECH
HEARING THRESHOLD
130
120
110
100
90
80
70
60
50
40
30
20
10
0

22 copyright LMS International - 2010
Decibel “Funny” Math
6 dB = Double Sound Pressure Level
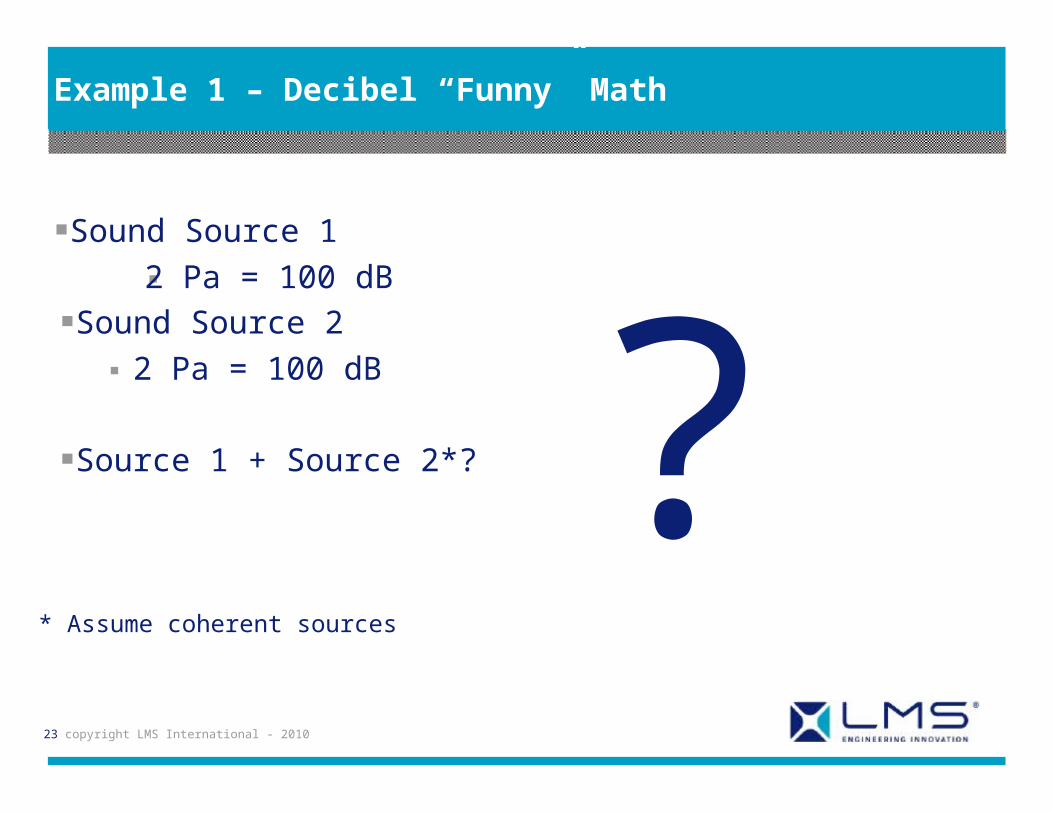
Example 1 – Decibel “Funny” Math
Sound Source 1
2 Pa = 100 dB
?Sound Source 2
2 Pa = 100 dB
Source 1 + Source 2*?
* Assume coherent sources
23 copyright LMS International - 2010

Example 1 – Decibel “Funny” Math
Sound Source 1
2 Pa = 100 dB
Sound Source 2
2 Pa = 100 dB
Source 1 + Source 2
4 Pa = 106 dB
100 dB + 100 dB = 106 dB!
* Assume coherent sources
24 copyright LMS International - 2010

25 copyright LMS International - 2010
Adding Sources Together
Coherent
vs
Incoherent
Makes a Difference!

Pa
Amplitude
Pa
Amplitude
26 copyright LMS International - 2010
0.00 2000.00
2.00
60.0e-6
Summation of Coherent Sinusoidal Sound Sources
1000 Hz - Overall Level: 100 dB
100 dB (2 Pa) at 1000 Hz *
100 dB (2 Pa) at 1000 Hz
+
* In Phase
0.00 2000.00Hz
2.00
60.0e-6
Hz
1000 Hz - Overall Level: 100 dB

Pa
Amplitude
Pa
Amplitude
Pa
Amplitude
0.00 2000.00
2.00
Summation of Coherent Sinusoidal Sound Sources
1000 Hz - Overall Level: 100 dB
0.00 2000.00Hz
0.00
2.00
Hz
1000 Hz - Overall Level: 100 dB
100 dB (2 Pa) at 1000 Hz
+0.00
* In Phase
0.00
27 copyright LMS International - 2010
2000.00Hz
4.01
0.00
Summation of Coherent Sources: 106 dB
100 dB (2 Pa) at 1000 Hz *
=
106 dB (4 Pa) Overall
6 dB Increase
Pa
Amplitude
Pa
Amplitude
0.00 3000.00Hz
2.00
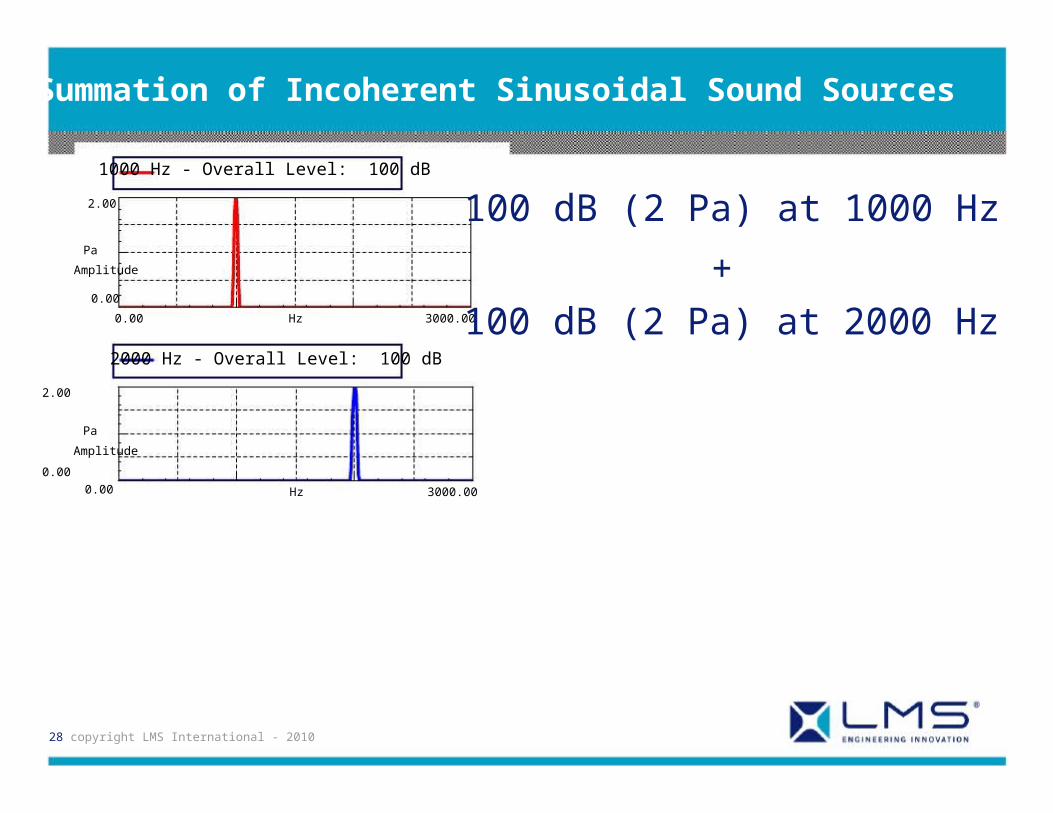
Summation of Incoherent Sinusoidal Sound Sources
1000 Hz - Overall Level: 100 dB
0.00
28 copyright LMS International - 2010
3000.00Hz
2000 Hz - Overall Level: 100 dB
2.00
0.00
100 dB (2 Pa) at 1000 Hz
100 dB (2 Pa) at 2000 Hz
+0.00

Pa
Amplitude
Pa
Amplitude
Pa
Amplitude
0.00 3000.00Hz
2.00
Summation of Incoherent Sinusoidal Sound Sources
1000 Hz - Overall Level: 100 dB
0.00 3000.00Hz
2.00
0.00
2000 Hz - Overall Level: 100 dB
100 dB (2 Pa) at 1000 Hz
100 dB (2 Pa) at 2000 Hz
+0.00
=
103 dB (2.82 Pa) Overall
0.00
29 copyright LMS International - 2010
3000.00Hz
2.00
89.9e-6
Summation of Incoherent Sources: 103 dB
3 dB Increase
Pa
Amplitude
Pa
Amplitude
30 copyright LMS International - 2010
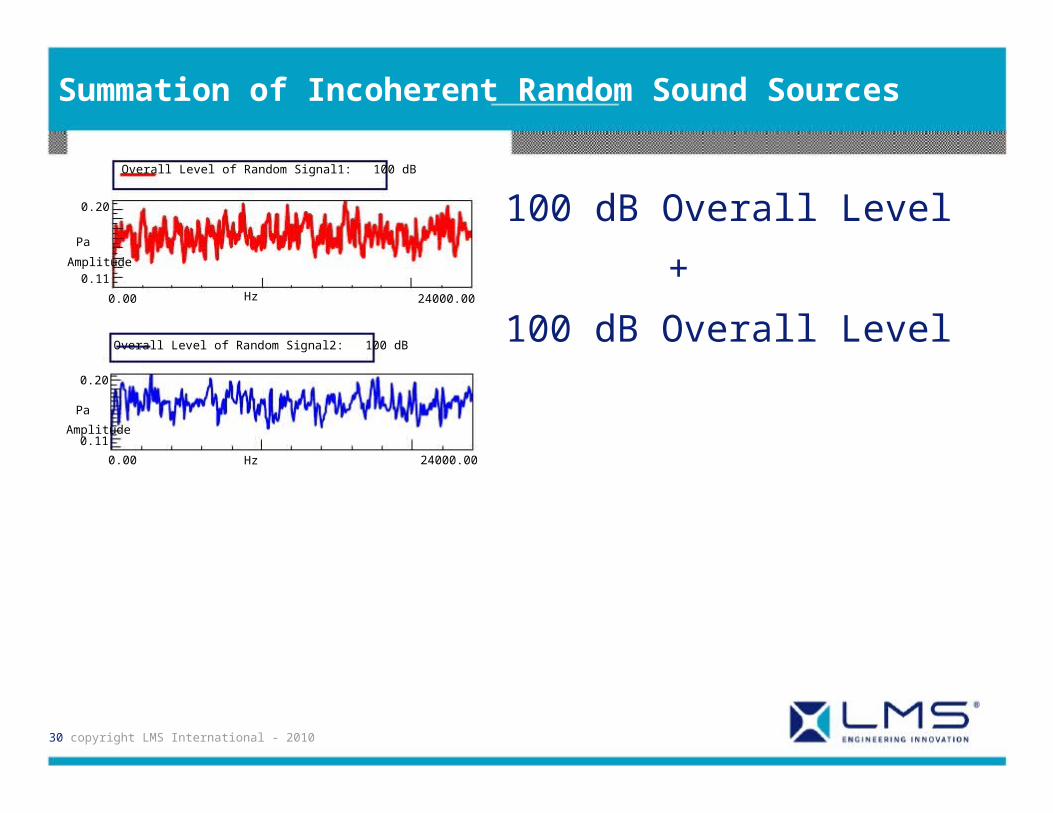
100 dB Overall Level
100 dB Overall Level
+
0.20
0.11
Summation of Incoherent Random Sound Sources
Overall Level of Random Signal1: 100 dB
0.00
0.00
24000.00
24000.00
0.20
0.11
Hz
Overall Level of Random Signal2: 100 dB
Hz

Pa
Amplitude
Pa
Amplitude
Pa
Amplitude
0.00
31 copyright LMS International - 2010
24000.00Hz
0.28
0.11
Summation of Random Signals Overall Level: 103 dB
0.00 24000.00Hz
0.20
0.11
Summation of Incoherent Random Sound Sources
Overall Level of Random Signal1: 100 dB
100 dB Overall Level
+
100 dB Overall Level
=
103 dB Overall Level0.00 24000.00
100 dB100 dB
Hz
Overall Level of Random Signal1:Overall Signal of Random Signal2:
0.20
0.11
Overall Level of Random Signal2: 100 dB
3 dB Increase
32 copyright LMS International - 2010
Decibel “Funny” Math
6 dB increase when adding coherent sources
3 dB increase when adding incoherent sources

Example 2 – Decibel “Funny” Math
Sound Source 1 10 Pa = 113 dB
Sound Source 22 Pa = 100 dB
Sound Source 32 Pa = 100 dB
Source 1 + Source 2 + Source 3*10.39 Pa (RMS sum) = 114.3 dB
113 dB + 100 dB + 100 dB = 114.3 dB* Assume incoherent sources
33 copyright LMS International - 2010
Sum is almost identical to largest source
1) One source can dominate, affecting others does not help
2) If all sources equal, must address all
34 copyright LMS International - 2010
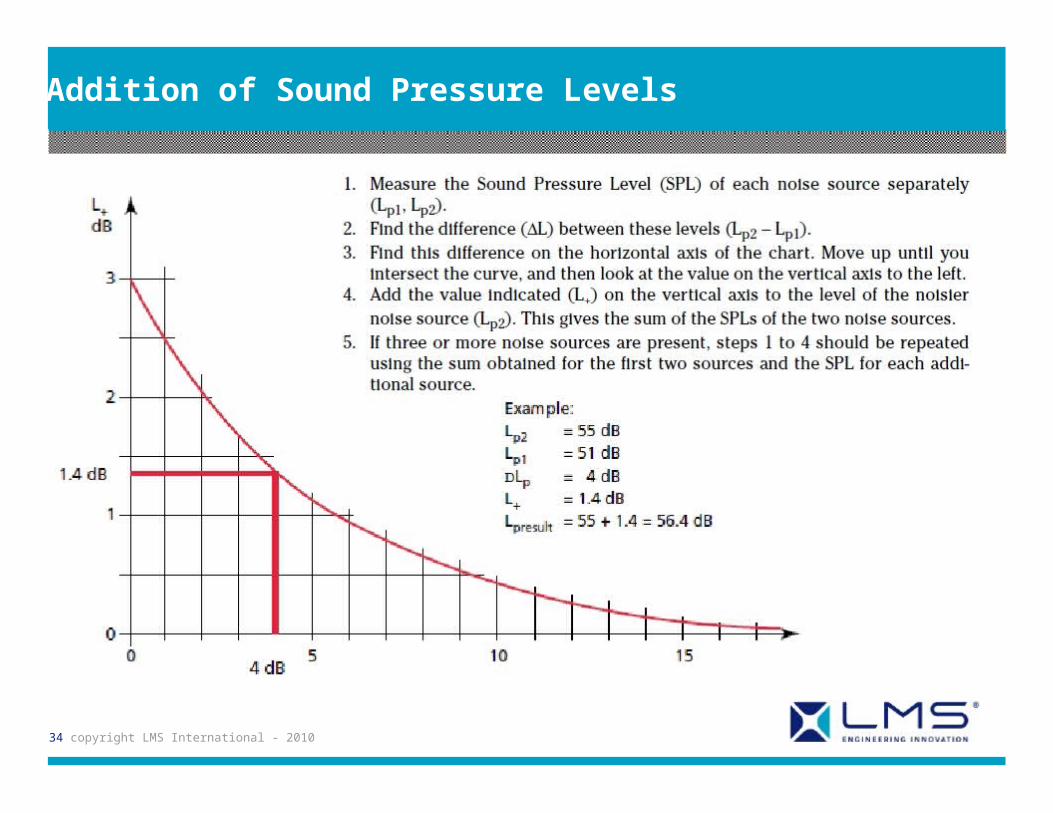
Addition of Sound Pressure Levels
35 copyright LMS International - 2010
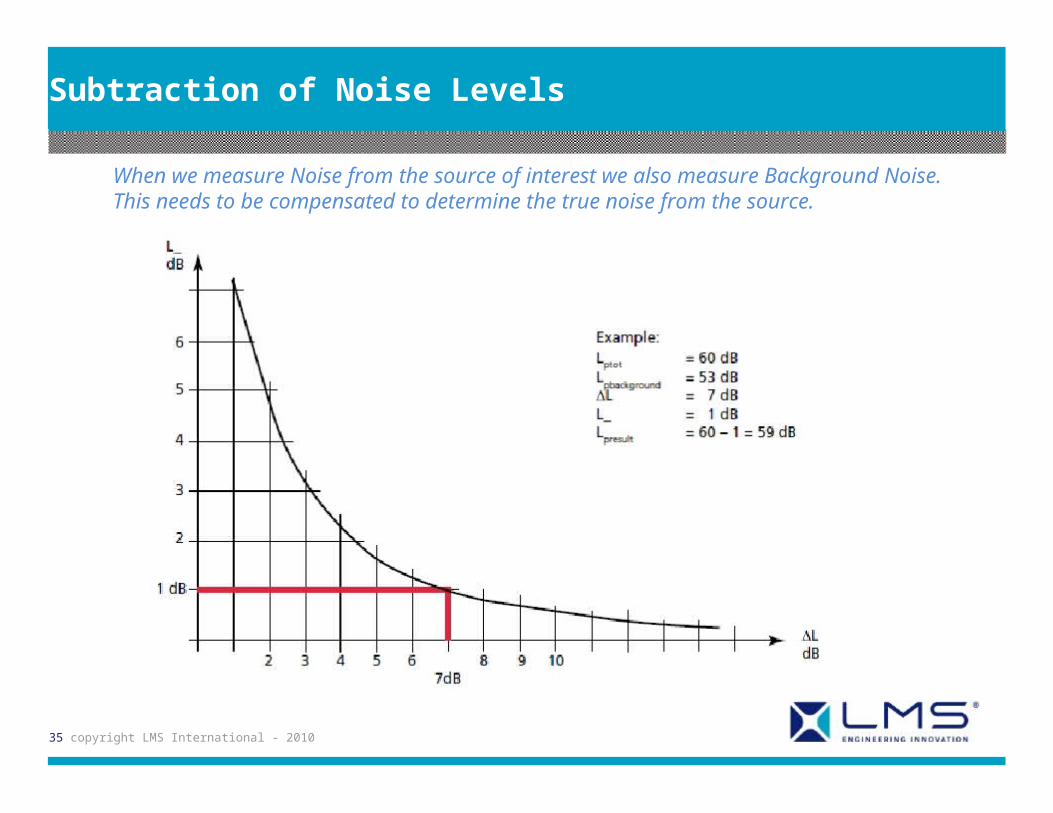
Subtraction of Noise Levels
When we measure Noise from the source of interest we also measure Background Noise.This needs to be compensated to determine the true noise from the source.

36 copyright LMS International - 2010
Background Noise Criterion
If ΔL is less than 3 dB, the background noise is too high for anaccurate measurement and the correct noise level cannot befound until the background noise has been reduced. If, on theother hand, the difference is more than 10 dB, the backgroundnoise can be ignored.
The Measured Noise should be at least 10 dB more than theambient noise or background noise
ISO 11202
ISO 3740 (series), ISO 9614 (series) ….

37 copyright LMS International - 2010
Free field – Double distance
When doubling distance from source
6 dB decrease for a point source
3 dB decrease for a line source
38 copyright LMS International - 2010
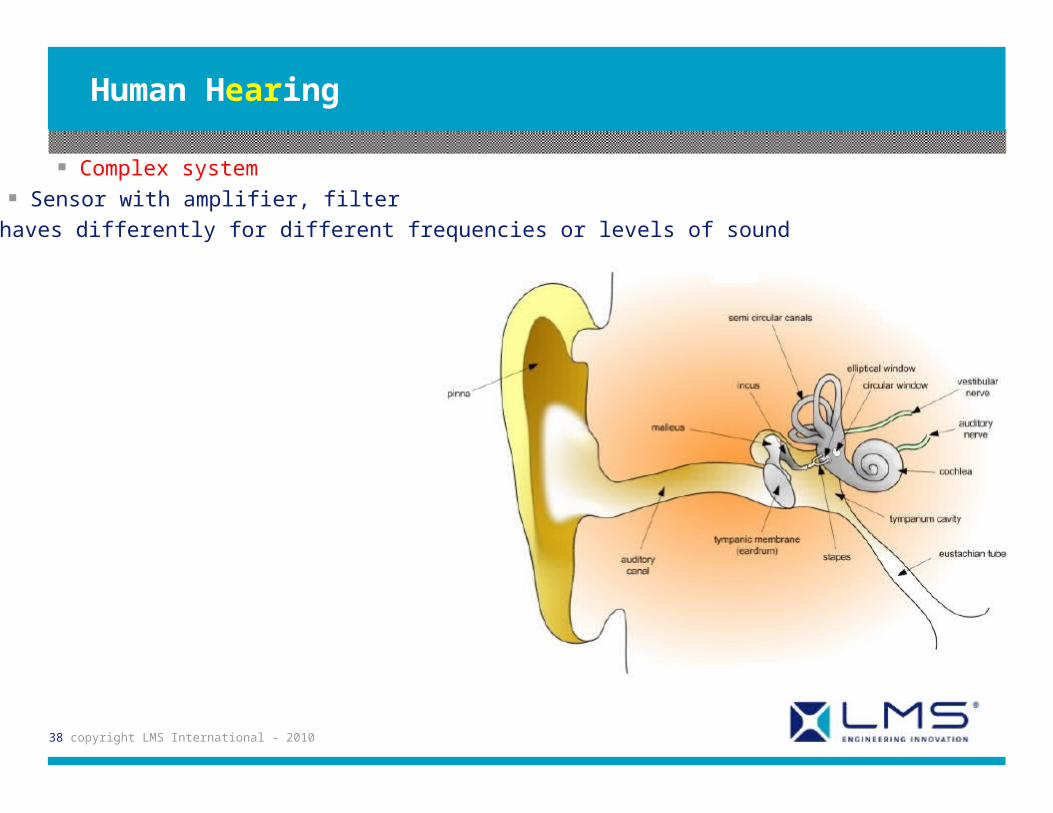
Human Hearing
Complex system
Sensor with amplifier, filter
Behaves differently for different frequencies or levels of sound
39 copyright LMS International - 2010
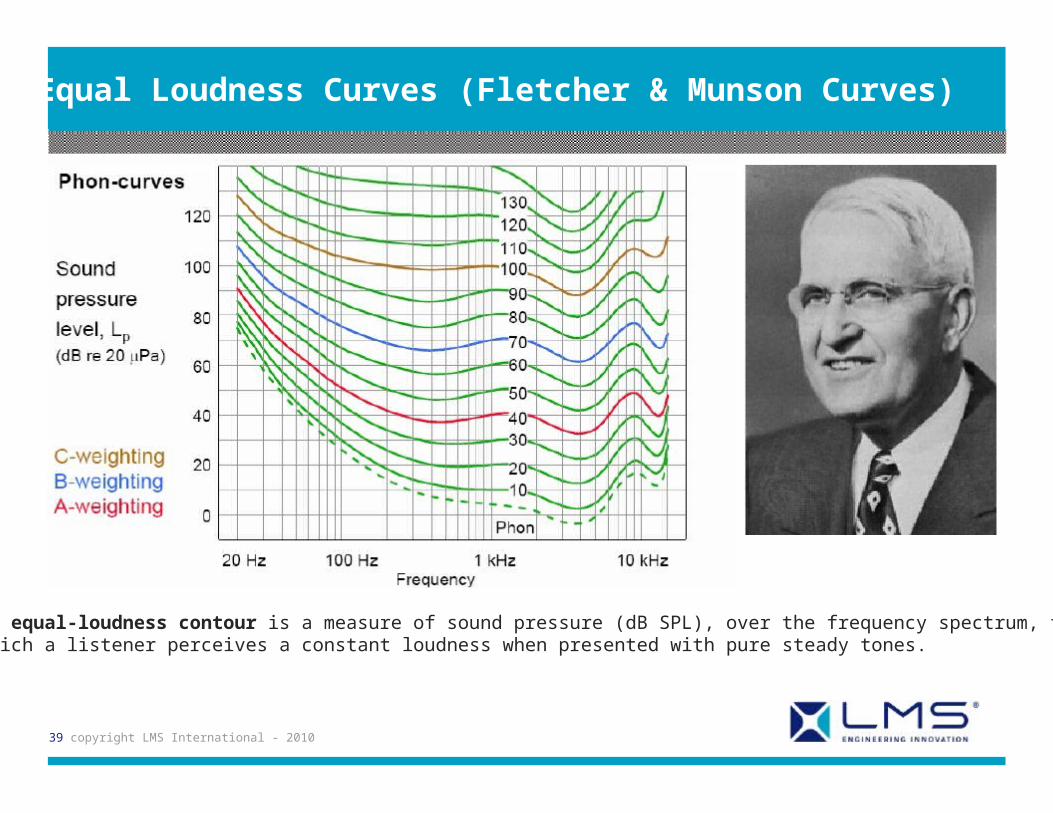
Equal Loudness Curves (Fletcher & Munson Curves)
An equal-loudness contour is a measure of sound pressure (dB SPL), over the frequency spectrum, forwhich a listener perceives a constant loudness when presented with pure steady tones.

40 copyright LMS International - 2010
A-,B-,C- and D-weighting
Filter with similar attributes to ear
Simple curve shape, attenuates low frequencies
1000 Hz - no gain/attenuation, used for microphone cals
dB(A) maps on 40dBdB(B) maps on 70dB

gain(dB)
41 copyright LMS International - 2010
Basic AcousticsA-,B-,C- and D-weighting
A-weighting corresponds to the 40-phone curve, i.e. the equal loudness contour which passes 40 dB at 1kHz. Is most often used
B- and C-weighting are similar to A-weighting in concept, but correspond to the 70- and 100-phone equalloudness contours
D-weighting has been introduced for the purpose of measuring aircraft noise. It attributes more significanceto the 1-10 kHz region
frequency (Hz)

1/1 octave
Center Frequency
(Hz)
50
100
200
400
800
1600
3150
6300
12600
63
125
250
500
1000
2000
4000
8000
16000
80
160
315
630
1250
2500
5000
10000
20160
1/n OCTAVE filter 1/1 1/3 1/12
Filter bandwidth
(about % of the center frequency)
70% 23% 6%
PressuredB/2e-005[Pa]
42 copyright LMS International - 2010
Logarithmic
frequency scale63 125 250 500 1000 2000 4000Frequency [Hz]
20
Octaves
16 31.5
Traces: 2/2
X2
2
1
Octave analysis – Constant % bandwidth
380
70
60
50
40
30
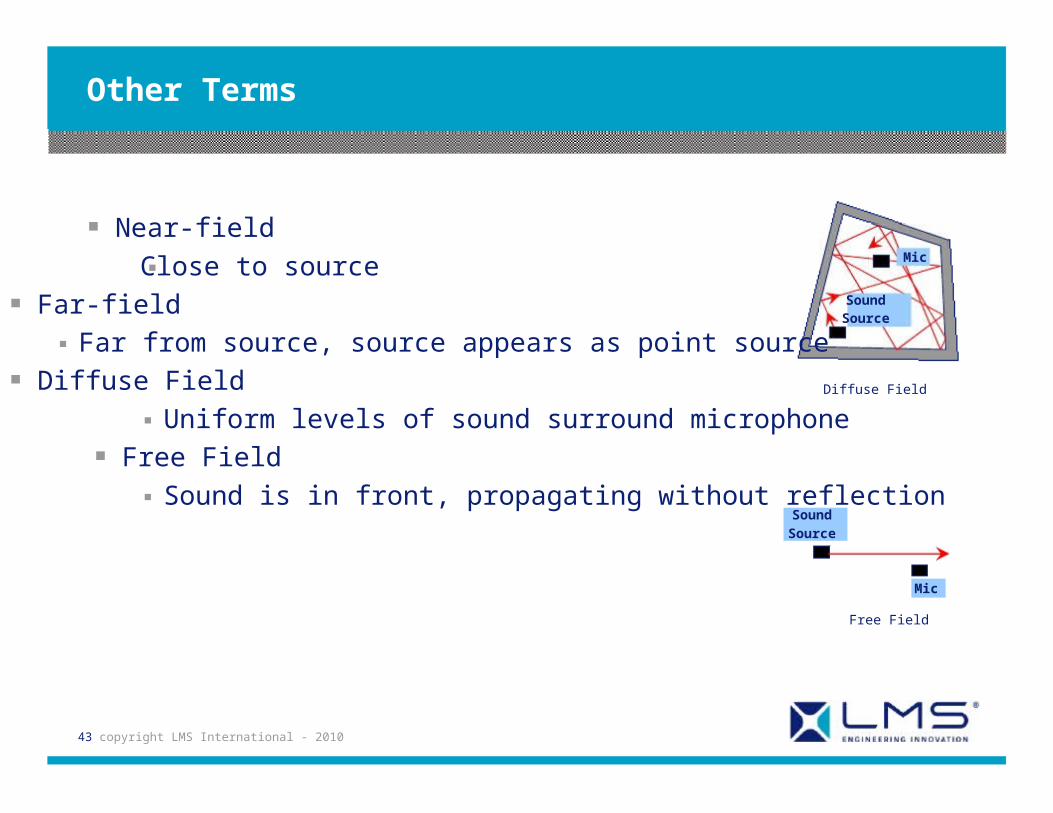
Other Terms
Near-field
Close to source
Far-field
Far from source, source appears as point source
Diffuse Field
SoundSource
Diffuse Field
Mic
Uniform levels of sound surround microphone
Free Field
Sound is in front, propagating without reflectionSound
Source
Mic
Free Field
43 copyright LMS International - 2010

Propagation of SoundAnechoic Room
Highly absorbing surfaces
Source radiates as in a free field
Almost no reverberation
To measure:
sound power of source
directivity pattern of radiating source
Anechoic rooms are more effective at high than at low frequencies. The lowestfrequency at which an anechoic room can be used depends on the room volumeand the depth of the wedges
A very large room (several m’s) with 1-2 m wedges is effective down to 100 Hz
44 copyright LMS International - 2010
anechoic room
45 copyright LMS International - 2010
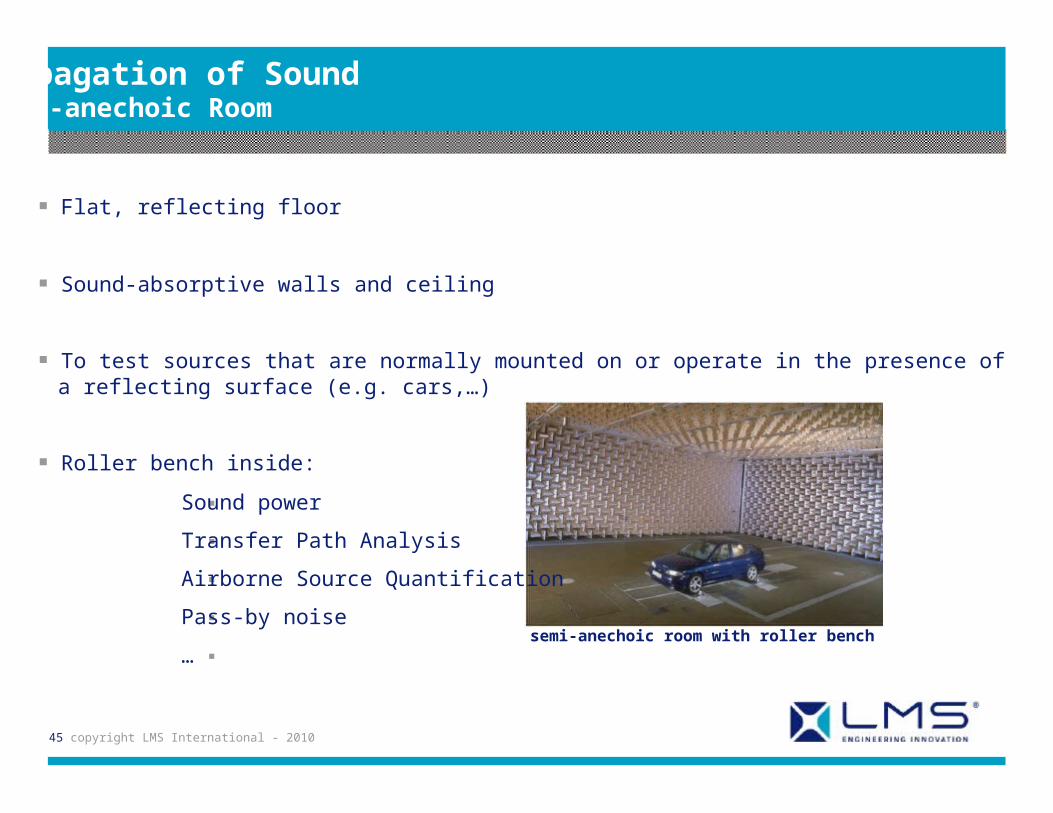
Propagation of SoundSemi-anechoic Room
Flat, reflecting floor
Sound-absorptive walls and ceiling
To test sources that are normally mounted on or operate in the presence ofa reflecting surface (e.g. cars,…)
Roller bench inside:
Sound power
Transfer Path Analysis
Airborne Source Quantification
Pass-by noise
…semi-anechoic room with roller bench

Propagation of SoundReverberation Room
High-reflecting, non-parallel walls
Diffuse field: nearly uniform sound intensity
To measure:
sound power of sources
Sound absorptive properties of materials
Sound transmission through building elements
At low frequencies, the frequency response to wide-band noise shows severalpeaks corresponding to the room modes. At higher frequencies, the individualmodes begin to overlap and are less obvious
To make the room response more uniform at lower frequencies, low-frequencysound absorptive elements and rotating diffusers are often used
46 copyright LMS International - 2010
Sound path
Sound Source
typical reverberation room

47 copyright LMS International - 2010
Intensity

Sound is a vector quantity that has both magnitude and direction, because the energywill flow in some directions but not others
Intensity is dependent on the source’s properties and the distance from the source
48 copyright LMS International - 2010
Watts
m2 PowerArea
Energy
Area Time
Force Distance
Area Time
What is Intensity?
Sound intensity is the average rate of sound energy transmitted in the specifieddirection through a unit area (1 m2) normal to this direction at the point considered.
Intensity Pressure x Particle Velocity

49 copyright LMS International - 2010
W W
d S = WIS
I +
d S = 0IS
Sound power can bemeasured to anaccuracy of 1dB fromsources as much as10dB lower than thebackground noise.
Stationary backgroundnoise has no effect onmeasured power.
• ISO Standard
I +
I +
I -
I -
I -
I +
I +
I +
I +
Sound Intensity:Effect of Background Noise
50 copyright LMS International - 2010
Intensity: p-p probe
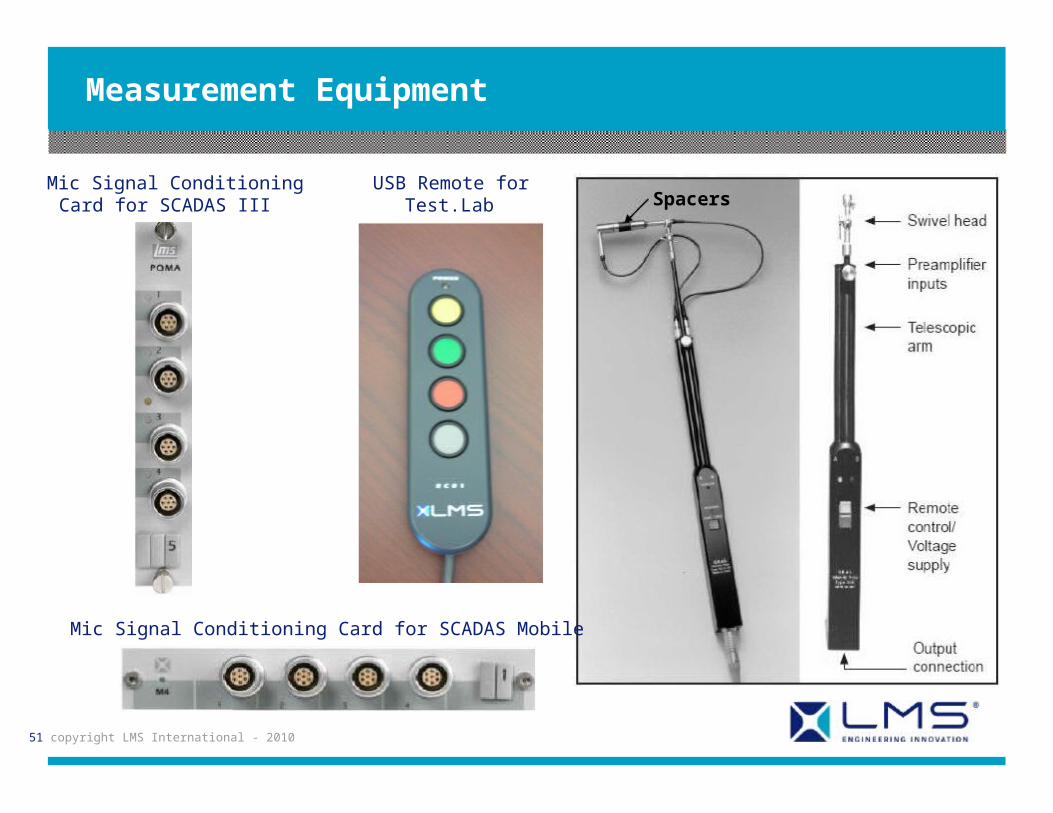
Measurement Equipment
SpacersMic Signal Conditioning
Card for SCADAS III
Mic Signal Conditioning Card for SCADAS Mobile
51 copyright LMS International - 2010
USB Remote forTest.Lab

Measurement ConsiderationsFrequency Limitations
Lower Frequency LimitPhase mismatch between microphones
Typically < 0.3˚ degrees for matchedprobe microphones
Ex: At 63 Hz the wavelength isapproximately 5.5 m and the change ofphase over a 12mm spacer is only 0.8°so a phase mismatch of ± 0.3° willcause a significant error in the intensity
52 copyright LMS International - 2010
Upper frequency Limit
Spacer distance :
< 1/6th of the wavelength

Grade of Accuracy Bias ErrorFactor
(dB)
Precision (Grade 1) 10
Engineering (Grade 2) 10
Survey (Grade 3) 7
Pressure Residual Intensity Index (PRII)
Pressure Residual Intensity Index (PRII) – quantifies the phase mismatch
Defined as a “noise floor” below which measurements cannot be made
Caused by a small phase difference between the 2 signals, which is interpreted asintensity along the spacer
Measured in an intensity calibrator which gives the same signal to both mics (0 intensity)
Phase change in degrees along the spacer distance must be over 5 times the phasemismatch for accuracy within 1dB
Dynamic Capability Index (Ld) – gives a limit to the Pressure Intensity Index that can bemeasured with accuracy, applying a bias error correction factor (K)
53 copyright LMS International - 2010

54 copyright LMS International - 2010
PRII Measurement
Notice the PRII Index is afunction of frequency and
ranges typically between 15dB to 25 dB

dBLp LI
LdPIo
React. index
Residual
Intensitylevel
frequencyResidual intensity level < Sound intensity level < Sound pressure level
55 copyright LMS International - 2010
Acquisition module
Lp
Sound Intensity:PRII, RI and Reactivity Index

56 copyright LMS International - 2010
Source localization using SI:Intensity measurement at 35 cm from washing machine

57 copyright LMS International - 2010
Source localization using SI:Intensity measurement at 65 cm from washing machine

ISO Quality Checks
ISO 9614 Field Indicators ensure the quality of the measurements and meshes
F2: Surface pressure-intensity indicator
Examines the difference between the pressure and the absolute values of intensity,which tells how diffuse or reactive a field is
• Small value = good measurement conditions
• Large value = probe not aligned well or measuring in a diffuse field
F3: Negative partial power indicator
Examines the difference between measured intensity and pressure while taking thedirection of the intensities into account, which gives amount of extraneous noise
• Positive direction = intensity from source under investigation
• Negative direction = intensity from extraneous sources
F4: Non-uniformity indicator
Indicates the measure of spatial variability that exists in the field, which verifies themesh adequacy
58 copyright LMS International - 2010
59 copyright LMS International - 2010
Intensity: p-U probe

Pressure velocity probe
Pros:Direct velocity measurementIntensity = simple spectral productNo frequency range limitsNear-field measurementsEasy-to-useSizeDirect input for VL-Acoustics
Contra:All ISO-standards relate to 2-mic probesHard to calibrate (frequency dependant)
60 copyright LMS International - 2010
velocity probe
1 D intensity probes 3D

61 copyright LMS International - 2010
Acoustic Hardware: Microphones

62 copyright LMS International - 2010
Principle of a microphone
Most microphones incorporate a thin diaphragm as the primary transducer which issensitive to the air (sound wave) acting against it. The mechanical movement ofthe diaphragm is converted to an electric output by means a secondarytransducer (Capacitor or Condenser type, piezoelectric crystal type, Electrodynamictype and Carbon type) that provides an analogous electrical signal.
63 copyright LMS International - 2010
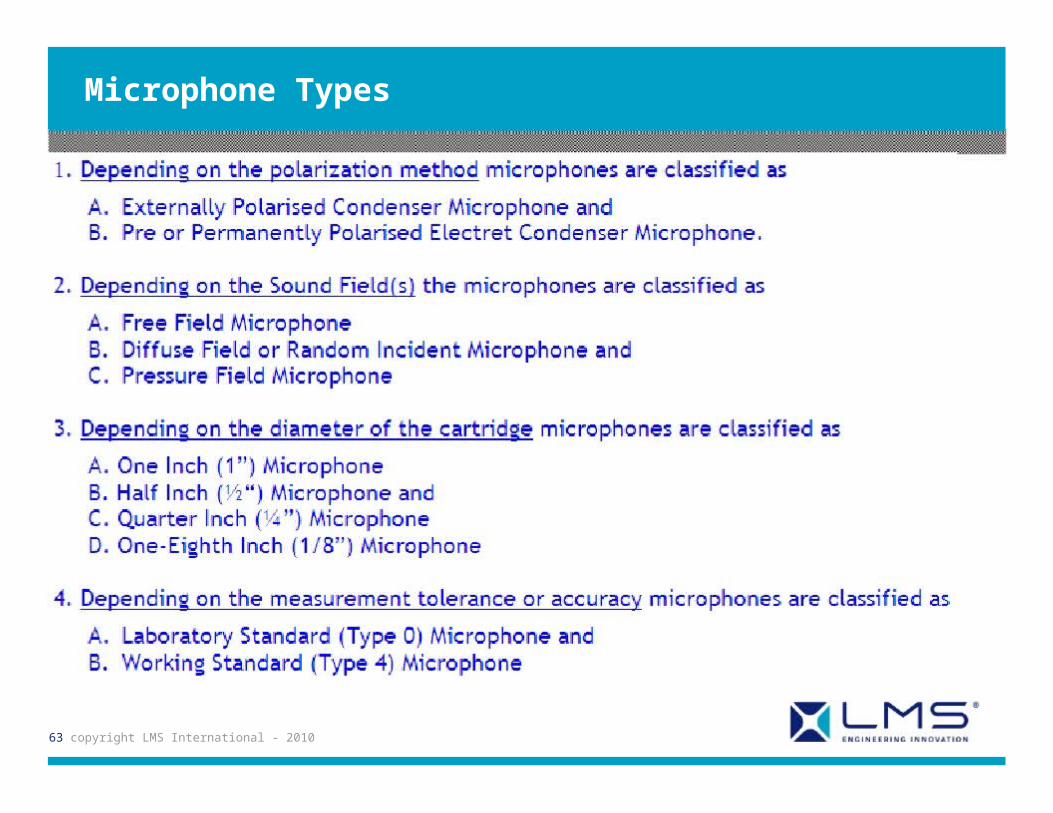
Microphone Types

64 copyright LMS International - 2010
Condenser type – Externally Polarized
The condenser microphone cartridge converts sound pressure to capacitancevariations. This variation in capacitance is converted to an electrical voltageby using a constant electrical charge, which is either permanently built into themicrophone cartridge or applied to it via an external voltage source referred toas preamplifier. The backplate is polarised, either from an external voltagesource as the case with the externally polarized microphones or from apermanently charged polymer known as electret, as employed in theprepolarized condenser microphones .

65 copyright LMS International - 2010
Microphones

66 copyright LMS International - 2010
Microphones
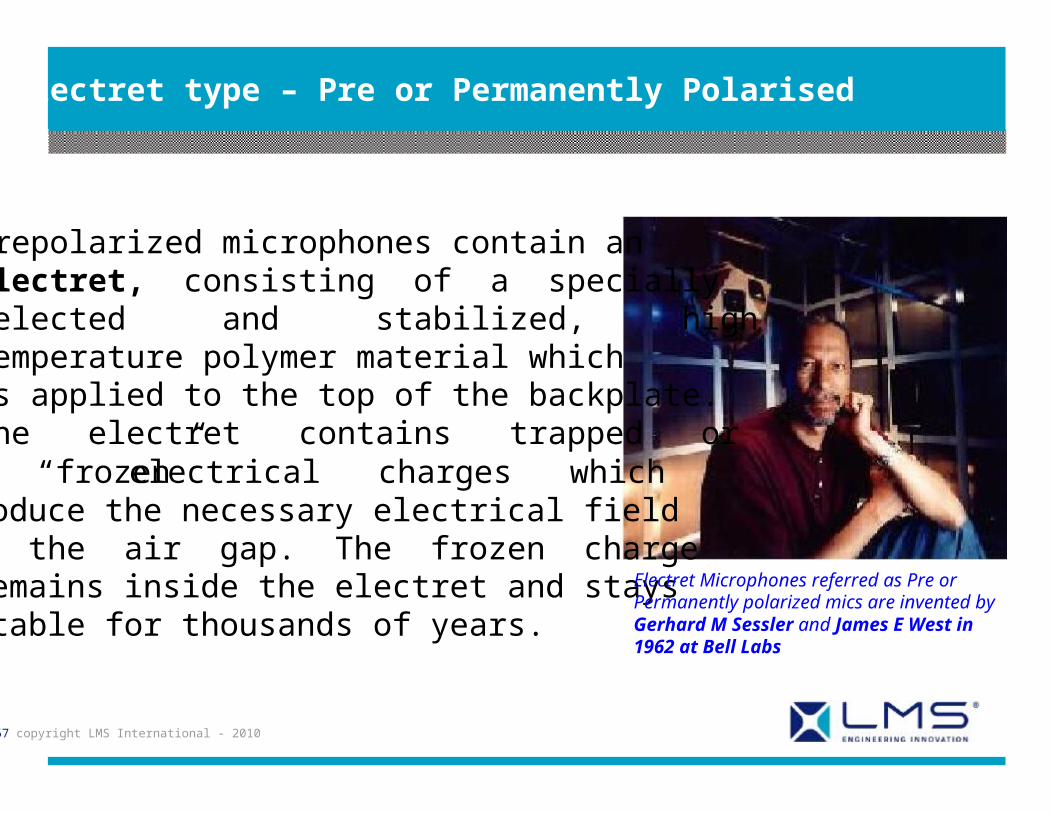
Electret type – Pre or Permanently Polarised
Prepolarized microphones contain anelectret, consisting of a speciallyselected and stabilized, hightemperature polymer material whichis applied to the top of the backplate.The electret contains trapped or
“frozen” electrical charges whichproduce the necessary electrical fieldin the air gap. The frozen chargeremains inside the electret and staysstable for thousands of years.
67 copyright LMS International - 2010
Electret Microphones referred as Pre orPermanently polarized mics are invented byGerhard M Sessler and James E West in1962 at Bell Labs
68 copyright LMS International - 2010
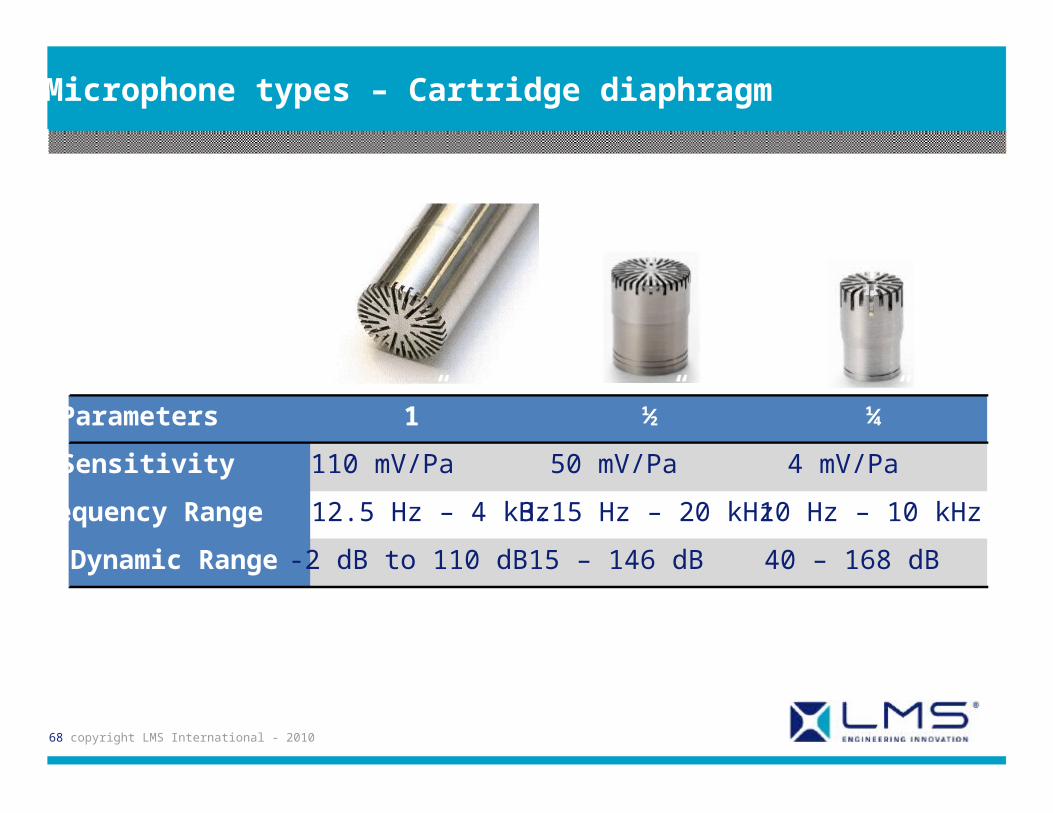
Microphone types – Cartridge diaphragm
ParametersSensitivity
1”110 mV/Pa
½”50 mV/Pa
¼”4 mV/Pa
Frequency Range 12.5 Hz – 4 kHz 3.15 Hz – 20 kHz 10 Hz – 10 kHzDynamic Range -2 dB to 110 dB 15 – 146 dB 40 – 168 dB
69 copyright LMS International - 2010
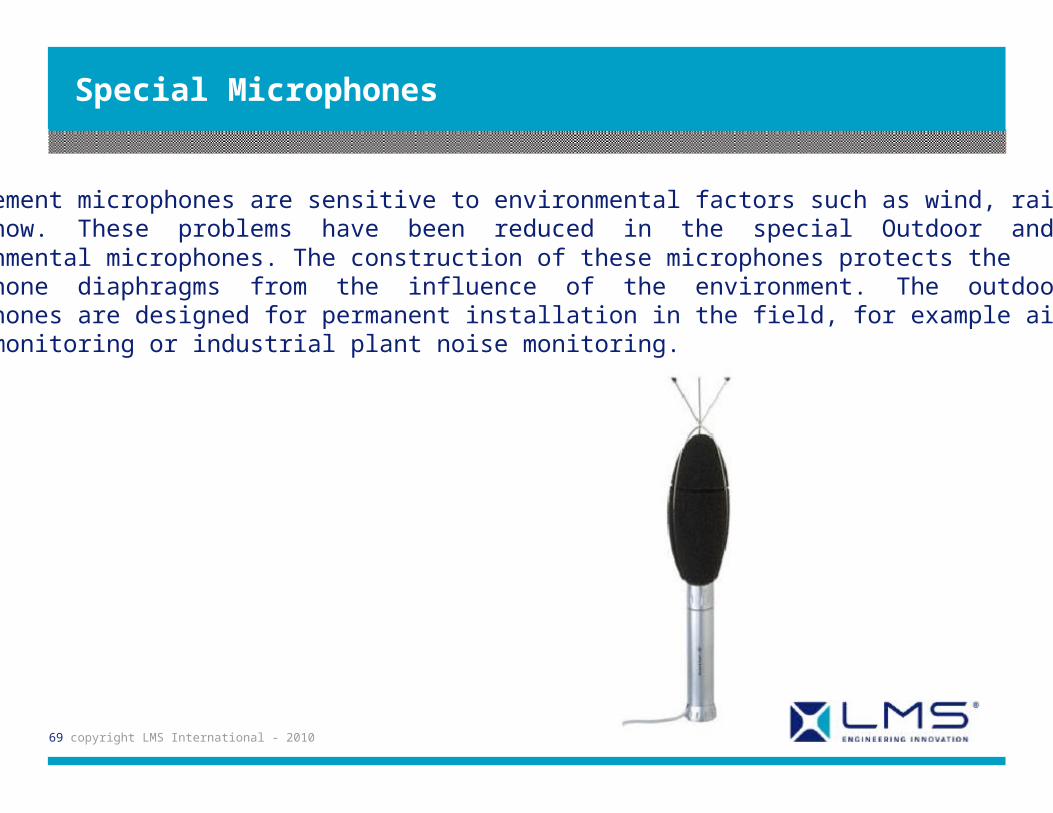
Special Microphones
Measurement microphones are sensitive to environmental factors such as wind, rainand snow. These problems have been reduced in the special Outdoor andEnvironmental microphones. The construction of these microphones protects themicrophone diaphragms from the influence of the environment. The outdoormicrophones are designed for permanent installation in the field, for example airportnoise monitoring or industrial plant noise monitoring.

70 copyright LMS International - 2010
Sound Level Meter

71 copyright LMS International - 2010
Noise Measurement Considerations
Time Weighting
Fast (125 m sec) / Slow (1 sec) / Impulse (35 m sec)
Frequency Weighting
Weighting Network: A, B, C, D or Lin

72 copyright LMS International - 2010
Calibration
Mic./SLM Performance Check
Periodic calibration – Reciprocity or Comparison Method
Field Check - Before & After Measurements
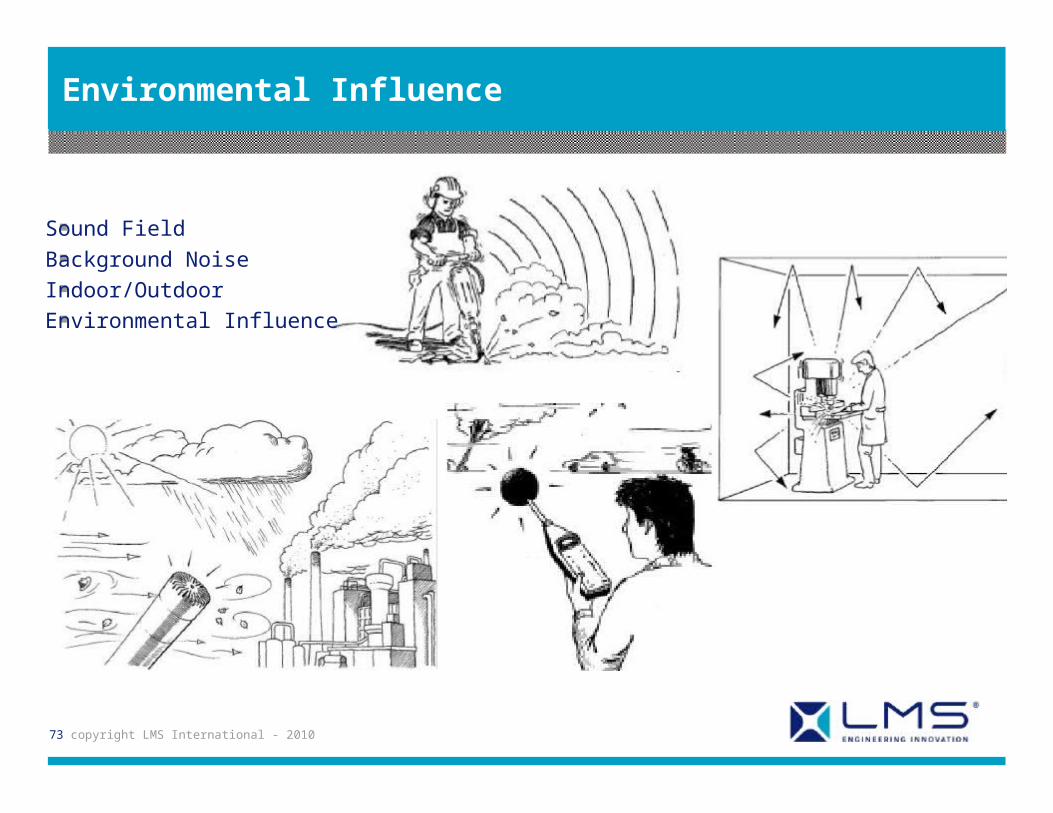
Environmental Influence
Sound Field
Background Noise
Indoor/Outdoor
Environmental Influence
73 copyright LMS International - 2010

Gert Sablon, LMS International
Thank You