get your science used—six guidelines to improve your · pdf fileget your science...
TRANSCRIPT
Get Your Science Used—Six Guidelines to Improve YourProducts
Circular 1419
U.S. Department of the InteriorU.S. Geological Survey

Get Your Science Used—Six Guidelines to Improve Your Products
By Suzanne C. Perry, Michael L. Blanpied, Erin R. Burkett, Nnenia M. Campbell, Anders Carlson, Dale A. Cox, Carolyn L. Driedger, David P. Eisenman, Katherine T. Fox-Glassman, Sherry Hoffman, Susanna M. Hoffman, Kishor S. Jaiswal, Lucile M. Jones, Nicolas Luco, Sabine M. Marx, Sean M. McGowan, Dennis S. Mileti, Morgan P. Moschetti, David Ozman, Elizabeth Pastor, Mark D. Petersen, Keith A. Porter, David W. Ramsey, Liesel A. Ritchie, Jessica K. Fitzpatrick, Kenneth S. Rukstales, Timothy L. Sellnow, Wendy L. Vaughon, David J. Wald, Lisa A. Wald, Anne Wein, and Christina Zarcadoolas
Circular 1419
U.S. Department of the InteriorU.S. Geological Survey
U.S. Department of the InteriorSALLY JEWELL, Secretary
U.S. Geological SurveySuzette M. Kimball, Director
U.S. Geological Survey, Reston, Virginia: 2016
For more information on the USGS—the Federal source for science about the Earth, its natural and living resources, natural hazards, and the environment—visit http://www.usgs.gov/ or call 1–888–ASK–USGS (1–888–275–8747).
For an overview of USGS information products, including maps, imagery, and publications, visit http://www.usgs.gov/pubprod/.
Any use of trade, firm, or product names is for descriptive purposes only and does not imply endorsement by the U.S. Government.
Although this information product, for the most part, is in the public domain, it also may contain copyrighted materials as noted in the text. Permission to reproduce copyrighted items must be secured from the copyright owner.
Suggested citation: Perry, S.C., Blanpied, M.L., Burkett, E.R., Campbell, N.M., Carlson, A., Cox, D.A., Driedger, C.L., Eisenman, D.P., Fox-Glassman, K.T., Hoffman, S., Hoffman, S.M., Jaiswal, K.S., Jones, L.M., Luco, N., Marx, S.M., McGowan, S.M., Mileti, D.S., Moschetti, M.P., Ozman, D., Pastor, E., Petersen, M.D., Porter, K.A., Ramsey, D.W., Ritchie, L.A., Fitzpatrick, J.K., Rukstales, K.S., Sellnow, T.S., Vaughon, W.L., Wald, D.J., Wald, L.A., Wein, A., and Zarcadoolas, C., 2016, Get your science used—Six guidelines to improve your products: U.S. Geological Survey Circular 1419, 37 p., http://dx.doi.org/10.3133/cir1419.
ISSN 2330-5703 (online)
iii
Contents
Executive Summary ......................................................................................................................................1Why This Publication?..........................................................................................................................1Why the Workshop? .............................................................................................................................1A Strategy to Improve Understanding ...............................................................................................2Additional Recommendations for the NSHM and USGS ................................................................4
Introduction.....................................................................................................................................................5The National Seismic Hazard Maps ..................................................................................................5A Workshop for the NSHM to Reach New Audiences—Motivation for Creating Science-
Communication Guidelines ....................................................................................................6The Span of Workshop Expertise ..............................................................................................6Workshop Outcomes ...................................................................................................................7
A Strategy to Improve Understanding—Six Guidelines ..........................................................................71. Define Your Goals ..............................................................................................................................8
Prioritizing Audiences ...............................................................................................................102. Know Your Audience ......................................................................................................................12
Risk Perception Trumps Reality ...............................................................................................13Emotion is a Wellspring for Action ..........................................................................................13The Mantra is “Concrete, Local, and Current” .....................................................................14Probability Alone Won’t Get the Message Across ...............................................................14Vivid Content Has Value and Dangers ....................................................................................16Worry, Dread, and A Bias Toward Optimism .........................................................................16
3. Start Where They Are ....................................................................................................................18Communicate in Ways That Work for Your Audience..........................................................18Choose the Right Frame ............................................................................................................20Personalize the Risk ..................................................................................................................20Use Clear and Plain Language ................................................................................................21Match the Literacy Levels of Your Audience ........................................................................21Reduce the Literacy Load to Make Your Language More Clear ........................................22Warning! Same Words, Different Concepts ..........................................................................23Best Practices for Useful Maps ..............................................................................................23
4. Work Together, Stay Open .............................................................................................................24Participatory Processes Can Help ..........................................................................................24What is Design Thinking? .........................................................................................................24A Workshop That Combines The Two ....................................................................................25
5. Evaluate Early and Often ...............................................................................................................25Outputs and Outcomes .............................................................................................................26Types of Questions That Evaluation Can Answer .................................................................26Evaluation Methods ...................................................................................................................26Evaluation Resources ...............................................................................................................29
6. Repeat, Repeat, Repeat .................................................................................................................30
iv
Using the Guidelines....................................................................................................................................30Tips to Get Started With the Six Guidelines ...................................................................................30
References Cited..........................................................................................................................................31Appendix—About the USGS and SAFRR .................................................................................................36
Contents—Continued
Figures1. Simplified National Seismic Hazard Map, which was intended for the general public and
is now being revised based on the six guidelines and other outcomes of a recent work-shop to broaden the understanding and use of the National Seismic Hazard Maps .......5
2. Photograph of civil engineer Keith Porter pitching a product idea for homeowners during a National Seismic Hazard Map workshop brainstorming session ........................................7
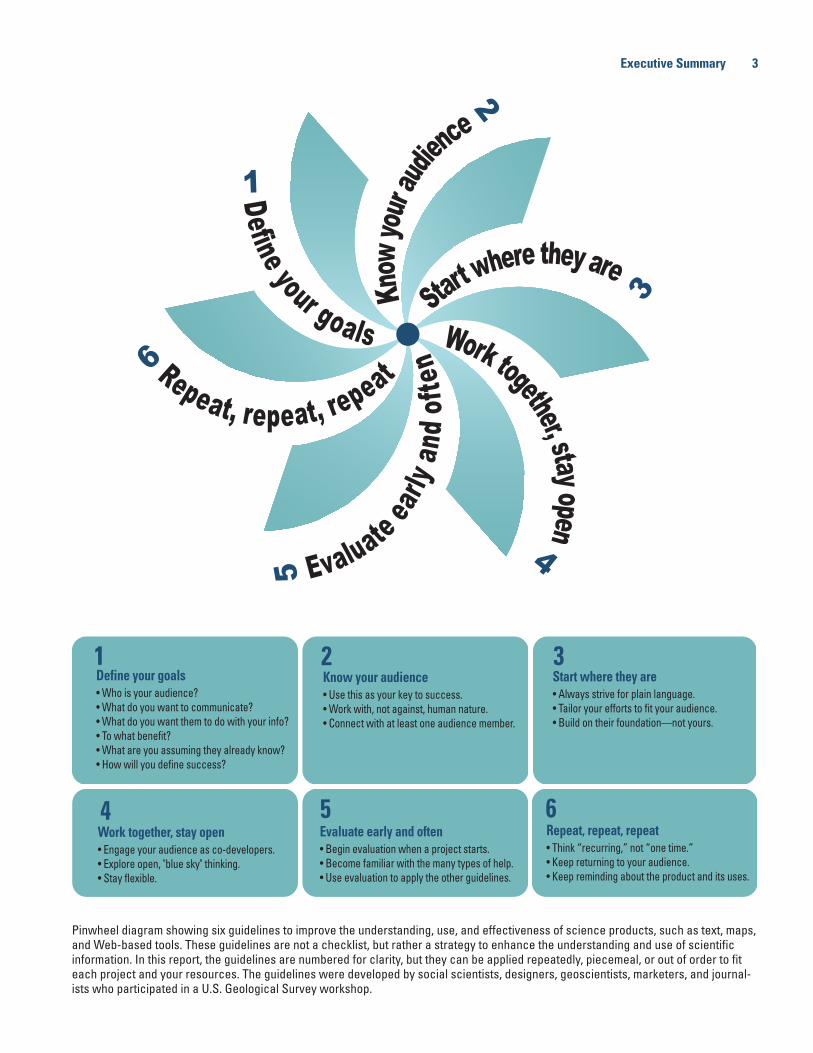
3. Pinwheel diagram showing six guidelines to improve the understanding, use, and effective-ness of science products, such as text, maps, and Web-based tools ................................9
4. Illustration of “stakeholder” orbits ....................................................................................................115. Seismic hazard map for the Evansville Indiana/Henderson Kentucky urban area based on
the National Seismic Hazard Maps .........................................................................................156. Cartoon showing the finite pool of worry .............................................................................................177. Schematic illustration showing the stages of a typical evaluation process ..............................29


Get Your Science Used—Six Guidelines to Improve Your Products
By Suzanne C. Perry,1 Michael L. Blanpied,1 Erin R. Burkett,1 Nnenia M. Campbell,2 Anders Carlson,3 Dale A. Cox,1 Carolyn L. Driedger,1 David P. Eisenman,4 Katherine T. Fox-Glassman,5 Sherry Hoffman,6 Susanna M. Hoffman,7 Kishor S. Jaiswal,1 Lucile M. Jones,1 Nicolas Luco,1 Sabine M. Marx,8 Sean M. McGowan,1 Dennis S. Mileti,2 Morgan P. Moschetti,1 David Ozman,1 Elizabeth Pastor,9 Mark D. Petersen,1 Keith A. Porter,10 David W. Ramsey,1 Liesel A. Ritchie,2 Jessica K. Fitzpatrick,1 Kenneth S. Rukstales,1 Timothy L. Sellnow,11 Wendy L. Vaughon,12 David J. Wald,1 Lisa A. Wald,1 Anne Wein,1 and Christina Zarcadoolas13
Executive SummaryNatural scientists, like many other experts, face challenges when communicating to people
outside their fields of expertise. This is especially true when they try to communicate to those whose background, knowledge, and experience are far distant from that field of expertise.
Why This Publication?
At a recent workshop, experts in risk communication offered insights into the communica-tion challenges of probabilistic hazard products, suggested tips, and shared their strategies for making products that a targeted audience can understand and use. Although the workshop was held to broaden the understanding and use of the U.S. Geological Survey (USGS) National Seis-mic Hazard Maps (NSHM), the workshop outcomes presented in this report can benefit anyone who develops products based on technical information.
Why the Workshop?
In the United States, earthquakes threaten people in 42 of the 50 States, with 16 States at high risk. The NSHM, which forecast earthquake ground shaking, are important products for earthquake loss reduction and thus are a flagship application of the earthquake hazards research done at the USGS. The seismic provisions of U.S. building codes use the NSHM to save lives,
1U.S. Geological Survey. 2Natural Hazards Center, University of Colorado Boulder. 3School of Architecture, University of Southern California. 4Center for Public Health and Disasters, University of California Los Angeles. 5Center for Research on Environmental Decisions, Columbia University, New York, N.Y. 6Designmatters, Art Center College of Design, Pasadena, Calif. 7Hoffman Consulting, Telluride, Colo. 8Center for Research on Environmental Decisions, Earth Institute, Columbia University, New York, N.Y. 9Humantific, New York, N.Y. 10University of Colorado Boulder. 11Nicholson School of Communication, University of Central Florida. 12The Graduate Center, University of New York School of Public Health.13City University of New York School of Public Health.
2 Get Your Science Used—Six Guidelines to Improve Your Products
and to date, the main user group has been engineers. However, because the NSHM provide a broad view of earthquake ground-shaking hazard across the Nation, they have untapped value for planning, risk reduction, and education, and they have potential users as yet unreached.
To expand the use and understanding of the NSHM, the USGS Science Application for Risk Reduction (SAFRR) project convened experts from 18 disciplines, representing decades of research and practice in earthquake science and risk communication. Participants shared understanding from natural, physical, behavioral, and social sciences, as well as from engineer-ing, public health, marketing, communication, and social-impact design. Workshop attendees addressed:
• The aspects of human thinking and behavior that influence comprehension and use of probabilistic information and maps; and
• The roles of participatory processes (which engage potential users in product develop-ment), evaluation (to understand effectiveness), and design thinking (an approach to problem-solving that enables ideas to emerge without preconceptions).
A Strategy to Improve Understanding
Given the number of expert “stovepipes” (disciplines with experts who do not interact or follow each other’s work) at the NSHM workshop, participants provided remarkably consistent guidelines to improve the understanding and use of science through text, maps, and other prod-ucts. Their guidelines are based on decades of research and practice. In this report the guidelines are numbered for clarity, but they can be applied repeatedly, piecemeal, or out of order, to fit each project and your resources:
1. Define your goals.—Who is your audience? What do you want to communicate? What do you want them to do with your information? To what benefit? What are you assum-ing they already know? How will you define success? How realistic are you being? Answer these questions at the start, and return to them periodically; your answers will likely evolve as your project proceeds.
2. Know your audience.—Because they’re people, your audience will understand, learn, remember, and make decisions based on their background, experience, and psychology. You can’t fight human nature so learn how to work with it. Different audiences require different strategies—communication is not “one size fits all.” Don’t be daunted—con-tact with even one audience member can help.
3. Start where they are.—Communicate in ways that work for your audience. Always strive for plain language and use a literacy level that fits your audience. Build on a foundation of their knowledge, expectations, and view—not yours. Don’t expect them to change or learn in order to understand you. You can make simple adjustments to improve their use of your text, maps, and other products.
4. Work together, stay open.—Use participatory processes—that is, engage members of your audience as co-developers; this will increase buy-in and correct preconceptions (on both sides) that can limit success. Employ design thinking, a style of problem solv-ing that focuses on “blue sky” thinking, multiple perspectives, and remaining open, flexible, collaborative, and inclusive.
5. Evaluate early and often.—Begin evaluation when a project starts. Many methods exist, as do many types of help if you are unsure how to get started or how to reduce costs. Much evaluation can be done in-house, with limited expertise. Evaluation will help you apply the other guidelines, and vice versa. For example, when you talk with an audience member you are conducting evaluation.
6. Repeat, repeat, repeat.—Every aspect of this process is iterative. In particular, keep returning to members of your audience for feedback, questions, and insights. Expect
Executive Summary 3
Start where they are
Know
your
audienc
e
Define your goalsRepeat, repeat, repeat
Evaluate ea
rly an
d ofte
n Work together, stay open
1
2
3
45
6
Define your goals• Who is your audience?• What do you want to communicate?• What do you want them to do with your info?• To what benefit?• What are you assuming they already know?• How will you define success?
Know your audience• Use this as your key to success.• Work with, not against, human nature.• Connect with at least one audience member.
Start where they are• Always strive for plain language.• Tailor your efforts to fit your audience.• Build on their foundation—not yours.
Repeat, repeat, repeat• Think “recurring,” not “one time.”• Keep returning to your audience. • Keep reminding about the product and its uses.
Evaluate early and often• Begin evaluation when a project starts.• Become familiar with the many types of help.• Use evaluation to apply the other guidelines.
Work together, stay open• Engage your audience as co-developers.• Explore open, "blue sky" thinking.• Stay flexible.
1 2 3
4 5 6
Pinwheel diagram showing six guidelines to improve the understanding, use, and effectiveness of science products, such as text, maps, and Web-based tools. These guidelines are not a checklist, but rather a strategy to enhance the understanding and use of scientific information. In this report, the guidelines are numbered for clarity, but they can be applied repeatedly, piecemeal, or out of order to fit each project and your resources. The guidelines were developed by social scientists, designers, geoscientists, marketers, and journal-ists who participated in a U.S. Geological Survey workshop.
4 Get Your Science Used—Six Guidelines to Improve Your Products
to make more than one product handoff—people need reminding over the long term about the exis-tence, value, and correct uses of your product.
As a test and proof of concept, SAFRR applied these six guidelines to develop this report. To develop future NSHM products for new audiences, the NSHM and SAFRR teams will follow these guidelines.
Additional Recommendations for the NSHM and USGS
Workshop participants made recommendations specific to the NSHM that provide helpful examples of how to apply the six guidelines, so are included in this report. For example, participants demonstrated key steps in the thought process behind selecting an audience. They discussed pros and cons of various audiences, then recom-mended that the NSHM team focus on development of products for and with (1) local (State/city) officials, (2) professional interpreters (the “go-between” experts from academia and consulting who interpret USGS science), and (3) the general public—with the caveat that these are not homogeneous groups and will need further subdivi-sion. Workshop attendees also offered numerous tips about presenting probabilistic products like the NSHM to less technical audiences without “dumbing it down.”
Some USGS practices could limit the success of new products. For example, the USGS carefully distinguishes between earthquake hazard and risk, but most of the population—from average residents to social scientists—perceive these words as synonyms. Thus, when the USGS presents hazard information, most people are likely to interpret it as risk information. When using both concepts, the USGS needs to point out this distinction and explain the differences between the two concepts.
Tips to Get Started With the Six Guidelines
• Start small. Compare the guidelines with the way you make products now, and find one change that might improve your products. Make that part of your routine, then come back and look for another change to try.
• For most people, answering the questions in guideline 1 is the place to start. Don’t worry about answering all the questions immediately. You’ll add and revise as your project goes along.
• If you know members of your target audience, talk to a few of them. If you don’t know anyone, a colleague might. If you can’t reach your target audience, try a related audience—or just use people who are outside your field. Ask them about the information they already use—how they get the information, how they use it, and why.
• Get their feedback on an existing product—it doesn’t have to be one of yours. What resonates? What confuses? Did they walk away with the author’s intended take-home messages?
• Many sections of this report flag aspects of human nature that can influence communication. Identify which might pertain to your products. When you interact with members of your audi-ence, note which come into play.
• Before you get attached to a particular idea, stage an informal workshop to brainstorm possibilities you might not have considered. Try not to steer the ideas in one direction or another. Invite pub-lications staff or Web developers and members of your target audience to make suggestions.
• Write/map/draw with a specific person in mind.
• In the References Cited, an asterisk identifies references that could be particularly helpful as you get started. Most of these are derivative publications that combine findings from research and practice.
• SAFRR is building a collection of online resources at http://www.usgs.gov/natural_hazards/safrr/.
• SAFRR ([email protected]) is happy to share con-tacts if you need to seek expert advice.
Introduction 5
IntroductionNatural scientists, like many other experts, face challenges when communicating to people
outside their fields of expertise. This is especially true when they try to communicate to those whose background, knowledge, and experience are far distant from that field of expertise.
At a recent workshop, experts in risk communication offered insights into the communica-tion challenges of probabilistic hazard products, suggested tips, and shared their strategies for making products that a targeted audience can understand and use. Although the workshop was held to broaden the understanding and use of the U.S. Geological Survey’s (USGS) National Seismic Hazard Maps (NSHM), the workshop outcomes presented in this report can benefit anyone who develops products based on technical information.
The National Seismic Hazard Maps
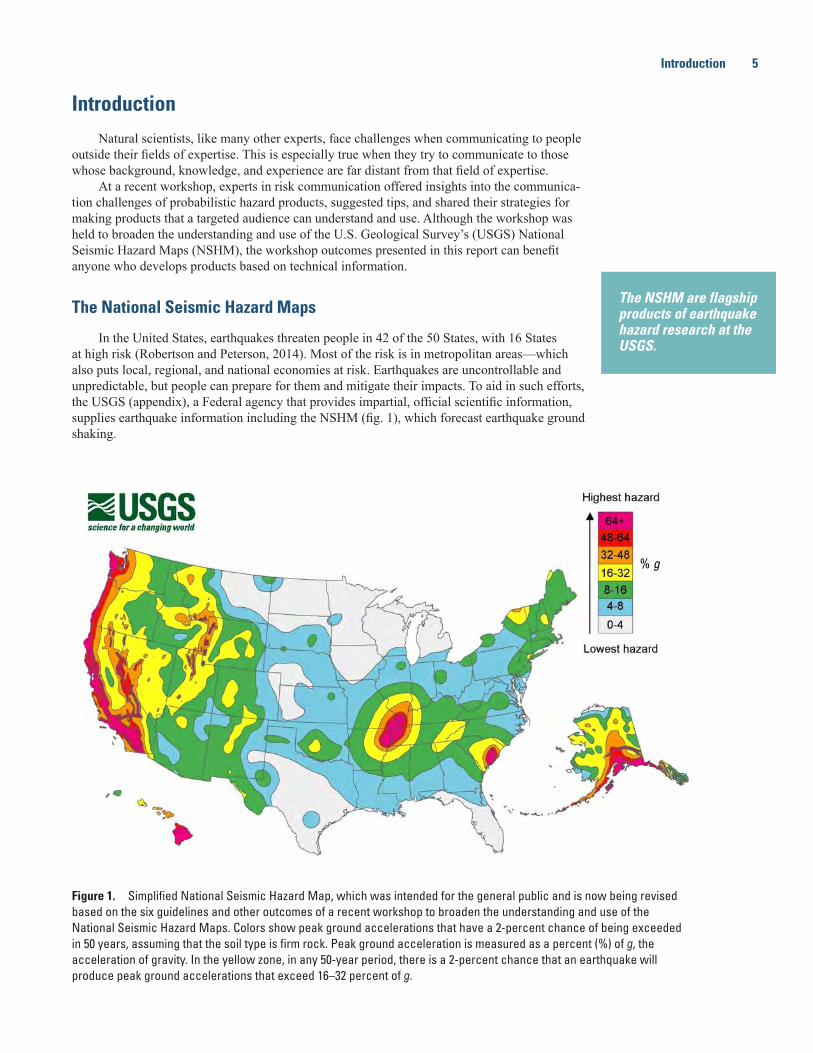
In the United States, earthquakes threaten people in 42 of the 50 States, with 16 States at high risk (Robertson and Peterson, 2014). Most of the risk is in metropolitan areas—which also puts local, regional, and national economies at risk. Earthquakes are uncontrollable and unpredictable, but people can prepare for them and mitigate their impacts. To aid in such efforts, the USGS (appendix), a Federal agency that provides impartial, official scientific information, supplies earthquake information including the NSHM (fig. 1), which forecast earthquake ground shaking.
% g
Figure 1. Simplified National Seismic Hazard Map, which was intended for the general public and is now being revised based on the six guidelines and other outcomes of a recent workshop to broaden the understanding and use of the National Seismic Hazard Maps. Colors show peak ground accelerations that have a 2-percent chance of being exceeded in 50 years, assuming that the soil type is firm rock. Peak ground acceleration is measured as a percent (%) of g, the acceleration of gravity. In the yellow zone, in any 50-year period, there is a 2-percent chance that an earthquake will produce peak ground accelerations that exceed 16–32 percent of g.
The NSHM are flagship products of earthquake hazard research at the USGS.
6 Get Your Science Used—Six Guidelines to Improve Your Products
The NSHM are an important tool for earthquake loss reduction and thus a flagship applica-tion of earthquake hazard research at the USGS. The NSHM are used in the seismic provisions of building codes, which save lives by minimizing the risk of structural collapse during earth-quake ground shaking. The building codes prescribe construction methods that minimize the risk of structural collapse of buildings and important specialized structures, including nuclear power plants, dams, bridges, schools, hospitals, pipelines, and tall buildings. In addition, most earthquake-insurance rate structures use risk models that reference the NSHM. Therefore, the NSHM annually influence hundreds of billions of dollars of construction and business decisions.
Currently, the NSHM and their Web pages convey information in ways that are most mean-ingful to the primary audience—engineers who design or use building codes. Risk modelers and earthquake scientists also have the expertise to understand the current maps. However, maps that are best suited to engineers are difficult to understand by many who are not engineers. This restricts usage and increases misinterpretation and misuse of the NSHM by other audiences. Because the NSHM provide a broad view of earthquake hazard across the United States, they have other potentially valuable uses for planning, risk reduction, and education. The NSHM—and the data that go into them—contain information that could benefit a broad array of groups, including State and city leaders, the private sector, and individuals.
A Workshop for the NSHM to Reach New Audiences—Motivation for Creating Science-Communication Guidelines
To broaden the use and understanding of the NSHM on behalf of the NSHM team, the USGS Science Application for Risk Reduction Project (SAFRR, appendix) convened a SAFRR “Cadre of Relevant Experts” (SAFRR CORE, see appendix) workshop in June 2014, uniting experts from multiple disciplines to exchange knowledge and tackle a common problem.
This workshop, entitled “New Audiences, New Products for the National Seismic Hazard Maps,” sought to improve two kinds of accessibility to the NSHM:
• Physical accessibility—are the maps easy to obtain?
• Intellectual accessibility—are they easy to understand and use?During the 2 days of the workshop, participants shared understanding from natural,
behavioral, and social sciences, as well as from engineering, public health, marketing, com-munication, and social-impact design. Because participants represented decades of research and practice, they shared their understanding as summations, overviews, and general findings, rather than details of individual research studies.
The Span of Workshop ExpertiseThe expertise of the 30 workshop attendees spanned 18 disciplines—anthropology, civil
engineering, decision science, geography, geology, geophysics, hydrology, information design, journalism, marketing, medicine, political science, psychology, public health, seismology, sociolinguistics, sociology, and structural engineering. About half of the attendees came from disciplines outside of the Earth sciences. This breadth of knowledge was stimulating, eye-opening, and revealed communication complications—each discipline had its own jargon; many relied on acronyms and others on abbreviations. Perhaps most treacherous were the times when attendees used the same words but intended different meanings.
For example, workshop discussion revealed different uses of the word probability. To some, a probabilistic map like the NSHM implies that the map includes probable (more likely) events and excludes possible (less likely) events. To others—including earthquake scientists—probability indicates a method of analysis that accounts for uncertainty and which includes possible, as well as probable, events.
The 30 attendees spanned 18 disci-plines, and about half came from disciplines outside of the Earth sciences.
The NSHM could benefit a broad array of groups, including State and city leaders, the private sector, and individuals.
At times, attendees used the same words but intended different meanings.
A Strategy to Improve Understanding—Six Guidelines 7
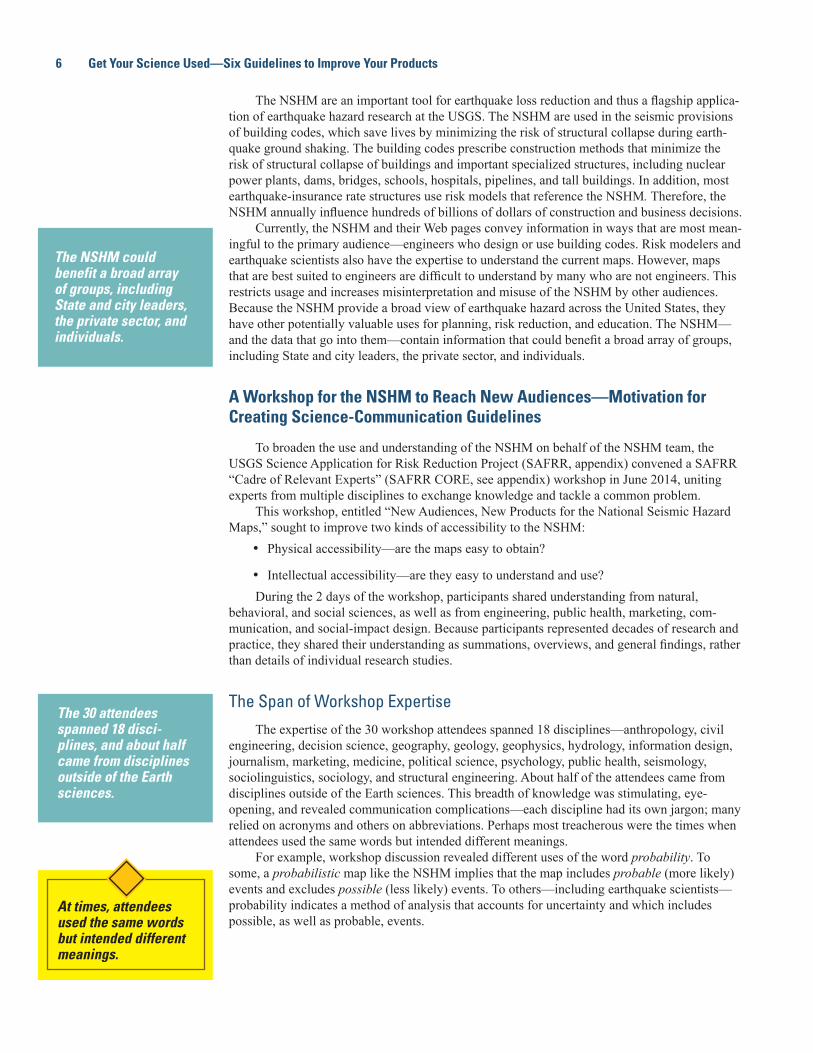
Workshop OutcomesThe workshop took advantage of the group’s creativity and expertise to brainstorm poten-
tial products, audiences, partnerships, and resources for the NSHM (fig. 2). Throughout work-shop activities, participants acknowledged that the workshop outcomes—the product ideas and prioritized choices of audiences—could only be preliminary, because few members of potential audiences were in attendance. The workshop outcomes provide starting points for conversations with new audiences.
This report summarizes workshop discussions and includes a road map for future efforts. More importantly, it provides a general strategy for those who seek to improve the understand-ing and use of science-products—maps, decision-support tools, Web pages, phone apps, techni-cal reports, books and brochures, videos, and more for technical and nontechnical audiences. Although the incoming goal of the workshop was new products for the NSHM, the result is a set of guidelines that can help to improve any product that is based on technical information.
Figure 2. Photograph of civil engineer Keith Porter pitching a product idea for homeowners during a National Seismic Hazard Map workshop brainstorming session. Also shown in this photo are Earth scientists, designers, sociologists, psychologists, marketers, journalists, and decision scientists. (Photograph courtesy of Elizabeth Pastor.)
A Strategy to Improve Understanding—Six GuidelinesOn the basis of research and practice into how people think, use tools, make decisions, and
understand scientific/technical information, the social and behavioral scientists, marketers, and social-impact designers at the NSHM workshop provided remarkably consistent guidelines to develop successful science products, such as text, maps, and other products. In this report the guidelines are numbered for clarity, but they can be applied repeatedly, piecemeal, or out of order to fit each project and your resources. If you want someone to understand and use your science:
Attendees provided remarkably consistent guidelines to develop successful science products.
8 Get Your Science Used—Six Guidelines to Improve Your Products
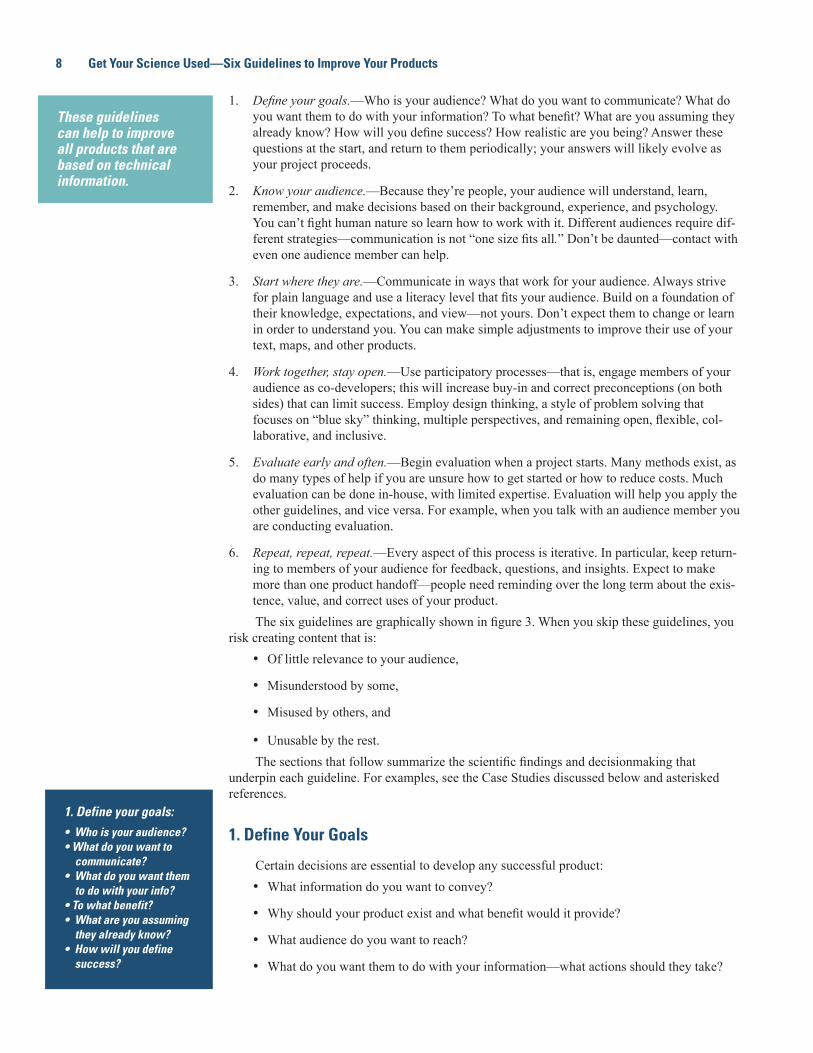
1. Define your goals.—Who is your audience? What do you want to communicate? What do you want them to do with your information? To what benefit? What are you assuming they already know? How will you define success? How realistic are you being? Answer these questions at the start, and return to them periodically; your answers will likely evolve as your project proceeds.
2. Know your audience.—Because they’re people, your audience will understand, learn, remember, and make decisions based on their background, experience, and psychology. You can’t fight human nature so learn how to work with it. Different audiences require dif-ferent strategies—communication is not “one size fits all.” Don’t be daunted—contact with even one audience member can help.
3. Start where they are.—Communicate in ways that work for your audience. Always strive for plain language and use a literacy level that fits your audience. Build on a foundation of their knowledge, expectations, and view—not yours. Don’t expect them to change or learn in order to understand you. You can make simple adjustments to improve their use of your text, maps, and other products.
4. Work together, stay open.—Use participatory processes—that is, engage members of your audience as co-developers; this will increase buy-in and correct preconceptions (on both sides) that can limit success. Employ design thinking, a style of problem solving that focuses on “blue sky” thinking, multiple perspectives, and remaining open, flexible, col-laborative, and inclusive.
5. Evaluate early and often.—Begin evaluation when a project starts. Many methods exist, as do many types of help if you are unsure how to get started or how to reduce costs. Much evaluation can be done in-house, with limited expertise. Evaluation will help you apply the other guidelines, and vice versa. For example, when you talk with an audience member you are conducting evaluation.
6. Repeat, repeat, repeat.—Every aspect of this process is iterative. In particular, keep return-ing to members of your audience for feedback, questions, and insights. Expect to make more than one product handoff—people need reminding over the long term about the exis-tence, value, and correct uses of your product.The six guidelines are graphically shown in figure 3. When you skip these guidelines, you
risk creating content that is:• Of little relevance to your audience,
• Misunderstood by some,
• Misused by others, and
• Unusable by the rest.The sections that follow summarize the scientific findings and decisionmaking that
underpin each guideline. For examples, see the Case Studies discussed below and asterisked references.
1. Define Your Goals
Certain decisions are essential to develop any successful product:• What information do you want to convey?
• Why should your product exist and what benefit would it provide?
• What audience do you want to reach?
• What do you want them to do with your information—what actions should they take?
1. Define your goals:• Who is your audience?• What do you want to
communicate?• What do you want them
to do with your info?• To what benefit?• What are you assuming
they already know?• How will you define
success?
These guidelines can help to improve all products that are based on technical information.
A Strategy to Improve Understanding—Six Guidelines 9
Start where they are
Know
your
audienc
e
Define your goalsRepeat, repeat, repeat
Evaluate ea
rly an
d ofte
n Work together, stay open
1
2
3
45
6
Define your goals• Who is your audience?• What do you want to communicate?• What do you want them to do with your info?• To what benefit?• What are you assuming they already know?• How will you define success?
Know your audience• Use this as your key to success.• Work with, not against, human nature.• Connect with at least one audience member.
Start where they are• Always strive for plain language.• Tailor your efforts to fit your audience.• Build on their foundation—not yours.
Repeat, repeat, repeat• Think “recurring,” not “one time.”• Keep returning to your audience. • Keep reminding about the product and its uses.
Evaluate early and often• Begin evaluation when a project starts.• Become familiar with the many types of help.• Use evaluation to apply the other guidelines.
Work together, stay open• Engage your audience as co-developers.• Explore open, "blue sky" thinking.• Stay flexible.
1 2 3
4 5 6
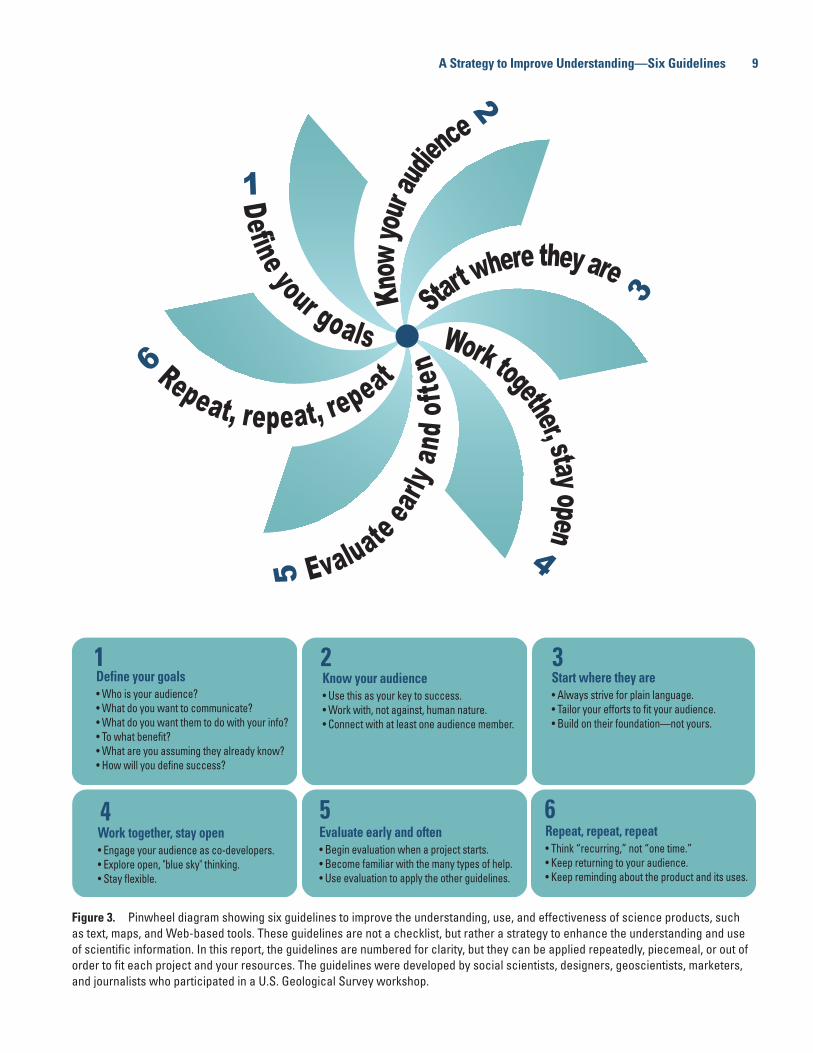
Figure 3. Pinwheel diagram showing six guidelines to improve the understanding, use, and effectiveness of science products, such as text, maps, and Web-based tools. These guidelines are not a checklist, but rather a strategy to enhance the understanding and use of scientific information. In this report, the guidelines are numbered for clarity, but they can be applied repeatedly, piecemeal, or out of order to fit each project and your resources. The guidelines were developed by social scientists, designers, geoscientists, marketers, and journalists who participated in a U.S. Geological Survey workshop.
10 Get Your Science Used—Six Guidelines to Improve Your Products
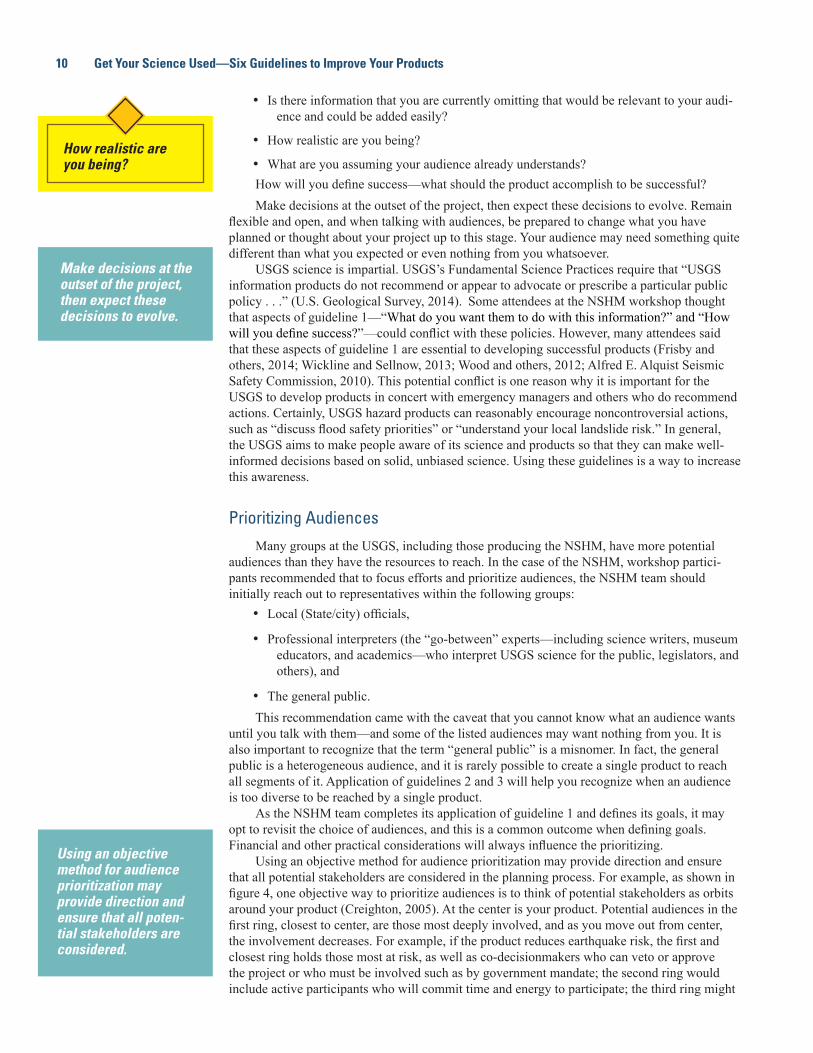
• Is there information that you are currently omitting that would be relevant to your audi-ence and could be added easily?
• How realistic are you being?
• What are you assuming your audience already understands?How will you define success—what should the product accomplish to be successful?Make decisions at the outset of the project, then expect these decisions to evolve. Remain
flexible and open, and when talking with audiences, be prepared to change what you have planned or thought about your project up to this stage. Your audience may need something quite different than what you expected or even nothing from you whatsoever.
USGS science is impartial. USGS’s Fundamental Science Practices require that “USGS information products do not recommend or appear to advocate or prescribe a particular public policy . . .” (U.S. Geological Survey, 2014). Some attendees at the NSHM workshop thought that aspects of guideline 1—“What do you want them to do with this information?” and “How will you define success?”—could conflict with these policies. However, many attendees said that these aspects of guideline 1 are essential to developing successful products (Frisby and others, 2014; Wickline and Sellnow, 2013; Wood and others, 2012; Alfred E. Alquist Seismic Safety Commission, 2010). This potential conflict is one reason why it is important for the USGS to develop products in concert with emergency managers and others who do recommend actions. Certainly, USGS hazard products can reasonably encourage noncontroversial actions, such as “discuss flood safety priorities” or “understand your local landslide risk.” In general, the USGS aims to make people aware of its science and products so that they can make well-informed decisions based on solid, unbiased science. Using these guidelines is a way to increase this awareness.
Prioritizing AudiencesMany groups at the USGS, including those producing the NSHM, have more potential
audiences than they have the resources to reach. In the case of the NSHM, workshop partici-pants recommended that to focus efforts and prioritize audiences, the NSHM team should initially reach out to representatives within the following groups:
• Local (State/city) officials,
• Professional interpreters (the “go-between” experts—including science writers, museum educators, and academics—who interpret USGS science for the public, legislators, and others), and
• The general public.This recommendation came with the caveat that you cannot know what an audience wants
until you talk with them—and some of the listed audiences may want nothing from you. It is also important to recognize that the term “general public” is a misnomer. In fact, the general public is a heterogeneous audience, and it is rarely possible to create a single product to reach all segments of it. Application of guidelines 2 and 3 will help you recognize when an audience is too diverse to be reached by a single product.
As the NSHM team completes its application of guideline 1 and defines its goals, it may opt to revisit the choice of audiences, and this is a common outcome when defining goals. Financial and other practical considerations will always influence the prioritizing.
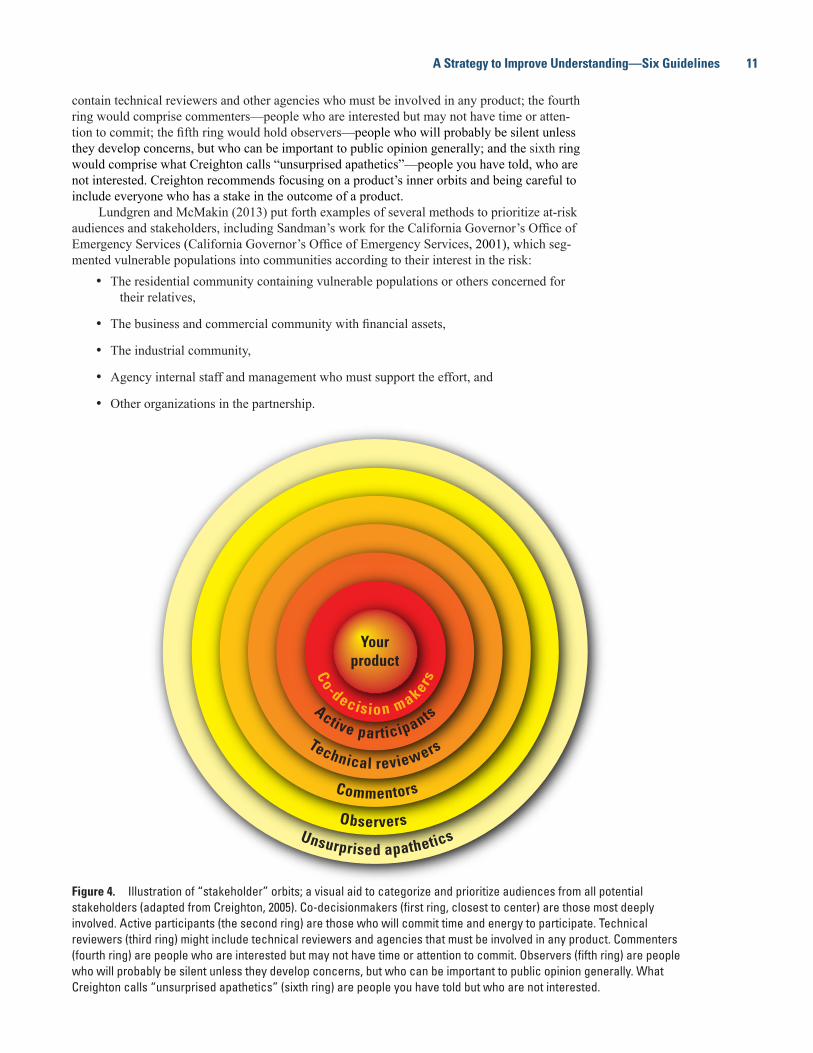
Using an objective method for audience prioritization may provide direction and ensure that all potential stakeholders are considered in the planning process. For example, as shown in figure 4, one objective way to prioritize audiences is to think of potential stakeholders as orbits around your product (Creighton, 2005). At the center is your product. Potential audiences in the first ring, closest to center, are those most deeply involved, and as you move out from center, the involvement decreases. For example, if the product reduces earthquake risk, the first and closest ring holds those most at risk, as well as co-decisionmakers who can veto or approve the project or who must be involved such as by government mandate; the second ring would include active participants who will commit time and energy to participate; the third ring might
Make decisions at the outset of the project, then expect these decisions to evolve.
How realistic are you being?
Using an objective method for audience prioritization may provide direction and ensure that all poten-tial stakeholders are considered.
A Strategy to Improve Understanding—Six Guidelines 11
contain technical reviewers and other agencies who must be involved in any product; the fourth ring would comprise commenters—people who are interested but may not have time or atten-tion to commit; the fifth ring would hold observers—people who will probably be silent unless they develop concerns, but who can be important to public opinion generally; and the sixth ring would comprise what Creighton calls “unsurprised apathetics”—people you have told, who are not interested. Creighton recommends focusing on a product’s inner orbits and being careful to include everyone who has a stake in the outcome of a product.
Lundgren and McMakin (2013) put forth examples of several methods to prioritize at-risk audiences and stakeholders, including Sandman’s work for the California Governor’s Office of Emergency Services (California Governor’s Office of Emergency Services, 2001), which seg-mented vulnerable populations into communities according to their interest in the risk:
• The residential community containing vulnerable populations or others concerned for their relatives,
• The business and commercial community with financial assets,
• The industrial community,
• Agency internal staff and management who must support the effort, and
• Other organizations in the partnership.
Co-decision makers
Active participants
Technical reviewers
Commentors
ObserversUnsurprised apathetics
Yourproduct
Co-Decision Makers
Active Participants
Technical Reviewers
Commentors
ObserversUnsurprised Apathetics
YourProduct
Figure 4. Illustration of “stakeholder” orbits; a visual aid to categorize and prioritize audiences from all potential stakeholders (adapted from Creighton, 2005). Co-decisionmakers (first ring, closest to center) are those most deeply involved. Active participants (the second ring) are those who will commit time and energy to participate. Technical reviewers (third ring) might include technical reviewers and agencies that must be involved in any product. Commenters (fourth ring) are people who are interested but may not have time or attention to commit. Observers (fifth ring) are people who will probably be silent unless they develop concerns, but who can be important to public opinion generally. What Creighton calls “unsurprised apathetics” (sixth ring) are people you have told but who are not interested.
12 Get Your Science Used—Six Guidelines to Improve Your Products
In some situations, a single product might serve several of these communities. Again, application of guidelines 2 and 3 will enable you to determine when these communities need different products, formats, or channels of delivery and thus constitute separate audiences that may need to be prioritized.
2. Know Your Audience
Understanding your audience can be just as important as the content of your product (Mai-bach and others, 2009). Providing more and better information does not equate with increased use of the information or with better decisionmaking, and the expert view does not always align with the public’s perception. That’s because people, including members of an audience:
• Are selective when attending to information;
• Evaluate options using both cognitive and what the psychologists call affective (emo-tional) processes;
• Are influenced by the context within which a decision is made (individually, in a group, at work, at home, and so forth); and
• Are influenced by cultural values, beliefs, goals, and prior experience.
To understand your audience, consider:• Does your audience subdivide into segments with different needs?
• What are their concerns, worries, goals, needs? Are there some of these that may not directly relate to your hazard/issue, but which can be linked to it indirectly?
• Which communication channels are most likely to reach your audience?
• What kinds of products or tools are they most likely to use?
• What is their experience with your hazard/issue?
• What are their expectations and beliefs about your hazard/issue?
• What are their expectations about your science products?
• What are their fundamental and science literacy levels?
• How is their role important to public safety?
• Will they serve as advocates, helping to convey messages?
• Are they an existing, cohesive social group?Sometimes, an interim or go-between audience is important. For example, partners in
disaster mitigation and response may need earthquake hazard maps when they give prepared-ness information to people in a certain community. If you want to tailor a hazard map for that community, a good approach is to ask your disaster mitigation and response partners what kinds of maps they need to do their job effectively.
An excellent way to know an audience is to establish a long-term conversation with members of that audience, which facilitates trust building, understanding of needs, and ongoing evaluation. However, even brief, one-time contact with members of your audience can help to improve the products you make for that audience. When it comes to knowing your audience—or applying the other guidelines—make the level of effort that’s feasible for you.
The sections that follow summarize aspects of human nature that can impede understand-ing of probabilistic hazard products such as the NSHM. Many of these aspects of human nature also pertain to understanding other types of technical information. The sections also indicate ways, based on social science, to work around the impediments.
2. Know your audience:• Use this as your key to
success.• Work with, not against,
human nature.• Connect with at least one
audience member.
Providing more and better information does not equate with increased use of the information or with better decisionmaking.
A Strategy to Improve Understanding—Six Guidelines 13
These summaries won’t substitute for getting to know members of your target audience. Rather, they flag issues you may need to explore with your audience members.
Risk Perception Trumps RealityRisk perception is subjective, personal, and important, because subjective perceptions of
risk influence what people pay attention to in complicated situations and define how people approach and solve problems. In fact, perceptions often matter more to people than scientific facts. The best way to align perception with reality is to understand your audience and their concerns and their goals (Sellnow and others, 2014; Mileti and Peek, 2000).
Risk perceptions are part of a person’s mental model—a person’s individual understanding of the surrounding world and how something works. To make a successful product, or encour-age risk-wise behavior, you have to understand a person’s mental model, because it serves as the framework into which that person will fit new information. For example, many people who experienced the 1994 Northridge California earthquake (magnitude 6.7) have as part of their mental models that any damaging earthquake will be a lot like Northridge.
A mental model (Morgan and others, 2001; Kempton, 1991):• Is an individual belief system formed through culture, experience, and personal percep-
tions;
• Is based on often incomplete facts, past experiences, and intuitive perceptions;
• Includes relevant knowledge and beliefs that help to interpret new information in order to reach conclusions; and
• Often serves as a filter during searches for and uptake of information. For example, it is common for people to notice only the information that supports their beliefs; this is called confirmation bias.
Emotion is a Wellspring for ActionRisks can be perceived as feelings, and this is not necessarily a conscious process. Sub-
jective feelings of being at risk influence judgments of the riskiness of an event or situation in ways that go beyond objective consequences. Affect—“emotion that gives a positive or nega-tive quality to the stimulus”—controls action and can do so even when the emotional trigger is subtle (Lowenstein and others, 2001). In the face of risk and uncertainty, a person’s perception of risk and the resulting decisions and actions are driven by affect, that is, by how a person feels about the situation. Thus, effective communication of scientific/technical information combines affective information with analytic information.
That emotion plays an incredibly important role in decisionmaking and action has been recognized for centuries and was discussed by Plato. According to one recent model of this dynamic (Kahneman, 2011), humans reason with dual processes:
• System 1 reasoning is quick, emotional, heuristic; and
• System 2 reasoning is slow, deliberative, and analytic.With many kinds of decisionmaking, emotion drives action because system 1 reason-
ing operates faster and is a better motivator for action. System 2 reasoning can and does drive action, but because it tends to be slower and more deliberate, judgments and decisions are often made through system 1 before the more rational system 2 has had the chance to kick in. Thus, it is often true that to inspire action an appeal to system 1 is necessary, although in cases where people are prepared to look at the situation analytically and deliberately—and in the absence of a scary/affective threat—system 2 reasoning can work quite well. People usually run prob-abilities through system 2 reasoning. However, you can also engage system 1 reasoning when communicating probabilities, and this can boost understanding:
To make a successful product, or encourage risk-wise behavior, you have to understand a person’s mental model.
Emotion plays an incredibly important role in decisionmaking and action.
14 Get Your Science Used—Six Guidelines to Improve Your Products
• Use proportions not percentages (Visschers and others, 2009; Garcia-Retamero and Galesic, 2009). Simply saying 1 in 10 chance instead of 10-percent or 10% chance improves the understanding of risk, because 1 in 10 helps people think about it more personally. They relate to and become the “1” in the ratio. However, be aware that with fractions, people tend to ignore the denominator. For example, people intuitively feel that 4/25 is greater than 2/5.
• Include vivid, emotional context. However, the vivid should not seek to scare, because that can have negative consequences, as discussed below. How do you know whether your vivid is too vivid? Try it on members of your audience.
The Mantra is “Concrete, Local, and Current”One reason people have difficulty with probabilistic hazard is because the concepts are psy-
chologically distant; that is, they are uncertain, far away in space, and far away in time. Psycho-logical distance leads to abstract thinking, which does not inspire action. People are motivated by psychologically close threats, which leads to concrete thinking, which inspires action (Trope and Liberman, 2010). Disasters that may happen in the future can be made more concrete. With earthquakes, for example:
• Focus on the details of what the earthquake will be like—such as through hazard drills like the ShakeOut drills (http://www.shakeout.org); or
• Connect future outcomes with past experiences. Adding photos of real earthquakes, such as of shaking damage, can make future potential hazards more concrete.
The scale or extent of a map, graph, or other graphic can influence psychological distance (Trope and Liberman, 2010):
• To increase psychological closeness, zoom in;
• Use pie charts with caution. Pie charts make rare events seem even rarer;
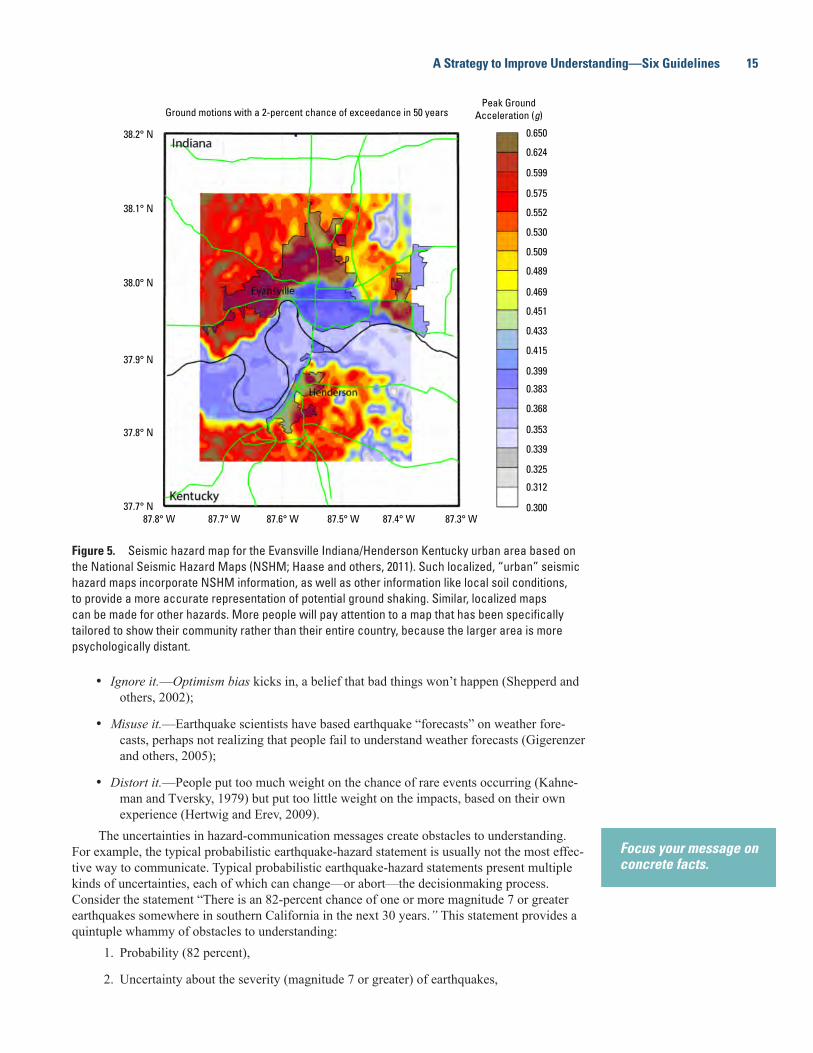
• Community-scale maps are psychologically closer than national-scale maps. For example, urban-scale seismic hazard maps (fig. 5), which provide NSHM data and other information at a city scale, have a better chance of capturing attention than a map of the Nation.
Long time frames reduce people’s willingness to take action, because people discount future outcomes—they value them less than outcomes now. This makes it hard to get people engaged about future risks. In some situations, a work-around is to get them to precommit to an action—for example, making a decision to begin paying for insurance 1 month from now will cause discounting to act on that insurance payment, as well as on the uncertain future damage, making the insurance feel less expensive. As another example, more people will get earthquake insurance if the “default” on an insurance form is to get it. In fact, across many different types of choices, people are more likely to stay in than opt out.
People give most weight to recent observations. Rare events have generally not occurred recently and thus their likelihood and severity are underweighted. However, if a statistically rare event occurs or has recently occurred, people will initially overreact to it. This helps to explain anecdotes from those engaged in public outreach about “teachable moments.”
Probability Alone Won’t Get the Message AcrossWhen given a probability, people tend to:• Misinterpret it.—Even when given additional information about how to use it correctly,
people don’t (Budescu and others, 2009);
People are motivated by psychologically close threats, which leads to concrete thinking, which inspires action.
Long time frames reduce people’s willingness to take action.
A Strategy to Improve Understanding—Six Guidelines 15
Ground motions with a 2-percent chance of exceedance in 50 yearsPeak Ground
Acceleration (g)
38.2° N
38.1° N
38.0° N
37.9° N
37.8° N
37.7° N87.8° W 87.7° W 87.6° W 87.5° W 87.4° W 87.3° W
0.650
0.624
0.599
0.575
0.552
0.530
0.509
0.489
0.469
0.451
0.433
0.415
0.399
0.383
0.368
0.353
0.339
0.325
0.312
0.300
Figure 5. Seismic hazard map for the Evansville Indiana/Henderson Kentucky urban area based on the National Seismic Hazard Maps (NSHM; Haase and others, 2011). Such localized, “urban” seismic hazard maps incorporate NSHM information, as well as other information like local soil conditions, to provide a more accurate representation of potential ground shaking. Similar, localized maps can be made for other hazards. More people will pay attention to a map that has been specifically tailored to show their community rather than their entire country, because the larger area is more psychologically distant.
• Ignore it.—Optimism bias kicks in, a belief that bad things won’t happen (Shepperd and others, 2002);
• Misuse it.—Earthquake scientists have based earthquake “forecasts” on weather fore-casts, perhaps not realizing that people fail to understand weather forecasts (Gigerenzer and others, 2005);
• Distort it.—People put too much weight on the chance of rare events occurring (Kahne-man and Tversky, 1979) but put too little weight on the impacts, based on their own experience (Hertwig and Erev, 2009).
The uncertainties in hazard-communication messages create obstacles to understanding. For example, the typical probabilistic earthquake-hazard statement is usually not the most effec-tive way to communicate. Typical probabilistic earthquake-hazard statements present multiple kinds of uncertainties, each of which can change—or abort—the decisionmaking process. Consider the statement “There is an 82-percent chance of one or more magnitude 7 or greater earthquakes somewhere in southern California in the next 30 years.” This statement provides a quintuple whammy of obstacles to understanding:
1. Probability (82 percent),
2. Uncertainty about the severity (magnitude 7 or greater) of earthquakes,
Focus your message on concrete facts.
16 Get Your Science Used—Six Guidelines to Improve Your Products
3. Uncertainty about the number of earthquakes (one or more),
4. Spatial uncertainty (somewhere in southern California), and
5. Temporal uncertainty (in the next 30 years).For statements involving so much (and so many kinds of) uncertainty, it may be more
effective to focus your message on concrete facts, such as what the effects are likely to be when an event does occur and the fact that it will happen in due course. When you do communicate probabilities, acknowledge that people may have their own intuitive estimates of that probability based on their own experience. Point out that the probabilities for the future are different than what one might estimate based on what has happened in an area over the past 10 or 20 years, the span of most people’s experience. Address any experience-description disparity directly, and explain why it exists. And, again, a proportion like 1 in 1,000 (called an absolute risk estimate in the field of public health) will be understood better than a percentage like 0.1 percent.
People often use the existence of uncertainty to justify inaction or business-as-usual poli-cies. Fortunately, they will forego these tendencies when you:
• Employ the precautionary principle, which can reframe a potentially paralyzing uncer-tainty into a justification for strong, protective action. This is the “better safe than sorry” concept—for example, the flood will happen someday, so be ready for it.
• Explain the value of developing contingency plans and adopting adaptive-management strategies, just in case that rare event does occur.
Vivid Content Has Value and DangersInclude personally relevant context and vivid examples. However, beware the overuse of
emotional appeals and don’t focus too strongly on the enormity of the consequences. Overload-ing people with frightening or hopeless-sounding information can lead to emotional numbing and paralysis—People may think, “this is too big and there is nothing I can do, so I am going to disengage from the topic.” In addition, people cannot maintain a constant, heightened state of alert.
The key is to find a good balance between grabbing attention and “fear mongering.” Combine vivid information about potential consequences with advice on how people could take control of some aspect of their situation or reduce their risk. Feelings of instrumentality—feel-ing that there are actions to take that would influence a situation—associate with higher belief in the risk and greater likelihood of action (Spence and others, 2011). As always, the way to be sure you have the right level of vivid content is to try it out on members of your target audience.
Worry, Dread, and A Bias Toward OptimismWhat people worry about, and how much, influences how well they attend to risk (Slovic,
2000, 2010; Sjöberg and others, 2004): • Different people worry about different things and may perceive the same risk as more
or less threatening and manageable and therefore worry about it to a different extent (Slovic and others, 2004).
• Worry erodes over time, so plan to get people’s attention repeatedly (Brickman and Campbell, 1971).
• The sense of risk diminishes over time, which also requires reengaging people’s atten-tion (Brickman and Campbell, 1971).
• People have an optimism bias—they think the bad thing won’t happen to them (Wein-stein, 1980).
People often use the existence of uncer-tainty to justify inaction or business-as-usual policies.
Feeling that there are actions to take that would influence a situation associate with higher belief in the risk.
A Strategy to Improve Understanding—Six Guidelines 17
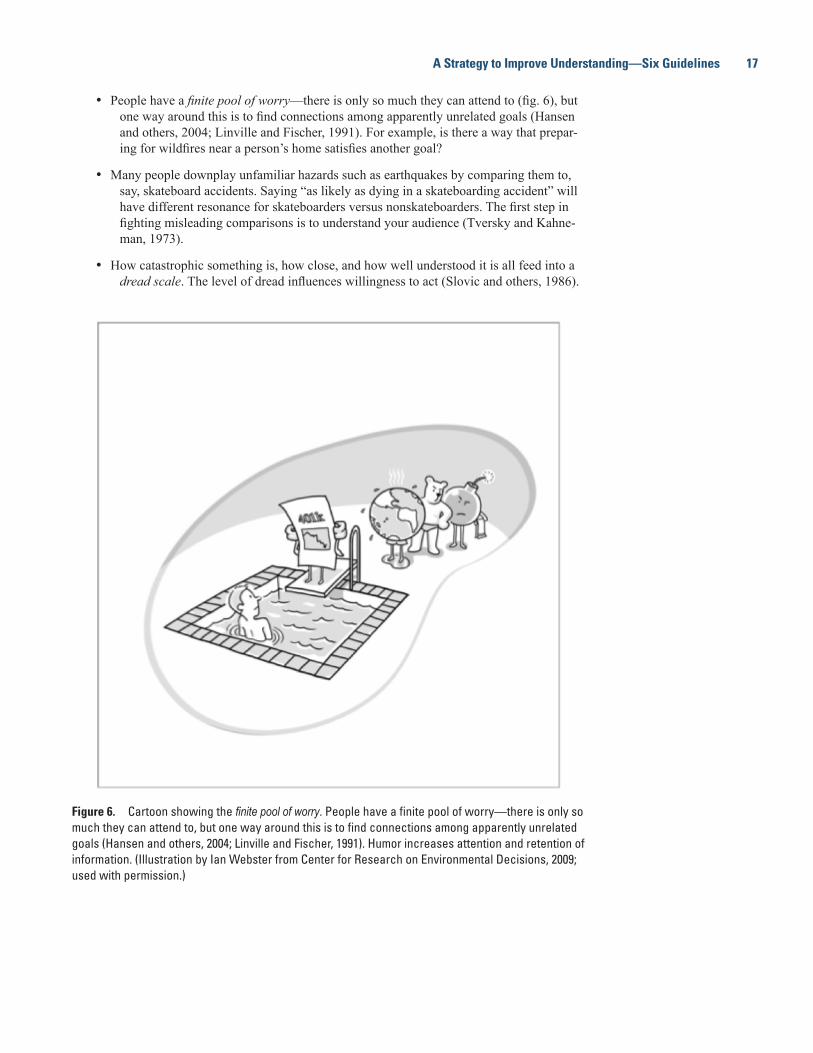
• People have a finite pool of worry—there is only so much they can attend to (fig. 6), but one way around this is to find connections among apparently unrelated goals (Hansen and others, 2004; Linville and Fischer, 1991). For example, is there a way that prepar-ing for wildfires near a person’s home satisfies another goal?
• Many people downplay unfamiliar hazards such as earthquakes by comparing them to, say, skateboard accidents. Saying “as likely as dying in a skateboarding accident” will have different resonance for skateboarders versus nonskateboarders. The first step in fighting misleading comparisons is to understand your audience (Tversky and Kahne-man, 1973).
• How catastrophic something is, how close, and how well understood it is all feed into a dread scale. The level of dread influences willingness to act (Slovic and others, 1986).
Figure 6. Cartoon showing the finite pool of worry. People have a finite pool of worry—there is only so much they can attend to, but one way around this is to find connections among apparently unrelated goals (Hansen and others, 2004; Linville and Fischer, 1991). Humor increases attention and retention of information. (Illustration by Ian Webster from Center for Research on Environmental Decisions, 2009; used with permission.)
18 Get Your Science Used—Six Guidelines to Improve Your Products
3. Start Where They Are
After you get to know members of your potential audience, you’ll find it easier to adjust communication tactics and products to build on what they already know and believe—which could be quite different from what you want or expect. To help them understand what you know, your products—both in content and in format—must “meet them where they are.” This is a catch phrase from public health education and leadership training that describes a situation where experts forgo top-down models of talking at people and don’t require people to change or learn before they can understand.
Communicate in Ways That Work for Your AudienceEvery audience has different, preferred methods of getting information (for example, see
the Case Study—Finding Out Where They Are). Thus, the same information will need to be packaged differently for different audiences. Business people might want training, tutorials, or inservice (learning through direct participation); engineers might prefer webinars or conferences that satisfy continuing education requirements; and some segments of the general public might gravitate to popular media, such as television, video, magazines, games, and social media. To find out what your audience prefers, engage with members of that audience.
There is diversity within every audience. For example, the “general public at the house-hold level” includes renters and homeowners, who often require distinct messaging conveyed through different media. Multinational corporations and small businesses are distinct subseg-ments in the “private sector” audience. Within each audience subsegment, what makes a mes-sage or a medium successful depends on education level, income level, cultural perspective, and more. For example, according to some NSHM workshop attendees, low-income members of the public may be more likely to reach the Internet using smart phones rather than computers. Where that holds true, a phone app that provides your information may be more suitable than pages of Web site text—and a mobile-friendly Web page would be essential.
The knowledge base about reaching different audiences varies. Most peer-reviewed research about reaching a targeted audience focuses on communicating with the general public at the individual and household levels. The NSHM workshop discussions touched on the fol-lowing aspects of communication with some common audiences:
• Individuals will not conduct household mitigation and preparation if all they hear about is hazard and risk. Instead, they respond to information about what actions to take (Wood and others, 2012);
• Businesses and organizations may make decisions differently than individuals, based on anecdotes (attendees saw this as an area in need of research);
• For individuals messaging must be repetitive, received over multiple “channels,” and heard from multiple sources, such as the USGS and its partners (Alfred E. Alquist Seismic Safety Commission, 2010);
• Visuals and a compelling story are key for news media and social media, as are con-cise and catchy statements that summarize “what’s new” about your science and “so what”—why should people care about this, how might it affect them?;
• When the USGS provides information to legislators, such as members of Congress and their staffers, less information is more. Legislators are often crisis- and news-driven and locally focused—the information must matter to the legislator’s State or constitu-ency;
• Unintended audiences. You will reach a trickle-down audience—a secondary audi-ence—which may be unknown at the outset but discovered in the evaluation process. Communication with local officials, for example, may trickle down to the public or to legislators.
3. Start where they are:• Always strive for plain
language.• Tailor your efforts to fit
your audience.• Build on their foundation—
not yours.
What makes a message or a medium successful depends on education level, income level, cultural perspective, and more.
Case Study—Finding Out Where They Are 19
Case Study—Finding Out Where They Are[This case study shows the six guidelines in action. Numbers in brackets indicate the applicable guideline.]
As Yogi Berra once noted, “You can observe a lot just by watching.” A compelling demonstration of why it helps to involve members of the targeted audience in the development process [4] for science products occurred at the recent National Seismic Hazard Maps (NSHM) workshop. Wendy Vaughon presented a video of usability testing [5], part of a project being conducted with Dr. Christina Zarcadoolas that includes a con-tract to develop NSHM Web content for segments of the general public [1].
Workshop participants saw a video of a usability-testing [5] session, where a man with emergency-management experience and a college education [2] was asked to imagine that he was a staffer for a Congressman who needed information about the level of earthquake hazard in his district in upstate New York. The testers asked the participant to get the information from the NSHM Web pages, with revealing results:
• When the participant tried the NSHM interactive mapping tool, his expectation was that it would function like Google Maps [2], and as a result, he could not figure out how to select his area of interest. Such a result is extremely common in usability tests. How someone actually uses and understands your product may be different than what you—or participants—expect.
• He gave up on his assignment after he read introductory material on the NSHM pages, where he did not understand the vocabulary, concepts, or names of page links [2]. However, there was a more basic problem. With evident frustra-tion, he explained, “I’m trying to find out about earthquakes, but this is showing me ground shaking, not earthquakes.”
• This usability test uncovered perceptions that the NSHM would need to address before this user could use its products [3]. Map tools should behave like Web applications such as Google Maps—interactive and intuitive—and the participant needs to know that earthquakes produce ground shaking.
A different kind of usability problem arose in another usability test [6], this time with a woman who actually is a congressional staffer [2]. Given the same imaginary assignment, this staffer’s first reaction was disbelief, because she said that she would never go to a Web site for information like this [2] but would instead phone a trusted expert, an academic who would interpret the science for her.
Take-Home Messages.—(1) Usability testing allowed the research team to identify user perceptions and preferences and recommend revisions to elements in the presenta-tion of the NSHM. (2) If the NSHM team wants to provide information to decisionmak-ers who don’t use Web pages, the team needs to be on their lists of trusted experts or make sure that those trusted experts understand and use the NSHM. Based on anecdotal experience of multiple workshop attendees, many decisionmakers rely on trusted experts to serve as “interpreters” of technical information.
“I’m trying to find out about earthquakes, but this is showing me ground shaking, not earthquakes.”
20 Get Your Science Used—Six Guidelines to Improve Your Products
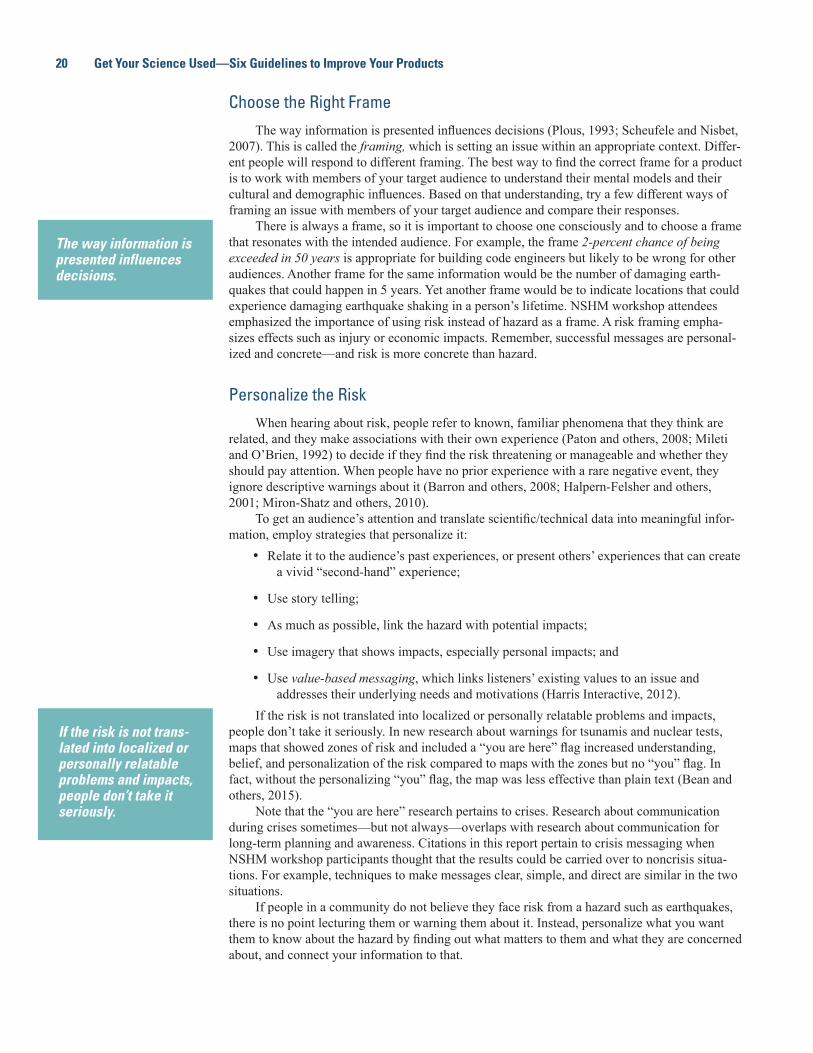
Choose the Right FrameThe way information is presented influences decisions (Plous, 1993; Scheufele and Nisbet,
2007). This is called the framing, which is setting an issue within an appropriate context. Differ-ent people will respond to different framing. The best way to find the correct frame for a product is to work with members of your target audience to understand their mental models and their cultural and demographic influences. Based on that understanding, try a few different ways of framing an issue with members of your target audience and compare their responses.
There is always a frame, so it is important to choose one consciously and to choose a frame that resonates with the intended audience. For example, the frame 2-percent chance of being exceeded in 50 years is appropriate for building code engineers but likely to be wrong for other audiences. Another frame for the same information would be the number of damaging earth-quakes that could happen in 5 years. Yet another frame would be to indicate locations that could experience damaging earthquake shaking in a person’s lifetime. NSHM workshop attendees emphasized the importance of using risk instead of hazard as a frame. A risk framing empha-sizes effects such as injury or economic impacts. Remember, successful messages are personal-ized and concrete—and risk is more concrete than hazard.
Personalize the RiskWhen hearing about risk, people refer to known, familiar phenomena that they think are
related, and they make associations with their own experience (Paton and others, 2008; Mileti and O’Brien, 1992) to decide if they find the risk threatening or manageable and whether they should pay attention. When people have no prior experience with a rare negative event, they ignore descriptive warnings about it (Barron and others, 2008; Halpern-Felsher and others, 2001; Miron-Shatz and others, 2010).
To get an audience’s attention and translate scientific/technical data into meaningful infor-mation, employ strategies that personalize it:
• Relate it to the audience’s past experiences, or present others’ experiences that can create a vivid “second-hand” experience;
• Use story telling;
• As much as possible, link the hazard with potential impacts;
• Use imagery that shows impacts, especially personal impacts; and
• Use value-based messaging, which links listeners’ existing values to an issue and addresses their underlying needs and motivations (Harris Interactive, 2012).
If the risk is not translated into localized or personally relatable problems and impacts, people don’t take it seriously. In new research about warnings for tsunamis and nuclear tests, maps that showed zones of risk and included a “you are here” flag increased understanding, belief, and personalization of the risk compared to maps with the zones but no “you” flag. In fact, without the personalizing “you” flag, the map was less effective than plain text (Bean and others, 2015).
Note that the “you are here” research pertains to crises. Research about communication during crises sometimes—but not always—overlaps with research about communication for long-term planning and awareness. Citations in this report pertain to crisis messaging when NSHM workshop participants thought that the results could be carried over to noncrisis situa-tions. For example, techniques to make messages clear, simple, and direct are similar in the two situations.
If people in a community do not believe they face risk from a hazard such as earthquakes, there is no point lecturing them or warning them about it. Instead, personalize what you want them to know about the hazard by finding out what matters to them and what they are concerned about, and connect your information to that.
The way information is presented influences decisions.
If the risk is not trans-lated into localized or personally relatable problems and impacts, people don’t take it seriously.
A Strategy to Improve Understanding—Six Guidelines 21
Use Clear and Plain LanguageWe all benefit from plain language and clear communication. There is a growing mismatch
between levels of public understanding and information produced, especially technical informa-tion. It is vital that crucial information such as hazard and disaster communications be designed with plain-language principles in mind. Recognition of this by experts across many fields led to the recent and far-reaching Plain Writing Act of 2010 (http://www.plainlanguage.gov/plLaw/index.cfm).
Over recent years, communication about science has changed, as have the mediums that communicate such information. Information and society have become more complex. In fact, complex information has become so common that it is sometimes hard for professionals to recognize the barriers that this information presents to the public or even to people from another academic discipline.
If you want to reach your audience, use language that they are comfortable and familiar with. This is not “dumbing down.” A common myth when talking about literacy and plain language is that experts must “dumb down” information so everyone can use it. That is not the case and, in fact, efforts to write dumbed-down sentences backfire and reduce communication (Centers for Disease Control and Prevention, 2014)!
Over the years, many highly regarded communicators have shared the philosophy of plain language, including investor Warren Buffett (Plainlanguage.gov, [n.d.]a):
Write with a specific person in mind. When writing Berkshire Hathaway’s annual report, I pretend that I’m talking to my sisters . . . Though highly intelligent, they are not experts in accounting or finance. They will understand plain English, but jargon may puzzle them. My goal is simply to give them the information I would wish them to supply me if our positions were reversed.
Match the Literacy Levels of Your AudienceLiteracy is more than just understanding of vocabulary or the ability to read something.
According to the National Council of Teachers of English, “Literacy has always been a col-lection of cultural and communicative practices shared among members of particular groups” (National Council of Teachers of English, 2013).
One type of literacy is health literacy, which, among other things, influences how people prepare for, cope, and respond to natural disasters (National Institutes of Health, 2015). The field of public health has decades of experience in communicating to different literacy levels, and several models of health literacy exist. A model of health literacy relevant for natural disas-ters was developed by Zarcadoolas, Pleasant, and Greer (2003, 2005, 2006).
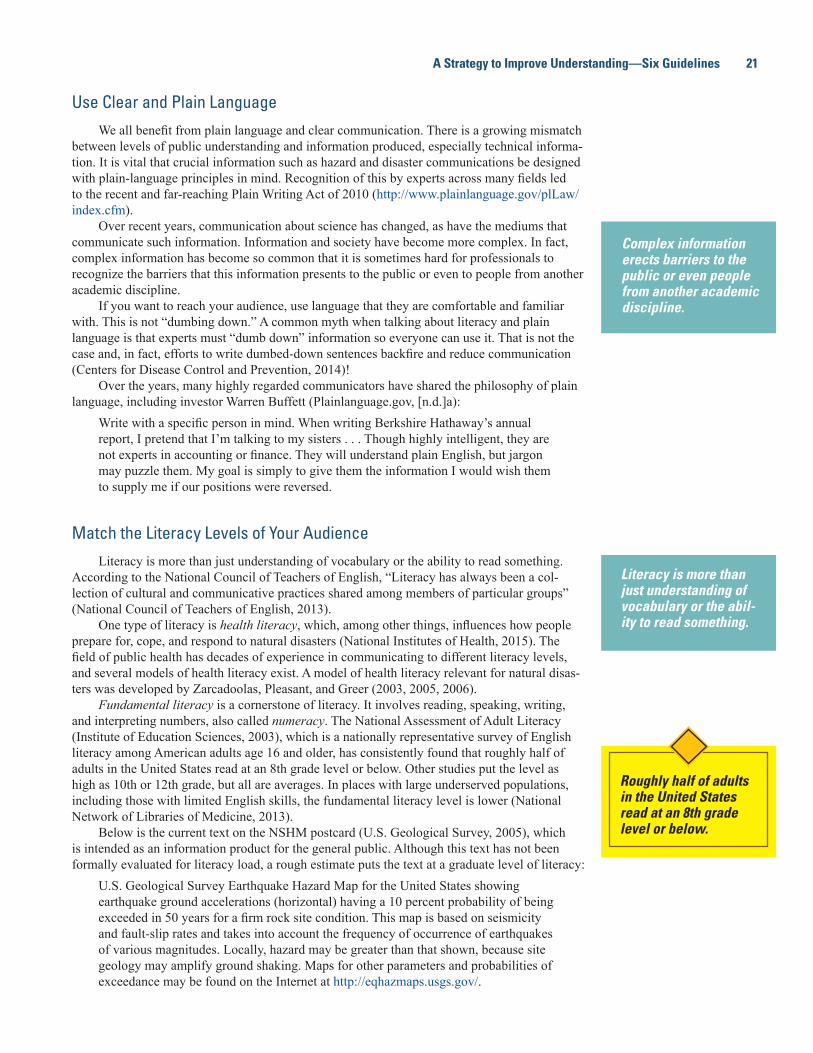
Fundamental literacy is a cornerstone of literacy. It involves reading, speaking, writing, and interpreting numbers, also called numeracy. The National Assessment of Adult Literacy (Institute of Education Sciences, 2003), which is a nationally representative survey of English literacy among American adults age 16 and older, has consistently found that roughly half of adults in the United States read at an 8th grade level or below. Other studies put the level as high as 10th or 12th grade, but all are averages. In places with large underserved populations, including those with limited English skills, the fundamental literacy level is lower (National Network of Libraries of Medicine, 2013).
Below is the current text on the NSHM postcard (U.S. Geological Survey, 2005), which is intended as an information product for the general public. Although this text has not been formally evaluated for literacy load, a rough estimate puts the text at a graduate level of literacy:
U.S. Geological Survey Earthquake Hazard Map for the United States showing earthquake ground accelerations (horizontal) having a 10 percent probability of being exceeded in 50 years for a firm rock site condition. This map is based on seismicity and fault-slip rates and takes into account the frequency of occurrence of earthquakes of various magnitudes. Locally, hazard may be greater than that shown, because site geology may amplify ground shaking. Maps for other parameters and probabilities of exceedance may be found on the Internet at http://eqhazmaps.usgs.gov/.
Complex information erects barriers to the public or even people from another academic discipline.
Literacy is more than just understanding of vocabulary or the abil-ity to read something.
Roughly half of adults in the United States read at an 8th grade level or below.
22 Get Your Science Used—Six Guidelines to Improve Your Products
The NSHM team wants this product to be understandable to the majority of Americans, so it is in the process of adjusting the content by applying the six guidelines to a revision.
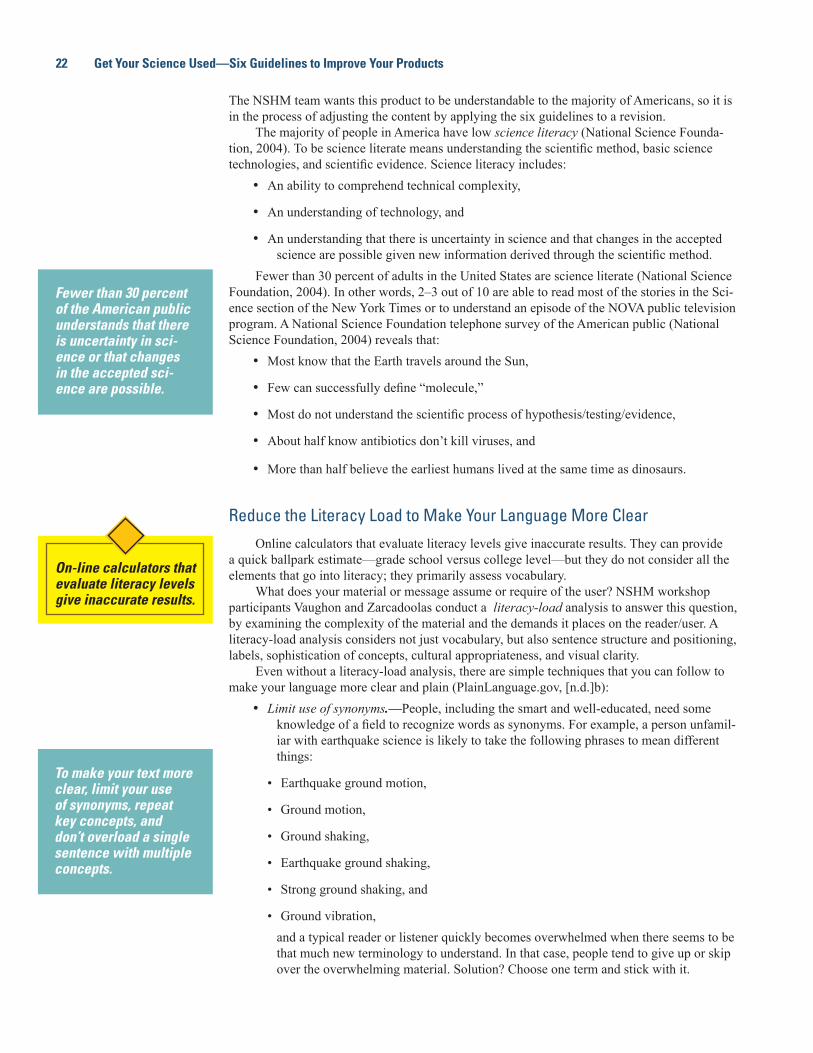
The majority of people in America have low science literacy (National Science Founda-tion, 2004). To be science literate means understanding the scientific method, basic science technologies, and scientific evidence. Science literacy includes:
• An ability to comprehend technical complexity,
• An understanding of technology, and
• An understanding that there is uncertainty in science and that changes in the accepted science are possible given new information derived through the scientific method.
Fewer than 30 percent of adults in the United States are science literate (National Science Foundation, 2004). In other words, 2–3 out of 10 are able to read most of the stories in the Sci-ence section of the New York Times or to understand an episode of the NOVA public television program. A National Science Foundation telephone survey of the American public (National Science Foundation, 2004) reveals that:
• Most know that the Earth travels around the Sun,
• Few can successfully define “molecule,”
• Most do not understand the scientific process of hypothesis/testing/evidence,
• About half know antibiotics don’t kill viruses, and
• More than half believe the earliest humans lived at the same time as dinosaurs.
Reduce the Literacy Load to Make Your Language More ClearOnline calculators that evaluate literacy levels give inaccurate results. They can provide
a quick ballpark estimate—grade school versus college level—but they do not consider all the elements that go into literacy; they primarily assess vocabulary.
What does your material or message assume or require of the user? NSHM workshop participants Vaughon and Zarcadoolas conduct a literacy-load analysis to answer this question, by examining the complexity of the material and the demands it places on the reader/user. A literacy-load analysis considers not just vocabulary, but also sentence structure and positioning, labels, sophistication of concepts, cultural appropriateness, and visual clarity.
Even without a literacy-load analysis, there are simple techniques that you can follow to make your language more clear and plain (PlainLanguage.gov, [n.d.]b):
• Limit use of synonyms.—People, including the smart and well-educated, need some knowledge of a field to recognize words as synonyms. For example, a person unfamil-iar with earthquake science is likely to take the following phrases to mean different things:
• Earthquake ground motion,
• Ground motion,
• Ground shaking,
• Earthquake ground shaking,
• Strong ground shaking, and
• Ground vibration,and a typical reader or listener quickly becomes overwhelmed when there seems to be that much new terminology to understand. In that case, people tend to give up or skip over the overwhelming material. Solution? Choose one term and stick with it.
Fewer than 30 percent of the American public understands that there is uncertainty in sci-ence or that changes in the accepted sci-ence are possible.
On-line calculators that evaluate literacy levels give inaccurate results.
To make your text more clear, limit your use of synonyms, repeat key concepts, and don’t overload a single sentence with multiple concepts.
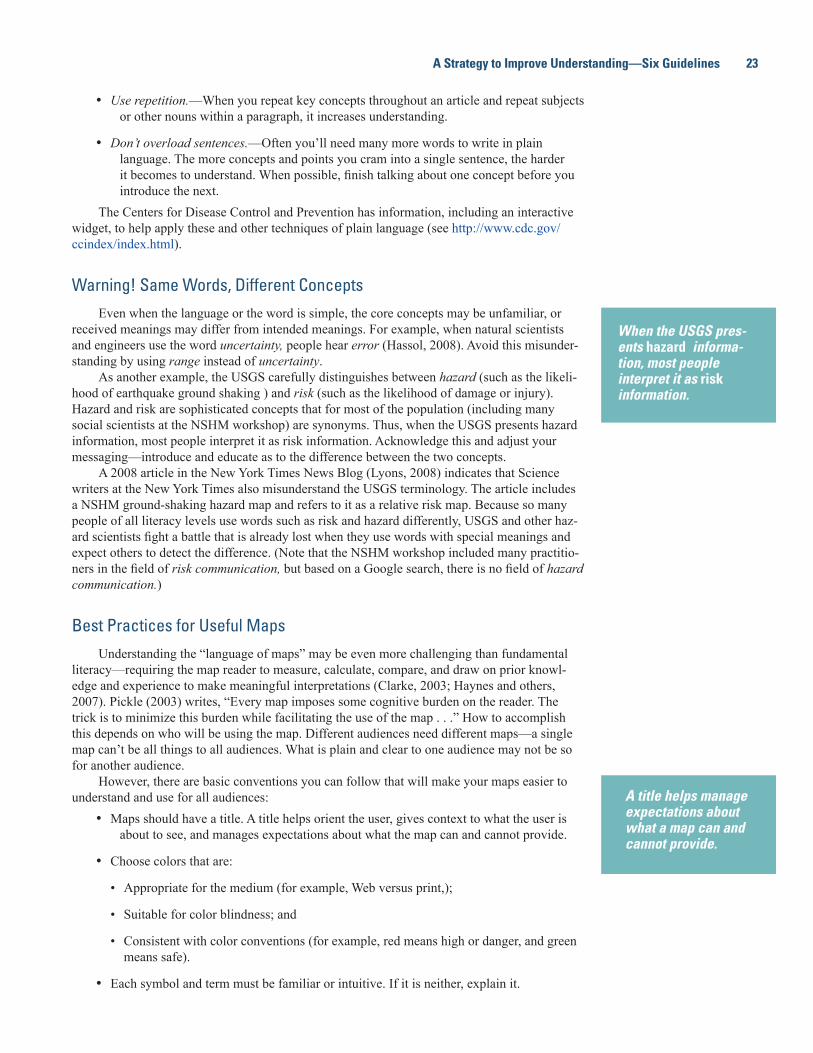
A Strategy to Improve Understanding—Six Guidelines 23
• Use repetition.—When you repeat key concepts throughout an article and repeat subjects or other nouns within a paragraph, it increases understanding.
• Don’t overload sentences.—Often you’ll need many more words to write in plain language. The more concepts and points you cram into a single sentence, the harder it becomes to understand. When possible, finish talking about one concept before you introduce the next.
The Centers for Disease Control and Prevention has information, including an interactive widget, to help apply these and other techniques of plain language (see http://www.cdc.gov/ccindex/index.html).
Warning! Same Words, Different ConceptsEven when the language or the word is simple, the core concepts may be unfamiliar, or
received meanings may differ from intended meanings. For example, when natural scientists and engineers use the word uncertainty, people hear error (Hassol, 2008). Avoid this misunder-standing by using range instead of uncertainty.
As another example, the USGS carefully distinguishes between hazard (such as the likeli-hood of earthquake ground shaking ) and risk (such as the likelihood of damage or injury). Hazard and risk are sophisticated concepts that for most of the population (including many social scientists at the NSHM workshop) are synonyms. Thus, when the USGS presents hazard information, most people interpret it as risk information. Acknowledge this and adjust your messaging—introduce and educate as to the difference between the two concepts.
A 2008 article in the New York Times News Blog (Lyons, 2008) indicates that Science writers at the New York Times also misunderstand the USGS terminology. The article includes a NSHM ground-shaking hazard map and refers to it as a relative risk map. Because so many people of all literacy levels use words such as risk and hazard differently, USGS and other haz-ard scientists fight a battle that is already lost when they use words with special meanings and expect others to detect the difference. (Note that the NSHM workshop included many practitio-ners in the field of risk communication, but based on a Google search, there is no field of hazard communication.)
Best Practices for Useful MapsUnderstanding the “language of maps” may be even more challenging than fundamental
literacy—requiring the map reader to measure, calculate, compare, and draw on prior knowl-edge and experience to make meaningful interpretations (Clarke, 2003; Haynes and others, 2007). Pickle (2003) writes, “Every map imposes some cognitive burden on the reader. The trick is to minimize this burden while facilitating the use of the map . . .” How to accomplish this depends on who will be using the map. Different audiences need different maps—a single map can’t be all things to all audiences. What is plain and clear to one audience may not be so for another audience.
However, there are basic conventions you can follow that will make your maps easier to understand and use for all audiences:
• Maps should have a title. A title helps orient the user, gives context to what the user is about to see, and manages expectations about what the map can and cannot provide.
• Choose colors that are:
• Appropriate for the medium (for example, Web versus print,);
• Suitable for color blindness; and
• Consistent with color conventions (for example, red means high or danger, and green means safe).
• Each symbol and term must be familiar or intuitive. If it is neither, explain it.
When the USGS pres-ents hazard informa-tion, most people interpret it as risk information.
A title helps manage expectations about what a map can and cannot provide.
24 Get Your Science Used—Six Guidelines to Improve Your Products
• The map explanation should not explain everything. Adding obvious information to legends can cause confusion. People know some conventions so well they do not need explanation—for example, adult audiences generally know that dots are cities and the words next to the dots are city names.
• Work with editors, geographic information systems (GIS) professionals, and graphics experts who understand good design.
• Provide a map scale and indicate to what scale the map is accurate.
• Instruct on proper map usage.
4. Work Together, Stay Open
Successful products don’t provide unsolicited information, they develop in a reciprocal process with members of the audience, through participatory processes and design thinking, discussed in the sections that follow.
Participatory Processes Can HelpIn a participatory process (Peterson and others, 2010; Creighton, 2005; Zarcadoolas and
others, 2001), members of the audience work with experts. An audience member can make a request that the expert will consider and respond to, while recognizing that people may think they need something that is not actually appropriate. Using participatory processes was a recur-ring theme of the NSHM workshop. Through participatory processes, members of the target audience become project participants, and their opinions and needs shape the evolution of the research, product, or evaluation. Participatory processes involve members of the audience repeatedly—probably in groups that fluctuate as tasks change—and include “market testing” of end products, much like the sneak previews of movie producers. Participatory processes help to get and keep attention, engage an audience, and tailor the products to the intended audience. As one NSHM workshop participant advised, “No products should be developed without soliciting input, informed and tested by audiences who are potential users. The sooner scientists learn to solicit users’ input, the better.”
Several NSHM workshop participants have led—and strongly recommend—participa-tory mapping projects, where they put members of the target audience on the teams to design, develop, or revise maps. The resulting maps have a strong user base among the participants.
An important tangential benefit of participatory processes is that they provide additional opportunities to get to know members of the audience. Also, sometimes people think they understand when they don’t, and during the participatory process, test questions and exercises can check their understanding. The primary objective is to engage people—as partners, not as experimental subjects.
Engaging audience members is always an iterative process that involves multiple meetings and likely requires soliciting input in multiple ways—some qualitative and some quantitative. Keep testing content with members of your audience. Follow every revision with more field-work to test new changes. Don’t assume you know how your audience will respond to your changes—you can’t assume you know your audience’s response at any stage of the process.
What is Design Thinking?The designer’s approach to product development stresses the need to understand members
of the target audience and thus has much overlap with the participatory approaches of social and behavioral scientists.
When Earth scientists hear “design” they typically think of graphic design and although many believe that a sketch or picture can often communicate more effectively than pages of
4. Work together, stay open:• Engage your audience as
co-developers.• Explore open, “blue sky”
thinking.• Stay flexible.
Participatory mapping projects result in maps that have a strong user base.
Don’t assume you know how your audience will respond.
A Strategy to Improve Understanding—Six Guidelines 25
text, few realize that design has a second component. The first component is that commonly recognized artistic/design skill. The second and arguably more important component is design as an approach to thinking and problem solving. Design thinking has as many subdisciplines as any scientific research field and in no way is this style of thinking limited to designers. Design thinking:
• Gathers information from multiple perspectives;
• Generates new ideas, builds on them, then iterates;
• Is human-centered, focused on people’s experiences, behaviors, perceptions, and needs;
• Is visual and tangible;
• Is collaborative;
• Produces products and services but only when they are warranted—your audience may not need the products you have in mind; and
• Starts with the decisions in guideline 1, “Define your goals.”
A Workshop That Combines The TwoA brainstorming workshop called a design-thinking workshop combines elements of
participatory processes and design thinking. Some meeting facilitators have experience in lead-ing design-thinking workshops, which bring together potential audience members with a mix of experts for knowledge sharing and research. It is beneficial when attendees do not have the same expertise; they bring a perspective that is closer to that of the audience than to that of other experts at the workshop.
Such a workshop begins with sharing of knowledge among participants and then moves into divergent thinking. This is big picture, “blue sky,” open thinking and generates ideas that start with I wish . . . I wonder . . . Imagine if . . . What if . . . Divergent thinking defers judgment and spotlights commonalities between ideas rather than differences. The intent is to generate lots of ideas, so as to have a range to evaluate and select from. A simple but effective tool to proceed during this phase is to respond to ideas with “yes, and . . . ,” which expands and builds on starting points, rather than “yes, but . . . ,” which shuts down and stops the flow of new ideas. Gradually, the activities move from divergent toward convergent thinking. In this phase, indi-vidual ideas are grouped according to commonalities to extract emergent themes.
Once clustered, the groupings of ideas are assigned to teams who explore them further. Trying to move beyond what is known, it is effective to ask the team assigned to one idea cluster to “cross-pollinate” or merge with another. After this, a design-thinking workshop often proceeds to developing prototypes of products, which then get brought to members of the target audience for testing, discussion, and additional development.
5. Evaluate Early and Often
Efforts to target an audience, learn their needs, understand their mental models, identify desired outcomes—and more—all fall within the purview of evaluation, which can focus on a process or a product. Many within the USGS call it assessment, but assessment actually refers to just one kind of evaluation.14
Design is an approach to thinking and problem solving.
Divergent thinking defers judgment and spotlights common-alities between ideas rather than differences.
5. Evaluate early and often:• Begin evaluation when a
project starts.• Become familiar with the
many types of help.• Use evaluation to apply
the other guidelines.14For Federal agencies, including the USGS, evaluations that involve the collection of information or opinions from 10 or more members of the public must conform to the Paperwork Reduction Act of 1980, as amended 1995 (Office of Management and Budget, [n.d.]). Many professional evaluators are familiar with the requirements of the Paperwork Reduction Act and can help you understand what’s required. Additionally, the USGS Office of Communications can provide USGS staff with guidance on this topic. More information can also be found on the following USGS Web page: http://www.usgs.gov/customer/research.html. For USGS staff, there is also an internal Web page: http://internal.usgs.gov/oei/oiim/oiim-home/information-management/paperwork-reduction-act/.
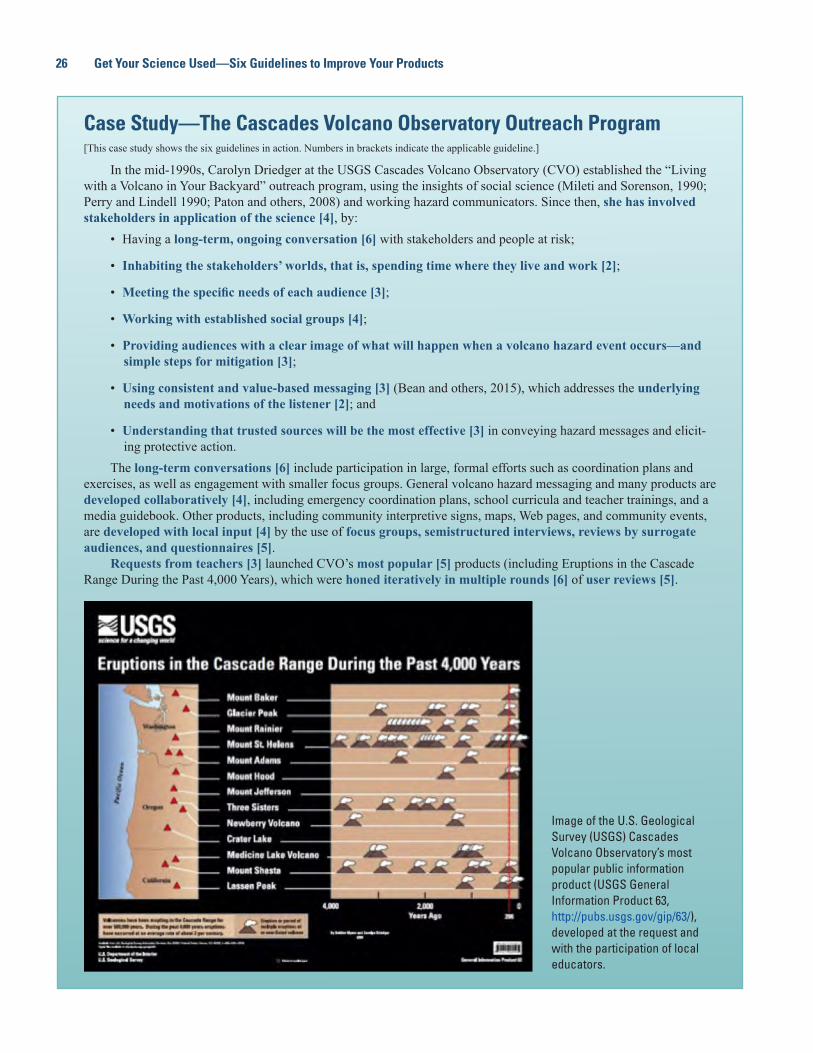
26 Get Your Science Used—Six Guidelines to Improve Your Products
Case Study—The Cascades Volcano Observatory Outreach Program[This case study shows the six guidelines in action. Numbers in brackets indicate the applicable guideline.]
In the mid-1990s, Carolyn Driedger at the USGS Cascades Volcano Observatory (CVO) established the “Living with a Volcano in Your Backyard” outreach program, using the insights of social science (Mileti and Sorenson, 1990; Perry and Lindell 1990; Paton and others, 2008) and working hazard communicators. Since then, she has involved stakeholders in application of the science [4], by:
• Having a long-term, ongoing conversation [6] with stakeholders and people at risk;
• Inhabiting the stakeholders’ worlds, that is, spending time where they live and work [2];
• Meeting the specific needs of each audience [3];
• Working with established social groups [4];
• Providing audiences with a clear image of what will happen when a volcano hazard event occurs—and simple steps for mitigation [3];
• Using consistent and value-based messaging [3] (Bean and others, 2015), which addresses the underlying needs and motivations of the listener [2]; and
• Understanding that trusted sources will be the most effective [3] in conveying hazard messages and elicit-ing protective action.
The long-term conversations [6] include participation in large, formal efforts such as coordination plans and exercises, as well as engagement with smaller focus groups. General volcano hazard messaging and many products are developed collaboratively [4], including emergency coordination plans, school curricula and teacher trainings, and a media guidebook. Other products, including community interpretive signs, maps, Web pages, and community events, are developed with local input [4] by the use of focus groups, semistructured interviews, reviews by surrogate audiences, and questionnaires [5].
Requests from teachers [3] launched CVO’s most popular [5] products (including Eruptions in the Cascade Range During the Past 4,000 Years), which were honed iteratively in multiple rounds [6] of user reviews [5].
Image of the U.S. Geological Survey (USGS) Cascades Volcano Observatory’s most popular public information product (USGS General Information Product 63, http://pubs.usgs.gov/gip/63/), developed at the request and with the participation of local educators.
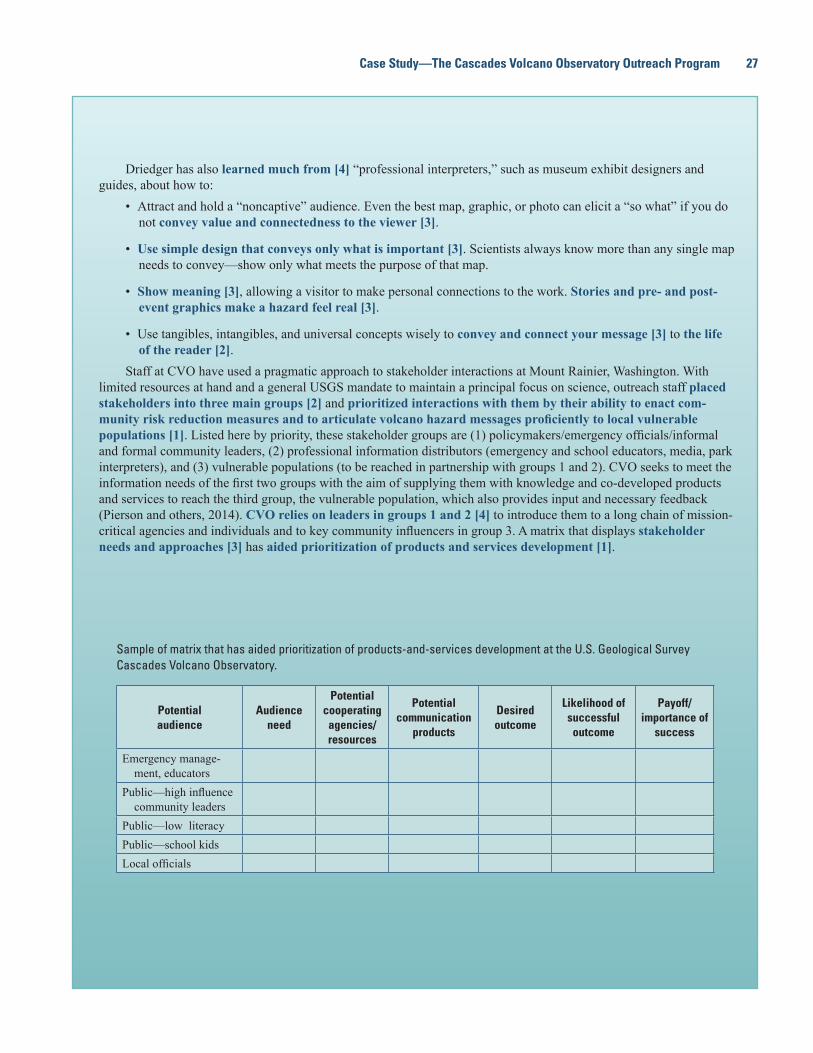
Case Study—The Cascades Volcano Observatory Outreach Program 27
Driedger has also learned much from [4] “professional interpreters,” such as museum exhibit designers and guides, about how to:
• Attract and hold a “noncaptive” audience. Even the best map, graphic, or photo can elicit a “so what” if you do not convey value and connectedness to the viewer [3].
• Use simple design that conveys only what is important [3]. Scientists always know more than any single map needs to convey—show only what meets the purpose of that map.
• Show meaning [3], allowing a visitor to make personal connections to the work. Stories and pre- and post-event graphics make a hazard feel real [3].
• Use tangibles, intangibles, and universal concepts wisely to convey and connect your message [3] to the life of the reader [2].
Staff at CVO have used a pragmatic approach to stakeholder interactions at Mount Rainier, Washington. With limited resources at hand and a general USGS mandate to maintain a principal focus on science, outreach staff placed stakeholders into three main groups [2] and prioritized interactions with them by their ability to enact com-munity risk reduction measures and to articulate volcano hazard messages proficiently to local vulnerable populations [1]. Listed here by priority, these stakeholder groups are (1) policymakers/emergency officials/informal and formal community leaders, (2) professional information distributors (emergency and school educators, media, park interpreters), and (3) vulnerable populations (to be reached in partnership with groups 1 and 2). CVO seeks to meet the information needs of the first two groups with the aim of supplying them with knowledge and co-developed products and services to reach the third group, the vulnerable population, which also provides input and necessary feedback (Pierson and others, 2014). CVO relies on leaders in groups 1 and 2 [4] to introduce them to a long chain of mission-critical agencies and individuals and to key community influencers in group 3. A matrix that displays stakeholder needs and approaches [3] has aided prioritization of products and services development [1].
Sample of matrix that has aided prioritization of products-and-services development at the U.S. Geological Survey Cascades Volcano Observatory.
Potential audience
Audience need
Potential cooperating
agencies/ resources
Potential communication
products
Desired outcome
Likelihood of successful
outcome
Payoff/importance of
success
Emergency manage-ment, educators
Public—high influence community leaders
Public—low literacyPublic—school kidsLocal officials
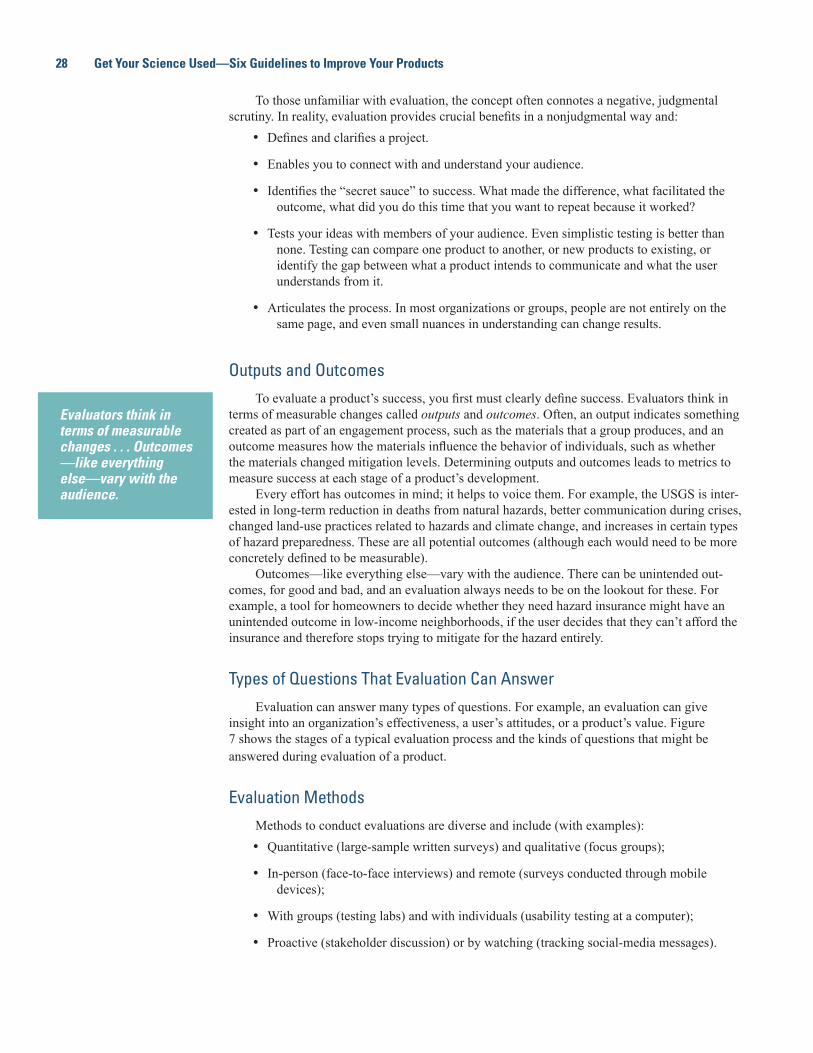
28 Get Your Science Used—Six Guidelines to Improve Your Products
To those unfamiliar with evaluation, the concept often connotes a negative, judgmental scrutiny. In reality, evaluation provides crucial benefits in a nonjudgmental way and:
• Defines and clarifies a project.
• Enables you to connect with and understand your audience.
• Identifies the “secret sauce” to success. What made the difference, what facilitated the outcome, what did you do this time that you want to repeat because it worked?
• Tests your ideas with members of your audience. Even simplistic testing is better than none. Testing can compare one product to another, or new products to existing, or identify the gap between what a product intends to communicate and what the user understands from it.
• Articulates the process. In most organizations or groups, people are not entirely on the same page, and even small nuances in understanding can change results.
Outputs and OutcomesTo evaluate a product’s success, you first must clearly define success. Evaluators think in
terms of measurable changes called outputs and outcomes. Often, an output indicates something created as part of an engagement process, such as the materials that a group produces, and an outcome measures how the materials influence the behavior of individuals, such as whether the materials changed mitigation levels. Determining outputs and outcomes leads to metrics to measure success at each stage of a product’s development.
Every effort has outcomes in mind; it helps to voice them. For example, the USGS is inter-ested in long-term reduction in deaths from natural hazards, better communication during crises, changed land-use practices related to hazards and climate change, and increases in certain types of hazard preparedness. These are all potential outcomes (although each would need to be more concretely defined to be measurable).
Outcomes—like everything else—vary with the audience. There can be unintended out-comes, for good and bad, and an evaluation always needs to be on the lookout for these. For example, a tool for homeowners to decide whether they need hazard insurance might have an unintended outcome in low-income neighborhoods, if the user decides that they can’t afford the insurance and therefore stops trying to mitigate for the hazard entirely.
Types of Questions That Evaluation Can AnswerEvaluation can answer many types of questions. For example, an evaluation can give
insight into an organization’s effectiveness, a user’s attitudes, or a product’s value. Figure 7 shows the stages of a typical evaluation process and the kinds of questions that might be answered during evaluation of a product.
Evaluation MethodsMethods to conduct evaluations are diverse and include (with examples):• Quantitative (large-sample written surveys) and qualitative (focus groups);
• In-person (face-to-face interviews) and remote (surveys conducted through mobile devices);
• With groups (testing labs) and with individuals (usability testing at a computer);
• Proactive (stakeholder discussion) or by watching (tracking social-media messages).
Evaluators think in terms of measurable changes . . . Outcomes —like everything else—vary with the audience.
A Strategy to Improve Understanding—Six Guidelines 29
Your choice of evaluation method can depend on audience, product type, desired out-comes, time frame, and resources. A mix of methods helps to capture diversity in every aspect, from language and literacy to Internet bandwidth and platform.
Evaluation is an iterative process that continues throughout the project and will likely change methods along the way. Ideally, it begins during the onset of a project. Evaluating early helps to define your project goals, can improve the effectiveness of future evaluation, and also helps the evaluators get to know the project. Even if there is no formal evaluation until the end of a project, getting the evaluators to the table early helps to avoid lengthy catch-up. The best evaluations are integrated into a project from beginning to end. Most importantly, you can’t add a criterion for success and evaluate it after the fact—it needs to be built into the project from the beginning.
Evaluation ResourcesEvaluation can be expensive and may seem intimidating if you’re unfamiliar with it, but
evaluation can proceed on a shoestring budget. Although some kinds of evaluation require substantial expertise and training, other kinds can be done with limited knowledge. You’ll need to do some groundwork:
• If you’re working with an evaluator, be specific and candid about funding to allow for appropriate evaluation design;
• Academics are often in a position to help with evaluation design without being fully funded;
• A grad student may see your project as a good dataset for a dissertation and be willing to help you with evaluation;
• USGS Office of Communications provides evaluation related to (1) whether news media and social media highlight USGS key messages, (2) quantitative statistics on viewer-
Define goals, set criteria for evaluation
Are project goals clear? Know the targeted audience.
Who uses the product? Is dissemination plan being used?
What value do users get from this product?
Did this product succeed/ meet project goals?
How often is the product used?
For what reasons?
What did users expect from this product?
Do users understand it and use it correctly?
What is user satisfac-tion level?
Are there unmet user needs?
How does this product compare to another product or version?
Explore existing products that have similarity.
Do project goals fit the larger agenda and plans of the organization?
Is the deliverable clear?
What are criteria for success and metrics for measuring success?
Is there a dissemination plan?
Precursory research
Evaluate utility and application Evaluate benefits
Figure 7. Schematic illustration showing the stages of a typical evaluation process. Each stage has questions to answer or other actions to take.
Starting evaluation early helps to define your project.
30 Get Your Science Used—Six Guidelines to Improve Your Products
ship of USGS outreach materials, and (3) overview reports of news media stories that result from science-communication efforts;
• Many schools have internship requirements and so, for relatively small amounts of money, interns can help with evaluations, but it is important that the student have a strong mentor;
• The American Association of Evaluators (http://www.eval.org) provides free evaluation tools and many resources including interns;
• Usability.gov (http://www.usability.gov) has evaluation templates;
• SAFRR ([email protected]) can share contacts with evaluators;
• SAFRR is building a collection of online resources at http://www.usgs.gov/natural_hazards/safrr/.
6. Repeat, Repeat, Repeat
Every aspect of the process to develop successful products is iterative. In particular, you can never assume you know what members of your audience will think or want. Even when you revise a product based on their input, you need to bring it back to them to get their feedback in an iterative and often co-creative process.
People need reminding on a systematic basis about warning (and presumably other) mes-sages intended for the long-term (Greenfield and others, 1999; Szybillo and Heslin, 1973; Wan, 2004). “Teachable moments” are one excellent means of reminding. Absent these, plan to do routine reminding.
For all products, a single handoff to your audience will limit use and understanding. As you continue to work with members of that audience, expect to remind them of a product’s existence, value, and correct uses.
Using the GuidelinesYou’ve just read a lot of detail about how people take in information and make deci-
sions. You don’t need to remember all of this. Instead, come back to these pages periodically, especially when you start to develop or revise a product. Then, after you engage with audience members, compare the information in this report to your experience.
You now know the six guidelines, a strategy that a variety of communication experts use to develop products that people can understand and use. It’s easy to follow guideline 1 and define your goals for every project that you undertake. When and how you apply the other guide-lines depends on you. It’s unlikely that you’ll make sudden, sweeping changes to the way you develop products. Start slowly, and just make a start. Try one or more of the tips to get started (see below). Improving products is a cumulative process. Each effort you make to improve a single product will give you benefits you can apply to future efforts.
Tips to Get Started With the Six Guidelines
The following are several tips to help you get started using the six guidelines for creating successful and effective products:
• Start small. Compare the guidelines with the way you make products now and find one change that might improve your products. Make that part of your routine, then come back and look for another change to try.
6. Repeat, repeat, repeat:• Think “recurring,” not
“one time.• Keep returning to your
audience.• Keep reminding about the
product and its uses.
You can never assume you know what mem-bers of your audience will think or want.
References Cited 31
• For most people, answering the questions in guideline 1 (Define your goals) is the place to start. Don’t worry about answering all the questions immediately. You’ll add and revise as your project goes along.
• If you know members of your target audience, talk to a few of them. If you don’t know anyone, a colleague might. If you can’t reach your target audience, try a related audi-ence—or just use people who are outside of your field. Ask them about the information they already use—how they get the information and how they use it and why.
• Get their feedback on an existing product—it doesn’t have to be one of yours. What resonates? What confuses? Did they walk away with the author’s intended take-home messages?
• Many sections of this report flag aspects of human nature that can influence communica-tion. Identify which might pertain to your products. When you interact with members of your audience, note which come into play.
• Before you get attached to a particular idea, stage an informal workshop to brainstorm possibilities you might not have considered. Try not to steer the ideas in one direction or another. Invite publications staff or Web developers and members of your target audience to make suggestions.
• Write/map/draw with a specific person in mind.
• In the References Cited, an asterisk identifies references that could be particularly help-ful as you get started. Most of these are derivative publications that combine findings from research and practice.
• SAFRR is building a collection of online resources at http://www.usgs.gov/natural_hazards/safrr/.
• SAFRR ([email protected]) is happy to share contacts if you need to seek expert advice.
References Cited
[Asterisks (*) indicate publications that could be especially helpful as you get started with using the six guidelines.]
*Alfred E. Alquist Seismic Safety Commission, 2010, The study of household preparedness—Preparing California for earthquakes: Alfred E. Alquist Seismic Safety Commission report to the California State Legislature, March 5, 2010, 22 p.
Barron, G., Leider, S., and Stack, J., 2008, The effect of safe experience on a warnings’ impact—Sex, drugs, and rock-n-roll: Organizational Behavior and Human Decision Pro-cesses, v. 106, no. 2, p. 125–142.
*Bean, H., Liu, B.F., Madden, S., Mileti, D.S., Sutton, J., and Wood, M.M., 2015, Final report—Comprehensive testing of imminent threat public messages for mobile devices: College Park, Md., National Consortium for the Study of Terrorism and Responses to Terrorism (START), 159 p.
Brickman, P., and Campbell, D.T., 1971, Hedonic relativism and planning the good society, in Apley, M.H., ed., Adaptation-level theory—A symposium: New York, Academic Press, p. 287–302.
Budescu, D.V., Broomell, S., and Por, H.H., 2009, Improving communication of uncertainty in the reports of the Intergovernmental Panel on Climate Change: Psychological Science, v. 20, no. 3, p. 299–308.
32 Get Your Science Used—Six Guidelines to Improve Your Products
*California Governor’s Office of Emergency Services, 2001 [reissued 2006], Risk communica-tion guide for State and local agencies: Sacramento, Calif., California Governor’s Office of Emergency Services, 87 p.
*Centers for Disease Control and Prevention, 2014, Health literacy—Develop materials: Cen-ters for Disease Control and Prevention Web page, accessed October 8, 2015, at http://www.cdc.gov/healthliteracy/developmaterials/.
*Center for Research on Environmental Decisions, 2009, The psychology of climate change communication—A guide for scientists, journalists, educators, political aides, and the inter-ested public: New York, Columbia University, 54 p.
Clarke, D., 2003, Are you functionally map literate?: Proceedings of the 21st International Car-tographic Conference, Durban, South Africa, August,10–16, 2003, p. 713–719.
Committee on Developments in the Science of Learning, National Research Council, 2000, How people learn—Brain mind experience and school: Washington, D.C., National Academy of Sciences, chapters 1–5, p. 3–127.
*Creighton, J.L., 2005, The public participation handbook—Making better decisions through citizen involvement: San Francisco, John Wiley and Sons, 304 p.
Frisby, B.N., Veil, S.R., and Sellnow, T.L., 2014, Instructional messages during health-related crises—Essential content for self-protection: Health Communication, v. 28, no. 4, p. 347–354.
Garcia-Retamero, R., and Galesic, M., 2009, Communicating treatment risk reduction to people with low numeracy skills—A cross-cultural comparison: American Journal of Public Health, v. 99, p. 2196–2202.
Gigerenzer, G., Hertwig, R., Van Den Broek, E., Fasolo, B., and Katsikopoulos, K.V., 2005, “A 30 percent chance of rain tomorrow”—How does the public understand probabilistic weather forecasts?: Risk Analysis, v. 25, no. 3, p. 623–629.
Greenfield, T.K., Graves, K.L., and Kaskutas, A., 1999, Long-term effects of alcohol warning labels—Findings from a comparison of the United States and Ontario, Canada: Psychology and Marketing, v. 16, no. 3, p. 261–282.
Haase, J.S., Bowling, T., Nowack, R.L., Choi, Y.S., Cramer, C.H., Boyd, O.S., and Bauer, R.A., 2011, Probabilistic seismic hazard assessment including site effects for Evansville, Indiana, and the surrounding region: U.S. Geological Survey Open-File Report 2011–1231, 29 p., accessed July 23, 2015, http://pubs.usgs.gov/of/2011/1231/.
Halpern-Felsher, B.L., Millstein, S.G., Ellen, J.M., Adler, N.E., Tschann, J.M., and Biehl, M., 2001, The role of behavioral experience in judging risks: Health Psychology, v. 20, no. 2, p. 120–126.
Hansen, J., Marx, S., and Weber, E.U., 2004, The role of climate perceptions, expectations, and forecasts in farmer decision-making—The Argentine pampas and south Florida: International Research Institute for Climate Prediction Technical Report 04–01, accessed September 2, 2015, at http://iri.columbia.edu/~jhansen/RoleOfClimatePerceptions.pdf.
Harris Interactive, 2012, Message Research Executive Summary: Harris Interactive, 16 p.
Hassol, J.S., 2008, Improving how scientists communicate about climate change: EOS (Trans-actions of the American Geophysical Union), v. 89, no. 11, p. 106–107.
Haynes, K., Barclay, J., and Pidgeon, N., 2007, Volcano hazard communication using maps—An evaluation of their effectiveness: Bulletin of Volcanology, v. 70, no. 2, p. 123–138.
References Cited 33
Hertwig, R., and Erev, I., 2009, The description-experience gap in risky choice: Trends in Cog-nitive Sciences, v. 13, no. 12, p. 517–523.
Institute of Education Sciences, National Center for Education Statistics, 2003, National assess-ment of adult literacy (NAAL): National Center for Education Statistics Web page accessed August 20, 2015, at https://nces.ed.gov/naal/.
Kahneman, D., 2011, Thinking, fast and slow: New York, Farrar, Straus Giroux, 512 p.
Kahneman, D., and Tversky, A.,1979, Prospect theory—An analysis of decision under risk: Econometrica, v. 47, no. 2, p. 263–291.
Kempton, W., 1991, Lay perceptions on global change: Global Environmental Change, v. 1, no. 3, p. 183–208.
Kreps, G.L. and Kunimoto, E.N., 1994, Effective communication in multicultural health care settings, in Communicating effectively in multicultural contexts: Thousand Oaks, Calif., Sage Publications, p. 72–95.
Linville, P.W., and G.W. Fischer, 1991, Preferences for separating or combining events: Journal of Personality and Social Psychology, v. 60, no. 1, p. 5–23.
Loewenstein, G.F., Weber, E.U., Hsee, C.K., and Welch, N., 2001, Risk as feelings: Psychologi-cal Bulletin, v. 127, no. 2, p. 267–286.
*Lundgren, R.E., and McMakin, A.H., 2013, Risk communication—A handbook for communi-cating environmental, safety, and health risks, 5th ed.: New Jersey, IEEE Press, 416 p.
Lyons, P.J., 2008, A earthquake rattles the Midwest: The Lede, The New York Times News Blog, accessed August 10, 2015, at http://thelede.blogs.nytimes.com/2008/04/18/an-earthquake-rattles-the-midwest/.
Maibach, E., Roser-Renouf, C., and Leiserowitz, A., 2009, Global warming’s six Americas 2009—An audience segmentation analysis: Yale Project on Climate Change Communication and George Mason University Center for Climate Change Communication, 140 p., accessed July 30, 2015, at http://environment.yale.edu/climate-communication/files/climatechange-6americas.pdf.
Mileti, D.S., and O’Brien, P.W., 1992, Warnings during disaster—Normalizing communicated risk: Social Problems, v. 39, p. 40–57.
Mileti, D.S. and Peek, L., 2000, The social psychology of public response to warnings of a nuclear power plant accident: Journal of Hazardous Materials, v. 75, p. 181–194.
Mileti, D.S., and Sorenson, J.H., 1990, Communication of emergency public warnings—A social science and state-of-the-art assessment: Oak Ridge, Tenn., Oak Ridge National Labora-tory, 128 pages.
Miron-Shatz, T., Barron, Greg, Hanoch, Y., Gummerum, M., and Doniger, G., 2010, To give or not to give—Parental experience and adherence to the Food and Drug Administration warn-ing about over-the-counter cough and cold medicine usage: Judgment and Decision Making, v. 5, no. 6, p. 428–436.
Morgan, M.G., Fischhoff, B., and Bostrom, A., 2001, Risk communication—A mental models approach: Cambridge, Cambridge University Press, 366 p.
National Council of Teachers of English, 2013, The NCTE definition of 21st century literacies: National Council of Teachers of English Web site, accessed August 5, 2015, at http://www.ncte.org/positions/statements/21stcentdefinition/.
34 Get Your Science Used—Six Guidelines to Improve Your Products
National Institutes of Health, 2015, Clear communication—Health literacy: National Institutes of Health Web site, accessed August 5, 2015, at http://www.nih.gov/clearcommunication/healthliteracy.htm.
National Network of Libraries of Medicine, 2013, Health literacy: National Network of Librar-ies of Medicine Web page, accessed September, 30, 2014, at http://nnlm.gov/outreach/consumer/hlthlit.html.
National Science Foundation, 2004, Science and technology; public attitudes and understand-ing—Public knowledge about S&T: National Science Foundation Web page, accessed July 30, 2015, at http://www.nsf.gov/statistics/seind04/c7/c7s2.htm.
Office of Management and Budget, [n.d.], Federal collection of information: Office of Manage-ment and Budget Web page, accessed October 22, 2015, at https://www.whitehouse.gov/omb/inforeg_infocoll#PRA.
Paton, D., Smith, L., Daly, M., and Johnston, D., 2008, Risk perception and volcanic hazard mitigation—Individual and social perspectives: Journal of Volcanology and Geothermal Research, v. 172, p. 179–188.
PlainLanguage.gov, [n.d.]a, Why Plain Language? Testimonials—Preface by Warren E. Buf-fett from Security and Exchange Commission, A plain English handbook, 1998: PlainLan-guage.gov Web site, accessed October 6, 2015, at http://www.plainlanguage.gov/whyPL/testimonials/buffet.cfm.
PlainLanguage.gov, [n.d.]b, Tips and tools: PlainLanguage.gov Web site, accessed August 26, 2015, at http://www.plainlanguage.gov/howto/wordsuggestions/index.cfm.
Perry, R.W., and Lindell, M.K., 1990, Predicting long-term adjustment to volcano hazard: Inter-national Journal of Mass Emergencies and Disasters, v. 8, no. 2, p. 117–136.
Peterson, N.D., Broad, K., Orlove, B., Roncoli, C., Taddei, R., and Velez, M.-A., 2010, Partici-patory processes and climate forecast use—Socio-cultural context, discussion, and consensus: Climate and Development, v. 2, no. 1, p. 14–29.
Pierson, T.C., Wood, N.J., and Driedger, C.L., 2014, Reducing risk from lahar hazards—Con-cepts, case studies, and roles for scientists: Journal of Applied Volcanology, v. 3, no. 16, 25 p., doi:10.1186/s13617-014-0016-4.
Pickle, L., 2003, Usability testing of map designs, computing science and statistics, vol. 35: Proceedings of the 35th Symposium on the Interface, Salt Lake City, Utah, 15 p.
Plous, S., 1993, The psychology of judgment and decision making: McGraw Hill, 352 p.
Robertson, J., and Peterson, M., 2014, New insight on the Nation’s earthquake hazards: U.S. Geological Survey Science features—Top story Web page, July 17, 2014, accessed July 28, 2015, at http://www.usgs.gov/blogs/features/usgs_top_story/new-insight-on-the-nations-earthquake-hazards/.
Scheufele, D.A., and Nisbet, M.C., 2007, Framing, in Kaid, L.L., and Holz-Bacha, C., eds., Encyclopedia of political communication—Volume 1: Thousand Oaks, Calif., Sage Publica-tions, p. 254–257.
Sellnow, D.D., Lane, D., Littlefield, R.S., Sellnow, T.L., Wilson, B., and Beauchamp, K., 2014, A receiver-based approach to effective instructional crisis communication: Journal of Contin-gencies and Crisis Management, accessed March 3, 2015, at http://dx.doi.org/10.1111/1468-5973.12066.
Shepperd, J.A., Carroll, P., Grace, J., and Terry, M., 2002, Exploring the causes of comparative optimism: Psychologica Belgica, v. 42, no. 1/2, p. 65–98.
References Cited 35
Sjöberg, L., Moen, B.E., and Rundmo, T., 2004, Explaining risk perception—An evaluation of the psychometric paradigm in risk perception research: Trondheim, Norway, Rotunde, 39 p.
Slovic, P., Fischhoff, B., and Lichtenstein, S., 1986, The psychometric study of risk perception: Risk Evaluation and Management, v. 1, p. 3–24.
*Slovic, P., 2000, The perception of risk: New York, Earthscan, 512 p.
Slovic, P., Finucane, M.L., Peters, E., and MacGregor, D.G., 2004, Risk as analysis and risk as feelings—Some thoughts about affect, reason, risk, and rationality: Risk Analysis, v. 24, no. 2, p. 311–322.
Slovic, P., 2010, the feeling of risk—New perspectives on risk perception: New York, Earths-can, 456 p.
Spence, A., Poortinga, W., Butler, C., and Pidgeon, N.F., 2011, Perceptions of climate change and willingness to save energy related to flood experience: Nature Climate Change, v. 1, p. 46–49.
Syzbillo, G.J., and Heslin, R., 1973, Resistance to persuasion—Inoculation theory in a market-ing context: Journal of Marketing Research, v. X, p. 396–403.
Trope, Y., and Liberman, N., 2010, Construal-level theory of psychological distance: Psycho-logical Review, v. 117, no. 2, p. 440–463.
Tversky, A., and Kahneman, D., 1973, Availability—A heuristic of judging frequency and prob-ability: Cognitive Psychology, v. 5, no. 2, p. 207–232.
U.S. Geological Survey, 2005, Ground-shaking hazard from earthquakes: U.S. Geological Sur-vey General Information Product 5, postcard, accessed August 5, 2015, at http://pubs.usgs.gov/gip/2005/05/.
U.S. Geological Survey, 2014, Guidance on Advocacy and Recommendations in USGS Information Products: U.S. Geological Survey Fundamental Science Practices Web page, updated March 2014, accessed July 28, 2015, at http://www.usgs.gov/fsp/advocacy_and_recommendation_guidance.asp.
*Visschers, V.H.M., Meertens, R.M., Passchier, W.W.F., and De Vries, N.N.K., 2009, Probabil-ity information in risk communication—A review of the research literature: Risk Analysis, v. 29, no. 2, p. 267–287.
Wan, H-H., 2004, The relative effectiveness of inoculation, bolstering, and combined approaches in crisis communication: Journal of Public Relations Research, v. 16, no. 3, p. 201–328.
Weinstein, N.D., 1980, Unrealistic optimism about future life events: Journal of Personality and Social Psychology, v. 39, p. 806–820.
Wickline, M., and Sellnow, T.L., 2013, Expanding the concept of significant choice through consideration of health literacy during crises: Health Promotion Practice, v. 14, no. 6, p. 809–815.
Wood, M.M., Mileti, D.S., Kano, M., Kelley, M.M., Regan, R., and Bourque, L.B., 2012, Com-municating actionable risk for terrorism and other hazards: Risk Analysis, v. 32, p. 601–615.
Zarcadoolas, C., Timm, E., and Bibeault, L., 2001, Brownfields—A case study in partnering with residents to develop an easy-to-read print guide: Journal of Environmental Health, v. 64, no. 1, p. 15–20.
Zarcadoolas, C., Pleasant, A., and Greer, D.S., 2003, Elaborating a definition of health liter-acy—A commentary: Journal of Health Communication, v. 8, supplement 1, p. 119–120.
36 Get Your Science Used—Six Guidelines to Improve Your Products
Zarcadoolas, C., Pleasant, A., and Greer, D.S., 2005, Understanding health literacy—An expanded model: Health Promotion International, v. 20, no. 2, p. 195–203.
*Zarcadoolas, C., Pleasant, A.F., and Greer, D.S., 2006, Advancing health literacy—A frame-work for understanding and action: New York, Jossey-Bass/Wiley, 396 p.
Appendix—About the USGS and SAFRRThe USGS is a science organization that provides reliable, impartial information on the
health of ecosystems and environment, natural hazards, natural resources, and the impacts of climate and land-use change. The USGS serves the Nation by providing timely, relevant, and usable information to describe and understand the Earth; minimize loss of life and property from natural disasters; manage water, biological, energy, and mineral resources; and enhance and protect quality of life.
Within the USGS, the Natural Hazards Mission Area coordinates USGS response follow-ing disasters and oversees USGS emergency-management activities. The mission area also coordinates long-term planning across the full USGS hazards science portfolio, including earth-quakes, volcano crises, coastal erosion, and landslides, as well as other disasters that involve other agencies in research or response and which include tsunamis, floods, geomagnetic storms, hurricanes, severe storms, and wildfires.
The USGS Science Application for Risk Reduction (SAFRR) Project was created to inno-vate the application of hazard science for the safety, security, and economic well being of the Nation. SAFRR helps communities reduce their risk due to natural hazards by:
• Expanding capabilities through partnership;
• Sharing knowledge and needs among researchers and practitioners, other government agencies, public and private utilities, private companies and nonprofit organizations, emergency response and management agencies, policymakers, and the public;
• Connecting the producers of scientific information with users who need their products;
• Directing new and existing scientific research toward addressing gaps and vulnerabilities in current hazard mitigation and response capabilities; and
• Producing products that are successfully used and understood.The SAFRR Project is the continued evolution of the successful Multi-Hazards Demon-
stration Project (MHDP), which started in 2006 and was limited to a 5-year demonstration.In 2014, SAFRR established a style of partnership called the SAFRR Cadre of Relevant
Experts (SAFRR CORE), recognizing that SAFRR collaborates with many external experts whose knowledge and experience could benefit numerous USGS communication efforts. The SAFRR CORE is a rotating group of experts, mostly from outside the USGS, brought together with USGS scientists to share expertise and ideas in order to tackle a common problem. The workshop for the NSHM was the first SAFRR CORE workshop, and the authors of this report are the second group of SAFRR CORE experts (one earlier group of experts conducted a SAFRR CORE session by telephone).

Menlo Park Publishing Service Center, CaliforniaManuscript approval date December 9, 2015Edited by James W. Hendley IIDesign and layout by Vivian Nguyen and Jeanne DiLeoCover by Jeanne DiLeo

Perry and others—G
et Your Science Used —
Six Guidelines to Im
prove Your Products—Circular 1419
ISSN 2330-5703 (online)http://dx.doi.org/10.3133/cir1419