getting beyond breakeven beyond breakeven author susan nelson, principal, tdc contributors allison...
TRANSCRIPT

A Review of Capitalization Needs and Challenges of Philadelphia-Area Arts and Culture Organizations
Commissioned by The Pew Charitable Trusts and the William Penn Foundation
Getting Beyond Breakeven

AuthorSusan Nelson, Principal, TDC
ContributorsAllison Crump, Senior Associate, TDCJuliana Koo, Senior Associate, TDC
This report was made possible by The Pew Charitable Trusts and the William Penn Foundation. It may be downloaded at www.tdcorp.org/pubs.
The Pew Charitable Trusts is driven by the power of knowledge to solve today’s most challenging problems. Pew applies a rigorous, analytical approach to improve public policy, inform the public, and stimulate civic life. We partner with a diverse range of donors, public and private organizations, and concerned citizens who share our commitment to fact-based solutions and goal-driven investments to improve society. Learn more about Pew at www.pewtrusts.org.
The William Penn Foundation, founded in 1945 by Otto and Phoebe Haas, is dedicated to improving the quality of life in the Greater Philadelphia region through efforts that foster rich cultural expression, strengthen children’s futures, and deepen connections to nature and community. In partnership with others, the Foundation works to advance a vital, just, and caring community. Learn more about the Foundation online at www.williampennfoundation.org.
TDC is one of the nation’s oldest and largest providers of management consulting services to the nonprofit sector. For over 40 years, TDC has worked exclusively with nonprofit, governmental, educational and philanthropic organizations, providing them with the business and management tools critical to carrying out their missions effectively. Learn more about TDC at www.tdcorp.org.
Copyright © 2009 by TDC, Inc.

1
This document reports the key findings from the “Review of Capitalization Needs and Challenges of Philadelphia-area Arts and Culture Organizations,” a study commissioned by The Pew Charitable Trusts and the William Penn Foundation and conducted by TDC, a nonprofit research and consulting firm based in Boston. The objectives of the study were to review the capitalization status, needs, and challenges faced by nonprofit arts and culture organizations in the five-county Philadelphia region; clarify how well these organizations understand these needs; and develop recommendations for how organizations’ financial health and capitalization could be improved.1
This study was commissioned and conducted in late 2007 and early 2008, before the severe economic downturn in the fall of 2008. In this context, the first question we address is a simple one: Why talk about capitalization, especially now when so many organizations are struggling just to survive? This is a fair question, especially in the nonprofit context. In the for-profit world, capitalization – embodied in an organization’s equity – is everything. For nonprofits, however, financial performance is not the sine qua non of exemplary overall performance, and balance sheet analysis cannot measure social impact or artistic excellence.
So why should nonprofit arts organizations care about capitalization? TDC posits that financial health and mission impact are linked for a number of reasons. First, undercapitalization is distracting and debilitating, making it challenging to maintain the focus and energy necessary to conceive and produce the highest quality artistic programs. The stress and distractions can take many forms: listening to angry phone messages from creditors, patching up systems in poorly maintained buildings, wondering how the next debt payment or payroll will be covered, scrambling to find replacement funding when a grant doesn’t come through or when the last show wasn’t a success.
Even more importantly, undercapitalization can chill artistic risk-taking. An organization one failure away from closing has a strong incentive to choose the tried and true over the experimental. Even before the radical downturn in the environment, the arts sector was at an inflection point, where rapidly changing consumer tastes and habits were challenging the traditional business models of arts organizations. Without adequate capitalization, cultural organizations are hard put to pursue innovative strategies to address the changes in the marketplace.
Finally, undercapitalization puts organizations at risk of failure, and of course, organizations cannot meet their missions if they don’t exist. The squeeze of straitened resources and narrowing options resulting from the economic downturn has placed the risks of undercapitalization into sharp relief. Those organizations with solid capital structures have the capacity to last through the rainy day. Those that don’t are already pressed. The purpose of having a discussion about capitalization now is not only to grasp the teachable moment. Rather, the forward-thinking intent is to help viable organizations to create realistic plans as they adjust their strategic goals to fit a new, uncertain landscape of funding and audience engagement.
This discussion of capitalization falls into a field primed both in theory and practice. TDC recognizes that there are long-time players in the sector who have been talking about capitalization for many years, including the Nonprofit Finance Fund and National Arts Strategies. This study has built on this invaluable thinking. (For further reading, we have included a list of resources we found helpful on page 9.) In our conversations with Philadelphia organization managers, service providers, and funders, TDC was heartened to find a culture that values and supports capacity building and strategic planning. We hope that the insights gained through this project will help to move that agenda forward.
Introduction
1 TDC interpreted “arts and culture” broadly to include a multitude of disciplines, reaching beyond the traditional fine arts. We sorted organizations into 10 discipline groups: art museums, arts education organizations, arts service organizations, dance organizations, historical museums and societies, humanities organizations, music organizations, natural history and other museums, theaters, and visual arts organizations.

2
Before delving any further, let’s step back and define the subject at hand. What is capitalization?
Capitalization is the accumulation and application of resources in support of the achievement of an organization’s mission and goals over time. The province of capitalization is the balance sheet, which encapsulates the record of an organization’s financial performance as net assets and measures the magnitude of its assets and liabilities. A strong balance sheet evidences an organization’s ability to access the cash necessary to cover its short- and long-term obligations, to weather downturns in the external operating environment, and to take advantage of opportunities to innovate. Conversely, an undercapitalized organization often falls short of these capabilities.
Unpacking the balance sheet. By building their net assets through years of surplus operations, organizations develop the capacity to plan for the future, react quickly to new opportunities, and support missions that require major fixed assets and a long-term view. There are six distinct types of capital funds, described in the table below, that managers can use to maintain organizational health. Each of these funds addresses a distinct need.
Not all organizations require all of these funds. The nonprofit sector is plagued with misconceptions about the different types of capital funds and their use. For example, while endowments are an essential piece of the capitalization mix for organizations that have significant long-term obligations, they may not be a helpful use of funds for those that live primarily in the current day. In fact, by restricting capital, endowments may actually be counterproductive for some organizations that could be better served with board-restricted reserve funds. The proper scope and scale of capital structure can only be determined after an examination of an organization’s time horizon, core business model drivers, and lifecycle stage.
What is Capitalization?
Fund Description of use Time Horizon
Operating funds The money that organizations use to pay for their reasonable, planned day to day expenses during the year to run their programs as stated in their current strategy.
Current: Planned operational need
Working capital Working capital funds are meant to smooth cash flow bumps that arise from predictable business cycles.
Current: Planned cyclical need
Operating reserve Unlike working capital, operating reserves are held in order to protect against unexpected downturns, i.e. the “rainy day.”
Current: Unpredictable, one-time risk
Capital replacement reserve
A cash fund organizations with facilities maintain to realize long-term facilities replacement plans.
Long-term: Planned capital replacement
Endowment Endowments are meant to ensure the longevity of organizations with long-term time horizons through investment earnings dedicated to ongoing costs, such as maintenance of a collection or historic building. In general, the endowment corpus is legally restricted, although boards can create quasi-endowments not restricted by donor intent.
Long-term: Planned operational need
Risk capital Risk capital is meant to give organizations the freedom to try out new ideas, such as product extensions, new marketing campaigns to broaden audience, earned income ventures, major growth, or a new strategic direction. Risk capital should be used to address large environmental shifts that demand a change in strategic direction.
Long-term: Strategic risk

3
Time horizon. Time horizon is an essential consideration when matching an organization’s mission to a capital structure. On one end of the spectrum are organizations that live in the present day, seeking to address the needs of the current-day population and realizing a single person’s innovative idea or artistic voice. They may be low budget, driven with sweat equity of a committed staff. In the middle range are organizations that are invested in a logic model, brand, or regular audience or membership. At the long-term end of the spectrum are institutions that are committed to stewardship of buildings and collections and that are investing to meet the needs of future audiences.
Matching the need with the fund is important. Organizations that are more concerned with present-day needs require more flexible capitalization, while those with the obligation to look to the future need permanence and stability. Matching becomes harder when there are competing agendas with different time horizons at the same organization. For example, at a museum, collections stewardship has a long-term time horizon while education programs are mid-range.
Business model drivers. To build our evaluative model for capitalization, TDC defined four basic business model drivers, described in the table below, which each have an associated time horizon.
Few organizations could be confined to only one of these buckets. Theaters, for example, often have a hybrid business model, being audience dependent and facilities heavy at the same time. As an organization adds layers, its capitalization needs become more complex, encompassing multiple constituents, larger obligations to maintain fixed assets, and longer time horizons. Conversely, for the simplest organizations that focus on current needs, capitalization structure often is simple, highly liquid, and highly flexible. To illustrate these business model drivers in action, TDC has prepared five organizational profiles, which appear on page 13.
Organizational lifecycle. Capital needs are also determined by an organization’s place in the organizational lifecycle. Transition stages – Start-up, Growth, Decline, Renewal – are the places where organizations have more intense capital needs. One caveat to note about the lifecycle – while it is tempting to map the four business model drivers onto lifecycle, it can be counterproductive to imagine that all artistic vision organizations must someday “grow-up” into facilities-owning institutions.
Business Model Driver Description Time Horizon
Artistic Vision While all organizations have an artistic vision, an organization with a “pure” artistic vision business model would be one built around the work of a single artist, voice, or method. These types of organizations often operate project to project with slim overhead costs.
Obligation to realize vision in near term
Audience Dependent Attendance and ticket sales are key drivers of financial health as well as measurements of mission success. Performance based organizations often fall into this category, as do any groups that are dependent on paid attendance. These organizations often invest in brand-building activities to sustain audience interest over time and independent of particular programs or artists.
Obligation to serve audience in near- and mid-term
Facilities Organizations that require buildings or other extensive fixed assets to operate fall into this group. Requires higher levels of capitalization to achieve stability. Creates pressures on the operating budget that can be outside the control of management.
Long-term obligation to maintain facilities
Collections Organizations with collections are (or should be) planning for the long-term needs of collections and posterity, balanced with the needs of current audience. Should have or plan to have an endowment as well as a facility to address these non-negotiable needs.
Perpetual obligation to steward collections (care, housing, conservation)

4
The study’s core questions were:
To what extent are nonprofit arts and culture organizations ��
in the Philadelphia area capitalized adequately to enable achievement of their missions? Do local nonprofit cultural leaders understand the ��
relationship between capital structure and achievement of organizational mission, and is that understanding evident in their decision-making and actions?Does the system of incentives and technical assistance help ��
to improve the financial health and capitalization of cultural organizations?
TDC used both quantitative and qualitative analysis to answer the core questions. Using the Pennsylvania Cultural Data Project (PACDP) dataset, we evaluated the financial position of 158 organizations.2 The majority of the available data were drawn from fiscal years 2005 and 2006. We interviewed a subset of 60 organizations to evaluate financial literacy. We researched the funding and capacity building environment by interviewing 12 local and national arts funders, 5 local service providers, and 11 outside experts, and reviewing the literature on nonprofit capitalization and financial health.
TDC designed a classification system that defined four scores, from one being strongest to four weakest. The strongest organizations had the ability to meet their financial obligations, weather downturns, invest in new ideas, and were best positioned to achieve their missions. The weakest organizations were severely constrained. To classify organizations, we conducted a financial statement analysis. Primary consideration was given to the condition of the balance sheet, the levels of liquidity, working capital, and available unrestricted net assets, in the context of the budget size. Special attention was paid to the management of restricted funds and deferred revenue, which is easily overlooked as a risk factor, but is a leading indicator of a strapped organization borrowing from its future operations. Secondary analysis focused on revenue and expense factors, such as proportions of contributed and earned revenue, funding of depreciation and debt service, and patterns and scale of net surpluses and deficits. Different thresholds
for liquidity, earned income ratios, endowment value, and capital replacement reserve size were determined based on business model drivers. The scoring criteria chart on page 12 offers more details, and the organizational profiles on page 13 illuminate TDC’s scoring methodology and rationale. TDC also designed a classification system for financial literacy, which measured understanding of the balance sheet and financial operations, ability to articulate capitalization needs, ability to project forward, and ability to set the organization’s financial structure in the larger context of the sector and the regional environment.
It’s important to note that the measures TDC used to judge adequate levels of capitalization are more complex than the two more universally accepted yardsticks in the nonprofit world – a balanced budget with a modest surplus that ties to the stated objectives of an organization, and a positive unrestricted fund balance. This study has asked us to hold organizations to a different – longer range – standard than most are currently asked to be accountable for. If we had used the more conventional criteria to measure the financial condition of the groups in this study, we may have indeed come up with a more optimistic set of rankings.
While at first blush the goals of breakeven and positive net assets may appear simplistic, they are not. Generating revenue – both earned and unearned – to support the various complex business models of art and culture nonprofits is challenging. Matching available revenue to mission priorities and operating realities requires truly skilled and thoughtful management and planning, and in our interviews we indeed found that the majority of organizations understand a great deal about their financial condition. They work hard to hold themselves to balanced budgets and positive fund balances, thinking long and hard about the tradeoffs they need to make to keep the ship afloat.
What Were the Study’s Core Questions and Methodology?
2 The organizations were drawn from grantee lists supplied by the William Penn Foundation and The Pew Charitable Trusts, and were chosen to constitute a representative (but not random) sample. All organizations had budget sizes above $150,000. Footnote 1 lists the included 10 discipline groups.

5
3 Since this study focused on Pew and William Penn grantees, TDC did not evaluate the granting practices of other funders.4 It is also of interest to note that these conditions are not unique to the Greater Philadelphia area. The Boston Foundation recently published two reports, “Vital Signs” and
“Passion and Purpose” (both cited in Selected Resources), that reinforce our findings. “Vital Signs” reported very similar financial conditions for a significant segment of the Greater Boston arts and cultural sector. “Passion and Purpose,” which reviews the health of the overall nonprofit sector in Massachusetts, points to the similar weakness in the capital structures of a critical number of organizations regardless of subsector.
This process has been ably facilitated by the granting programs of the William Penn Foundation and The Pew Charitable Trusts.3 Our interviews and the data demonstrated that both funders’ guidelines had served to either generate or reinforce these practices that are at the core of long-term stability. In effect, the very real accomplishment of creating this level of stability now allows the goal post to be moved. What this study reveals is that if organizations and their supporters want to assure their long-term viability they need to build on these core achievements and create a new set of measures.4
And yet – this more comprehensive set of measures may not be necessary for the entire sector. Some organizations by their very nature may be created to present a unique artistic voice for the duration of that voice. This study was not designed to cross reference the artistic quality of an organization’s offerings with its financial condition. There is an abundance of evidence in the field that organizations with one or more of the following attributes – long-term horizons, a significant operating scale, and/or facilities and collections – are more likely to find artistic quality compromised by concerns about their financial conditions. In TDC’s view, there is an open question as to whether smaller arts organizations, not constrained by the need to manage capital assets because of the unique time horizon of an individual leader’s vision, require the same level of sound financial structure to achieve quality. It may be that certain organizations are able to shrink and grow according to their current economic standing. Living in a financially fragile condition for this unique subset of cultural organizations may be just fine. We believe a great deal more thinking needs to be done to design sustainable solutions for individual artists. Forcing goals appropriate for institutions onto individuals may be inappropriate.

6
The results of the study are sobering, even more so when considering the fact that it was completed in spring 2008 before the economic downturn.
Weak financial health. The study confirms what organizations and funders knew already: Arts organizations at all budget sizes and in all disciplines have troubling balance sheets and highly constrained capital structures. We found that 77 percent of the organizations we reviewed fell into classes 3 and 4, the weaker end of the spectrum.
There was surprisingly little variation on these results based on organizational characteristics. There was a slightly higher tendency for financial health at the top of the budget spectrum ($20 million and above), and a slightly lower tendency at the bottom ($150,000 to $250,000). We found that organizations with an audience-driven, performance-based focus were more likely to be weaker, while art and natural history museums were more likely to be stronger. A particularly disturbing finding was the high percentage of organizations currently in capital campaign seeking to embark on major expansions that had weak capitalization structures.
Strong financial literacy. Belying the belief of most academic experts that nonprofit managers do not understand their financial situations, TDC found that organizational leaders were generally articulate about the financial health of their organizations and the strengths and challenges they have faced and continue to confront. Only 10 percent of those interviewed fell into the low financial literacy category, and over half were highly knowledgeable. Financial literacy did not vary significantly by budget size, discipline, or financial health. As in the overall pool, the majority of those in the weaker financial health categories had mid to high financial literacy scores.
Strong support for capacity building and strategic planning. We found that Philadelphia has the good fortune to have a robust system of resources and incentives to support capacity building that has been built up by regional funders and service providers. TDC found that this capacity building agenda has provided benefits to the system, including strong financial literacy, ongoing strategic planning, and breakeven budgeting.
So, why is it that financial literacy and a strong support system do not seem to impact long-term financial health? In TDC’s interviews and in our review of the data, it is clear that many organizations have greatly improved their internal understanding of how to balance their yearly budgets. There are many incentives in the system that encourage organizations to break even. We heard repeatedly how running a deficit was frowned on by boards and funders. Organizations have responded well to that message and work hard not to run a deficit. This same discipline, however, has not occurred with larger capitalization issues. While breakeven is an essential goal for achieving adequate capitalization, it is not enough. The focus on breakeven has trained attention on the profit and loss statement, while the balance sheet has been neglected. When the goal is breakeven, there is no avenue through which to build up net assets and capital funds, which can only be accumulated through regular and significant surpluses.
What Were the Study’s Core Findings and What Are the Implications?
Health Score – All Organizations
1 2 3 4 Total
Total 15 22 63 58 158
Percentage 9% 14% 40% 37% 100%
Health Score – Organizations in Campaign
1 2 3 4 Total
Total 3 4 11 7 25
Percentage 12% 16% 44% 28% 100%
Financial Literacy Score, by Health Score
Financial Literacy Score
Health Score
1 2 3 4 Total Percentage
Low 1 0 1 4 6 10%
Mid 2 2 10 7 21 35%
High 4 6 18 5 33 55%
Total 7 8 29 16 60 100%

7
One source of the disconnect may be a narrow scope of planning. Although organizations know that they need a higher degree of capitalization to reach their goals, they are often not realistic in projecting the size of the necessary resources and, moreover, they often don’t size the market to see if strategies to garner these resources are feasible. By including capitalization analysis and external market research, strategic planning could become more effective at helping organizations set feasible goals. Benchmarks are only part of the answer, however. Several organizations who had used PACDP data to compare themselves to others commented, “Well, I don’t look too bad compared to my sister organizations.” This type of comparison may have unanticipated consequences for the field. If the majority of your peer organizations are severely undercapitalized and posting only modest margins, what impetus does this offer to change behaviors? As one organization’s director stated, “I know I don’t have enough cash to do anything but no one else does either. Maybe it’s just the way it is. And that’s what my treasurer thought when I showed him some benchmarks.”
Another problem is miscommunication and fear of failure. Many organizations know they are inadequately capitalized and yet feel they have no choice but to assume the risks associated with undercapitalization because they believe that key constituents – including foundations, donors, and boards – do not see this as a prime concern. Our interviews provided insights on how organizations try to finesse the discussion in terms that their constituents find motivating in order to access capital. Unfortunately, these tactics often lead to situations that don’t fully address the challenge of developing a sustainable capital structure.
For example, a common capitalization challenge is the long-term care and feeding of facilities. The problem is often baked into facilities projects from the start. Many of those we interviewed had compromised campaign goals by decreasing the amount set aside for reserves, capital replacement funds, and endowment. A truly comprehensive look at how much capital may be needed beyond the hard costs – such as tweaking or revamping of newly launched products, new branding or marketing messages that last beyond launch, unanticipated operating costs, or unanticipated capital costs – is often lacking. Again, when pushed on these issues, most managers realize the dangers of undercapitalization but are “afraid if we kept hammering on these issues the project would not move forward.”
These compromises are played out as an organization lives with a new facility. The majority of organizations with facilities reported an inability to generate enough annual surplus to fund true capital replacement reserves. Even those that budget for depreciation do not always use the excess funds to address long-term capital needs. Boards and staff are fatigued enough from trying to achieve breakeven; adding the burden of capital reserves feels impossible, especially given the limited set of funding vehicles. Without addressing facilities needs on an ongoing basis, organizations fall back on capital campaigns to raise funds when needs become pressing. While there may be some efficiency to this type of fundraising, there are also significant dangers. A startling finding from this study was that to make these capital campaigns attractive to donors, organizations often plan expansions or remodeling projects that will ultimately increase operating costs, further eroding the organizations’ ability to meet routine facilities needs on an ongoing basis.
Many groups interviewed clearly see the world changing around them. Even those who felt stable expressed an awareness of the tenuous position they occupy, the changing nature of the cultural environment, and their fundamental vulnerability. Many organizations are trying to define a response to the impact of rapid change in audience behavior and the crowded field of cultural opportunities now available in Philadelphia. For many the lack of access to risk or working capital stymies their ability to fully define the problem – is it a marketing issue, a product problem, or a question of relevance to mission? – and then respond to the problem in a meaningful or creative way. As one organization’s director stated, “I feel as if the arts world is at a critical moment when we need to take some real risks. Yet somehow there is an overall feeling that art groups need to be financially conservative. There is not much reward to taking risks unless you succeed every time – which, of course, is not the nature of risk.”

8
In TDC’s view there are three things that appear to advance capitalization:
Financial literacy that affords managers and boards an ��
understanding of the organization’s financial structure.Robust strategic business planning that establishes a ��
feasible roadmap to sustainability; andIncentives from boards and funders that recognize and ��
support the results of robust planning and a common language through which to have an informed discussion about capital needs.
In TDC’s conversations with both stakeholders and grantees, we saw that indeed financial literacy and incentives for strategic planning and balanced budgets do exist in Philadelphia. However, we do not see them elevated to a full capitalization strategy, despite the fact that financial literacy has grown over the years. While we did find that most organizations can identify their key capitalization issues, they have not been able to integrate this knowledge into coherent plans that tie to a comprehensive and contextual strategy.
A true strategic business plan articulates a mission and vision that demonstrates an organization’s value proposition, and it analyzes four elements in order to build a comprehensive roadmap to sustainability: competitive position in the market, quantification of and demonstrated ability to garner necessary resources, capitalization strategy, and potential risks. To be valid, these analyses must be informed and supported by external data. In the organizational profiles on page 13, we have shown how TDC thinks about the internal and external research that organizations may need to pursue to inform their strategic planning processes. External research is difficult, and the available data can be missing, ambiguous, or not quite on target. There is as much art as science to strategic planning. However, in TDC’s view, an organization increases its chances of making the right decision if it takes a hard look at the external operating environment first.
Even if they could construct optimal strategic plans, organizations often have no meaningful outlet to test or integrate them. As we spoke with organizational leaders, we heard that trustees often are not focused on capitalization and that funders often do not offer rewards and incentives that foster healthy capital structures. The incentives that funders currently do provide, which assure that strategic plans and balanced budgets exist, do not go far enough. If they are not asked for evidence of an integrated capitalization strategy,
organizations fall back to a balanced budget stance, since this is already difficult enough to achieve. The lack of incentives also adds a level of uncertainty. Many of the organizations we spoke with were afraid to talk to funders and donors about undercapitalization because they worry about being perceived as weak and, ultimately, “unfundable.”
The nonprofit sector is tasked with imagining a better, more beautiful society and conceiving of innovative ways to achieve this vision. Everyone involved – artists, managers, board members, and funders – are there because they want to participate in dreaming this dream. In the midst of the grand visions, it is imperative to call the hard questions about strategic positioning and capitalization: Are we the right people to do this at the present time? Do we have the necessary resources to do this right? Each organization needs multiple voices from the spectrum of stakeholder groups asking these questions. Without a system of checks and balances in place to temper the visionaries in the room, nonprofits can find themselves in an unsustainable situation that makes realizing even a pale version of the dream impossible.
In TDC’s view, addressing this challenge must be seen as a shared responsibility across the sector, from funders, boards, and staffs. While technical assistance and robust resources have progressed us forward, this study has shown that educational interventions cannot get us all the way to our desired outcome of sustainable organizations. The system needs to support the fruits of this work. Organizations have met difficult goals and are ready to go to the next level through honest, productive conversations with boards and funders that recognize the issues and design meaningful, achievable solutions.
To prime these conversations, TDC is designing a capitalization analysis tool, which will be implemented in partnership with PACDP. With this tool, organizations and funders will be able to review the key capitalization issues that an organization faces, using the same ratios and analytic techniques regularly used by TDC when we assess financial health. The tool will offer some ability to set this analysis in the context of an organization’s key business model drivers and lifecycle. The hope is that the tool will help organizations and funders ask the difficult questions during strategic planning and other key juncture points in an organization’s lifecycle. The goal is not perfection but continued progress.
How Can the System Move Forward?
9
Talking about capitalization in the current economic climate is a double-edged sword. On one hand, it opens up the conversation about financial health – there is no shame in claiming fragility in these troubled times. On the other hand, TDC worries that the economic crisis will provide yet another excuse to duck the hard questions. Depending on the soundness of an organization’s capital structure and the quality of the board and management, the recession means something very different for different organizations. For one group, this is the rainy day for which they have prudently prepared. They have options. While belt-tightening will be painful, it won’t change the fact that they will make it through the downturn with their core missions intact. For a second group, the recession will have a profound impact on an organization’s growth and development. For those in the middle of a lifecycle change, the economic downturn increases the risk factor tremendously. For those facing the decision to grow or change, they may have to forego their dreams until conditions are more favorable, perhaps sacrificing long-term strategic positioning for short-term financial health, at least temporarily. For a third group, the recession will be the straw that breaks the camel’s back. Managing structural deficits and fragile balance sheets through the near term will be a more and more monumental task, and the feasible set of options will narrow. For these organizations, everything needs to be on the table, including strategic repositioning, merger, and bankruptcy.
The key question that management, boards, and funders need to ask at this point is: Which of these realities is mine? If the key stakeholders are not in agreement about an organization’s reality, it is impossible to have an honest conversation about workable, effective solutions and organizations run the risk of a debilitating indecision. If they assume the wrong reality, they may end up making completely inappropriate decisions that do nothing but stave off the day of reckoning a little further. If they can agree on the correct reality, even if it’s ugly, there is a hope of crafting feasible solutions or, in the very least, salvaging the core pieces of value the organization retains.
The arts and culture funders in Philadelphia are ready, willing, and able to have the honest conversation. Through the publication of this report and the creation of the capitalization tool, the William Penn Foundation and The Pew Charitable Trusts hope to help organizations identify the key strategic questions they need to face head on in partnership with their stakeholders. The system in Philadelphia is primed through decades of hard work in capacity building and quality arts programming. Now is the time to bring the energy and commitment of the system to bear to ensure the enduring vibrancy of Philadelphia’s arts sector through the recession and beyond.
Selected Resources
Elizabeth Cabral Curtis and Susan Nelson, “The Risk of Debt in Financing Nonprofit Facilities: Why Your Business Model Matters” (TDC, 2007)
Elizabeth Keating, “Passion and Purpose: Raising the Fiscal Fitness Bar for Massachusetts Nonprofits” (Boston Foundation, 2008)
Clara Miller, “Hidden in Plain Sight: Understanding Nonprofit Capital Structure” (Nonprofit Quarterly, Spring 2003) and “The Business Roots of Capacity and Mission at Nonprofits” (Nonprofit Finance Fund, 2002)
Susan Nelson and Ann McQueen, “Vital Signs: Metro Boston’s Arts and Cultural Nonprofits 1999 and 2004” (Boston Foundation, 2007)
George Overholser, “Nonprofit Growth Capital: Building Is Not Buying” (Nonprofit Finance Fund) and “Patient Capital: The Next Step Forward?” (Nonprofit Finance Fund)
Jim Rosenberg and Russell Taylor, “Learning from the Community: Effective Financial Management Practices in the Arts” (National Arts Strategies, 2003)
Thomas Wolf, “The Search for Shining Eyes” (Knight Foundation, 2006)
Dennis Young (editor), Financing Nonprofits: Putting Theory into Practice (Altamira Press, 2007)

10
More about Financial Assessment and Financial Health Scoring
While it may bear more than a passing resemblance to a consultation with the oracles at Delphi, it’s important to note that the financial assessment process is not magical. It requires honesty, reliable data, and attention to a few key indicators. TDC’s method adheres to the following principles.
Except where the analysis explicitly deals with restricted ��
funds, all calculations should be performed on an unrestricted basis. This isolates current operations from resources set aside for future use; mitigates against some of the volatility that tracks activity related to restricted funds; and emphasizes those resources that are fully available and under the control of management.
Total expenses are preferred as the indicator for ��
organization size. Again, this eliminates some degree of the volatility associated with revenue cycles, and more closely tracks the scale of operations.
There is close attention paid to the impacts of investment ��
in fixed assets and associated debt. The degree to which Unrestricted Net Assets are tied up in capital assets has a significant impact on flexibility; in many cases this calculation reveals that the organization’s available net assets are negative. Reliance on debt brings different concerns, when narrow operating margins are inadequate to cover principal payments, or when debt service becomes an intractable component of the operating budget.
Cash position must be examined as a corollary to accrual-��
based indicators such as Current Ratio and Working Capital. Inability to make payroll is paralyzing for management, and size does not inoculate organizations from these pressures. One common source of cash flow is the borrowing of deferred revenue and restricted funds to support current operations; this practice defers the day of reckoning, but has dangerous cumulative impacts on operations and betrays the trust of key supporters. The indicator “coverage of restrictions” calculates coverage of restricted funds and deferred revenue to clarify an understanding of operating cash.
Short-term investments can supplement cash, but �� TDC does not regard the unrestricted or temporarily restricted portions of endowment (after the planned spend amount is taken out) as available to support operations. The endowment model is only sustainable if the corpus is growing; capital preservation alone is not sufficient.
Maintaining a facility creates financial pressures that are ��
manifested on the balance sheet, the operating budget, and the need for cash reserves. Those organizations that own facilities are expected to demonstrate a higher level of capitalization and flexibility to be positioned to responsibly manage this heightened demand. Best practice calls for the accumulation of a capital replacement fund as a capitalized asset depreciates over time.
The business model of the organization is a key driver in the ��
evaluation of its financial position. Beyond explicit financial considerations, such as the presence of endowment or facilities, the nature of the mission carries with it differing degrees of flexibility and need for capital. TDC considers the business model along with quantitative indicators in evaluation of financial health.
Note on Endowment Spending
In the profiles that follow, we used the term “endowment spending” to refer to the amount transferred to support operations. Endowments are governed by spending policies that define the maximum prudent use to support operations. Spending is typically calculated based on a rolling average, which may or may not correlate to a single year’s total return. Thus, “endowment spending” and “endowment income” are different.
A balanced spending rule allows for ups and downs to ease the pain of market swings but also accounts for inflation to protect the future worth of the endowment. The endowment spending formula has a number of goals:
1. Protect the future purchasing power of the endowment against inflation,
2. Smooth revenue for current use against volatility in the stock market, and
3. Account for management fees.5
Appendices
5 Dick Ramsden, “Insights into the Yale Formula for Endowment Spending” (http://www.commonfund.org/Commonfund/Archive/News/Yale_formula.htm)

11
Financial Health Indicators
The following table provides a list of key indicators that TDC observes during a financial assessment. Not all of these will be relevant for every organization.
Indicator Formula
Current RatioCurrent Assets
Current Liabilities
Operating MarginNet Income
Total Revenue
Months of Operating CashCash + Short Term Investments
(Total Expense / 12 )
Working Capital( Cash + Short Term Investments – Current Liabilities )
Total Expense
Unrestricted Net Assets (URNA) net of Property, Plant, and Equipment (PPE)
URNA – ( Net fixed assets – associated debt )
Coverage of Restrictions Total cash + investments
( Deferred revenue + TRNA + PRNA6 ) – ( Pledges + Restricted grants receivable )
Coverage of Total Debt ServiceNet income
Current portion debt
Debt Service ImpactTotal Debt Service including principal and interest
Total Expense
6 TRNA: Temporarily Restricted Net Assets. PRNA: Permanently Restricted Net Assets.

12
Score Profile Indicators With Owned FacilityBusiness Model Driver
Considerations
1
Can weather a prolonged ��
downturn in external conditions
Can invest in new ideas ��
Can effectively address its ��
continuing facilities needs
Is well positioned to define ��
strategy and achieve mission
Positive unrestricted net assets ��
(net of investment in facilities)
6 months of operating cash ��
Meaningful operating reserves
Capital replacement reserves of 20% of building value
For audience driven orgs, ��
earned revenue greater than 70% of revenue
For collections based orgs, ��
endowment greater than building value
2
Has adequate working capital��
Can weather a short downturn ��
in conditions
Needs outside investment to ��
pursue new ideas
Can address some facilities ��
needs but relies on infusions of capital to address larger needs
Positive unrestricted net assets��
3 months of operating cash��
Ability to cover restricted cash ��
accounts
Capital replacement reserves of 20% of building value
For audience driven orgs, ��
earned revenue greater than 50% of revenue
For collections based orgs, ��
endowment greater than 75% of building value
3
Has inadequate working capital��
Has to make budget cuts in ��
response to even a short down turn in conditions
Cannot invest in new ideas ��
and is dependent on infusions of capital to address facilities needs
Modest unrestricted net assets��
Under 3 months operating cash��
Negative operating results in at ��
least one of the last three years
Inability to consistently cover ��
restricted cash accounts
For audience driven orgs, ��
earned revenue less than 50% of revenue
For collections based orgs, ��
endowment greater than 50% of building value
4
Living hand to mouth��
In crisis or severely constrained��
Negative or negligible ��
unrestricted net assets or steeply trending to this condition
Severely constraining levels of ��
cash and working capital
For audience driven orgs, ��
earned revenue less than 30% of revenue
For collections based orgs, ��
endowment less than 50% of building value
Financial Health Scoring Criteria

13
TDC has prepared these fictional organizational profiles to illustrate the four business model drivers described on page 3: artistic vision (Arte Público), audience dependent (Fleetside Company Theatre), facilities (Elm Street Cinema), and collections (Chambers Museum of Art). Although many organizations are influenced by more than one business model driver, we have attempted to distill the drivers in these examples to simplify matters. However, since facilities decisions are so often a factor in the arts, we have created an additional profile (Street Media) that illustrates what can occur when an artistic vision organization considers taking on a facility.
We have also used this opportunity to demonstrate how to conduct financial health assessments and how to set up robust strategic business planning that includes capitalization strategies and is validated by external research. We hope that these snapshots will serve to further illuminate the ideas articulated in “Getting Beyond Breakeven.” In reviewing the mock financial information we prepared, it may be helpful to refer to the financial health indicators table on page 11.
Each profile opens with a narrative describing the organization, its mission, and its basic operational issues. We then present the organization’s income statement and balance sheet, annotated to highlight the key observations one might make in an assessment process. The next portion of the profiles mirrors what could be called the “current state analysis” of the basic strategic issues and assessment of the current financial position. To stay consistent with the criteria listed in “Getting Beyond Breakeven,” we include a financial health score. The “re-analyzed balance sheet” illustrates financial assessment, building on the supplied balance sheet to delve deeper into issues like restrictions and other constraints that can mask problems. We also identify the potential categories of net assets both to segregate net assets invested in property as well as board-designated reserves. As we state in the report, financial assessment can sometimes look mysterious. We hope that the re-analyzed balance sheet “shows our work” and makes the process more transparent.
We go a step further and offer a hypothetical “recapitalized balance sheet,” which illustrates how each organization might look if it were sustainably capitalized. Highlighted numbers indicate a change, and the text of “Capitalization Goals” provides commentary. The recapitalized balance sheets are meant to be descriptive not prescriptive; the goal is to give a sense of the direction for progress rather than one right solution. Also, the recapitalized balance sheets are not meant to represent any time period or turnaround plan; rather, they suggest an alternative vision of how an organization with an active capitalization strategy might have successfully positioned itself to meet the example’s challenges.
While capital campaign is the most straightforward way to think about how an organization might garner new funds, we recognize that finding donors in the current climate is challenging. In each example, we offer some thoughts on alternative sources or strategies, such as partnerships, sale of assets, and challenge grants. A core question for all is the possibility of “getting beyond breakeven”: Can the basic operation generate enough surplus to provide adequate working capital and replenishment of capital reserves? If not, what alternative method might be feasible?
We draw on both the strategic issues and financial assessments to pose critical business planning questions the organizations need to answer in order to resolve their strategic issues, develop a sustainable business model, and build adequate capitalization. We pay attention to internal factors, such as mission alignment and organizational capacity, as well as external factors, such as audience needs and funding availability. All of these questions point toward the two basic questions we raised in the report: “Are we the right people to do this at the present time? Do we have the necessary resources to do this right?”
Finally, we end each example with an indication of the next steps each organization would need to pursue to make informed decisions and build a defensible strategic business plan. Although the space dedicated to next steps is small, the work involved is substantial and often must be phased over a period of months or years. The timeframe is extended when implementing new donor cultivation or major changes, such as new ventures or strategic re-direction.
There are a plethora of resources in the Philadelphia region to help organizations get started on planning, including:
The Arts and Business Council of Greater Philadelphia��
The Greater Philadelphia Cultural Alliance��
The Nonprofit Center at LaSalle University��
The Nonprofit Finance Fund��
The Philadelphia Cultural Management Initiative��
Relationships with helping institutions and consultants are only useful when organizations – managers and boards – are willing to have an honest conversation about strategy and capitalization. We hope that these profiles will be a way to encourage candid, effective strategic business planning.
Business Model Driver Profiles

14
Artistic Vision: Arte Público
Arte Público was founded five years ago by Max Rodriguez, a high school art teacher who leads public art projects with schools and other urban community groups. Its mission is to foster strong communities by facilitating shared experiences of collaborative creativity and by reclaiming and beautifying urban landscapes. Over the past two years, word about the quality of Max’s projects has spread, increasing demand. Max has enlisted three other artists who regularly facilitate projects on a contractor basis. Last year, Max and his colleagues led 16 projects, with 12 taking place in the summer months. A multi-year grant from the city arts council dependably arrives in the fall. The total budget is $225,500, most of which goes to pay Max, the other project facilitators, and a part-time grantwriter. There are minimal overhead expenses, since Arte Público is run out of Max’s apartment.
Project funding comes from grants and community fundraising that happens in tandem with the project to publicize the event. The mismatch between timing of expenses and income often creates serious cash flow problems. Last summer, Max ended up taking a $10,000 cash advance from a personal credit card to pay one of his facilitators after a community group could not cover the cost in a timely manner. By the time they paid, other demands ate up the cash, and Max has not managed to pay down his credit card balance.
In March, Max and his board chair, Cherie Myers, met with a local foundation interested in gang violence prevention, and learned of an opportunity to start a summer camp for at-risk youth. The funding – a $150,000 grant for three years – would be available after the start of the fiscal year in July. Cherie and Max are excited about the prospect but Max has some doubts when he thinks about the logistics. To get a program together by summer, he realizes that he would have to get some help with curriculum development, promotion, and partnerships right away, before the grant money would come through. He would also have to get liability insurance. He’s not sure if he’ll be able to manage to front these costs, and is considering giving up the opportunity.
Strategic Issues
Arte Público is a small, project-oriented organization that has managed to exist for five years with slim resources. There are two issues at hand: Should and can Arte Público take on the higher degree of fundraising necessary to put the organization on more steady financial footing? Should the organization pursue the new camp opportunity? Operating a camp would require a degree of infrastructure, advance planning, staff supervision, and attention to regulatory issues that would be new to the organization. A shift from short-term to recurring activity represents a fundamental change in direction, and will demand higher levels of capitalization and a more secure financial structure.
Scale: Growth vs. Mission��
Cash Flow and Working Capital��

15
Income Statement : Arte Público
Revenue Expenses Operating Revenue 230,000
Contributed Revenue Personnel Expense 0 Operating Expense 225,500
Individual Donations 10,000
Corporate & Foundation Gifts 70,000 Program Expense Net Operating Income 4,500
Released from Restriction 0 Program Materials 30,000
Special Events 50,000 Advertising/Ticket Sales 0 Breakeven or small surplus may be fine for
Total Contributed Revenue 130,000 Consultants/Contract Labor 187,000 this small project-based organization
Total Program Expense 217,000
Earned Revenue Other Revenue & Expense
Program Fees 100,000 Occupancy Expense New Restricted Revenue 0
Sales (net) 0 Rent 0 Interest & Dividends 0
Memberships 0 Interest Expense 0 Unrealized Gain/Loss 0
Ticket Sales 0 Utilities & Insurance 0 Releases from Restriction 0
Total Earned Revenue 100,000 Maintenance & Equipment 0 Net Other 0
Depreciation 0
Investments Revenue Total Occupancy Expense 0 Change in Net Assets 4,500
Interest 0
Endowment Spending 0 Office Expense
Total Investments Revenue 0 Supplies, Postage & Printing 3,500
Audit & Board Expense 5,000
Total Revenue 230,000 Interest & Financing Fees 0
Total Office Expense 8,500
Total Expenses 225,500
Balance Sheet: Arte Público
Assets
Cash 20,000 Looks like 10% of budget, but look at deferred revenue
Accounts Receivable 30,000
Grants Receivable 25,000
Prepaids 0
Current Assets 75,000
Long-term Grants Receivable 35,000 Time restricted grants are Temporarily Restricted
Total Assets 110,000
Liabilities & Net Assets
Accounts Payable 50,000 Very high compared to cash, A/R and budget
Accrued Expense 0
Deferred Revenue 5,000 Deposits on future jobs should be held in cash
Current Debt 10,000
Current Liabilities 65,000
Total Liabilities 65,000
Net Assets 45,000 How will this change when TRNA are reclassified?
Total Net Assets 45,000
Total Liabilities & Net Assets 110,000

16
Assessment of current capital structure
Financial Health Score: 3 (1–Strongest, 4–Weakest) Arte Público has little cash or working capital, and therefore very low flexibility. While a fragile state may be okay for Arte Público as it has been operating, it will not be sufficient to support an expanded operation with the camp. Typical measures of liquidity like current ratio appear reasonable for a small organization. However, a deeper analysis of the cash position shows that $5,000 of the $20,000 in cash is deferred revenue, for projects not yet underway. Assuming that Max follows the best practice of setting aside deferred revenue, actual available cash of $15,000 represents less than one month’s share of annual expenses (about $18,000). Looking at the re-analyzed balance sheet, we note that the $35,000 long-term grant receivable is classified as temporarily restricted because of the time-restriction. Therefore, of the $45,000 in net assets, Max actually has only $10,000 in unrestricted net assets (URNA). The small amount of URNA reflects the organization’s slim margins. Shortfalls are absorbed by a growing Accounts Payable and a personal loan, risking loss of vendors and management distraction.
Capitalization goals The recapitalized balance sheet illustrates how sustainability of current operations could be dramatically improved with relatively modest fundraising to reduce liabilities and provide more cash cushion. Raising $80,000 to bolster working capital could reduce liabilities by 60 percent and increase available cash to 3 months. Pursuing program growth would entail much higher levels of working capital and organizational infrastructure that would scale up the entire operation, which may or may not be sustainable or appropriate.
Business planning questions
In order to achieve greater stability, Max and Cherie will need to examine the organization’s capabilities – both staff and board – to undertake a higher degree of fundraising. Would Arte Público need to hire a development consultant? What is the cost-benefit analysis for taking on this expense? Another option would be to develop the fundraising capacity and prospects internally over time. Then the question would be, how long can Arte Público keep delivering a quality product in a financially vulnerable position? Or perhaps the potential camp funder would be interested in supporting a stabilization period to set the stage for the camp effort further down the road.
In order to decide on the camp opportunity, Max and Cherie will need to take the time to answer a number of questions, regarding the mission match, market need, the full cost, and the revenue generation possibilities. Will pursuit of the new opportunity compromise the core commitment to community-based art making or will it launch Arte Público into an exciting new niche that takes the organization to the next level? What competition is there in the local marketplace? Do existing programs address the full extent of need? What evidence is available that there would be an audience for the proposed camp? What will the organizational cost be of adapting to more complex programs? Is there a partnership opportunity with an existing camp program that might be a viable alternative? Assuming that program fees would not cover the full cost, would grant sources be available beyond the startup period?
Next steps Although it appears that the funder is working on a short time frame, Max and Cherie may need to go back and talk about funding for a planning phase before jumping into the camp opportunity and before committing to an expanded fundraising effort.
Two summers ago, Arte Público ran a project at a recreational daycamp. Max built a good relationship with the director, and plans to use her as a sounding board, to consider the range of issues and potential competition or collaboration that may already exist.

17
Arte Público Re-Analyzed Balance Sheet Scoring: 3 Recapitalized Balance Sheet
UnrestrictedTemporarilyRestricted
PermanentlyRestricted Total Unrestricted
TemporarilyRestricted
PermanentlyRestricted Total
Assets
Cash 20,000 20,000 60,000 60,000
Accounts Receivable 30,000 30,000 30,000 30,000
Grants Receivable 25,000 25,000 25,000 25,000
Prepaids 0 0 0 0
Current Assets 75,000 0 0 75,000 115,000 0 0 115,000
Fixed Assets (net) 0 0 0
Long-term Grants Receivable 0 35,000 35,000 35,000 35,000
Total Assets 75,000 35,000 0 110,000 115,000 35,000 0 150,000
Liabilities & Net Assets
Accounts Payable 50,000 50,000 20,000 20,000
Accrued Expense 0 0 0
Deferred Revenue 5,000 5,000 5,000 5,000
Current Debt 10,000 10,000 0 0
Current Liabilities 65,000 0 0 65,000 25,000 0 0 25,000
Long-term Debt 0 0 0 0
Total Liabilities 65,000 0 0 65,000 25,000 0 0 25,000
Unrestricted Net Assets 10,000 10,000 90,000 90,000
Unrestricted Net Assets in Property 0 0
Board-Restricted Net Assets 0 0
Board-Restricted Replacement Reserves 0 0
Temporarily Restricted Net Assets 35,000 35,000 35,000 35,000
Permanently Restricted Net Assets 0 0
Total Net Assets 10,000 35,000 0 45,000 90,000 35,000 0 125,000
Total Liabilities & Net Assets 75,000 35,000 0 110,000 115,000 35,000 0 150,000
On the left, the re-analyzed balance sheet makes transparent the restricted funds and board-designated reserves. This format allows a more nuanced understanding of the current capitalization as articulated in the assessment on page 16. The recapitalized balance sheet, on the right, illustrates where improvements to the capital structure would be visible on the balance sheet, highlighted by shaded boxes. Commentary is provided in “Capitalization goals” on page 16.

18
Audience Dependent: Fleetside Company Theatre
Fleetside Company Theatre was founded 14 years ago as a professional company in a small metropolitan area. Its mission is to foster a vibrant local theater community by presenting high quality, thought-provoking productions with local theater artists for local theater enthusiasts. With an annual budget of $1.2 million, their seasons feature a mix of critically acclaimed contemporary plays and well-loved classics, including one or two musicals every year, produced in a 240-seat rented space. They have a loyal subscriber base, which translates into a substantial amount of deferred revenue. In addition, Fleetside has a small education program, which sends Company members into classrooms to lead workshops before school groups attend a production. The Theatre is managed by a six member staff, which includes an artistic director, managing director, publicist, production manager, office manager, and production assistant. Actors and production crews are paid as contractors.
Five years ago, Fleetside had unexpectedly lackluster box office results. Hoping to salvage the season, Fleetside invested 50 percent more than planned in the last show, and moved it into a 500-seat theater across town to accommodate a pit orchestra and larger cast. Unfortunately, Fleetside was unable to attract a larger audience with the show, and they ended the year with a major deficit, eating through their miniscule reserves and ending up with negative net assets. The next year the managing director and the Theatre chose to part ways, and the board hired Vandana Shasti, a transplant from a successful regional theater. Vandana and the artistic director, Scott Cantor, spent a good deal of time speaking with their audience to understand their needs, and discovered that Fleetside’s biggest differentiator was the intimate experience. Luckily for Vandana and Scott, acting on this insight was completely consistent with their efforts toward sustainability: Fleetside could favor smaller shows with fewer actors and less elaborate sets.
Vandana also worked hard to cultivate Fleetside’s small donor base, and turned an underperforming annual fund into one that they could rely on for 10 percent of their operating budget. With she and Scott doing most of the fundraising work, their development costs were quite low. With lower cost shows that were spot on their audience’s preferences and increased fundraising capacity, Fleetside was able to balance the budget in the following year and pay off their debts the year after that. They began posting surpluses of $50,000 to $100,000 in year 3, and currently have a safe cushion of working capital.
Vandana and Scott feel proud of how they have turned around Fleetside, and the board is thrilled with their success. Tony Melton, a long-time supporter who joined the board in the spring, is excited about helping Fleetside go to the next level. He decided to earmark his $50,000 annual gift to seed a permanently restricted endowment to provide an innovation fund. His hope was that Fleetside would be able to give Scott the opportunity to stretch his creative talents, either through presenting larger scale productions or by commissioning new plays periodically. He also had in mind that a capital campaign for the innovation fund would test the waters for a larger campaign down the road for a facility.
While Scott is pleased at the idea of an innovation fund, he and Vandana are unsure of how they can use the small amount that the fund would generate at its current value. While they could have enough to pay a commission to a relatively unknown playwright, they would have nothing to contribute toward production costs and there would be no reserve against the potential failure of an untried show.
Strategic Issues
Scott and Vandana are rightly proud of their achievement – they have truly demonstrated “getting beyond breakeven.” While Tony is certainly well-intentioned, the prospect of a capital campaign – for an innovation fund or a facility – is untested. Is there a critical mass of others out there willing to make similar contributions, or is Tony one of a kind? Could Fleetside’s management carry out a campaign, or would they have to bring in higher cost help? Would the fundraiser be able to “earn her keep”? Also, is Tony’s choice of restricting his gift in an endowment the best financial vehicle for a risk capital fund?
Risk Capital��
Organizational Capacity��

19
Balance Sheet: Fleetside Company Theatre
Assets
Cash 628,651 Looks like 6 months’ cash, but check deferred revenue
Prepaids 78,500
Current Assets 707,151
Fixed Assets (net) 23,652 Even without a building, there are capital investments
Total Assets 730,803
Liabilities & Net Assets
Accounts Payable 36,479
Accrued Expense 8,955
Deferred Revenue 359,775 Next season’s subscriptions have not yet been earned
Current Debt 26,844 Does this grow & shrink, or is it structural?
Current Liabilities 432,053
Total Liabilities 432,053
Unrestricted Net Assets 248,750 How much is tied up in fixed assets?
Permanently Restricted Net Assets 50,000 With no pledges receivable, this must also be in cash
Total Net Assets 298,750
Total Liabilities & Net Assets 730,803
Income Statement: Fleetside Company Theatre
Revenue Expenses Operating Revenue 1,271,777
Contributed Revenue Personnel Expense 531,256 Operating Expense 1,150,133
Individual Donations 121,493
Corporate & Foundation Gifts 22,400 Program Expense Net Operating Income 121,644
Released from Restriction 0 Program Materials 211,110
Special Events 41,563 Advertising/Ticket Sales 84,299 Healthy operating surplus allows reserves to build
Total Contributed Revenue 185,456 Consultants/Contract Labor 93,296
Total Program Expense 388,705 Other Revenue & Expense 0
Earned Revenue New Restricted Revenue 50,000
Program Fees 49,635 Occupancy Expense Interest & Dividends 0
Sales (net) 16,657 Rent 127,277 Unrealized Gain/Loss 0
Memberships 0 Interest Expense 0 Releases from Restriction 0
Ticket Sales 1,008,347 Utilities & Insurance 27,847 Net Other 50,000
Total Earned Revenue 1,074,639 Maintenance & Equipment 10,132
Depreciation 11,200 Change in Net Assets 171,644
Investments Revenue Total Occupancy Expense 176,456
Interest 11,682
Endowment Spending 0 Office Expense
Total Investments Revenue 11,682 Supplies, Postage & Printing 45,966
Audit & Board Expense 7,707
Total Revenue 1,271,777 Interest & Financing Fees 43
Total Office Expense 53,716
Total Expenses 1,150,133
20
Assessment of current capital structure
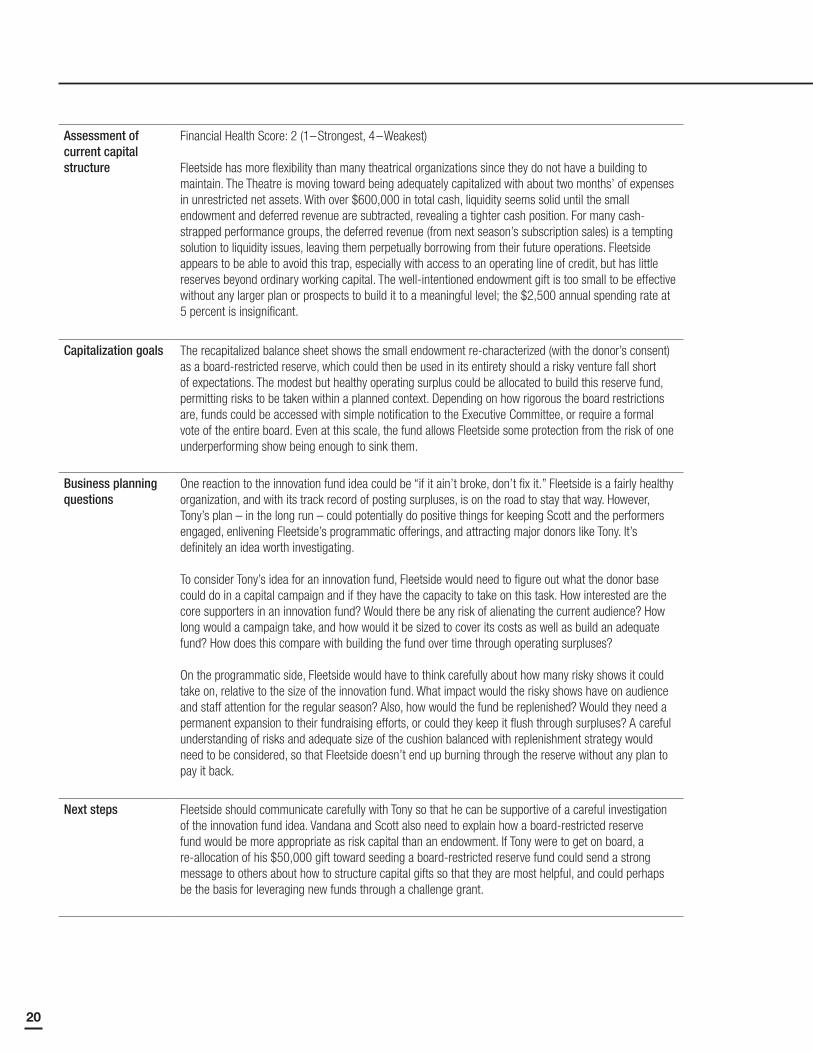
Financial Health Score: 2 (1–Strongest, 4–Weakest)
Fleetside has more flexibility than many theatrical organizations since they do not have a building to maintain. The Theatre is moving toward being adequately capitalized with about two months’ of expenses in unrestricted net assets. With over $600,000 in total cash, liquidity seems solid until the small endowment and deferred revenue are subtracted, revealing a tighter cash position. For many cash-strapped performance groups, the deferred revenue (from next season’s subscription sales) is a tempting solution to liquidity issues, leaving them perpetually borrowing from their future operations. Fleetside appears to be able to avoid this trap, especially with access to an operating line of credit, but has little reserves beyond ordinary working capital. The well-intentioned endowment gift is too small to be effective without any larger plan or prospects to build it to a meaningful level; the $2,500 annual spending rate at 5 percent is insignificant.
Capitalization goals The recapitalized balance sheet shows the small endowment re-characterized (with the donor’s consent) as a board-restricted reserve, which could then be used in its entirety should a risky venture fall short of expectations. The modest but healthy operating surplus could be allocated to build this reserve fund, permitting risks to be taken within a planned context. Depending on how rigorous the board restrictions are, funds could be accessed with simple notification to the Executive Committee, or require a formal vote of the entire board. Even at this scale, the fund allows Fleetside some protection from the risk of one underperforming show being enough to sink them.
Business planning questions
One reaction to the innovation fund idea could be “if it ain’t broke, don’t fix it.” Fleetside is a fairly healthy organization, and with its track record of posting surpluses, is on the road to stay that way. However, Tony’s plan – in the long run – could potentially do positive things for keeping Scott and the performers engaged, enlivening Fleetside’s programmatic offerings, and attracting major donors like Tony. It’s definitely an idea worth investigating.
To consider Tony’s idea for an innovation fund, Fleetside would need to figure out what the donor base could do in a capital campaign and if they have the capacity to take on this task. How interested are the core supporters in an innovation fund? Would there be any risk of alienating the current audience? How long would a campaign take, and how would it be sized to cover its costs as well as build an adequate fund? How does this compare with building the fund over time through operating surpluses?
On the programmatic side, Fleetside would have to think carefully about how many risky shows it could take on, relative to the size of the innovation fund. What impact would the risky shows have on audience and staff attention for the regular season? Also, how would the fund be replenished? Would they need a permanent expansion to their fundraising efforts, or could they keep it flush through surpluses? A careful understanding of risks and adequate size of the cushion balanced with replenishment strategy would need to be considered, so that Fleetside doesn’t end up burning through the reserve without any plan to pay it back.
Next steps Fleetside should communicate carefully with Tony so that he can be supportive of a careful investigation of the innovation fund idea. Vandana and Scott also need to explain how a board-restricted reserve fund would be more appropriate as risk capital than an endowment. If Tony were to get on board, a re-allocation of his $50,000 gift toward seeding a board-restricted reserve fund could send a strong message to others about how to structure capital gifts so that they are most helpful, and could perhaps be the basis for leveraging new funds through a challenge grant.

21
Fleetside Company Theatre Re-Analyzed Balance Sheet Scoring: 2 Recapitalized Balance Sheet
UnrestrictedTemporarily Restricted
Permanently Restricted Total Unrestricted
Temporarily Restricted
Permanently Restricted Total
Assets
Cash 578,651 50,000 628,651 628,651 628,651
Accounts Receivable 0 0
Grants Receivable 0 0
Prepaids 78,500 78,500 78,500 78,500
Current Assets 657,151 0 50,000 707,151 707,151 0 0 707,151
Fixed Assets (net) 23,652 23,652 23,652 23,652
Long-term Grants Receivable 0 0
Total Assets 680,803 0 50,000 730,803 730,803 0 0 730,803
Liabilities & Net Assets
Accounts Payable 36,479 36,479 36,479 36,479
Accrued Expense 8,955 8,955 8,955 8,955
Deferred Revenue 359,775 359,775 359,775 359,775
Current Debt 26,844 26,844 26,844 26,844
Current Liabilities 432,053 0 0 432,053 432,053 0 0 432,053
Long-term Debt 0 0
Total Liabilities 432,053 0 0 432,053 432,053 0 0 432,053
Unrestricted Net Assets 225,098 225,098 225,098 225,098
Unrestricted Net Assets in Property 23,652 23,652 23,652 23,652
Board-Restricted Net Assets 0 50,000 50,000
Board-Restricted Replacement Reserves 0 0
Temporarily Restricted Net Assets 0 0
Permanently Restricted Net Assets 50,000 50,000 0
Total Net Assets 248,750 0 50,000 298,750 298,750 0 0 298,750
Total Liabilities & Net Assets 680,803 0 50,000 730,803 730,803 0 0 730,803
On the left, the re-analyzed balance sheet makes transparent the restricted funds and board-designated reserves. This format allows a more nuanced understanding of the current capitalization as articulated in the assessment on page 20. The recapitalized balance sheet, on the right, illustrates where improvements to the capital structure would be visible on the balance sheet, highlighted by shaded boxes. Commentary is provided in “Capitalization goals” on page 20.

22
Facilities: Elm Street Cinema
The Friends of Elm Street Cinema saved the old Elm Street Grand Theater from demolition just over ten years ago with the mission to preserve for the local community the unique shared experience of watching high quality films in a grand movie house. Currently, the Elm presents a regular slate of classic and art films, related educational programming, and an annual film festival, all supported by a budget of $1.6 million. The organization is lead by executive director, Ron Fisher, and board chair, Mary Johnson.
The Friends were able to raise a considerable sum to purchase and renovate the building, plus subsidize ongoing operations, from an initial capital campaign. The resulting endowment stands at $1.3 million with 60 percent earmarked for the film festival and 40 percent dedicated to support the building. The original intent was a more even split, but when the renovation went over budget, about $200,000 of the projected endowment was diverted to cover part of the overrun, with a mortgage of $500,000 taken out to pay the rest. The Friends have kept up with debt payments, and currently, the principal balance is $240,000. The operation is able to generate enough cash so that the Friends can fund their full debt service of about $32,000 per year. Keeping up with the debt, however, has prevented them from building their replacement reserve for capital needs by funding depreciation.
The original strategic plan projected healthy revenues from the regular film screenings and the film festival, to cross-subsidize the education programming, along with some grant support. While the film festival brings in substantial revenues, the film screenings do not perform as well as expected, particularly during weekdays. However, there is an enthusiastic following of film students and faculty from neighboring Haven College. The Haven Film Studies Department sometimes rents out the Cinema for special screenings of their students’ work.
The Friends’ cash position this year was particularly weak. Two years ago, the heating system – which had not been replaced at the time of the renovation – gave out. Unable to access additional debt, Mary led an emergency three-year membership appeal, which yielded barely enough cash to pay for the new system. However, it has left them without access to a substantial portion of their membership income stream for the past two years, and cash flow has been tough. Ron and Mary are exhausted from keeping up with their cash needs for the past two years.
Ron has been hearing his colleagues at other regional theaters talking about how new digital projection equipment could enhance their ability to screen new films by independent filmmakers who shoot direct to digital. Using the digital equipment as a hook, the Friends’ board decided to start up a new capital campaign as a last ditch effort to resolve their financial challenges, despite Ron’s misgivings about their ability to keep up with the substantial ongoing maintenance and replacement costs.
Strategic Issues
Disappointing attendance of the ongoing film series is a major concern. Without addressing it, the Friends will be hard pressed to turn around their structural deficit. The Friends have been too busy with short-term cash flow issues to understand the underlying issues well.
Like many undercapitalized organizations, the Elm has gone into a capital campaign from a position of weakness rather than strength. Given its struggles with viability and the weakened donor base, it is hard to imagine how the new campaign will be a success. It’s not clear if they’ve done the cost-benefit analysis of the digital equipment to make sure that this should be the main focus of the campaign. Staff and board burnout is also a major concern.
Market Demand for Core Mission��
Structural Deficit��
Deferred Maintenance��
Internal Capacity��

23
Income Statement: Elm Street Cinema
Revenue Expenses Operating Revenue 1,619,342
Contributed Revenue Personnel Expense 1,004,244 Operating Expense 1,631,280
Individual Donations 339,345
Corporate & Foundation Gifts 112,000 Program Expense Net Operating Income (11,938)
Released from Restriction 25,000 Program Materials 287,495
Special Events 148,960 Advertising/Ticket Sales 15,942 Not funding depreciation, but does cover principal payments of debt Total Contributed Revenue 625,305 Consultants/Contract Labor 24,500
Total Program Expense 327,937
Earned Revenue Other Revenue & Expense
Program Fees 68,750 Occupancy Expense New Restricted Revenue 37,500
Sales (net) 74,852 Rent 0 Interest & Dividends 43,856
Memberships 210,000 Interest Expense 16,800 Unrealized Gain/Loss 38,728
Ticket Sales 573,000 Utilities & Insurance 146,557 Releases from Restriction (91,292)
Total Earned Revenue 926,602 Maintenance & Equipment 78,109 Net Other 28,792
Depreciation 28,570
Investments Revenue Total Occupancy Expense 270,036 Change in Net Assets 16,854
Interest 1,143
Endowment Spending 66,292 Office Expense The bottom line is not the most revealing number Total Investments Revenue 67,435 Supplies, Postage & Printing 15,230
Audit & Board Expenses 13,257
Total Revenue 1,619,342 Interest & Financing Fees 576 Note: Other Expense-Releases includes Endowment Spending Total Office Expense 29,063
Total Expenses 1,631,280
Balance Sheet: Elm Street Cinema
Assets
Cash 1,449,817 Much of this is TRNA, PRNA & deferred revenue
Accounts Receivable 23,675
Grants Receivable 25,000
Prepaids 5,488
Current Assets 1,503,980
Fixed Assets (net) 743,365
Total Assets 2,247,345
Liabilities & Net Assets
Accounts Payable 37,886
Accrued Expense 15,722
Deferred Revenue 86,250 Seems high – what is character of this liability?
Current Debt 15,100
Current Liabilities 154,958
Long-term Debt 226,000 How much pressure on budget from debt service?
Total Liabilities 380,958
Unrestricted Net Assets 540,547 How much is tied up in fixed assets?
Temporarily Restricted Net Assets 325,840
Permanently Restricted Net Assets 1,000,000
Total Net Assets 1,866,387
Total Liabilities & Net Assets 2,247,345

24
Assessment of current capital structure
Financial Health Score: 3 (1–Strongest, 4–Weakest)
At first glance, cash levels close to their annual operating budget look great, but a closer examination reveals that almost all is restricted or deferred revenue. Free operating cash is barely more than one month’s supply. Moreover, the unrestricted net assets of over $540,000 are substantially invested in fixed assets – $743,000 less debt of $241,000 – leaving only $38,000 available to support operations. The lack of a capital replacement reserve puts the Friends at risk of another emergency at any time.
Capitalization goals The recapitalized balance sheet projects the impact of a successful capital campaign to finish the job of the original campaign and purchase the digital projection equipment. A goal of $1.5 million would double endowment, fund equipment purchase, seed the capital replacement reserves, and improve working capital. In addition to tapping their core supporters, the campaign should also focus on potential historic preservation funding that could be directed toward the heating system. To raise new revenue, a partnership could be established with the local college to serve as a screening room for the film school during the week, when the theater is underutilized. The fees would allow depreciation to be funded to continue to build replacement reserves.
Business planning questions
The Friends need to understand if their inability to meet their original projections was due to errors in their original assumptions, poor performance, or a change in conditions. Can a shift in program mix, increased marketing, or some other change to their operation fix it? Is it an environmental shift that calls for a completely new strategy? Benchmarking research for similar venues in college towns could help to understand the situation better, as could a study of changes in local demographics and the competitive environment in recent years.
Ron and Mary need to ensure that the campaign will be able to raise enough endowment or reserves to manage the ongoing maintenance and replacement burden of the digital projection equipment, on top of the acquisition cost and the boost to capitalization necessary to fill the hole from the previous campaign. If they can’t achieve this, they will be left in the same boat, but with raised expectations and higher maintenance demands. Have they correctly modeled these costs to determine their campaign targets? Is there enough support in the marketplace to meet these projections? Can the current staff and board successfully conduct the campaign or will they need support? How much will this support cost? In the long term, is it truly imperative for their mission that they have access to this equipment now?
Next steps The Friends need to determine if their core operation can generate adequate revenues to capitalize the organization. The structural deficit needs to be resolved. If it can’t, the Friends need to consider other options, such as partnership or even merger, so that it can maintain its original mission of saving the building. Before pursuing budget-relieving partnership opportunities, however, the Friends should test the mission impact of these activities and understand the full costs, potential benefits, and risks. With a plan for long-term sustainability in hand, the Friends will find an easier time of it to make the capital campaign a success.

25
Elm Street Cinema Re-Analyzed Balance Sheet Scoring: 3 Recapitalized Balance Sheet
UnrestrictedTemporarily Restricted
Permanently Restricted Total Unrestricted
Temporarily Restricted
Permanently Restricted Total
Assets
Cash 148,977 300,840 1,000,000 1,449,817 358,944 300,840 2,000,000 2,659,784
Accounts Receivable 23,675 23,675 23,675 23,675
Grants Receivable 25,000 25,000 25,000 25,000
Prepaids 5,488 5,488 5,488 5,488
Current Assets 178,140 325,840 1,000,000 1,503,980 388,107 325,840 2,000,000 2,713,947
Fixed Assets (net) 743,365 743,365 1,223,365 1,223,365
Long-term Grants Receivable 0 0 0 0
Total Assets 921,505 325,840 1,000,000 2,247,345 1,611,472 325,840 2,000,000 3,937,312
Liabilities & Net Assets
Accounts Payable 37,886 37,886 37,886 37,886
Accrued Expense 15,722 15,722 15,722 15,722
Deferred Revenue 86,250 86,250 6,250 6,250
Current Debt 15,100 15,100 15,100 15,100
Current Liabilities 154,958 0 0 154,958 74,958 0 0 74,958
Long-term Debt 226,000 226,000 226,000 226,000
Total Liabilities 380,958 0 0 380,958 300,958 0 0 300,958
Unrestricted Net Assets 38,282 38,282 257,299 257,299
Unrestricted Net Assets in Property 502,265 502,265 982,265 982,265
Board-Restricted Net Assets 0 0 0 0
Board-Restricted Replacement Reserves 0 0 70,950 70,950
Temporarily Restricted Net Assets 0 325,840 0 325,840 0 325,840 0 325,840
Permanently Restricted Net Assets 0 0 1,000,000 1,000,000 0 0 2,000,000 2,000,000
Total Net Assets 540,547 325,840 1,000,000 1,866,387 1,310,514 325,840 2,000,000 3,636,354
Total Liabilities & Net Assets 921,505 325,840 1,000,000 2,247,345 1,611,472 325,840 2,000,000 3,937,312
On the left, the re-analyzed balance sheet makes transparent the restricted funds and board-designated reserves. This format allows a more nuanced understanding of the current capitalization as articulated in the assessment on page 24. The recapitalized balance sheet, on the right, illustrates where improvements to the capital structure would be visible on the balance sheet, highlighted by shaded boxes. Commentary is provided in “Capitalization goals” on page 24.

26
Collections: Chambers Museum of Art
The Chambers Museum of Art is a small art museum located in a suburb of a metropolitan area. Its mission is to foster a love of art and the natural world by collecting, preserving, exhibiting and interpreting works of art of the highest quality. CMA will celebrate its 100th anniversary in eight years. CMA is best known for its exquisite collection of American and European portrait miniatures; the Hudson collection of bird paintings, prints, and drawings; and a growing collection of bird and nature photographs. The collections are housed and exhibited in the former estate of the Chambers family, Millbrook, which has been owned by CMA since 1924. The Museum has a solid base of support from the local community, but director Ann Morris hopes to use the centennial to jumpstart its relationship with younger audiences and with a new population of Latino immigrants that has been growing for the past decade.
The Museum’s budget of $4.7 million supports a staff of about 40. The Museum presents two temporary exhibitions each year to supplement the six permanent galleries. The Museum has a well-regarded education program that serves school groups and presents lectures and tours for the general public. The new education director, Dahlia Cruz, has dynamic ideas about partnerships with schools and youth programs to engage more young people and people of color, but has a very limited budget for new program development.
The Museum has an endowment of $11.3 million, with 70 percent earmarked for curatorial and acquisition activities and 30 percent for building maintenance. This year, $305,000 was allocated for curatorial support and $130,000 was available toward occupancy expense over three times that amount. While the curatorial endowment has grown over the years through new gifts, the Museum has not focused on building capital replacement reserves, either through new capital gifts or by funding depreciation. Millbrook needs significant investment to support modern HVAC and security systems that are required to protect the collections. The staff has also noted periodic leaks in the attic, so it’s clear that the building envelope needs some attention as well.
Dennis Martin, a new trustee, has become a strong advocate for addressing the substantial capital needs of Millbrook. An
architect by profession, Dennis is appalled by the extent of deferred maintenance, and is advocating that the centennial campaign focus on the building needs as well as developing new audiences. A regional foundation offers matching grants for endowments, and he wants to leverage that opportunity to set the stage for the next hundred years.
Strategic Issues
Dennis and Ann have zeroed in on CMA’s two main strategic concerns: audience development and facilities. For collecting institutions, facility maintenance and replacement is generally a core activity since it is essential to house collections to steward them in perpetuity. For CMA, there is a double responsibility since the building itself has historic value. Audience development is also a core activity for CMA, since its mission directs them to “foster a love of art and the natural world.” CMA needs to balance the potential to increase admissions and expand to new audiences against costs and impact on mission. Efforts to reach out to Latino audiences are potentially strengthened by having a Latino person directing the education department. However, these efforts must be well integrated or risk appearing superficial.
Audience Engagement vs. Collections ��
and Facilities Stewardship
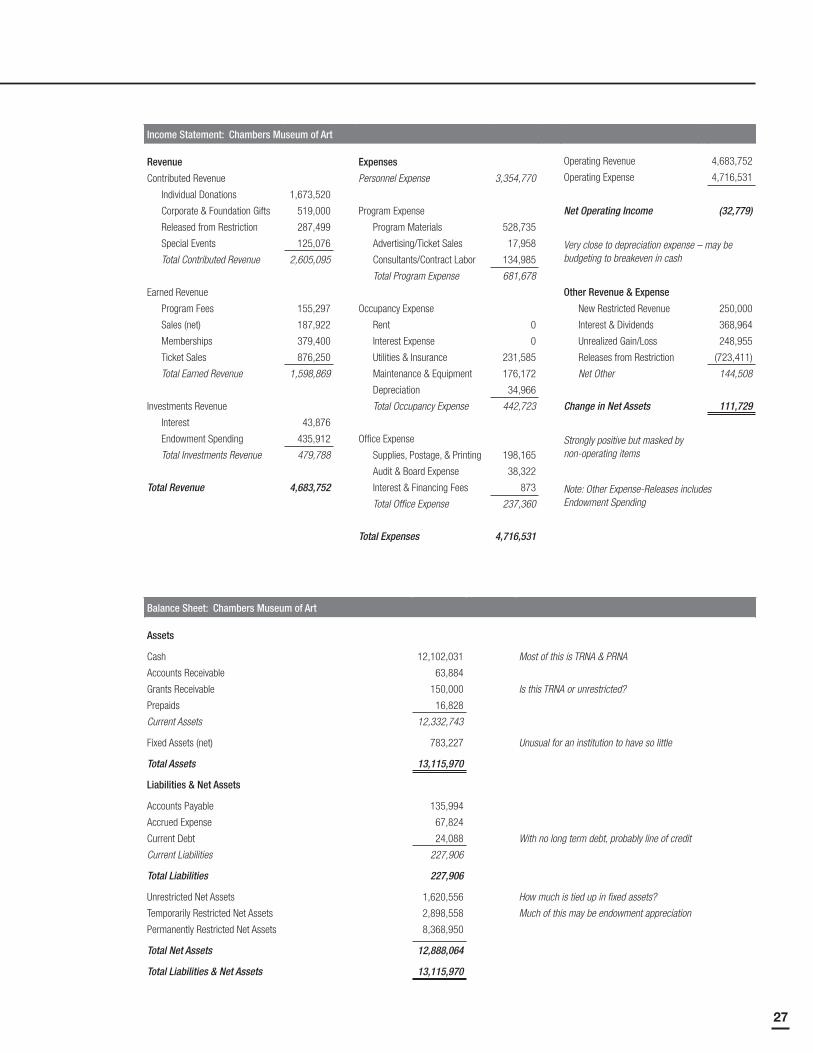
27
Income Statement: Chambers Museum of Art
Revenue Expenses Operating Revenue 4,683,752
Contributed Revenue Personnel Expense 3,354,770 Operating Expense 4,716,531
Individual Donations 1,673,520
Corporate & Foundation Gifts 519,000 Program Expense Net Operating Income (32,779)
Released from Restriction 287,499 Program Materials 528,735
Special Events 125,076 Advertising/Ticket Sales 17,958 Very close to depreciation expense – may be budgeting to breakeven in cash Total Contributed Revenue 2,605,095 Consultants/Contract Labor 134,985
Total Program Expense 681,678
Earned Revenue Other Revenue & Expense
Program Fees 155,297 Occupancy Expense New Restricted Revenue 250,000
Sales (net) 187,922 Rent 0 Interest & Dividends 368,964
Memberships 379,400 Interest Expense 0 Unrealized Gain/Loss 248,955
Ticket Sales 876,250 Utilities & Insurance 231,585 Releases from Restriction (723,411)
Total Earned Revenue 1,598,869 Maintenance & Equipment 176,172 Net Other 144,508
Depreciation 34,966
Investments Revenue Total Occupancy Expense 442,723 Change in Net Assets 111,729
Interest 43,876
Endowment Spending 435,912 Office Expense Strongly positive but masked by non-operating items Total Investments Revenue 479,788 Supplies, Postage, & Printing 198,165
Audit & Board Expense 38,322
Total Revenue 4,683,752 Interest & Financing Fees 873 Note: Other Expense-Releases includes Endowment Spending Total Office Expense 237,360
Total Expenses 4,716,531
Balance Sheet: Chambers Museum of Art
Assets
Cash 12,102,031 Most of this is TRNA & PRNA
Accounts Receivable 63,884
Grants Receivable 150,000 Is this TRNA or unrestricted?
Prepaids 16,828
Current Assets 12,332,743
Fixed Assets (net) 783,227 Unusual for an institution to have so little
Total Assets 13,115,970
Liabilities & Net Assets
Accounts Payable 135,994
Accrued Expense 67,824
Current Debt 24,088 With no long term debt, probably line of credit
Current Liabilities 227,906
Total Liabilities 227,906
Unrestricted Net Assets 1,620,556 How much is tied up in fixed assets?
Temporarily Restricted Net Assets 2,898,558 Much of this may be endowment appreciation
Permanently Restricted Net Assets 8,368,950
Total Net Assets 12,888,064
Total Liabilities & Net Assets 13,115,970

28
Assessment of current capital structure
Financial Health Score: 2 (1–Strongest, 4–Weakest)
In addition to its $11 million endowment, CMA has $1.6 million in unrestricted net assets. While about half of that amount is tied up in un-depreciated fixed assets, there is still sufficient working capital for the Museum’s operations, supplemented by a line of credit. With almost a million dollars in unrestricted cash, the current ratio is more than double the level considered healthy. Still, the stewardship of a venerable institution is capital-intensive, and the net fixed assets under $1 million hint that deferred maintenance is a strong possibility, and the operating deficit (while not large) correlates so closely to depreciation expense that it suggests a deliberate budget decision. These risk factors prevent CMA from being scored at the strongest level, in spite of its substantial resources.
Capitalization goals The recapitalized balance sheet projects the impact of a board decision to focus the 100th anniversary capital campaign on both the building and development of new audiences. Raising $11.5 million would allow $3 million to be spent immediately on deferred maintenance and capital needs, $7 million added to rebalance the endowment to better support the facility, and $1.5 million split between a board-restricted capital replacement reserve and a board-restricted risk fund for new program initiatives and other operational needs.
Business planning questions
Strategic planning efforts should strive to understand if CMA is well-positioned to reach out to new audiences. How much program development and marketing investment would be required? How can programs be positioned and designed to attract Latino and youth audiences? Are there other local programs meeting this demand already? Will this effort potentially distract attention from or place at financial risk the institution’s responsibility to care for its collections? In order to present an integrated program, how can the curatorial and other departments at CMA support Dahlia’s efforts?
CMA should also look at revenue generation possibilities, both in audience development and for the capital campaign. What are the demographic trends in the community, and among CMA’s audiences? Is the expectation for new revenue in line with the potential of these audiences? Have other cultural institutions attempted to target this same audience, and with what success? Have such efforts enhanced or reduced the possibilities for CMA? Are the institution’s supporters willing and able to fund both its capital needs and the effort to develop new audiences? How much additional admission revenue could CMA project that the audience development initiative would generate?
In addition to raising capital through donations, could CMA consider selling a portion of the Millbrook estate that does not contribute to the Museum’s operations, perhaps a discrete parcel of land? This investigation would require thinking about the parcel’s value to CMA – is it mission-based value or asset based? If it’s the latter, CMA could consider selling.
Next steps CMA has eight years before the centennial, which affords time to conduct strategic planning, pilot some of the audience outreach initiatives, and start the quiet phase of the campaign. Given the potential political fallout of selling a portion of the estate, the planning time also should encompass a community process to smooth the way for a sale, if the Museum finds that it is a viable plan.

29
Chambers Museum of Art Re-Analyzed Balance Sheet Scoring: 2 Recapitalized Balance Sheet
UnrestrictedTemporarily Restricted
Permanently Restricted Total Unrestricted
Temporarily Restricted
Permanently Restricted Total
Assets
Cash 984,523 2,748,558 8,368,950 12,102,031 2,484,523 2,748,558 15,368,950 20,602,031
Accounts Receivable 63,884 63,884 63,884 63,884
Grants Receivable 150,000 150,000 150,000 150,000
Prepaids 16,828 16,828 16,828 16,828
Current Assets 1,065,235 2,898,558 8,368,950 12,332,743 2,565,235 2,898,558 15,368,950 20,832,743
Fixed Assets (net) 783,227 783,227 3,783,227 3,783,227
Long-term Grants Receivable 0 0
Total Assets 1,848,462 2,898,558 8,368,950 13,115,970 6,348,462 2,898,558 15,368,950 24,615,970
Liabilities & Net Assets
Accounts Payable 135,994 135,994 135,994 135,994
Accrued Expense 67,824 67,824 67,824 67,824
Deferred Revenue 0 0
Current Debt 24,088 24,088 24,088 24,088
Current Liabilities 227,906 0 0 227,906 227,906 0 0 227,906
Long-term Debt 0 0
Total Liabilities 227,906 0 0 227,906 227,906 0 0 227,906
Unrestricted Net Assets 837,329 837,329 837,329 837,329
Unrestricted Net Assets in Property 783,227 783,227 3,783,227 3,783,227
Board-Restricted Net Assets 0 750,000 750,000
Board-Restricted Replacement Reserves 0 750,000 750,000
Temporarily Restricted Net Assets 2,898,558 2,898,558 2,898,558 2,898,558
Permanently Restricted Net Assets 8,368,950 8,368,950 15,368,950 15,368,950
Total Net Assets 1,620,556 2,898,558 8,368,950 12,888,064 6,120,556 2,898,558 15,368,950 24,388,064
Total Liabilities & Net Assets 1,848,462 2,898,558 8,368,950 13,115,970 6,348,462 2,898,558 15,368,950 24,615,970
On the left, the re-analyzed balance sheet makes transparent the restricted funds and board-designated reserves. This format allows a more nuanced understanding of the current capitalization as articulated in the assessment on page 28. The recapitalized balance sheet, on the right, illustrates where improvements to the capital structure would be visible on the balance sheet, highlighted by shaded boxes. Commentary is provided in “Capitalization goals” on page 28.
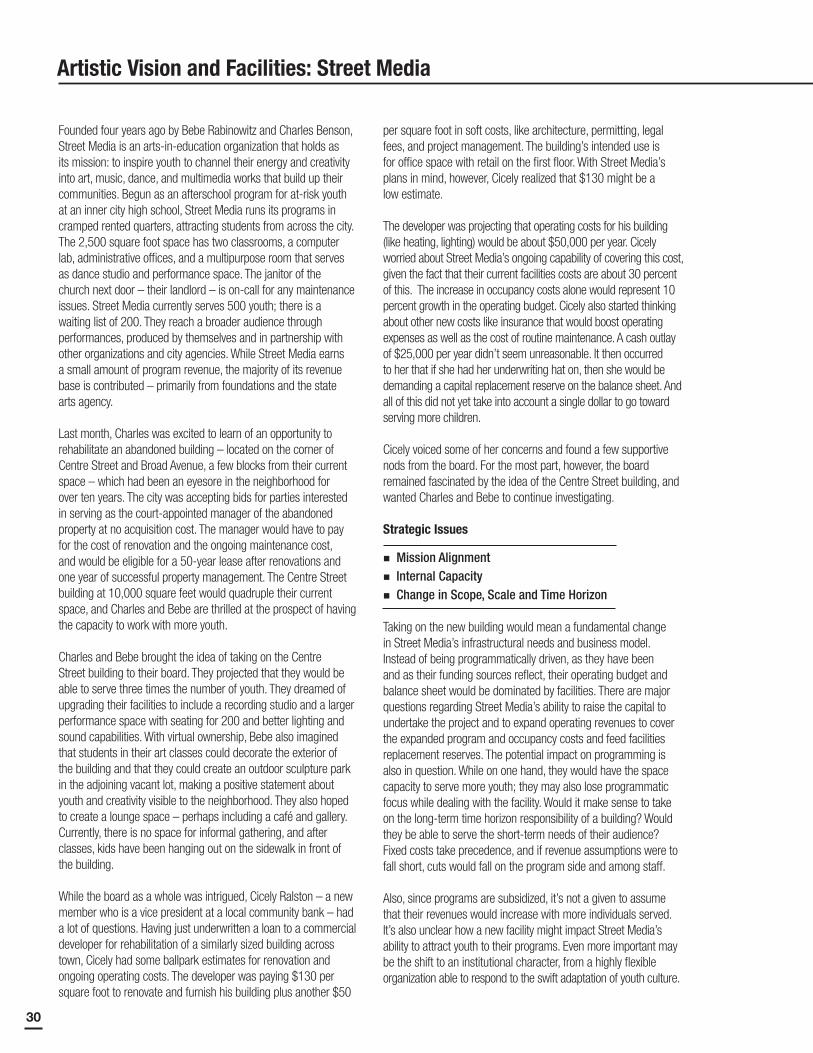
30
Artistic Vision and Facilities: Street Media
Founded four years ago by Bebe Rabinowitz and Charles Benson, Street Media is an arts-in-education organization that holds as its mission: to inspire youth to channel their energy and creativity into art, music, dance, and multimedia works that build up their communities. Begun as an afterschool program for at-risk youth at an inner city high school, Street Media runs its programs in cramped rented quarters, attracting students from across the city. The 2,500 square foot space has two classrooms, a computer lab, administrative offices, and a multipurpose room that serves as dance studio and performance space. The janitor of the church next door – their landlord – is on-call for any maintenance issues. Street Media currently serves 500 youth; there is a waiting list of 200. They reach a broader audience through performances, produced by themselves and in partnership with other organizations and city agencies. While Street Media earns a small amount of program revenue, the majority of its revenue base is contributed – primarily from foundations and the state arts agency.
Last month, Charles was excited to learn of an opportunity to rehabilitate an abandoned building – located on the corner of Centre Street and Broad Avenue, a few blocks from their current space – which had been an eyesore in the neighborhood for over ten years. The city was accepting bids for parties interested in serving as the court-appointed manager of the abandoned property at no acquisition cost. The manager would have to pay for the cost of renovation and the ongoing maintenance cost, and would be eligible for a 50-year lease after renovations and one year of successful property management. The Centre Street building at 10,000 square feet would quadruple their current space, and Charles and Bebe are thrilled at the prospect of having the capacity to work with more youth.
Charles and Bebe brought the idea of taking on the Centre Street building to their board. They projected that they would be able to serve three times the number of youth. They dreamed of upgrading their facilities to include a recording studio and a larger performance space with seating for 200 and better lighting and sound capabilities. With virtual ownership, Bebe also imagined that students in their art classes could decorate the exterior of the building and that they could create an outdoor sculpture park in the adjoining vacant lot, making a positive statement about youth and creativity visible to the neighborhood. They also hoped to create a lounge space – perhaps including a café and gallery. Currently, there is no space for informal gathering, and after classes, kids have been hanging out on the sidewalk in front of the building.
While the board as a whole was intrigued, Cicely Ralston – a new member who is a vice president at a local community bank – had a lot of questions. Having just underwritten a loan to a commercial developer for rehabilitation of a similarly sized building across town, Cicely had some ballpark estimates for renovation and ongoing operating costs. The developer was paying $130 per square foot to renovate and furnish his building plus another $50
per square foot in soft costs, like architecture, permitting, legal fees, and project management. The building’s intended use is for office space with retail on the first floor. With Street Media’s plans in mind, however, Cicely realized that $130 might be a low estimate.
The developer was projecting that operating costs for his building (like heating, lighting) would be about $50,000 per year. Cicely worried about Street Media’s ongoing capability of covering this cost, given the fact that their current facilities costs are about 30 percent of this. The increase in occupancy costs alone would represent 10 percent growth in the operating budget. Cicely also started thinking about other new costs like insurance that would boost operating expenses as well as the cost of routine maintenance. A cash outlay of $25,000 per year didn’t seem unreasonable. It then occurred to her that if she had her underwriting hat on, then she would be demanding a capital replacement reserve on the balance sheet. And all of this did not yet take into account a single dollar to go toward serving more children.
Cicely voiced some of her concerns and found a few supportive nods from the board. For the most part, however, the board remained fascinated by the idea of the Centre Street building, and wanted Charles and Bebe to continue investigating.
Strategic Issues
Taking on the new building would mean a fundamental change in Street Media’s infrastructural needs and business model. Instead of being programmatically driven, as they have been and as their funding sources reflect, their operating budget and balance sheet would be dominated by facilities. There are major questions regarding Street Media’s ability to raise the capital to undertake the project and to expand operating revenues to cover the expanded program and occupancy costs and feed facilities replacement reserves. The potential impact on programming is also in question. While on one hand, they would have the space capacity to serve more youth; they may also lose programmatic focus while dealing with the facility. Would it make sense to take on the long-term time horizon responsibility of a building? Would they be able to serve the short-term needs of their audience? Fixed costs take precedence, and if revenue assumptions were to fall short, cuts would fall on the program side and among staff.
Also, since programs are subsidized, it’s not a given to assume that their revenues would increase with more individuals served. It’s also unclear how a new facility might impact Street Media’s ability to attract youth to their programs. Even more important may be the shift to an institutional character, from a highly flexible organization able to respond to the swift adaptation of youth culture.
Mission Alignment��
Internal Capacity��
Change in Scope, Scale and Time Horizon��

31
Balance Sheet: Street Media
Assets
Cash 162,383 Looks like 45% of operations, but note TRNA balance
Accounts Receivable 8,736
Prepaids 760
Current Assets 171,879
Fixed Assets (net) 12,886 Current fixed assets are all equipment
Total Assets 184,765
Liabilities & Net Assets
Accounts Payable 16,847
Accrued Expense 5,000
Current Liabilities 21,847
Total Liabilities 21,847
Unrestricted Net Assets 62,918
Temporarily Restricted Net Assets 100,000 Reserved for future years
Total Net Assets 162,918
Total Liabilities & Net Assets 184,765
Income Statement: Street Media
Revenue Expenses Operating Revenue 358,067
Contributed Revenue Personnel Expense 304,615 Operating Expense 362,914
Individual Donations 24,795
Corporate & Foundation Gifts 227,500 Program Expense Net Operating Income (4,847)
Released from Restriction 25,000 Program Materials 18,527
Special Events 31,849 Advertising/Ticket Sales 892 Small operating deficit typical of marginal group operating close to the edge Total Contributed Revenue 309,144 Consultants/Contract Labor 4,875
Total Program Expense 24,294
Earned Revenue Other Revenue & Expense
Program Fees 45,788 Occupancy Expense New Restricted Revenue 100,000
Sales (net) 576 Rent 13,200 Interest & Dividends 46
Memberships 1,275 Utilities 973 Releases from Restriction (25,000)
Ticket Sales 1,284 Equipment 674 Net Other 75,046
Total Earned Revenue 48,923 Depreciation 1,840
Total Occupancy Expense 16,687 Change in Net Assets 70,199
Total Revenue 358,067
Office Expense Bottom line is positive – but misleading
Supplies, Postage & Printing 11,689
Audit 5,000
Interest & Financing Fees 629
Total Office Expense 17,318
Total Expenses 362,914

32
Assessment of current capital structure
Financial Health Score: 3 (1–Strongest, 4–Weakest)
Currently, the balance sheet is very simple, and capitalization is low, which can work for this kind of organization. With just over $50,000 in unrestricted net assets, it barely has the working capital to stay afloat in its current state, but without significant obligations beyond meeting payroll, two months worth of cash can feel adequate. However, there is no cushion, and the organization lacks the ability to weather any adverse circumstances.
Capitalization goals Even before serious consideration is given to owning a facility, a substantial amount of work lies ahead for stabilizing this organization. The recapitalized balance sheet represents thoughts on how the organization could achieve sustainability in its current state, without a facility. Building a pipeline of grants to support future operations would represent one step toward building a predictable future. At the same time, an operating reserve of six months of expenses would provide the means to withstand a short downturn, and test whether the donor appetite exists for Street Media to begin to consider a capital campaign. Even this goal would likely take several years to achieve.
Business planning questions
If they choose to go forward, they would need to build an operating model by investigating potential new and expanded programs, the youth interest to fill them, and the funder interest in paying for them. They also need to create a budget for the project itself, making sure to include realistic development costs for the uses they have in mind. For example, performance space costs more to develop than offices. They also need to budget adequately for soft costs, contingencies, and reserves. Importantly, they need to prepare three to five years of operating projections, to understand the impact on their ongoing operating budget, as well as the costs of scaling up – transition costs are likely to include start up of new programs over an extended period of time. Finally, they need a plan for a capital campaign to raise the necessary funds. Like Fleetside, starting up a capital campaign without a donor base is not a short-term endeavor.
Next steps Before going any further, Charles, Bebe, and their Executive Committee need to spend a half day considering the full range of implications of this opportunity. Cicely’s concerns are just the tip of the iceberg; the impact of taking on responsibility for a facility will have repercussions throughout the organization. Is it consistent with their mission to get more institutional and more permanent? How much do facilities really drive their success? How much will doing the development project and running the facility distract from programming, given the fact that Charles and Bebe do not have experience with running a commercial building? One of the biggest mistakes commonly made is to undertake a transformation without full recognition of its import, and with no one taking the devil’s advocate position. Even the decision to undertake the business planning exercise could become a distraction and excuse to delay a real decision.
Ownership is the key issue – not only ownership of the building but also ownership of the decision to move forward. Diffusion of responsibility can become a negative force, when individuals rely too heavily on other parties – such as banks, building owners, or a small subset of the board and management – for due diligence and when they rely on the momentum of a planning process to move them forward without making a decision. The half-day retreat would set this tone of ownership from the start, especially if Cicely – or someone else on the board – would consider taking the role of devil’s advocate. If there is no one willing to do this, Street Media should consider bringing in an outside, objective voice with the experience and fortitude to inject a dose of cold water on the situation. A property manager could be a good choice – someone with the prior experience to know what Street Media hasn’t taken into account.
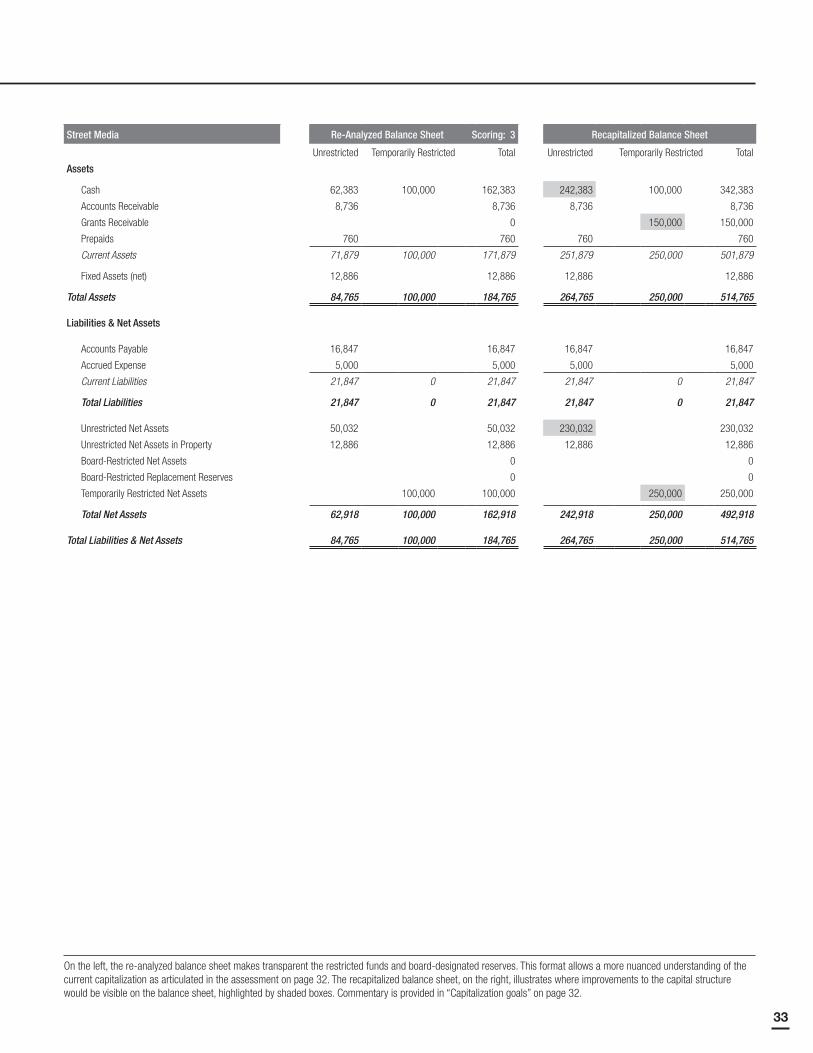
33
Street Media Re-Analyzed Balance Sheet Scoring: 3 Recapitalized Balance Sheet
Unrestricted Temporarily Restricted Total Unrestricted Temporarily Restricted Total
Assets
Cash 62,383 100,000 162,383 242,383 100,000 342,383
Accounts Receivable 8,736 8,736 8,736 8,736
Grants Receivable 0 150,000 150,000
Prepaids 760 760 760 760
Current Assets 71,879 100,000 171,879 251,879 250,000 501,879
Fixed Assets (net) 12,886 12,886 12,886 12,886
Total Assets 84,765 100,000 184,765 264,765 250,000 514,765
Liabilities & Net Assets
Accounts Payable 16,847 16,847 16,847 16,847
Accrued Expense 5,000 5,000 5,000 5,000
Current Liabilities 21,847 0 21,847 21,847 0 21,847
Total Liabilities 21,847 0 21,847 21,847 0 21,847
Unrestricted Net Assets 50,032 50,032 230,032 230,032
Unrestricted Net Assets in Property 12,886 12,886 12,886 12,886
Board-Restricted Net Assets 0 0
Board-Restricted Replacement Reserves 0 0
Temporarily Restricted Net Assets 100,000 100,000 250,000 250,000
Total Net Assets 62,918 100,000 162,918 242,918 250,000 492,918
Total Liabilities & Net Assets 84,765 100,000 184,765 264,765 250,000 514,765
On the left, the re-analyzed balance sheet makes transparent the restricted funds and board-designated reserves. This format allows a more nuanced understanding of the current capitalization as articulated in the assessment on page 32. The recapitalized balance sheet, on the right, illustrates where improvements to the capital structure would be visible on the balance sheet, highlighted by shaded boxes. Commentary is provided in “Capitalization goals” on page 32.
31 Milk StreetSuite 310
BostonMassachusetts02109
Tel617.728.9151
Fax617.728.9138
Webwww.tdcorp.org