getting ready for wisc-v! -...
TRANSCRIPT

10/17/2014
1
Getting Ready for WISC-V!Discover all the ways WISC-V delivers increased flexibility and more content.
Agenda
• Introduction
• Review:
– Scoring Options
– Revision Goals and Highlights
– Changes to Retained Subtests
– New Subtests
– WISC‐V on Q‐Interactive
• Test Structure
• Interpretation Basics
• Technical Information
• Purchasing Information
Copyright © 2014. Pearson, Inc. All rights reserved.
10/17/2014
2
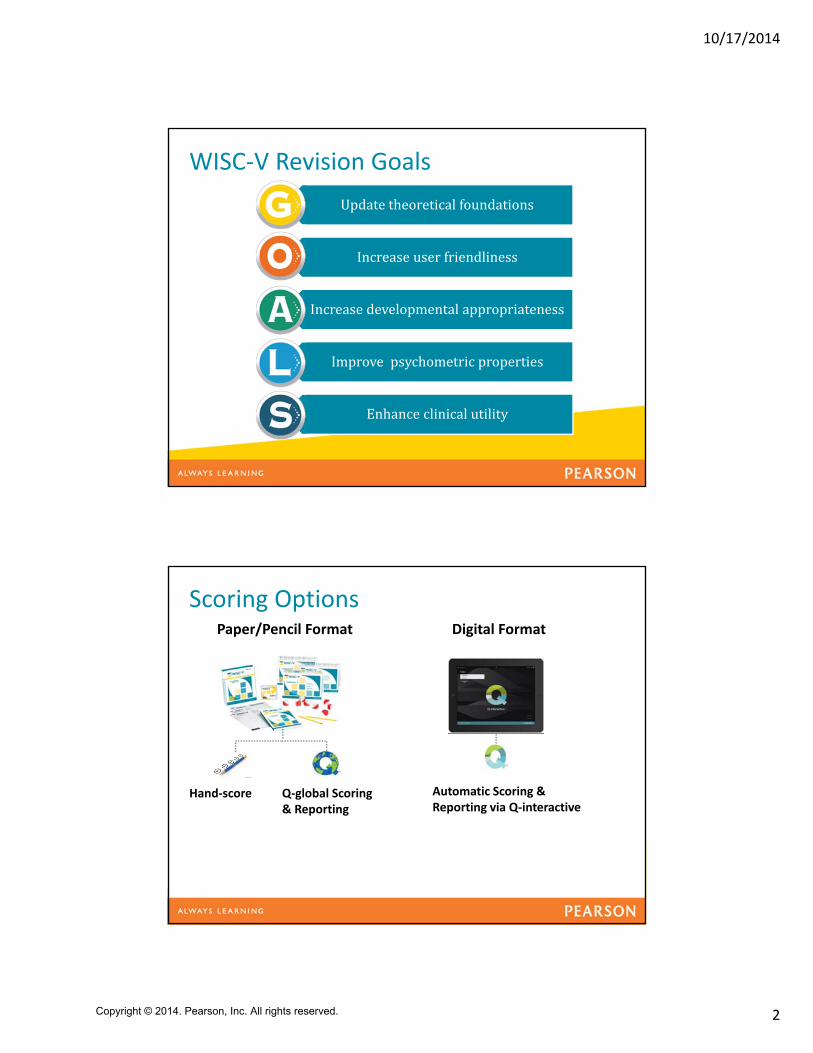
WISC‐V Revision Goals
Updatetheoreticalfoundations
Increaseuserfriendliness
Increasedevelopmentalappropriateness
Improvepsychometricproperties
Enhanceclinicalutility
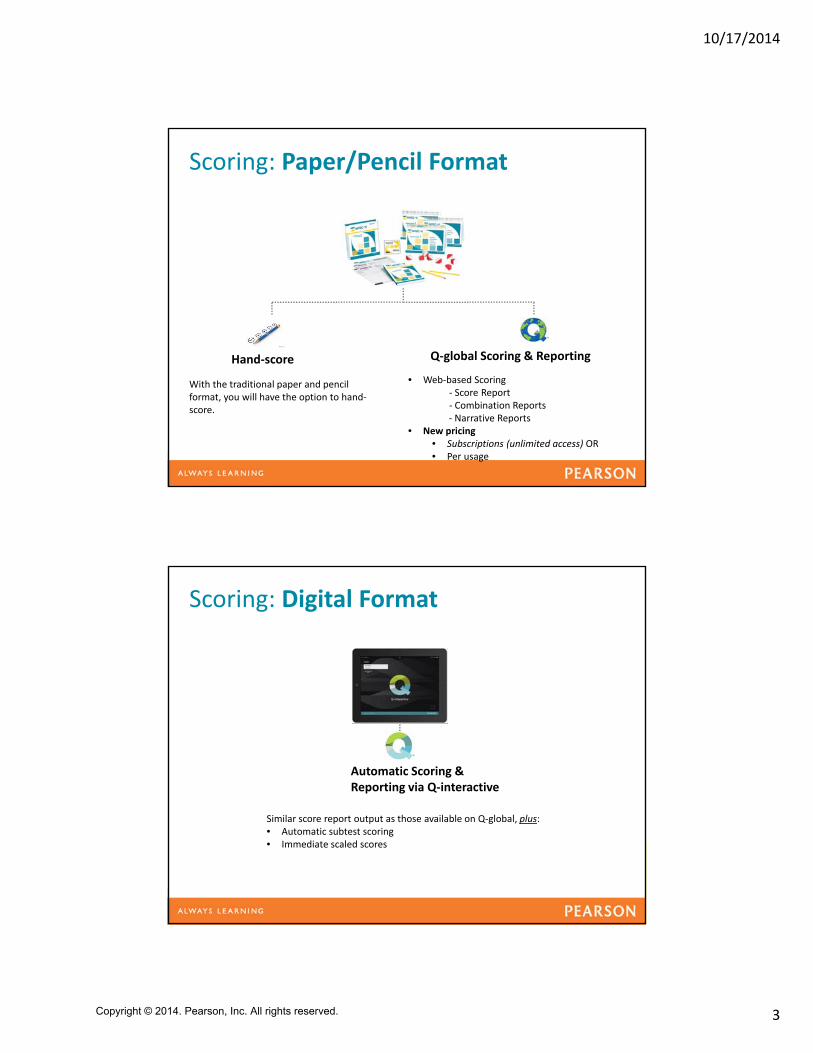
Scoring Options Paper/Pencil Format
Q‐global Scoring & Reporting
Digital Format
Automatic Scoring & Reporting via Q‐interactive
Hand‐score
Copyright © 2014. Pearson, Inc. All rights reserved.
10/17/2014
3
Scoring: Paper/Pencil Format
Q‐global Scoring & ReportingHand‐score
With the traditional paper and pencil format, you will have the option to hand‐score.
• Web‐based Scoring ‐ Score Report‐ Combination Reports‐ Narrative Reports
• New pricing • Subscriptions (unlimited access) OR • Per usage
Scoring: Digital Format
Automatic Scoring & Reporting via Q‐interactive
Similar score report output as those available on Q‐global, plus:• Automatic subtest scoring• Immediate scaled scores
Copyright © 2014. Pearson, Inc. All rights reserved.
10/17/2014
4
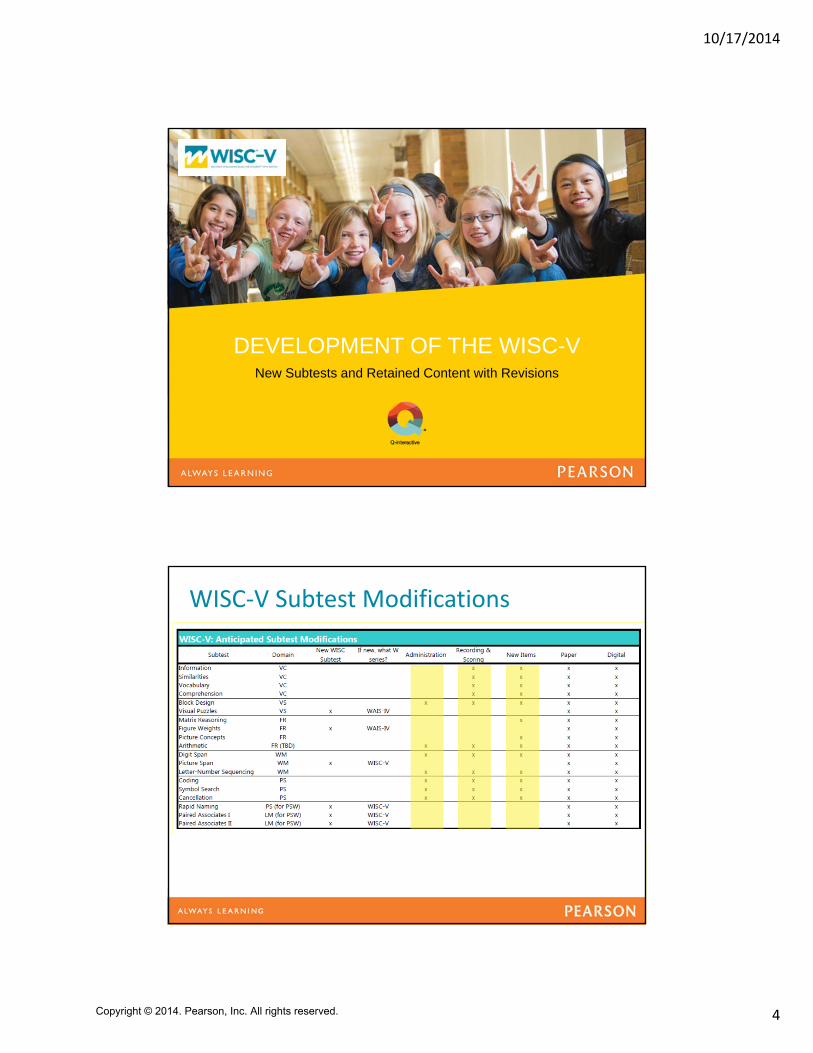
DEVELOPMENT OF THE WISC-VNew Subtests and Retained Content with Revisions
WISC‐V Subtest Modifications
Copyright © 2014. Pearson, Inc. All rights reserved.
10/17/2014
5
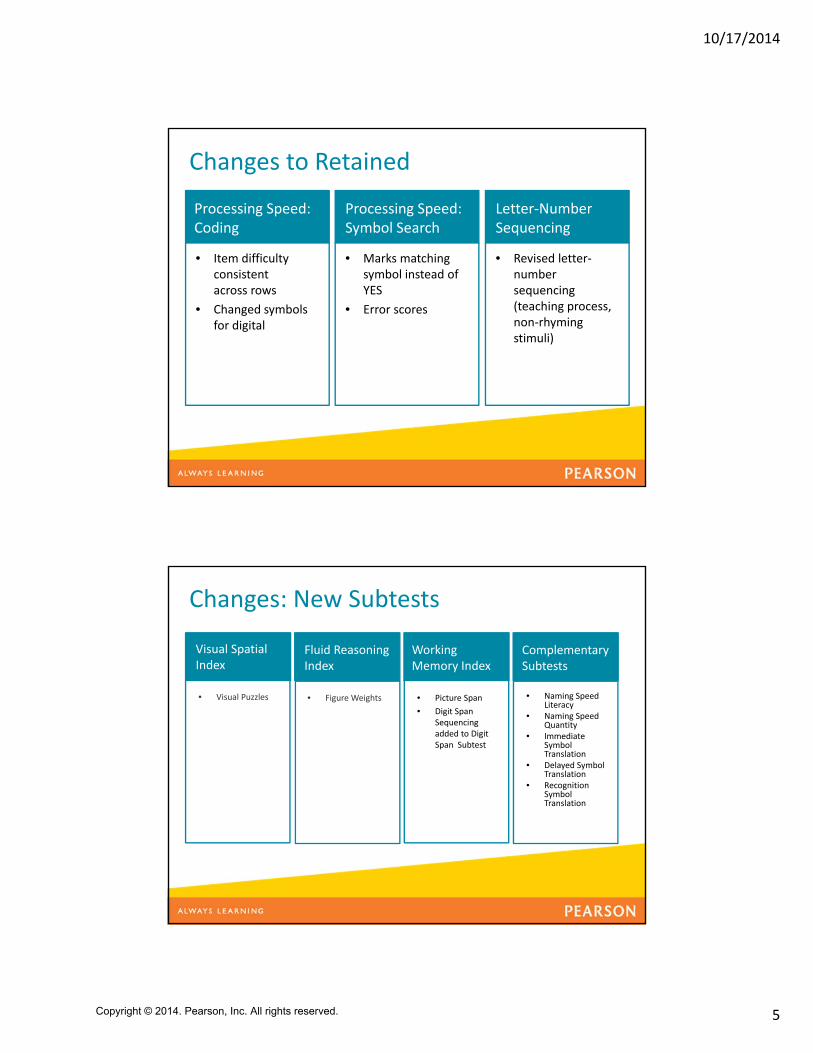
• Item difficulty consistent across rows
• Changed symbols for digital
Processing Speed: Coding
Changes to Retained
• Marks matching symbol instead of YES
• Error scores
Processing Speed: Symbol Search
• Revised letter‐number sequencing (teaching process, non‐rhyming stimuli)
Letter‐Number Sequencing
• Visual Puzzles
Visual Spatial Index
Changes: New Subtests
• Figure Weights • Picture Span
• Digit Span Sequencing added to Digit Span Subtest
• Naming Speed Literacy
• Naming Speed Quantity
• Immediate Symbol Translation
• Delayed Symbol Translation
• Recognition Symbol Translation
Fluid Reasoning Index
Working Memory Index
Complementary Subtests
Copyright © 2014. Pearson, Inc. All rights reserved.
10/17/2014
6
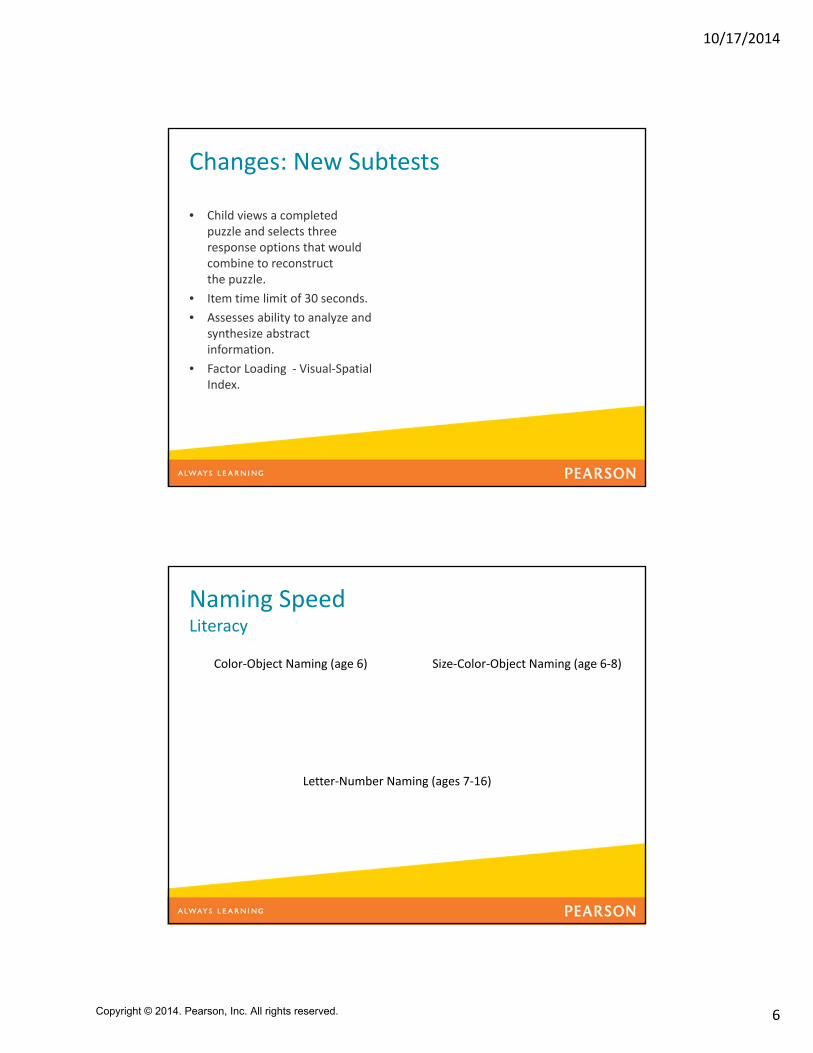
Changes: New Subtests
• Child views a completed puzzle and selects three response options that would combine to reconstruct the puzzle.
• Item time limit of 30 seconds.
• Assesses ability to analyze and synthesize abstract information.
• Factor Loading ‐ Visual‐Spatial Index.
Naming SpeedLiteracy
Color‐Object Naming (age 6)
Letter‐Number Naming (ages 7‐16)
Size‐Color‐Object Naming (age 6‐8)
Copyright © 2014. Pearson, Inc. All rights reserved.
10/17/2014
7
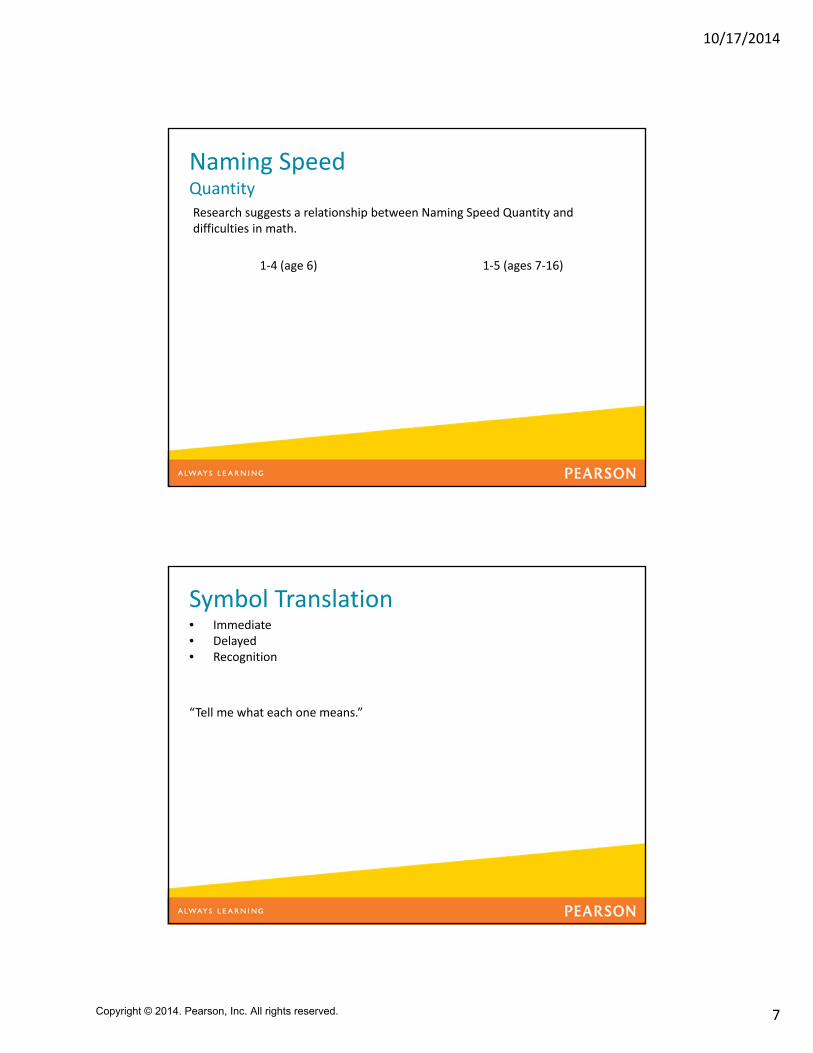
Naming SpeedQuantity
1‐4 (age 6) 1‐5 (ages 7‐16)
Research suggests a relationship between Naming Speed Quantity and difficulties in math.
Symbol Translation
“Tell me what each one means.”
• Immediate• Delayed• Recognition
Copyright © 2014. Pearson, Inc. All rights reserved.

10/17/2014
8
WISC-V TEST STRUCTURE
Test Structure – Full Scale IQ
Copyright © 2014. Pearson, Inc. All rights reserved.
10/17/2014
9
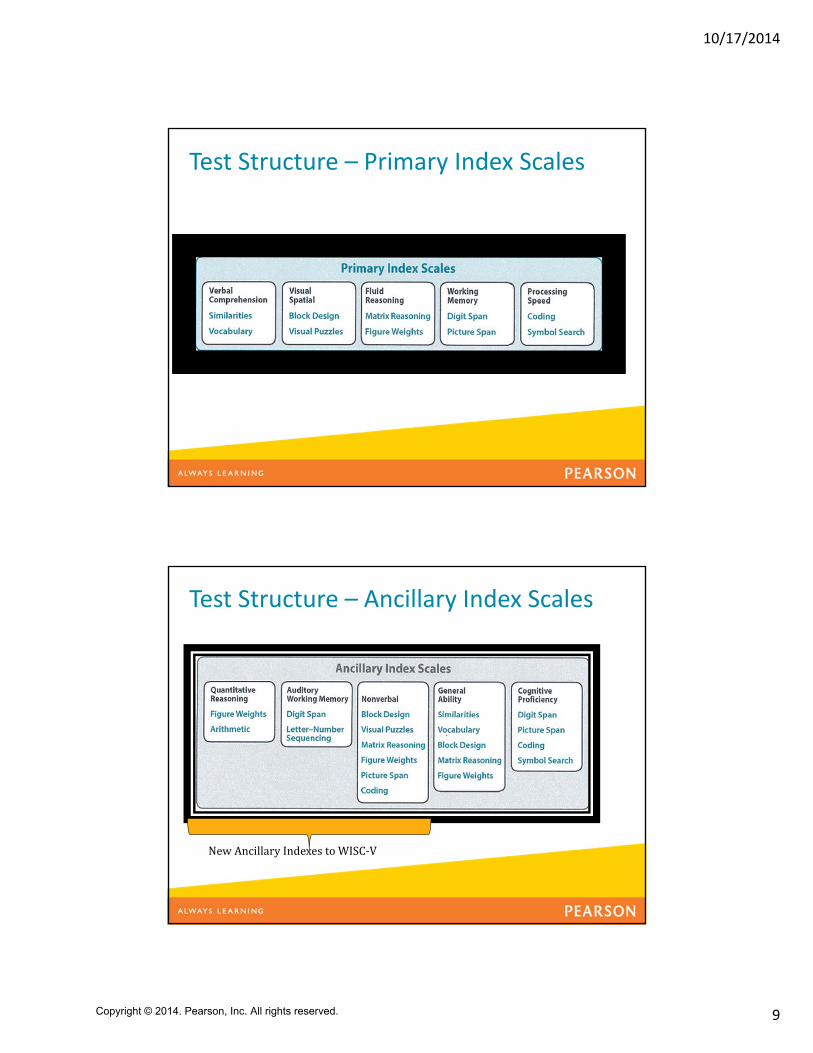
Test Structure – Primary Index Scales
Test Structure – Ancillary Index Scales
NewAncillaryIndexestoWISC‐V
Copyright © 2014. Pearson, Inc. All rights reserved.

10/17/2014
10
Complementary Index Scores
Headline placed here
Text here…
NSI STI SRIOnRecordFormAncillaryandComplementaryAnalysisPagesandinAdministrationandScoringManualSupplement:Optionalcarry‐alongNote:SRI=NSI+STI...SRI≠NSL+NSQ+IST+DST+RST
Copyright©2014PearsonEducation,Inc.oritsaffiliates.Allrightsreserved.
WISC-V Scoring and Interpretation: An introduction
Discover the ways the WISC-V delivers enhanced insights with new and different scores.
Copyright © 2014. Pearson, Inc. All rights reserved.

10/17/2014
11
FSIQ: Permissible Substitutions
IN or CO for SI or VC
CO for SI or VC
VP for BD
PC for MR or FW
AR for FW
PS or LNS (LN) for DS
SS or CA for CD
Reminder
Copyright © 2014. Pearson, Inc. All rights reserved.

10/17/2014
12
Descriptive Classifications
CompositeScoreRange
WISC–V DescriptiveClassification
Traditional DescriptiveClassification(“Old”)
130andabove ExtremelyHigh VerySuperior
120–129 VeryHigh Superior
110–119 HighAverage HighAverage
90–109 Average Average
80–89 LowAverage LowAverage
70–79 VeryLow Borderline
69andbelow ExtremelyLow ExtremelyLow
Copyright©2014PearsonEducation,Inc.oritsaffiliates.Allrightsreserved.
How to Report and Describe Performance
Copyright © 2014. Pearson, Inc. All rights reserved.
10/17/2014
13
What is represented by the VCI?
What is represented by the VSI?
Copyright © 2014. Pearson, Inc. All rights reserved.

10/17/2014
14
What is represented by the FRI?
What is represented by the WMI?
5‐8‐2‐7
7‐2‐8‐5
Copyright © 2014. Pearson, Inc. All rights reserved.
10/17/2014
15
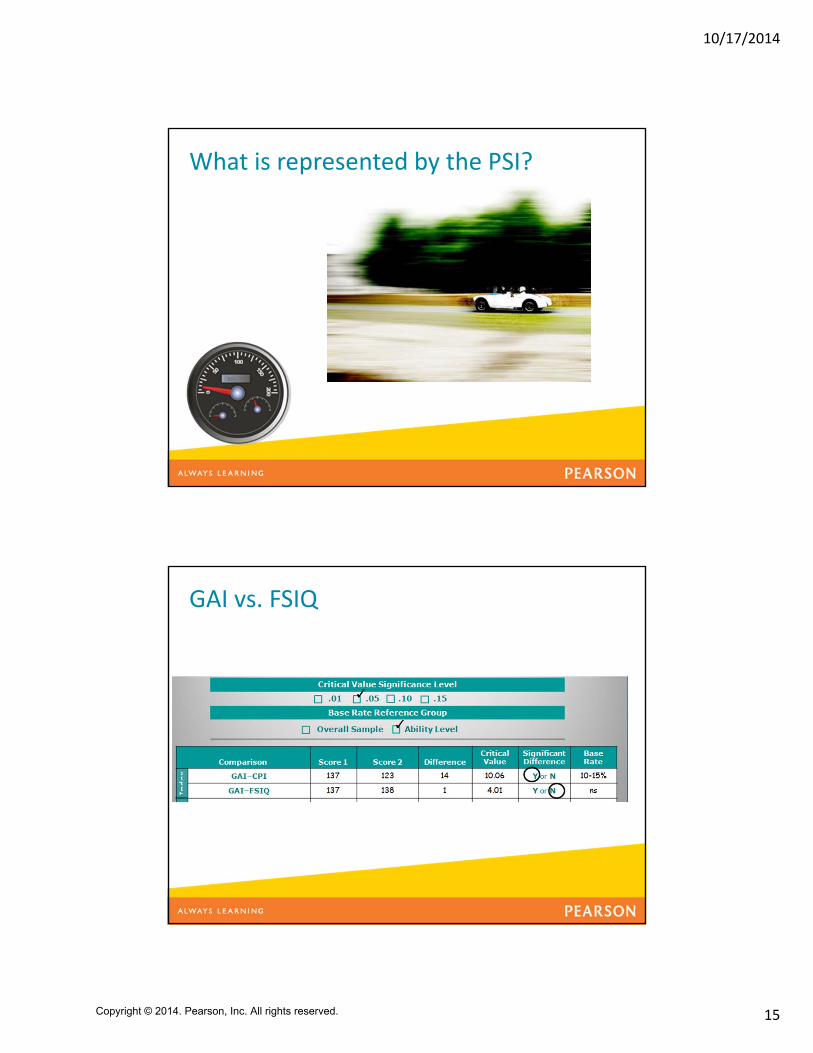
What is represented by the PSI?
GAI vs. FSIQ
Copyright © 2014. Pearson, Inc. All rights reserved.

10/17/2014
16
GAI vs. CPI
Nonverbal Index
• Composed of BD, MR, CD, FW, VP, PS
• Useful when examinee has clear verbal difficulties
– ELL
– RELD, ELD
– ASD with Language Impairment
• Does have processing speed which can affect results just like FSIQ
• More emphasis on reasoning using visual‐spatial processes than FSIQ
Copyright © 2014. Pearson, Inc. All rights reserved.

10/17/2014
17
Auditory Working Memory
• Digit Span and Letter‐Number Sequencing
• Very similar to WISC‐IV working memory with greater focus on sequencing than previous edition
• Contrast scores:– DSF VS DSB impact of additional
mental manipulation required by DSB
– DSF VS DSS impact of sequencing and number knowledge required by DSS
– DSS VS LNS impact of dual‐tasking and letter knowledge
• Useful when global difficulties with visual processing affecting test performance
Quantitative Reasoning
• New complementary index composed of Figure Weights and Arithmetic
• AR requires actual math problem solving; however, AR is very complex having Fluid Reasoning, Verbal, and Working Memory components
• FW requires math skills in a more limited abstract manner. Requires the ability to reason through a problem and to select the best quantitative operation to obtain the correct response.
Copyright © 2014. Pearson, Inc. All rights reserved.
10/17/2014
18
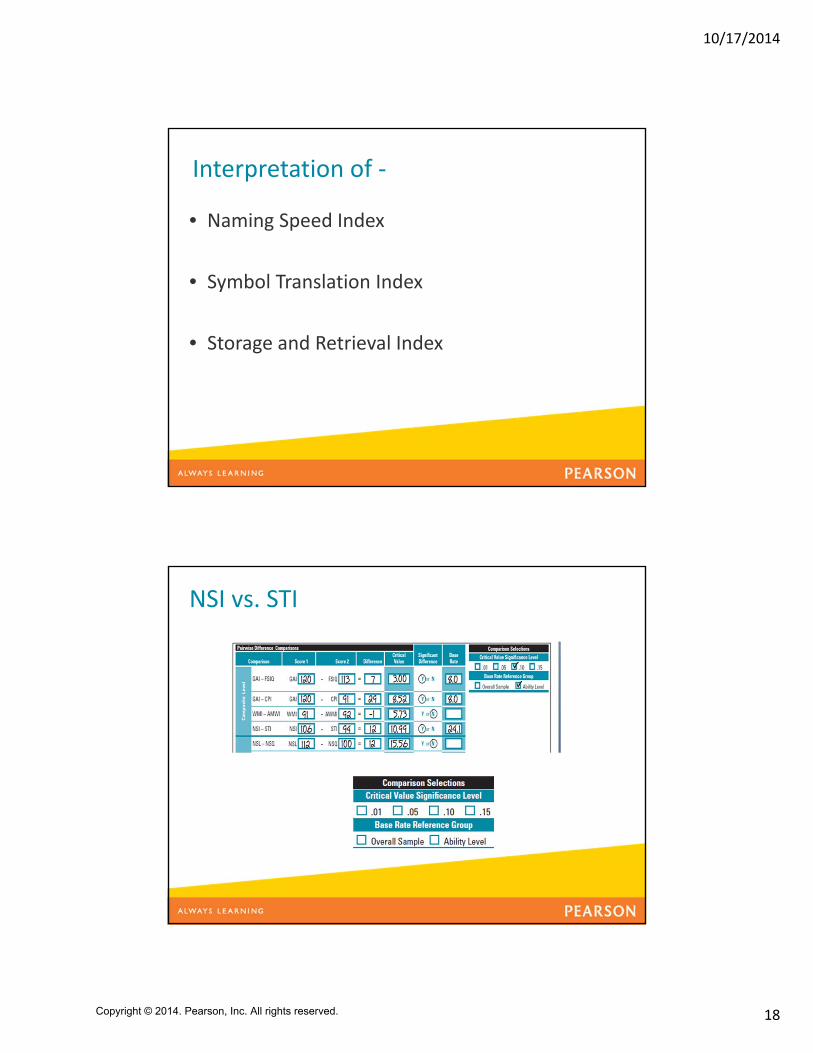
Interpretation of ‐
• Naming Speed Index
• Symbol Translation Index
• Storage and Retrieval Index
NSI vs. STI
Copyright © 2014. Pearson, Inc. All rights reserved.

10/17/2014
19
Technical Properties
Average Testing Time by Age
Copyright©2014PearsonEducation,Inc.oritsaffiliates.Allrightsreserved.
Copyright © 2014. Pearson, Inc. All rights reserved.

10/17/2014
20
Average Testing Times by Special Group
Copyright©2014PearsonEducation,Inc.oritsaffiliates.Allrightsreserved.
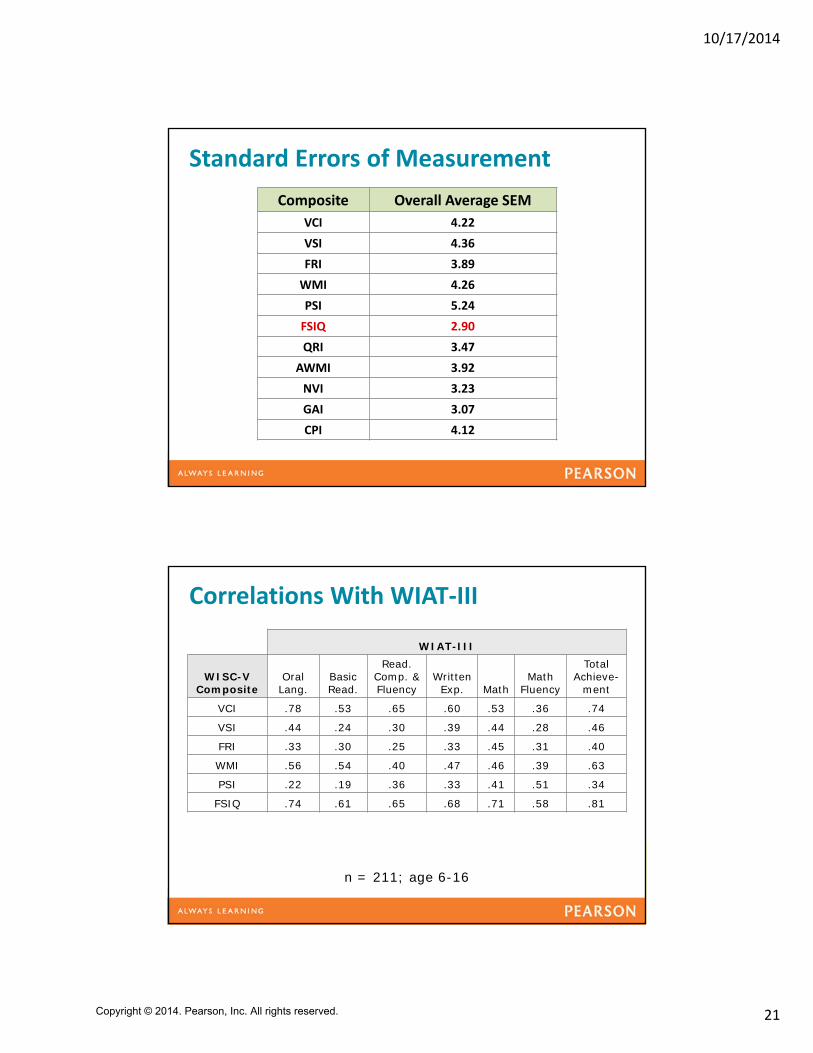
Standard Errors of Measurement
Composite Overall Average SEM
VCI 4.22
VSI 4.36
FRI 3.89
WMI 4.26
PSI 5.24
FSIQ 2.90
QRI 3.47
AWMI 3.92
NVI 3.23
GAI 3.07
CPI 4.12
Copyright © 2014. Pearson, Inc. All rights reserved.
10/17/2014
21
Standard Errors of Measurement
Composite Overall Average SEM
VCI 4.22
VSI 4.36
FRI 3.89
WMI 4.26
PSI 5.24
FSIQ 2.90
QRI 3.47
AWMI 3.92
NVI 3.23
GAI 3.07
CPI 4.12
Correlations With WIAT‐III
n = 211; age 6-16
WIAT-III
WISC-V Composite
Oral Lang.
Basic Read.
Read. Comp. & Fluency
Written Exp. Math
Math Fluency
Total Achieve-
ment
VCI .78 .53 .65 .60 .53 .36 .74
VSI .44 .24 .30 .39 .44 .28 .46
FRI .33 .30 .25 .33 .45 .31 .40
WMI .56 .54 .40 .47 .46 .39 .63
PSI .22 .19 .36 .33 .41 .51 .34
FSIQ .74 .61 .65 .68 .71 .58 .81
Copyright © 2014. Pearson, Inc. All rights reserved.
10/17/2014
22
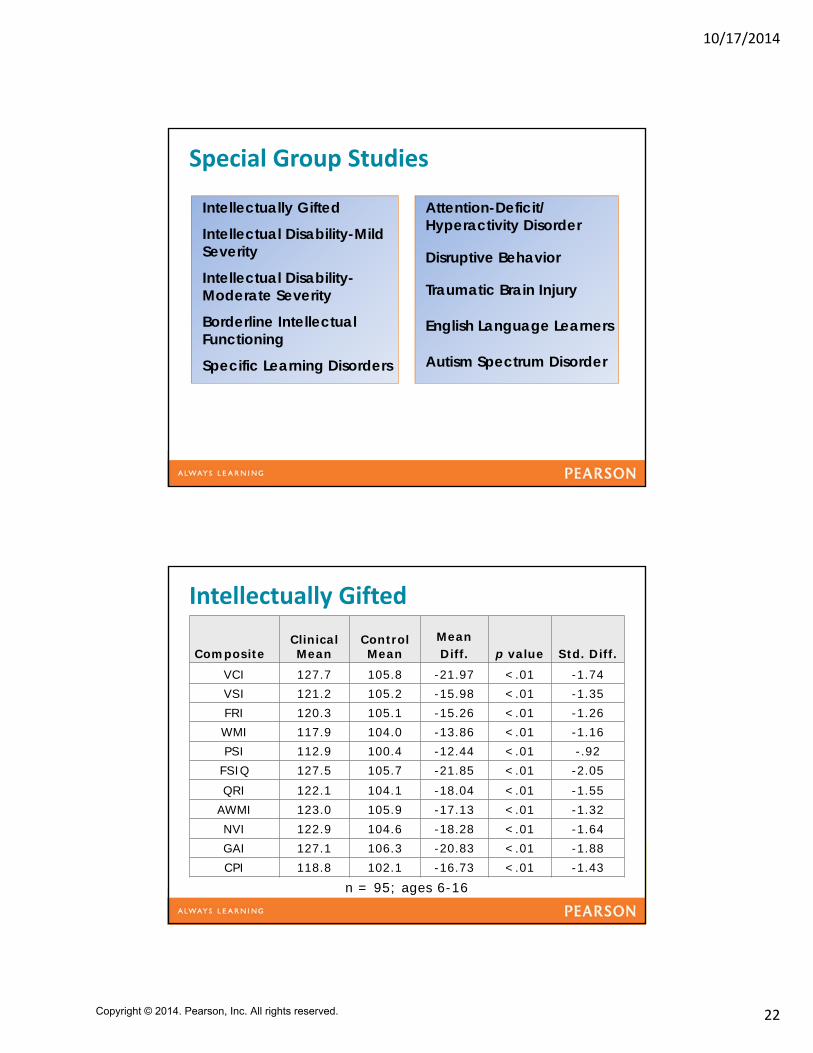
Special Group Studies
Intellectually Gifted
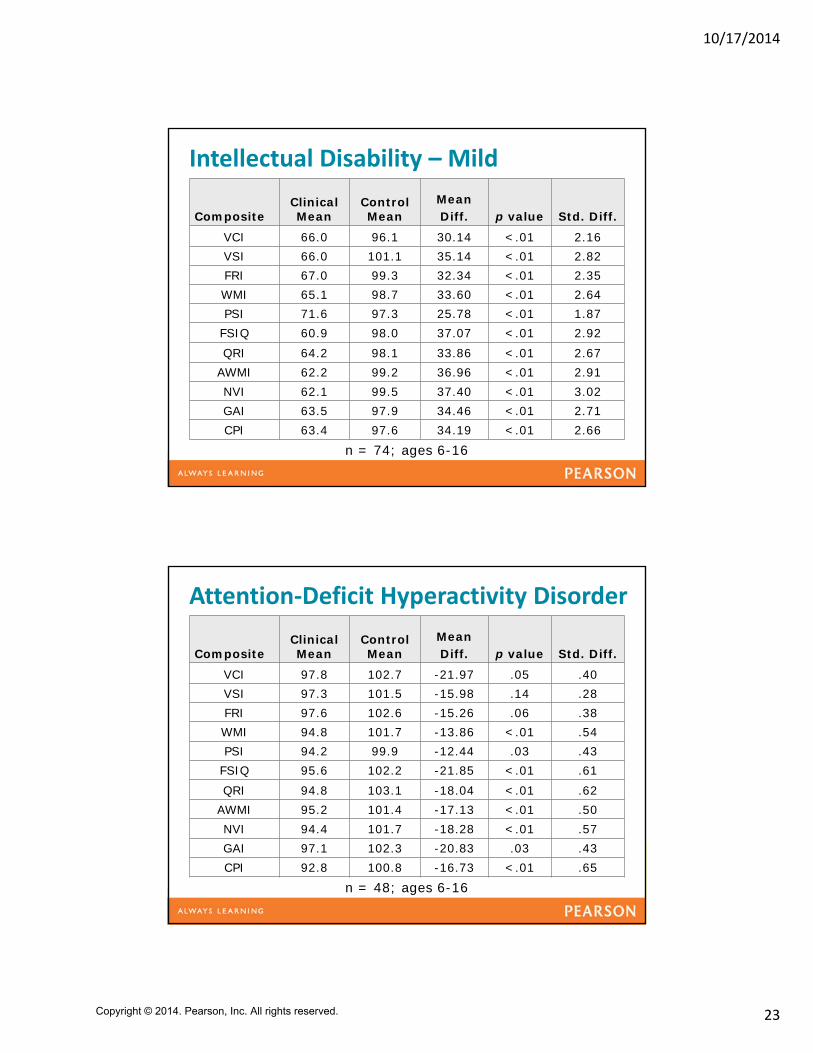
Intellectual Disability-Mild Severity
Intellectual Disability-Moderate Severity
Borderline Intellectual Functioning
Specific Learning Disorders
Attention-Deficit/ Hyperactivity Disorder
Disruptive Behavior
Traumatic Brain Injury
English Language Learners
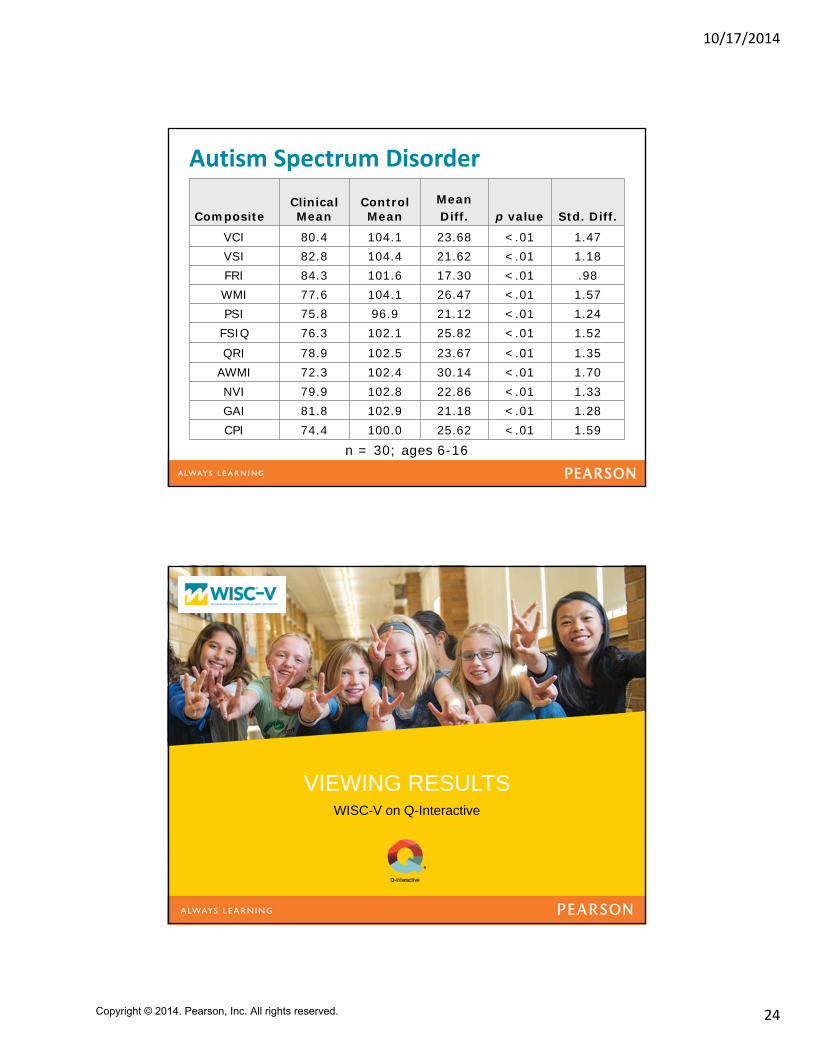
Autism Spectrum Disorder
Intellectually Gifted
n = 95; ages 6-16
CompositeClinical Mean
Control Mean
MeanDiff. p value Std. Diff.
VCI 127.7 105.8 -21.97 <.01 -1.74VSI 121.2 105.2 -15.98 <.01 -1.35FRI 120.3 105.1 -15.26 <.01 -1.26WMI 117.9 104.0 -13.86 <.01 -1.16PSI 112.9 100.4 -12.44 <.01 -.92
FSIQ 127.5 105.7 -21.85 <.01 -2.05QRI 122.1 104.1 -18.04 <.01 -1.55
AWMI 123.0 105.9 -17.13 <.01 -1.32NVI 122.9 104.6 -18.28 <.01 -1.64GAI 127.1 106.3 -20.83 <.01 -1.88CPI 118.8 102.1 -16.73 <.01 -1.43
Copyright © 2014. Pearson, Inc. All rights reserved.
10/17/2014
23
Intellectual Disability – Mild
n = 74; ages 6-16
CompositeClinical Mean
Control Mean
MeanDiff. p value Std. Diff.
VCI 66.0 96.1 30.14 <.01 2.16VSI 66.0 101.1 35.14 <.01 2.82FRI 67.0 99.3 32.34 <.01 2.35WMI 65.1 98.7 33.60 <.01 2.64PSI 71.6 97.3 25.78 <.01 1.87
FSIQ 60.9 98.0 37.07 <.01 2.92QRI 64.2 98.1 33.86 <.01 2.67
AWMI 62.2 99.2 36.96 <.01 2.91NVI 62.1 99.5 37.40 <.01 3.02GAI 63.5 97.9 34.46 <.01 2.71CPI 63.4 97.6 34.19 <.01 2.66
Attention‐Deficit Hyperactivity Disorder
n = 48; ages 6-16
CompositeClinical Mean
Control Mean
MeanDiff. p value Std. Diff.
VCI 97.8 102.7 -21.97 .05 .40VSI 97.3 101.5 -15.98 .14 .28FRI 97.6 102.6 -15.26 .06 .38WMI 94.8 101.7 -13.86 <.01 .54PSI 94.2 99.9 -12.44 .03 .43
FSIQ 95.6 102.2 -21.85 <.01 .61QRI 94.8 103.1 -18.04 <.01 .62
AWMI 95.2 101.4 -17.13 <.01 .50NVI 94.4 101.7 -18.28 <.01 .57GAI 97.1 102.3 -20.83 .03 .43CPI 92.8 100.8 -16.73 <.01 .65
Copyright © 2014. Pearson, Inc. All rights reserved.
10/17/2014
24
Autism Spectrum Disorder
n = 30; ages 6-16
CompositeClinical Mean
Control Mean
MeanDiff. p value Std. Diff.
VCI 80.4 104.1 23.68 <.01 1.47VSI 82.8 104.4 21.62 <.01 1.18FRI 84.3 101.6 17.30 <.01 .98WMI 77.6 104.1 26.47 <.01 1.57PSI 75.8 96.9 21.12 <.01 1.24
FSIQ 76.3 102.1 25.82 <.01 1.52QRI 78.9 102.5 23.67 <.01 1.35
AWMI 72.3 102.4 30.14 <.01 1.70NVI 79.9 102.8 22.86 <.01 1.33GAI 81.8 102.9 21.18 <.01 1.28CPI 74.4 100.0 25.62 <.01 1.59
VIEWING RESULTSWISC-V on Q-Interactive
Copyright © 2014. Pearson, Inc. All rights reserved.
10/17/2014
25
Click to Edit
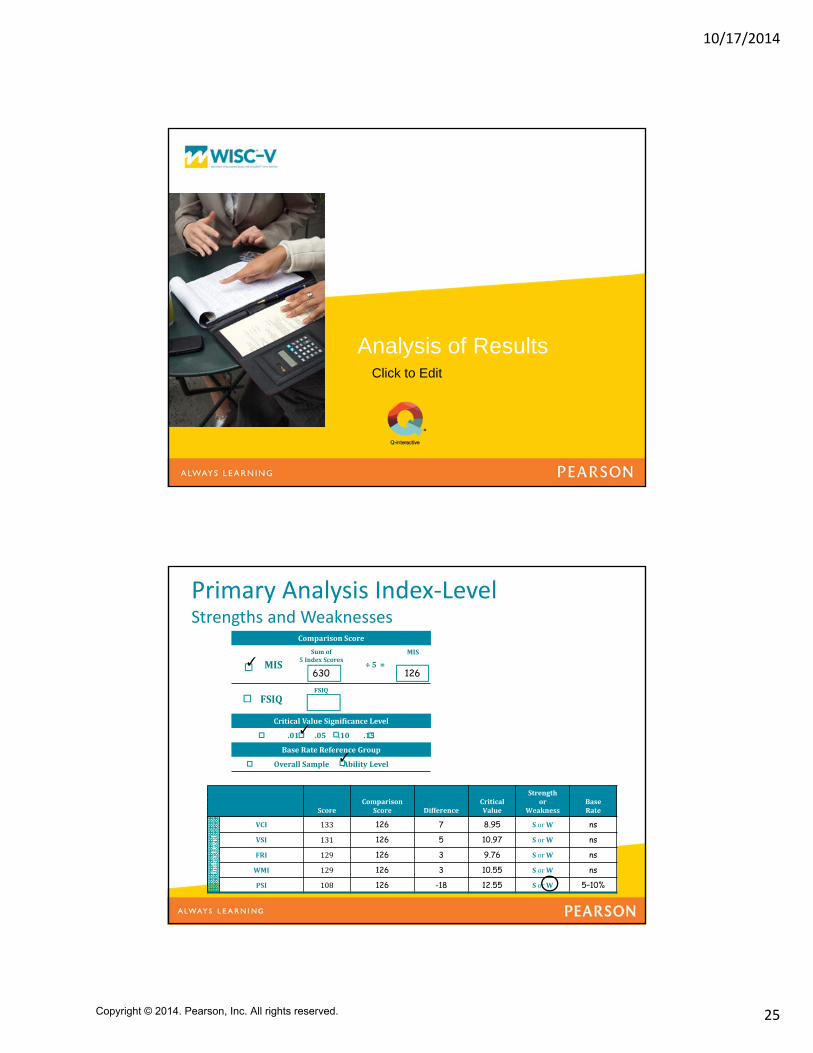
Analysis of Results
ScoreComparison
Score DifferenceCriticalValue
Strengthor
WeaknessBaseRate
IndexLevel
VCI 133 126 7 8.95 SorW ns
VSI 131 126 5 10.97 SorW ns
FRI 129 126 3 9.76 SorW ns
WMI 129 126 3 10.55 SorW ns
PSI 108 126 -18 12.55 SorW 5–10%
Primary Analysis Index‐Level Strengths and Weaknesses
ComparisonScore
MISSumof
5IndexScores÷ 5=
MIS
FSIQFSIQ
CriticalValueSignificance Level
.01.05.10.15
BaseRateReference Group
OverallSample AbilityLevel
630 126✓
✓
✓
Copyright © 2014. Pearson, Inc. All rights reserved.
10/17/2014
26
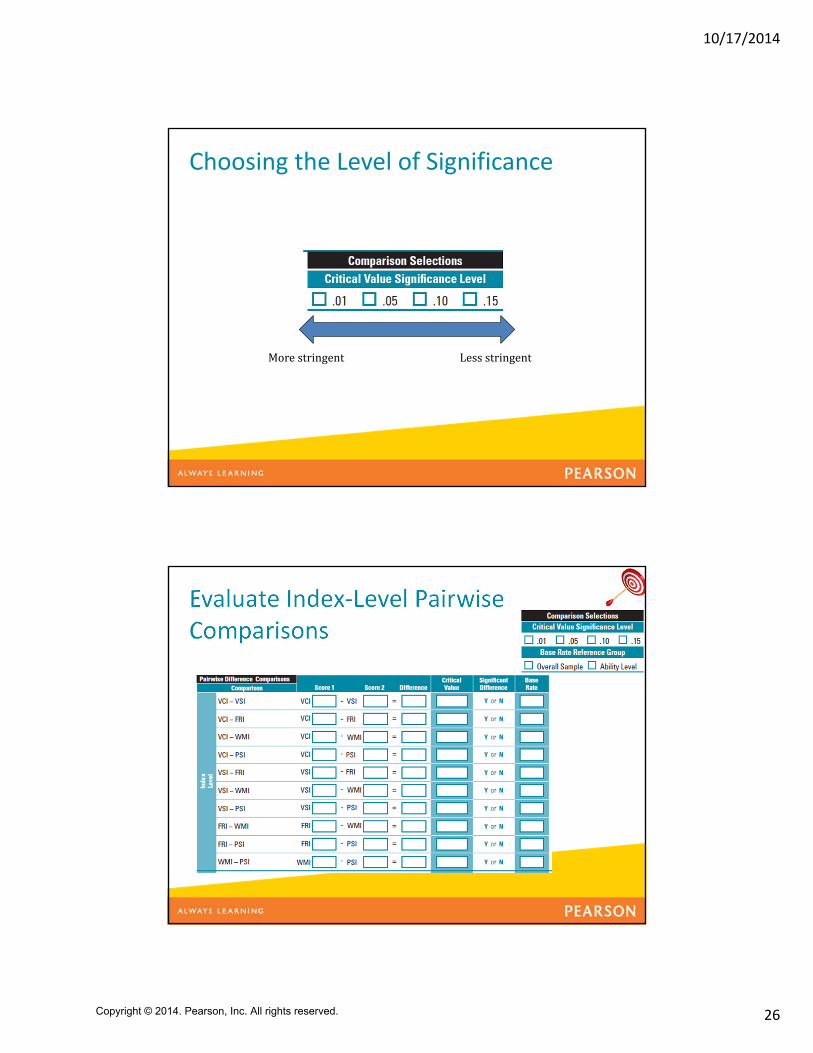
Choosing the Level of Significance
Morestringent Lessstringent
Evaluate Index‐Level PairwiseComparisons
Copyright © 2014. Pearson, Inc. All rights reserved.
10/17/2014
27
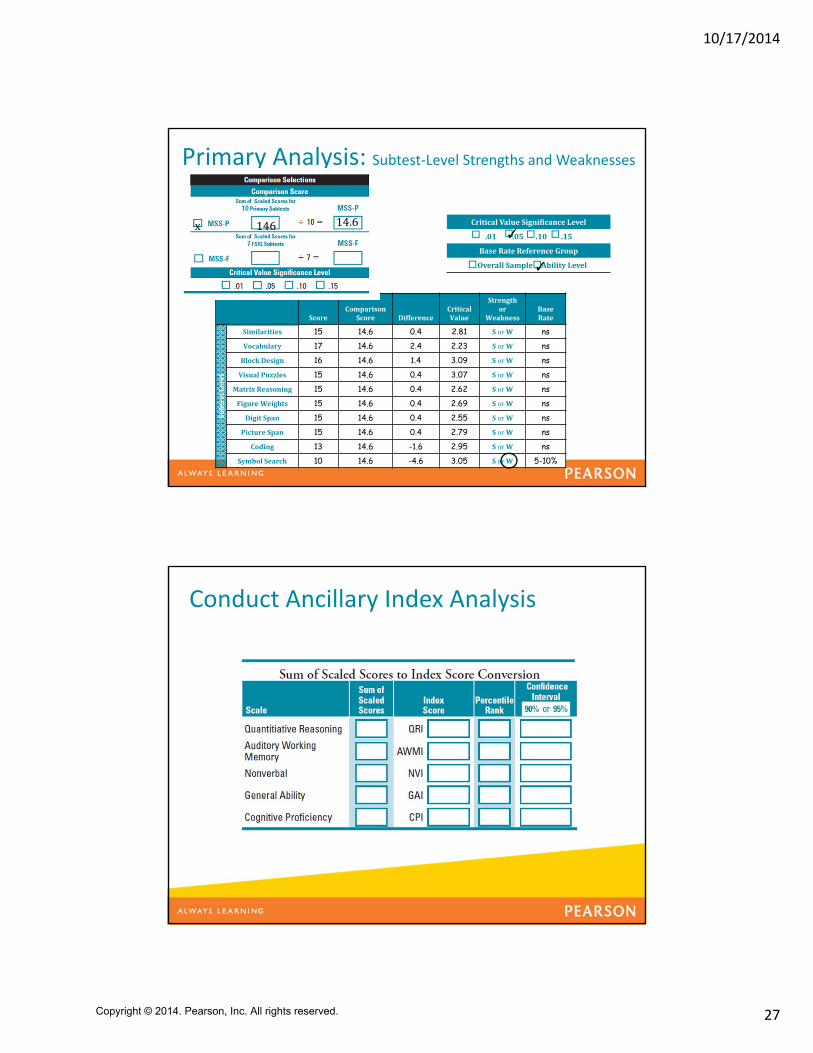
CriticalValueSignificance Level
.01.05.10.15
BaseRateReference Group
OverallSample AbilityLevel
ScoreComparison
Score DifferenceCriticalValue
Strengthor
WeaknessBaseRate
SubtestLevel
Similarities 15 14.6 0.4 2.81 SorW ns
Vocabulary 17 14.6 2.4 2.23 SorW ns
BlockDesign 16 14.6 1.4 3.09 SorW ns
VisualPuzzles 15 14.6 0.4 3.07 SorW ns
MatrixReasoning 15 14.6 0.4 2.62 SorW ns
FigureWeights 15 14.6 0.4 2.69 SorW ns
Digit Span 15 14.6 0.4 2.55 SorW ns
PictureSpan 15 14.6 0.4 2.79 SorW ns
Coding 13 14.6 -1.6 2.95 SorW ns
SymbolSearch 10 14.6 -4.6 3.05 SorW 5-10%
Primary Analysis: Subtest‐Level Strengths and Weaknesses
✓
✓
146 14.6x
Conduct Ancillary Index Analysis
Copyright © 2014. Pearson, Inc. All rights reserved.
10/17/2014
28
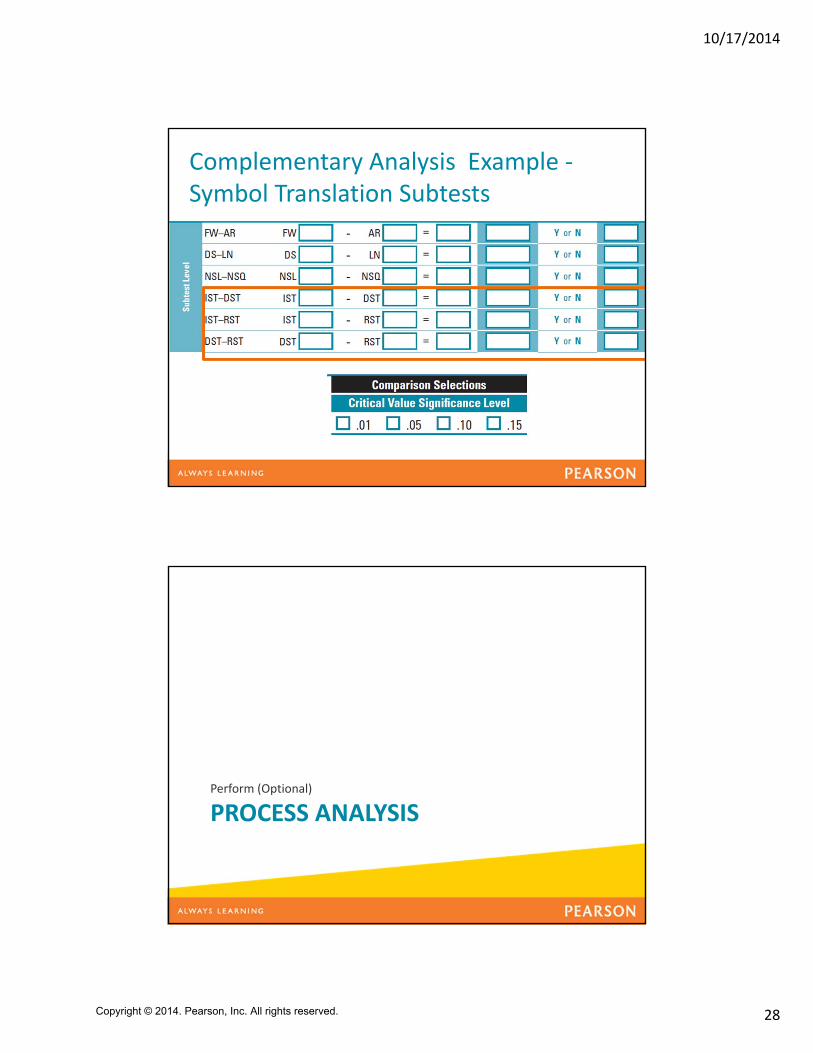
Complementary Analysis Example ‐Symbol Translation Subtests
PROCESS ANALYSISPerform (Optional)
Copyright © 2014. Pearson, Inc. All rights reserved.

10/17/2014
29
Copyright©2014PearsonEducation,Inc.oritsaffiliates.Allrightsreserved.
Block Design Scoring
Copyright©2014PearsonEducation,Inc.oritsaffiliates.Allrightsreserved.
Copyright © 2014. Pearson, Inc. All rights reserved.
10/17/2014
30
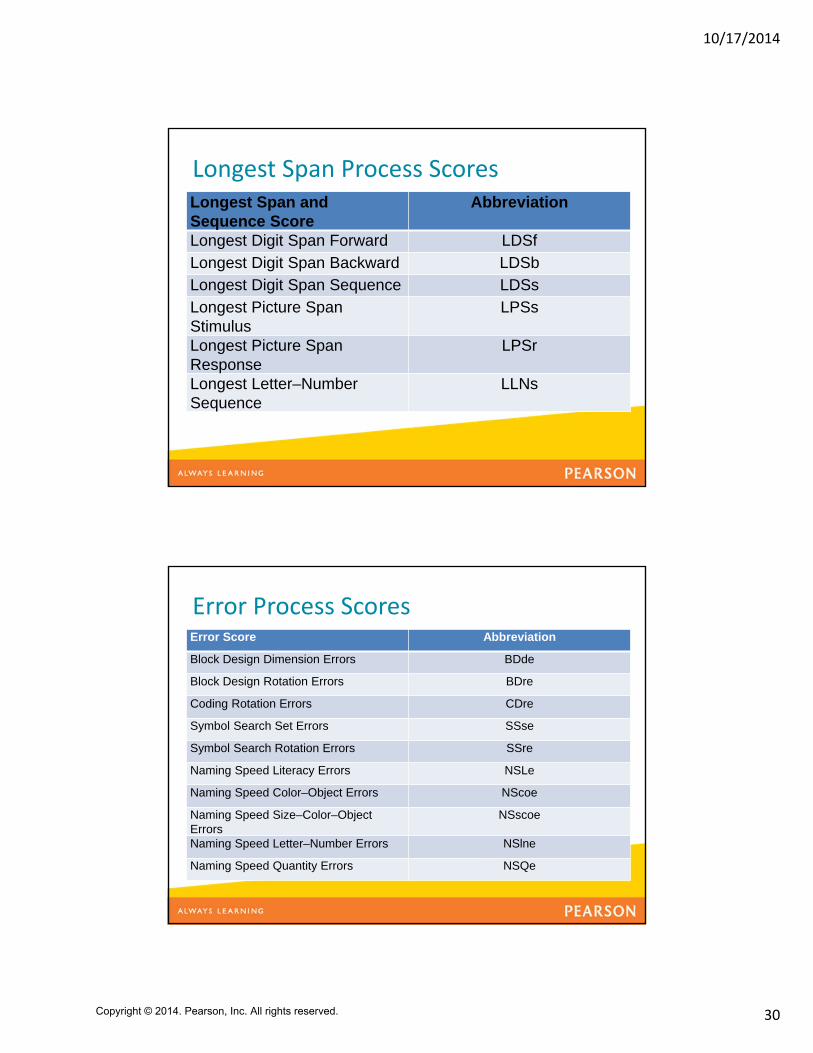
Longest Span Process ScoresLongest Span and Sequence Score
Abbreviation
Longest Digit Span Forward LDSfLongest Digit Span Backward LDSbLongest Digit Span Sequence LDSsLongest Picture Span Stimulus
LPSs
Longest Picture Span Response
LPSr
Longest Letter–Number Sequence
LLNs
Error Process ScoresError Score Abbreviation
Block Design Dimension Errors BDde
Block Design Rotation Errors BDre
Coding Rotation Errors CDre
Symbol Search Set Errors SSse
Symbol Search Rotation Errors SSre
Naming Speed Literacy Errors NSLe
Naming Speed Color–Object Errors NScoe
Naming Speed Size–Color–Object Errors
NSscoe
Naming Speed Letter–Number Errors NSlne
Naming Speed Quantity Errors NSQe
Copyright © 2014. Pearson, Inc. All rights reserved.
10/17/2014
31
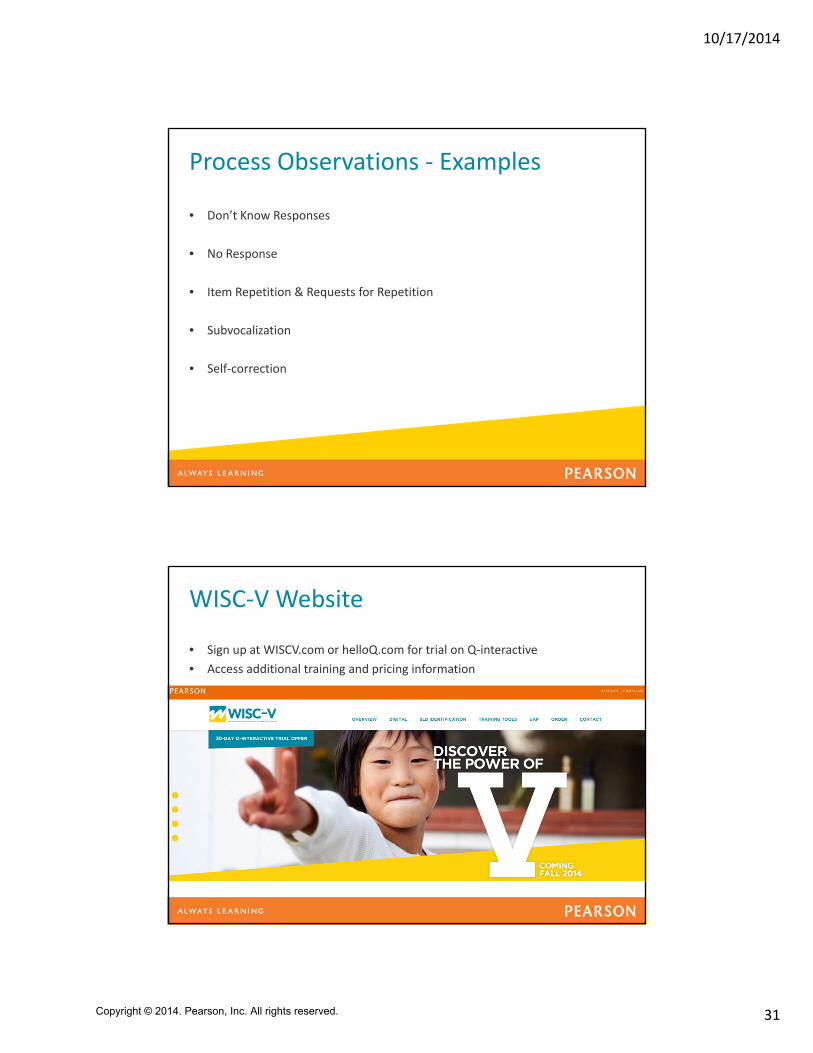
Process Observations ‐ Examples
• Don’t Know Responses
• No Response
• Item Repetition & Requests for Repetition
• Subvocalization
• Self‐correction
WISC‐V Website
• Sign up at WISCV.com or helloQ.com for trial on Q‐interactive
• Access additional training and pricing information
Copyright © 2014. Pearson, Inc. All rights reserved.

10/17/2014
32
Additional Questions?
Talk to a Consultant: 800‐627‐7271Email: [email protected]
See WISCV.com and HelloQ.com for more information!
Copyright © 2014. Pearson, Inc. All rights reserved.