getting started with environmental sustainability · 5r’s of the waste hierarchy. reduce waste at...
TRANSCRIPT
ASSA ABLOY is the global leader in door opening solutions, dedicated to satisfying end-user needs for security, safety and convenience
Getting Started with Environmental Sustainability


About the Presenter
9 years experience in manufacturing
8 years experience in business software development
BCIT Diploma of Technology, Computer Systems
APICS Fraser Valley Chapter member since 2013 – VP Communications 2014-2018
FlexiForce Canada Green Team Leader

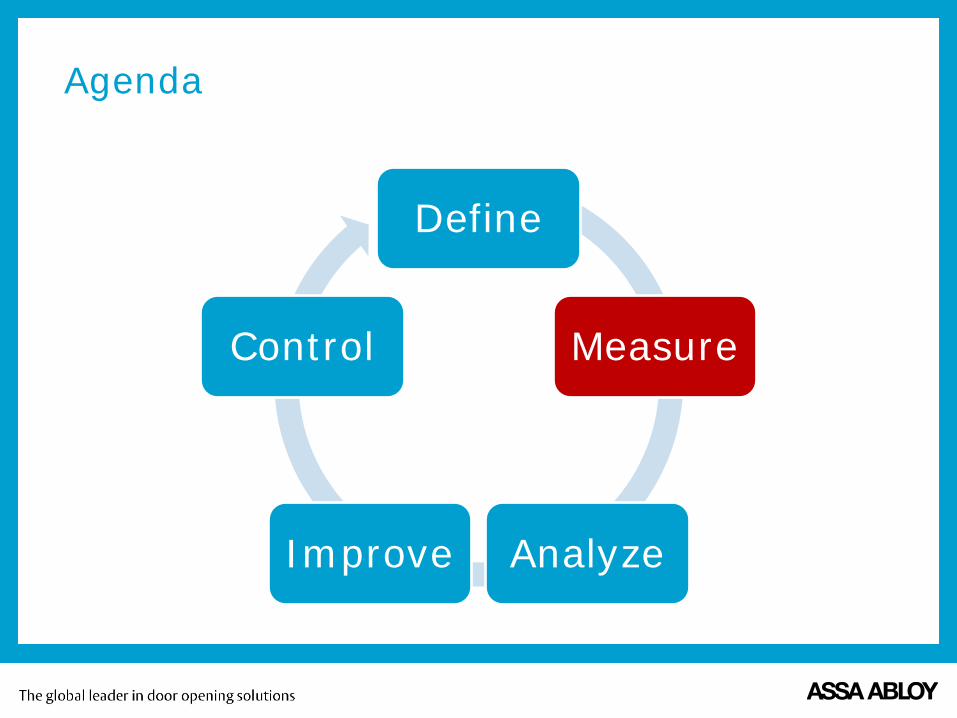
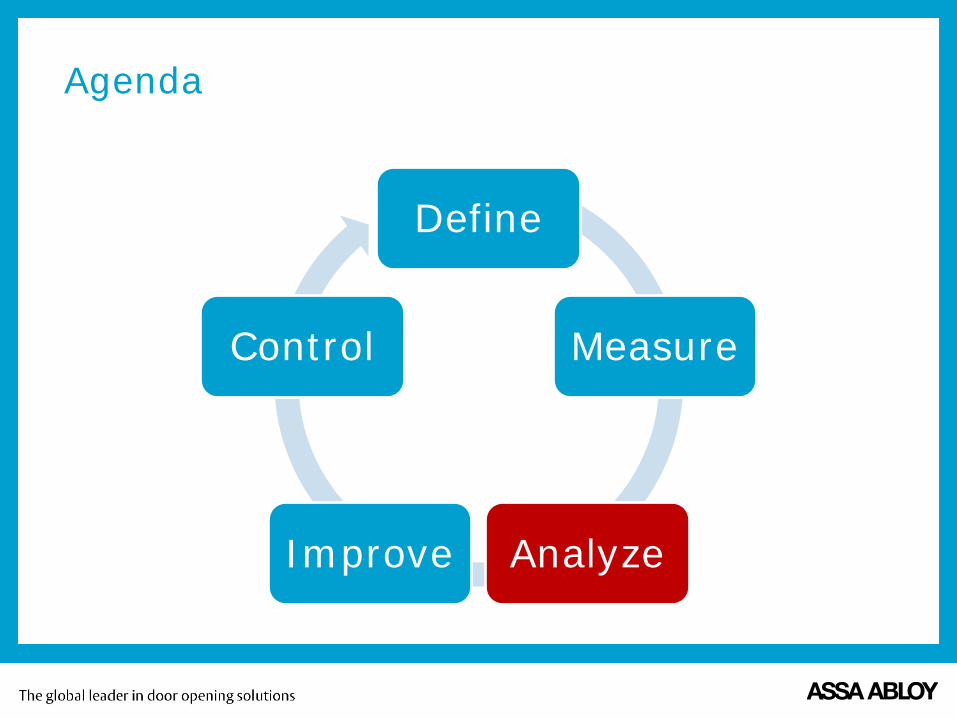
Agenda
Define
Measure
Analyze Improve
Control

What’s in it for us?
Save money – Dow Chemical: $9.8 billion – GE: $300 million – Walmart: $11 million
Build customer loyalty – 2/3 of consumers believe they “have a responsibility to
purchase products that are good for the environment and society”
Attract and engage employees – 55% better morale and 38% better employee loyalty in
companies with strong sustainability programs.

Agenda
Define
Measure
Analyze Improve
Control
POLL: Has your company started its green journey?
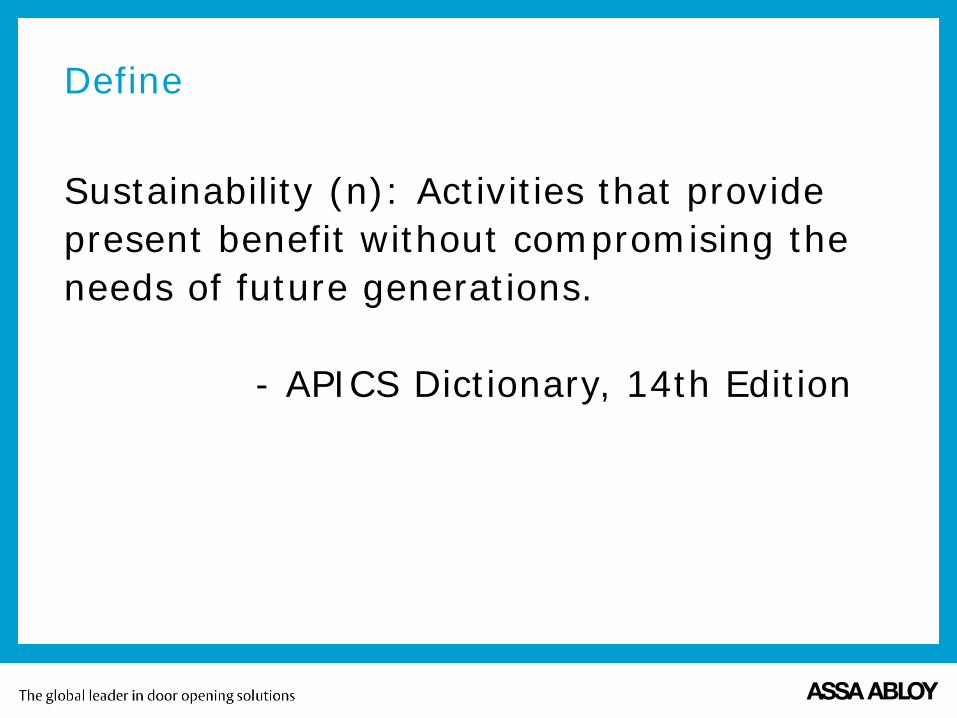
Define
Sustainability (n): Activities that provide present benefit without compromising the needs of future generations. - APICS Dictionary, 14th Edition
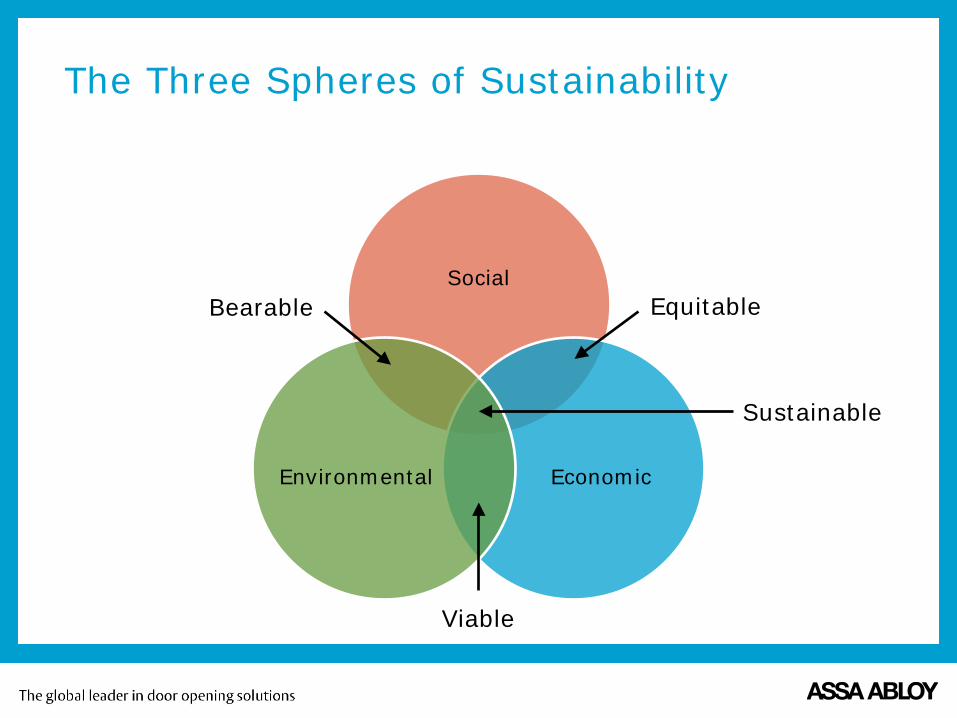
The Three Spheres of Sustainability
Social
Economic Environmental
Viable
Bearable Equitable
Sustainable
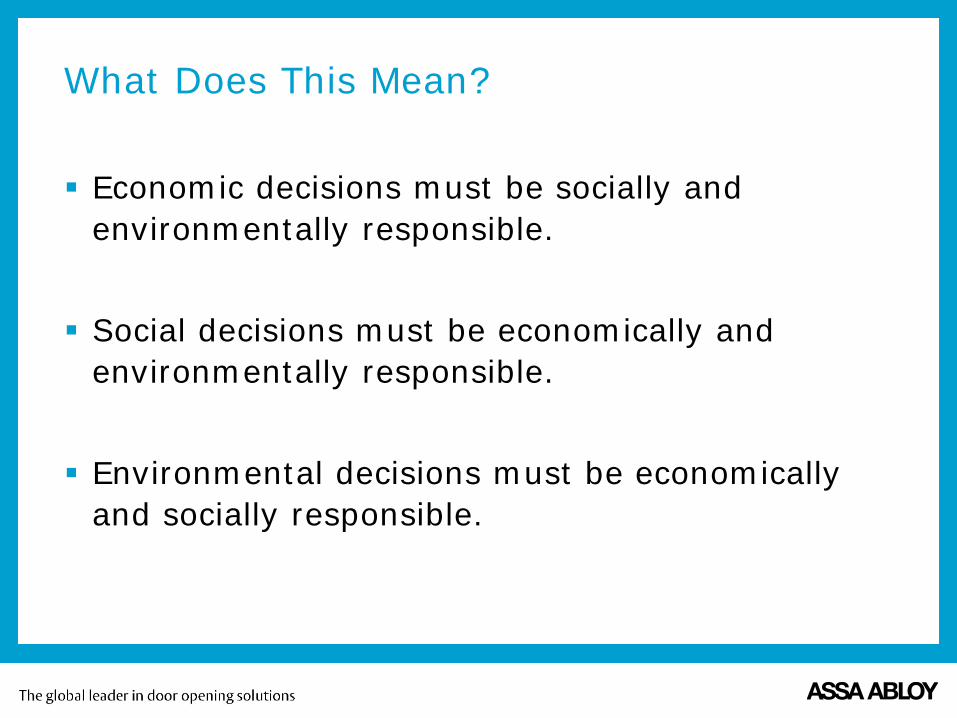
What Does This Mean?
Economic decisions must be socially and environmentally responsible.
Social decisions must be economically and environmentally responsible.
Environmental decisions must be economically and socially responsible.

Environmental Sustainability
Water Air Solids Toxins Energy
Agenda
Define
Measure
Analyze Improve
Control

POLL: Does your company measure environmental impact?

What / How Do We Measure?
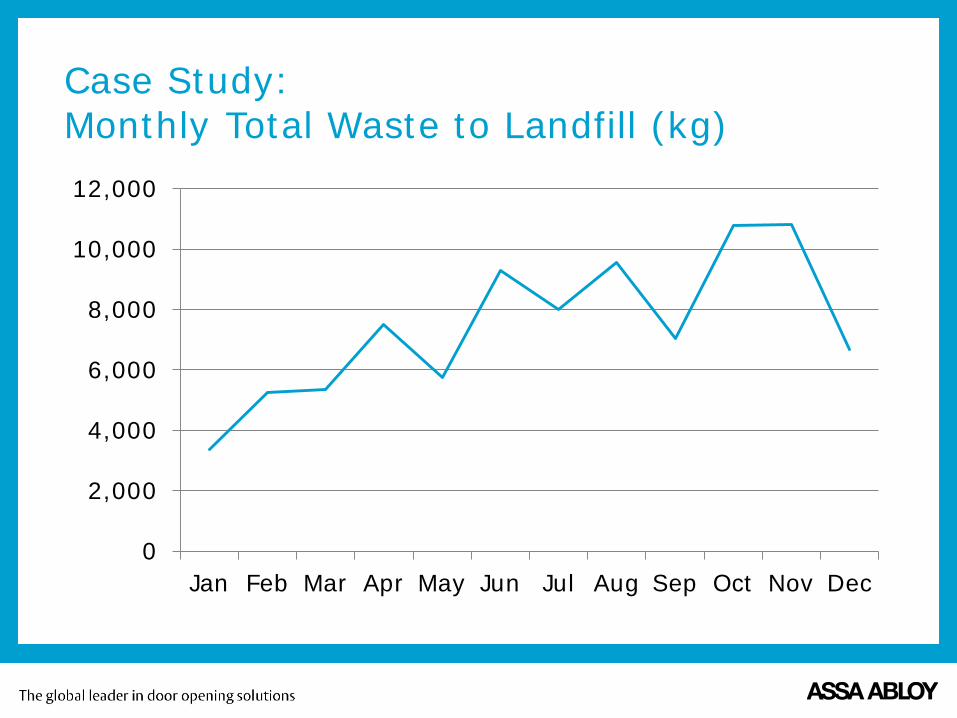
Case Study: Monthly Total Waste to Landfill (kg)
0
2,000
4,000
6,000
8,000
10,000
12,000
Jan Feb Mar Apr May Jun Jul Aug Sep Oct Nov Dec
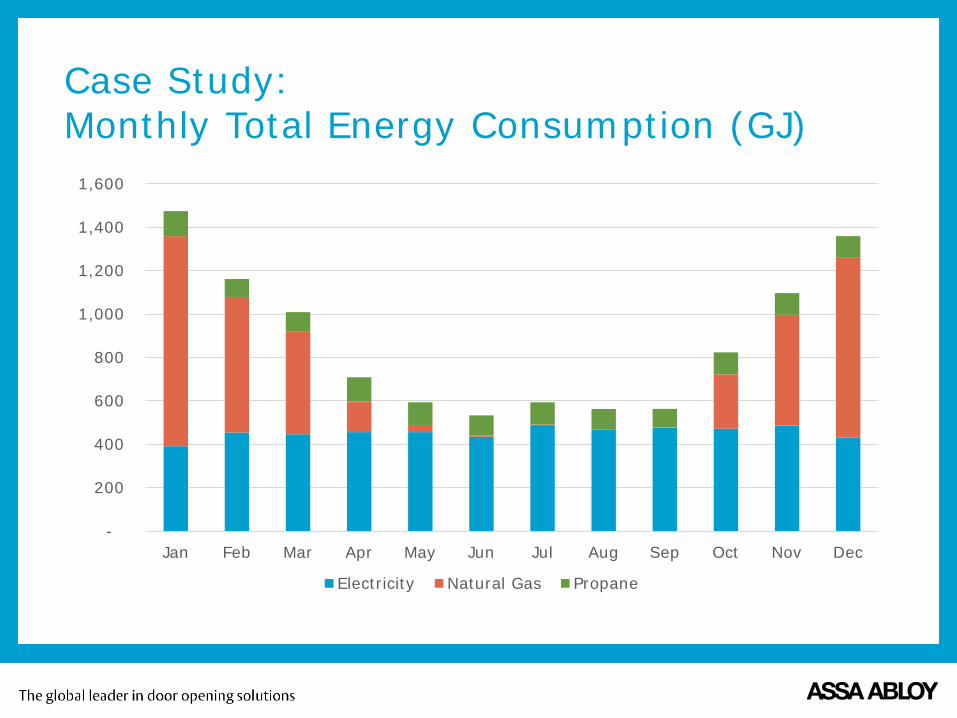
Case Study: Monthly Total Energy Consumption (GJ)
-
200
400
600
800
1,000
1,200
1,400
1,600
Jan Feb Mar Apr May Jun Jul Aug Sep Oct Nov Dec
Electricity Natural Gas Propane
Agenda
Define
Measure
Analyze Improve
Control
POLL: Are your company’s sales affected by seasonality?

Factor Out Seasonality
F+M+A+M+J+J+A+S+O+N+D+J = January
M+A+M+J+J+A+S+O+N+D+J+F = February
A+M+J+J+A+S+O+N+D+J+F+M = March
M+J+J+A+S+O+N+D+J+F+M+A = April
J+J+A+S+O+N+D+J+F+M+A+M = May

Case Study: 12-month Trailing Energy Consumption (GJ)
-
2,000
4,000
6,000
8,000
10,000
12,000
Jan Feb Mar Apr May Jun Jul Aug Sep Oct Nov Dec
Electricity Natural Gas Propane
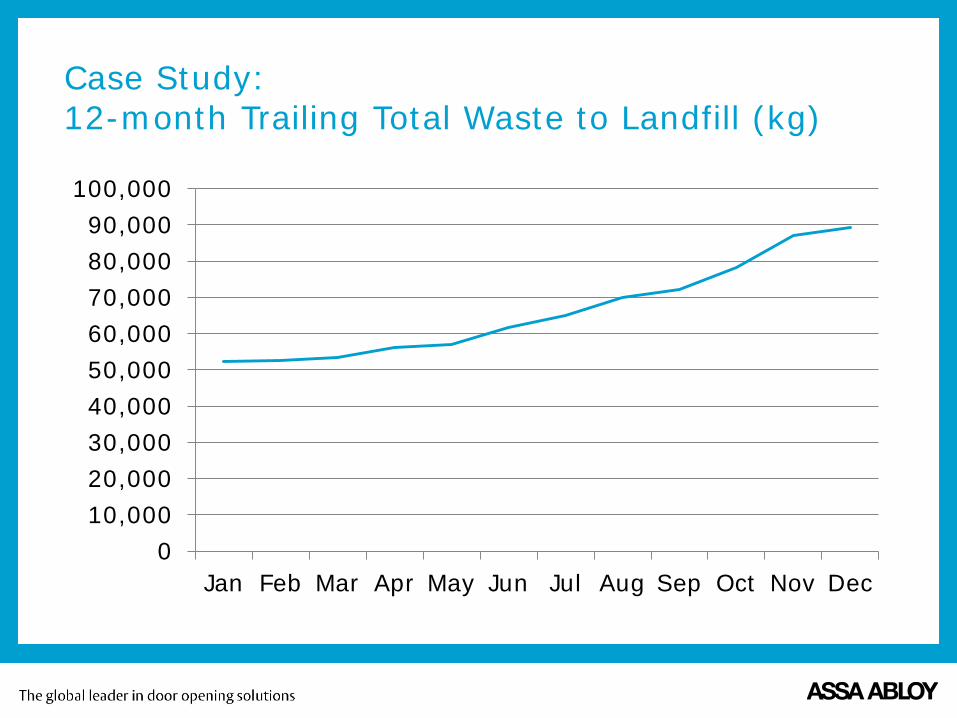
Case Study: 12-month Trailing Total Waste to Landfill (kg)
010,00020,00030,00040,00050,00060,00070,00080,00090,000
100,000
Jan Feb Mar Apr May Jun Jul Aug Sep Oct Nov Dec
POLL: Are your company’s sales growing?

Factor Out Business Volume
Intensity = input / output
Intensity = 9157 / 9472
Intensity = 0.97 GJ / ton
Productivity = output / input
Productivity = 9472 / 9157
Productivity = 1.03 tons / GJ
Input = 9157.34 gigajoules of energy
Output = 9472.35 metric tonnes of product shipped

Case Study: Solid Waste Intensity
0.0
1.0
2.0
3.0
4.0
5.0
6.0
Jan Feb Mar Apr May Jun Jul Aug Sep Oct Nov Dec

Case Study: Energy Intensity
0.750.760.770.780.790.800.810.820.830.840.85
Jan Feb Mar Apr May Jun Jul Aug Sep Oct Nov Dec

Agenda
Define
Measure
Analyze Improve
Control

POLL: Does your company have time to take on multiple simultaneous new projects?

Case Study: Prioritizing Our Improvement Efforts
1. Garbage = 47.6% of total spend
2. Electricity = 34.4% of total spend
3. Natural Gas = 10.2% of total spend
4. Propane = 4.2% of total spend
5. Cardboard = 3.5% of total spend
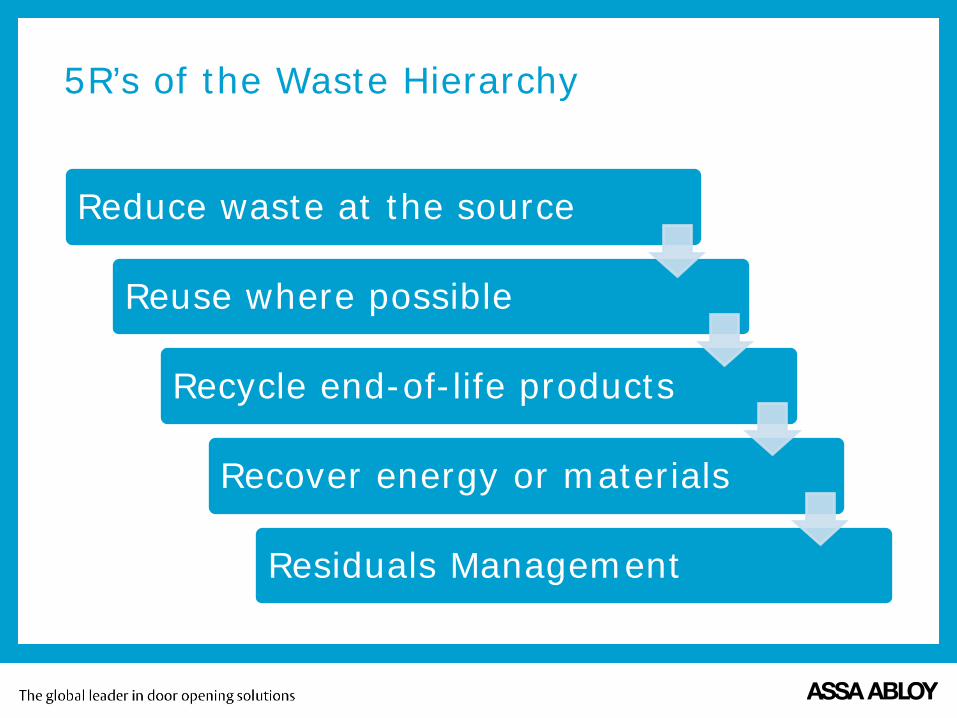
5R’s of the Waste Hierarchy
Reduce waste at the source
Reuse where possible
Recycle end-of-life products
Recover energy or materials
Residuals Management

Case Study: Waste Composition
Cardboard Recycling 30%
Scrap Metal 6%
Waste to
Landfill
64%
By Stream Cardboard 36%
Metal 21%
Other 21%
Wood 22%
Waste to Landfill
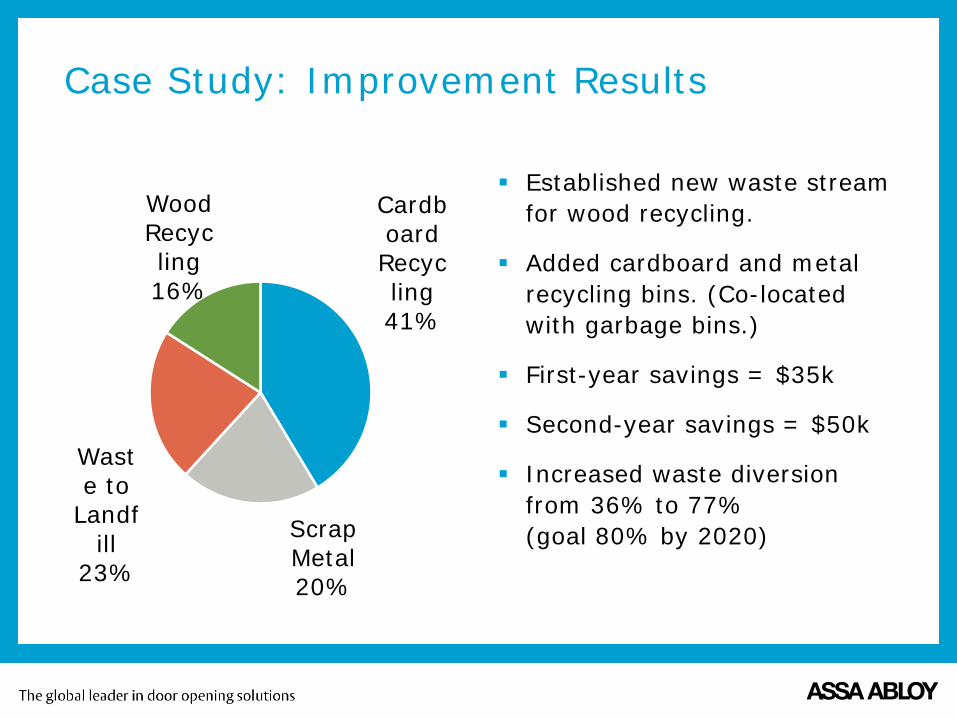
Case Study: Improvement Results
Established new waste stream for wood recycling.
Added cardboard and metal recycling bins. (Co-located with garbage bins.)
First-year savings = $35k
Second-year savings = $50k
Increased waste diversion from 36% to 77% (goal 80% by 2020)
Cardboard Recycling 41%
Scrap Metal 20%
Waste to
Landfill
23%
Wood Recycling 16%
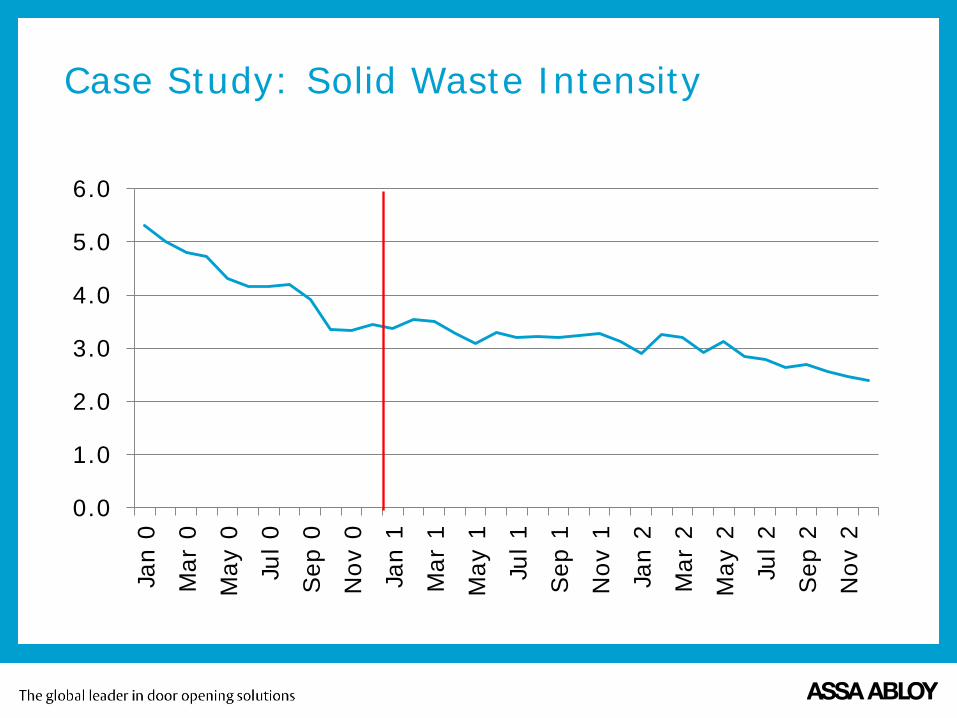
Case Study: Solid Waste Intensity
0.0
1.0
2.0
3.0
4.0
5.0
6.0
Jan
0
Mar
0
May
0
Jul 0
Sep
0
Nov
0
Jan
1
Mar
1
May
1
Jul 1
Sep
1
Nov
1
Jan
2
Mar
2
May
2
Jul 2
Sep
2
Nov
2

Divide and Conquer
1. Garbage = 47.6% of total spend
2. Electricity = 34.4% of total spend
3. Natural Gas = 10.2% of total spend
4. Propane = 4.2% of total spend
5. Cardboard = 3.5% of total spend

Energy Reduction Strategies
1. Energy Treasure Hunt – Usually a three-day event; good for low-hanging fruit.
2. Energy Audit – Good for identifying specific targets and prioritizing.
3. Energy Assessment – Deep-dive on a particular target.
Examples of Energy Reduction Opportunities from Actual Treasure Hunts Eliminate compressed air system leaks.
Turn off equipment when not in use.
Upgrade to energy efficient lighting.
Install motion sensors for interior lighting control.
Install photo cells for exterior lighting control.
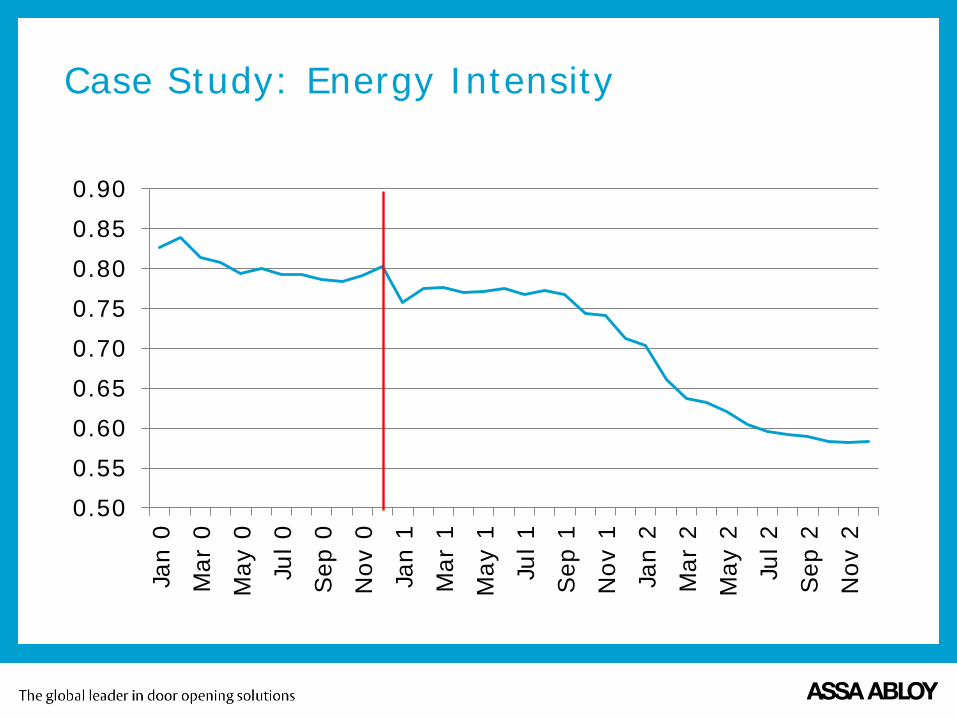
Case Study: Energy Intensity
0.500.550.600.650.700.750.800.850.90
Jan
0M
ar 0
May
0Ju
l 0Sep
0N
ov 0
Jan
1M
ar 1
May
1Ju
l 1Sep
1N
ov 1
Jan
2M
ar 2
May
2Ju
l 2Sep
2N
ov 2
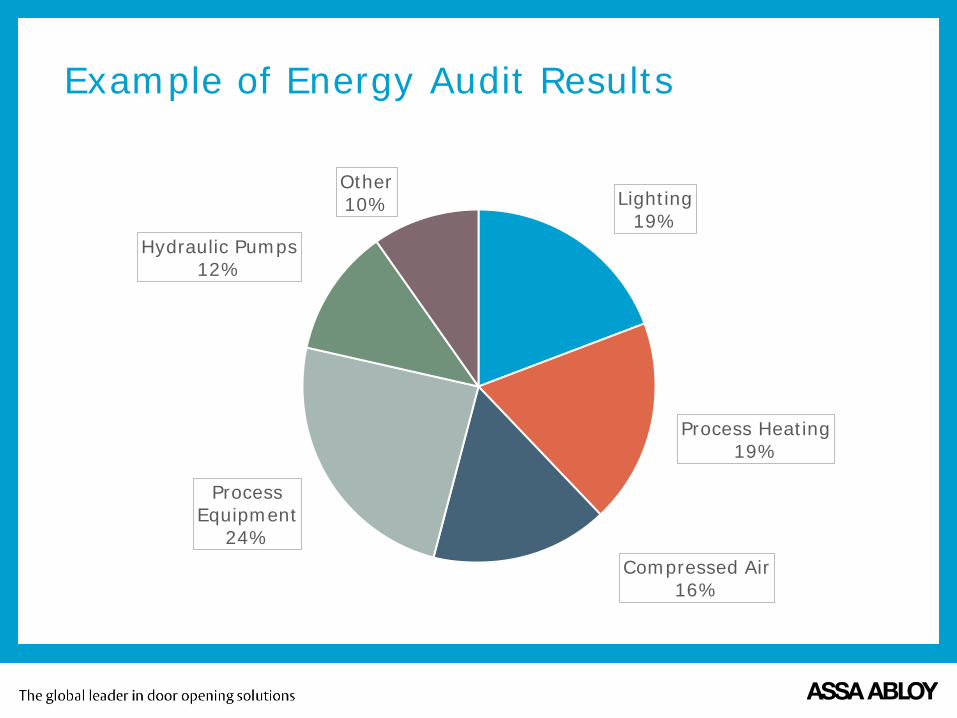
Example of Energy Audit Results
Lighting 19%
Process Heating 19%
Compressed Air 16%
Process Equipment
24%
Hydraulic Pumps 12%
Other 10%

Agenda
Define
Measure
Analyze Improve
Control
POLL: Does your company struggle to sustain improvement efforts?
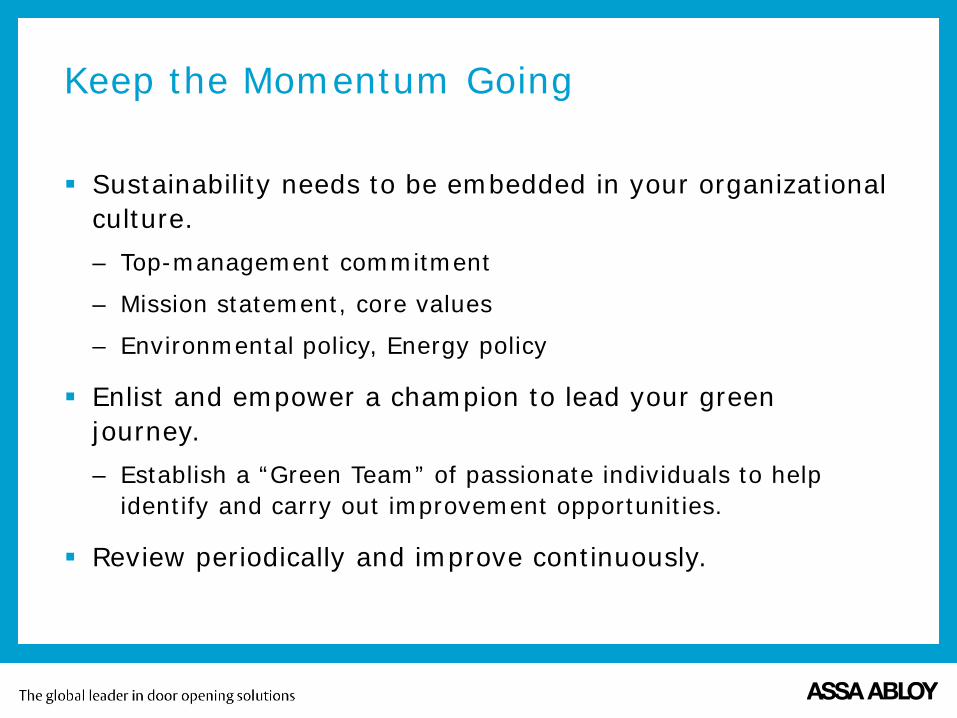
Keep the Momentum Going
Sustainability needs to be embedded in your organizational culture. – Top-management commitment
– Mission statement, core values
– Environmental policy, Energy policy
Enlist and empower a champion to lead your green journey. – Establish a “Green Team” of passionate individuals to help
identify and carry out improvement opportunities.
Review periodically and improve continuously.

Questions?