getting the most out of axis™
TRANSCRIPT

GETTING THE MOST OUT OF AXIS™
Volume 14
Consulting Actuaries
KEEPING PACE WITH HOT TRENDSEditor's words: Welcome to Volume 14 of our AXIS newsletter. This issue outlines how AXIS fits within a broader actuarial transformation and provides a deep dive into modeling registered index-linked annuities (“RILA”) in AXIS. You will find helpful tips and tricks for navigating the system and highlights of new features in recent AXIS releases. We hope you enjoy the newsletter.
IN THIS ISSUE
Executive Corner Actuarial Transformation: AXIS Modeling In A New World
In the Spotlight Modeling RILA: The Growth Engine For The Retail Annuity Market
Tips & Tricks
What's New in AXIS New Features In Recent AXIS Releases

Getting The Most Out Of AXIS™
© Oliver Wyman 2
Executive Corner
ACTUARIAL TRANSFORMATION: AXIS MODELING IN A NEW WORLD
Transformation is a #trending topic for actuaries in the insurance industry, jump-started by significant changes to regulatory calculation and reporting requirements, and fueled by a desire to shift actuarial time from manual runs or data manipulation to analytics and strategic initiatives.
In the midst of these changes, modeling actuaries may wonder: “Where does my AXIS model fit in?”
Transformation often means that larger volumes of data are being fed into actuarial models and processes, and that analytics and visualization tools are being used for more insight into model outputs. The actuarial model remains the fulcrum, where robust calculations are performed to inform pricing, valuation, financial reporting, and management actions.
This article examines three recurring themes related to actuarial transformation:
• Where the AXIS model fits within a transformedactuarial ecosystem
• How to maximize the return on your AXIS model
• How centralization of the model developmentfunction can increase efficiency
THE BIG PICTUREWhere the AXIS model fits within a transformed actuarial ecosystem
In a production environment, the AXIS model’s contribution should align with its primary function: performing actuarial calculations.
Some companies are reevaluating patchwork data and process solutions that evolved over time as business needs changed or became more demanding. In a transformed actuarial ecosystem, data mapping and assumptions may be moved outside the model and managed by the IT team. To process data inputs and model outputs, tools such as Python and Alteryx are
becoming more prevalent as they support advanced data processing and analytics.
Such a transformed ecosystem may better optimize the use of model development resources by reducing manual data manipulation and streamlining model updates and analysis.

© Oliver Wyman 3
Getting The Most Out Of AXIS™
Exhibit 1: Example of a transformed actuarial ecosystem
XLS JS
Data validation reports
Trigger/user interface
Virtual machine to runPython scripts
In-force/supplementarydata
Actuarial database
Centralization of input, output &assumption data enablesstreamlined & granular reporting
Pre-model adjustments Legend
Cloud services
AXIS virtual machine
AXIS runorchestration
Pre-model
Assumptions
Dashboards provide drilldown capability to enable easier data validation and analysis of results
Triggers automatically runPython scripts based ontime, file availability, oruser instructions
Reporting topsides
General ledger
Post-model
Reports and exhibits
XLS
XLS
Cloud environment allows scaling up and down compute resources on demand to manage costs
Cloud services
Virtual machine
Python
JS
Javascript trigger
Data visualizationdashboard
Alteryx
SQL datawarehouse
AXIS Model
Source: Oliver Wyman Analysis
Transformation often means that larger volumes of granular data are being fed into actuarial models and processes

Getting The Most Out Of AXIS™
© Oliver Wyman 4
ZOOMING INHow to maximize the return on your AXIS model
Automating production runs in AXIS reduces manual effort while increasing transparency and controls, maximizing efficiency of AXIS models and processes.
In a transformed model run environment, developing an externalized runbook can provide an interface for users to detail key requirements of each production run, including the AXIS Dataset, Batches and reports to be used, and run priority. The runbook would then feed an EnterpriseLink script, a high-level process that can manipulate and parametrize multiple models with limited manual intervention.
These scripts can be used in conjunction with Version Control project functionality in EnterpriseLink, ensuring an auditable and well-governed trail of inputs, models, and outputs.
When relying on a runbook to streamline AXIS runs, care should be taken to balance efficient and auditable models with runtime and transparency. For example, poor model design decisions may reduce transparency, complicate model Version Control and increase runtime.
PERFORMANCEHow centralization of the model development function can increase efficiency
There is a trend towards greater centralization of model development, with a goal of increasing organizational efficiency and consistency across actuarial functions. Rather than various functions such as valuation, projections, pricing, and inforce management each maintaining and running their own models, a centralized model development team works on behalf of all end users.
Potential benefits of a centralized model development function include:
• Stronger development of the technical skillset for actuarial modeling within a focused group
• Consistent model development practices across functions
• Increased model controls and governance and reduced risk of modeling errors
• Removal of “model merges” or “consistency checks” between models developed by different teams
• Reduced key person risk
CONCLUSION
The actuarial landscape is evolving and adapting as regulatory requirements and strategic initiatives spur companies to invest in a transformed actuarial ecosystem. An optimized actuarial model is at the center of this future state; thus, in order to reap
the full benefits of transformation, actuaries and stakeholders must critically evaluate how AXIS models will be developed, managed, parameterized and used.

© Oliver Wyman 5
Getting The Most Out Of AXIS™
ENABLING AND RENAMING MULTIPLE REPORTS USING THE OUTPUT MANAGER
The output manager in AXIS can be used to edit multiple reports or outputs. This allows the user to modify the desired outputs in a single screen without clicking through individual reports in a Batch.
The following example demonstrates how this functionality can be leveraged in a "CY projection recalculation" Batch:
• Right-click the Batch, select Output Manager under the Advanced section
• Under the Output Manager, the user can change
the output location and rename or enable/disable multiple calendar year reports in a single window
Tips & Tricks
Getting The Most Out Of AXIS™
© Oliver Wyman 6
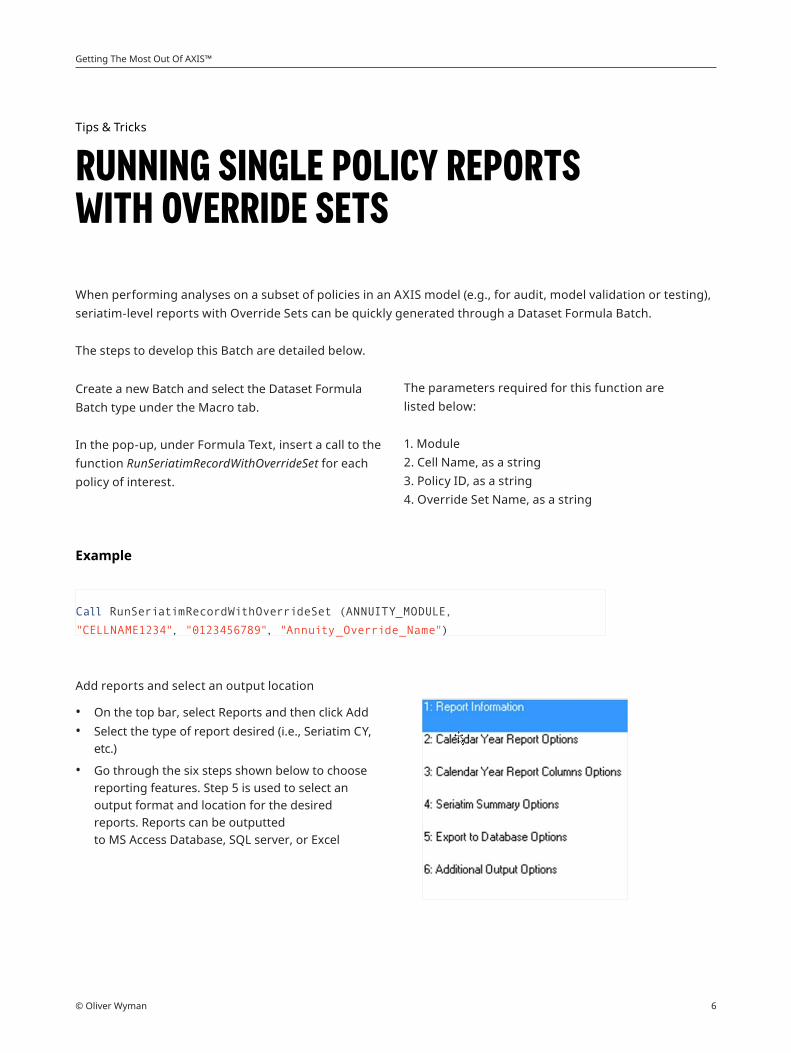
RUNNING SINGLE POLICY REPORTS WITH OVERRIDE SETS
When performing analyses on a subset of policies in an AXIS model (e.g., for audit, model validation or testing), seriatim-level reports with Override Sets can be quickly generated through a Dataset Formula Batch.
The steps to develop this Batch are detailed below.
The parameters required for this function are listed below:
1. Module2. Cell Name, as a string3. Policy ID, as a string4. Override Set Name, as a string
Create a new Batch and select the Dataset Formula Batch type under the Macro tab.
In the pop-up, under Formula Text, insert a call to the function RunSeriatimRecordWithOverrideSet for each policy of interest.
Example
Call RunSeriatimRecordWithOverrideSet (ANNUITY_MODULE,
"CELLNAME1234", "0123456789", "Annuity_Override_Name")
Add reports and select an output location
• On the top bar, select Reports and then click Add• Select the type of report desired (i.e., Seriatim CY,
etc.)
• Go through the six steps shown below to choose reporting features. Step 5 is used to select an output format and location for the desired reports. Reports can be outputtedto MS Access Database, SQL server, or Excel
Tips & Tricks

© Oliver Wyman 7
Getting The Most Out Of AXIS™
MODELING RILA: THE GROWTH ENGINE FOR THE RETAIL ANNUITY MARKET
Registered index-linked annuities (RILA) were created a mere decade ago but have since taken the annuity market by storm. With year-over-year growth rates reaching 55% in 2019 and 38% in 2020, RILA sales now make up 11% of 2020 US annuity sales (see Exhibit 2).
Competition in the RILA space is currently limited, but there is significant interest from both variable annuity (VA) and fixed indexed annuity (FIA) writers. This article provides a general overview of RILA, as well as key success factors in modeling them in AXIS.
Exhibit 2: US retail annuity sales by product type (%)
Non-registered products (FA, FIA, SPIA, DIA, SS)
57%
2018
38%
5%
2019
58%
35%
7%
2020
55%
34%
11%
VA RILA
Source: Secure Retirement Institute, US. Individual Annuity Sales Survey, 2019/2020, US Annuity sales, 2018 Q4 US Annuity sales
In the Spotlight

Getting The Most Out Of AXIS™
© Oliver Wyman 8
WHAT IS A RILA?A RILA is a deferred annuity that allows index-linked upside potential in exchange for sharing some downside risk. It was created to bridge the gap between FIA and VA. Exhibit 3 below compares key base product features across each of these products.
Exhibit 3: Product comparison
Fixed indexed annuity (FIA)
Registered index-linked annuity (RILA)
Variable annuity (VA)
Equity market participation
Downside protection
Cost of downside protection $$ $ NA
Upside potential
SEC filing requirement (classified as a security)
Credited rate profile (illustrative)
Index value Index value Index value
RILA provides less downside protection to policyholders than FIA with the trade-off of higher upside potential. RILA downside protection is typically provided in the form of either buffer or floor payoff design. Under the floor design, the policyholder is exposed to losses up to a defined amount, while the buffer design defines the downside covered by the insurer, with the policyholder absorbing all losses beyond the buffer amount.
For example, consider a scenario of -15% market returns. Under a -10% floor design, the policyholder will experience a -10% return. Under a -10% buffer design, the policyholder will experience a -5% return, the excess loss beyond the -10% buffer.
With year-over-year growth rates reaching 55% in 2019 and 38% in 2020, RILA sales now make up 11% of 2020 US annuity sales

© Oliver Wyman 9
Getting The Most Out Of AXIS™
MODELING RILA IN AXISAXIS provides an integrated modeling system for RILA, which allows complex product components, credited interest (and associated hedging) and reserves to be accurately calculated. AXIS further provides granular reports to gain a thorough understanding of product risks and mechanics.
PRODUCT COMPONENTS
RILA contain multiple intricate product features, with some key variations including buffer versus floor account designs, investment into various indexes, and allocations between these accounts. GLWB riders are rare for these products but can be modeled in AXIS and significantly alter the product profitability profile.
AXIS functionalityAXIS provides built-in functionality for modeling index returns for buffer and floor account designs, as detailed in Exhibit 4. Investment Accounts can be created for each account design (i.e., combination of index option and buffer/floor design), and Allocation
Rules tables can be used to specify the proportion of funds allocated to each account. The “Target allocation table [Formula]” provides great flexibility for adjusting allocations by duration, policyholder characteristics, etc.
Exhibit 4: Implementing a Buffer/Floor investment account designInvestment Account— Buffer vs Floor

Getting The Most Out Of AXIS™
© Oliver Wyman 10
CREDITED INTEREST AND HEDGING
Insurers’ exposure to market risk under a RILA can be minimized by having a well-replicated portfolio of index hedges, and AXIS is able to model the hedges accurately. Hedges under a RILA can be complex and may influence the Investment Account credited rate.
AXIS functionalityAs shown in Exhibit 5, AXIS’s “EIA credited rate [Formula]” table allows for an intuitive, bottom-up approach to specify the Investment Account return profile and model hedge assets that replicate this position.
AXIS allows for static and dynamic hedging and for the hedge ratio to be reduced by considering expected decrements.
AXIS further allows for solving of the cap rate (with the floor or buffer amount set to a specific value), which allows the option budget to be an input. Word of caution: if the option budget is less than or equal
to 0, the function automatically returns the specified “Minimum cap rate”. This may cause an issue, because AXIS may not solve for a cap rate to exhaust the option budget in this case. To avoid this, you can floor the option budget to a negligible amount above 0 (e.g., 0.00001).
Alternatively, AXIS recently introduced a new "EIA by replicate portfolio [Formula]" table in version 2021.05.00 ( Job 59541). This table allows users to create their own index credit/hedge strategy that may not fit into the buffer/minimum rate options in the "EIA credited rate [Formula]" table and can be useful for implementing more creative RILA products.
Exhibit 5: Hedge strategy example (“EIA credited rate [Formula]” table)
RESERVING
RILA are subject to VM-21 and require asset and liability projections under a range of economic scenarios.
AXIS functionalityAXIS contains embedded block functionality to model reserves using nested stochastic calculations under specified valuation frequency and will interpolate
reserves between valuation dates. Reserves can also be specified as a percentage of account value or as a percentage of a formulaic reserve.
© Oliver Wyman 11
Getting The Most Out Of AXIS™
GRANULAR REPORTS
RILA is a complex products, especially when riders are included. It is important to model the product under a variety of scenarios to fully understand the product dynamics.
AXIS functionalityAXIS provides many out-of-the-box reports that are helpful for performing single policy testing and understanding product profitability and risk.
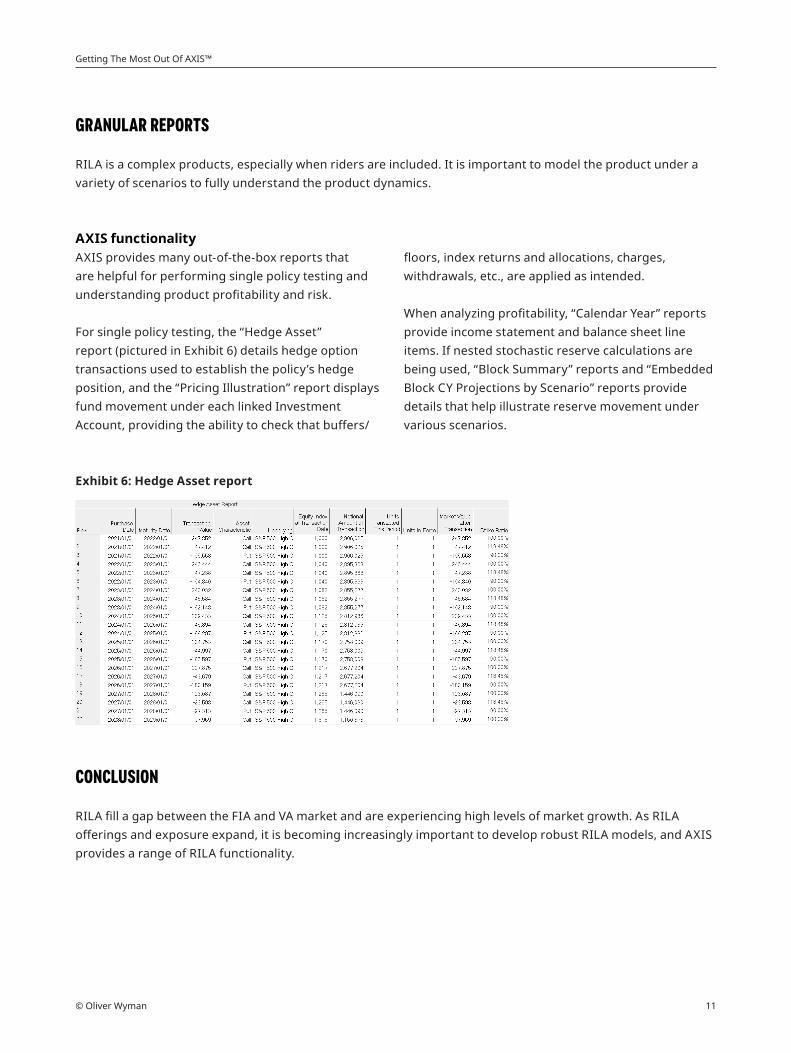
For single policy testing, the “Hedge Asset” report (pictured in Exhibit 6) details hedge option transactions used to establish the policy’s hedge position, and the “Pricing Illustration” report displays fund movement under each linked Investment Account, providing the ability to check that buffers/
floors, index returns and allocations, charges, withdrawals, etc., are applied as intended.
When analyzing profitability, “Calendar Year” reports provide income statement and balance sheet line items. If nested stochastic reserve calculations are being used, “Block Summary” reports and “Embedded Block CY Projections by Scenario” reports provide details that help illustrate reserve movement under various scenarios.
Exhibit 6: Hedge Asset report
CONCLUSION
RILA fill a gap between the FIA and VA market and are experiencing high levels of market growth. As RILA offerings and exposure expand, it is becoming increasingly important to develop robust RILA models, and AXIS provides a range of RILA functionality.

Getting The Most Out Of Axis™
© Oliver Wyman 12
WHAT’S NEW IN AXIS
NEW FEATURES IN RECENT AXIS RELEASES
Description Details
Annuitization phase monthly mortality formula table
• In the Annuity Module, the Formula Table "Monthly Mortality" was added for the "Actuarial Assumptions Mortality Annuitization phase" section. Up to 10 Child Mortality Tables can be used in the Formula Table to adjust mortality in the annuitization phase
• Version 20210800Learn more• https://www.ggy.
com/BugEnhance/UpdateDetail/30630/
GAAP TI Link ‐ current period reporting
• This functionality is available in GAAP TI Link under Feature Code 649. By enabling "Historical reporting period" options in the US GAAP section of the Dataset Parameter, cash flows and accumulated values from the beginning of the reporting period can now be generated in the "US GAAP Current Reporting" Batch
• Version 20211000Learn more• https://www.ggy.
com/BugEnhance/UpdateDetail/30781/
GAAP TI ‐ deferrable costs details
• A detailed “Deferrable Costs Details” report is now available for the following Modules: Annuity, Disability, Par Products and Universal Life
• The report provides additional rows for deferrable commissions, deferrable expenses and DAC ceded allowances in the "DAC/SIA/URL Details" section
• Version 20210800Learn more• https://www.ggy.
com/BugEnhance/UpdateDetail/30633/

About Oliver Wyman
Oliver Wyman is a global leader in management consulting. With offices in 60 cities across 29 countries, Oliver Wyman combines deep industry knowledge with specialized expertise in strategy, operations, risk management, and organization transformation. The firm has more than 5,000 professionals around the world who work with clients to optimize their business, improve their operations and risk profile, and accelerate their organizational performance to seize the most attractive opportunities. Oliver Wyman is a business of Marsh McLennan[NYSE: MMC].
The Actuarial Practice of Oliver Wyman has life, health, and property & casualty actuaries that advise financial institutions, insurance companies, regulators, and self-insured entities across a broad spectrum of risk management issues. With over 400 professionals in over 20 offices across North America, the Caribbean and Europe, the firm’s consulting actuaries provide independent, objective advice, combining a wide range of expertise with specialized knowledge of specific risks.
Moody's Analytics shall have no liability in respect of the views and opinions expressed in this report.
For more information, please contact:
Copyright ©2021 Oliver Wyman
All rights reserved. This report may not be reproduced or redistributed, in whole or in part, without the written permission of Oliver Wyman and Oliver Wyman accepts no liability whatsoever for the actions of third parties in this respect.
The information and opinions in this report were prepared by Oliver Wyman. This report is not investment advice and should not be relied on for such advice or as a substitute for consultation with professional accountants, tax, legal or financial advisors. Oliver Wyman has made every effort to use reliable, up-to-date and comprehensive information and analysis, but all information is provided without warranty of any kind, express or implied. Oliver Wyman disclaims any responsibility to update the information or conclusions in this report. Oliver Wyman accepts no liability for any loss arising from any action taken or refrained from as a result of information contained in this report or any reports or sources of information referred to herein, or for any consequential, special or similar damages even if advised of the possibility of such damages. The report is not an offer to buy or sell securities or a solicitation of an offer to buy or sell securities. This report may not be sold without the written consent of Oliver Wyman.
Dean Kerr, FSA, ACIA, [email protected]
Bryan Lindsley, FSA, [email protected]
Chris Whitney, FSA, [email protected]
David Weinsier, FSA, [email protected]
Oliver Wyman – A business of Marsh McLennan www.oliverwyman.com