getting to the local shopping district
TRANSCRIPT
Getting to the Local Shopping DistrictTravel and Spending Patterns in the Temescal District of Oakland, Calif.Sara Barz, Master of City Planning, UC Berkeley, 2015Jessica Nguyen, Master of City Planning & Public Health, UC Berkeley, 2015
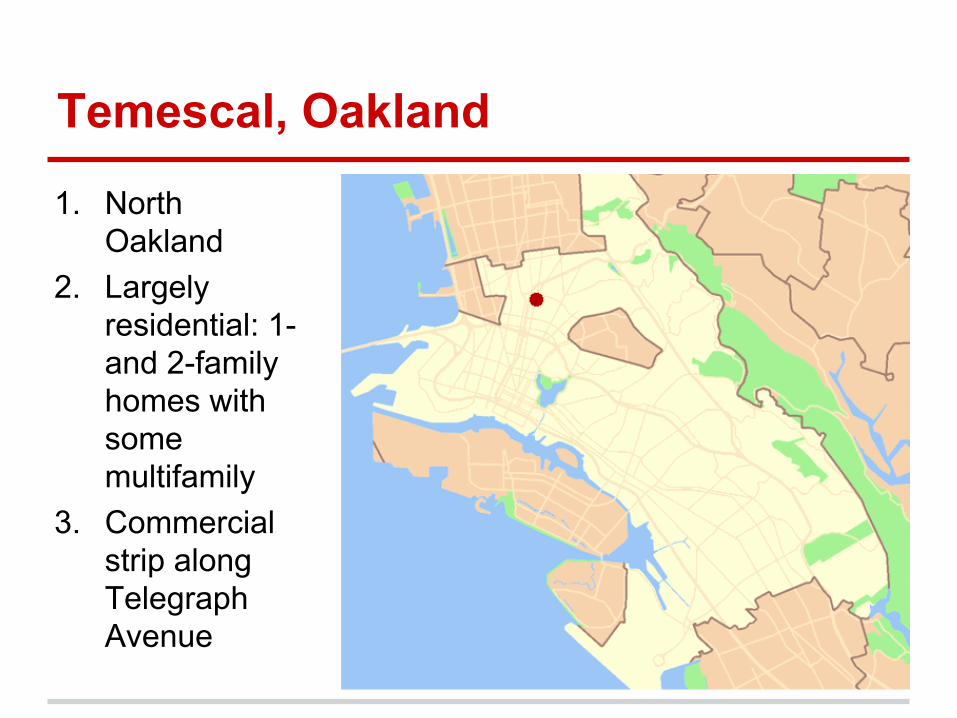
Temescal, Oakland
1. North Oakland
2. Largely residential: 1- and 2-family homes with some multifamily
3. Commercial strip along Telegraph Avenue

Temescal, Oakland
1. North Oakland
2. Largely residential: 1- and 2-family homes with some multifamily
3. Commercial strip along Telegraph Avenue

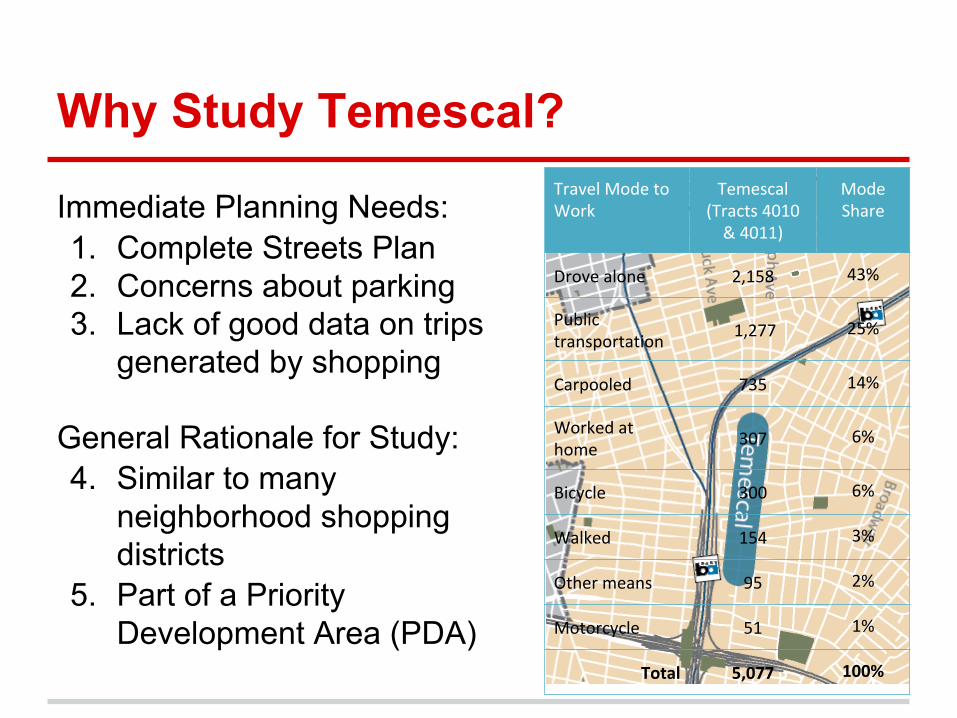
Why Study Temescal?
Immediate Planning Needs:1. Complete Streets Plan2. Concerns about parking3. Lack of good data on trips
generated by shopping
General Rationale for Study:4. Similar to many
neighborhood shopping districts
5. Part of a Priority Development Area (PDA)
Why Study Temescal?
Immediate Planning Needs:1. Complete Streets Plan2. Concerns about parking3. Lack of good data on trips
generated by shopping
General Rationale for Study:4. Similar to many
neighborhood shopping districts
5. Part of a Priority Development Area (PDA)
Travel Mode to Work
Temescal (Tracts 4010
& 4011)
Mode Share
Drove alone 2,158 43%
Public transportation
1,277 25%
Carpooled 735 14%
Worked at home
307 6%
Bicycle 300 6%
Walked 154 3%
Other means 95 2%
Motorcycle 51 1%
Total 5,077 100%

Study Objectives1. Understand merchant concerns and perceptions about
how shoppers and employees travel to the Temescal District
2. Quantify travel and spending behavior generated from commercial activity
3. Identify where shoppers live and how much they spend in relation to how far they live from the Telegraph Avenue shopping corridor

Methods
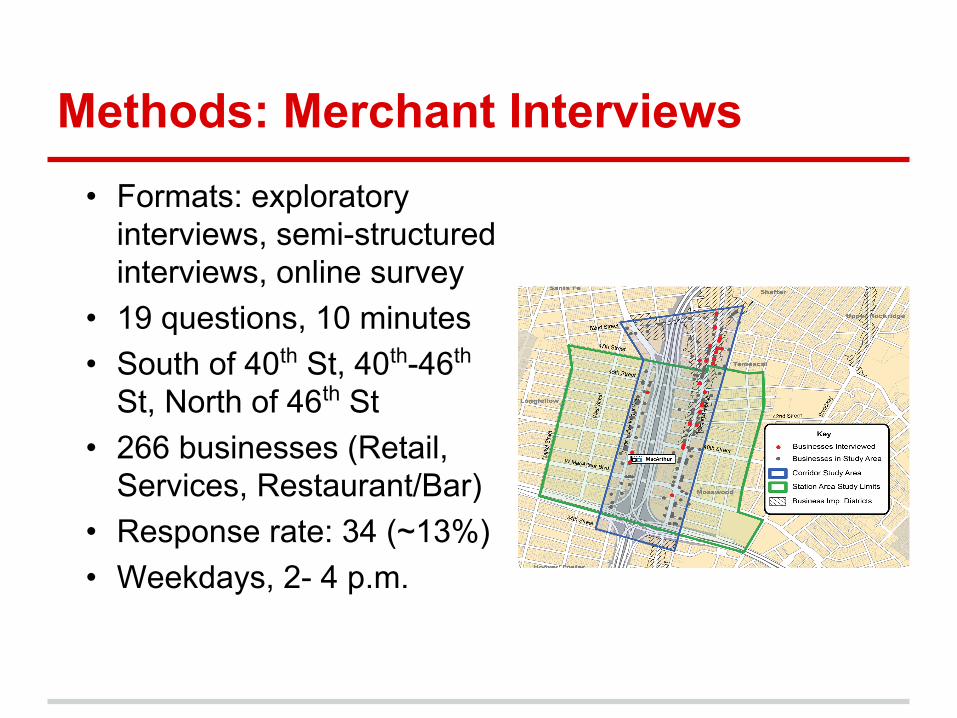
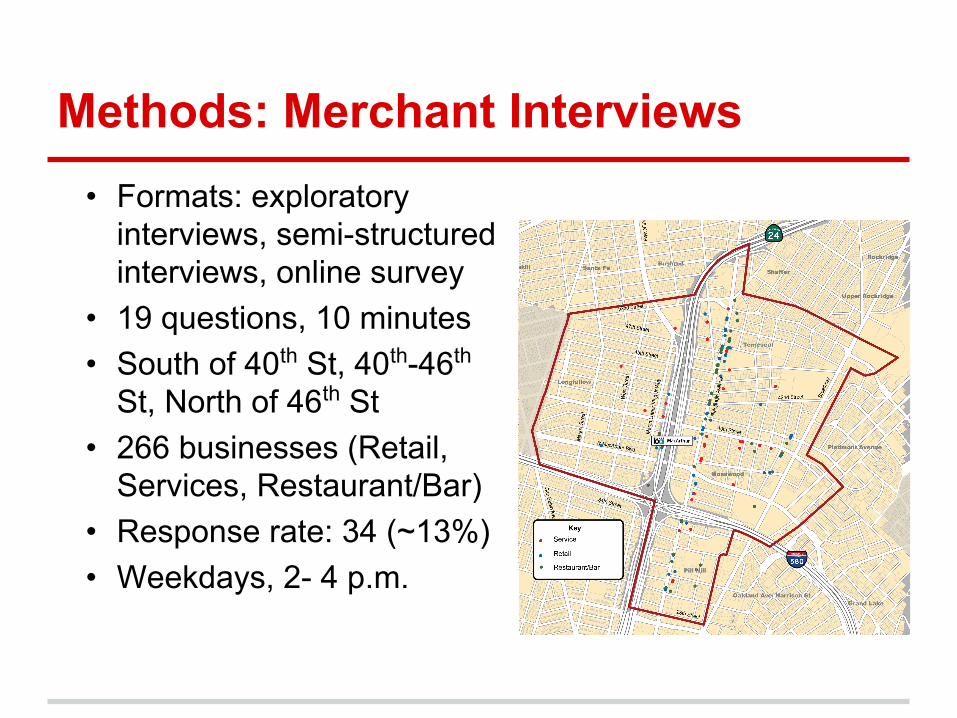
Methods: Merchant Interviews• Formats: exploratory
interviews, semi-structured interviews, online survey
• 19 questions, 10 minutes• South of 40th St, 40th-46th
St, North of 46th St• 266 businesses (Retail,
Services, Restaurant/Bar)• Response rate: 34 (~13%)• Weekdays, 2- 4 p.m.
Methods: Merchant Interviews• Formats: exploratory
interviews, semi-structured interviews, online survey
• 19 questions, 10 minutes• South of 40th St, 40th-46th
St, North of 46th St• 266 businesses (Retail,
Services, Restaurant/Bar)• Response rate: 34 (~13%)• Weekdays, 2- 4 p.m.
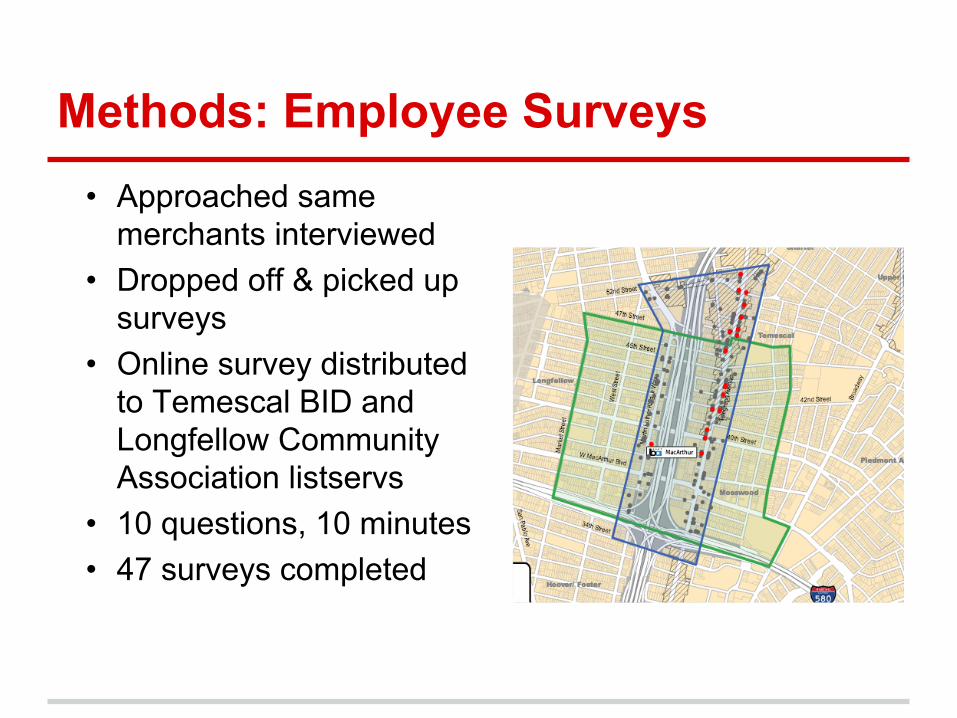
Methods: Employee Surveys• Approached same
merchants interviewed• Dropped off & picked up
surveys• Online survey distributed
to Temescal BID and Longfellow Community Association listservs
• 10 questions, 10 minutes• 47 surveys completed
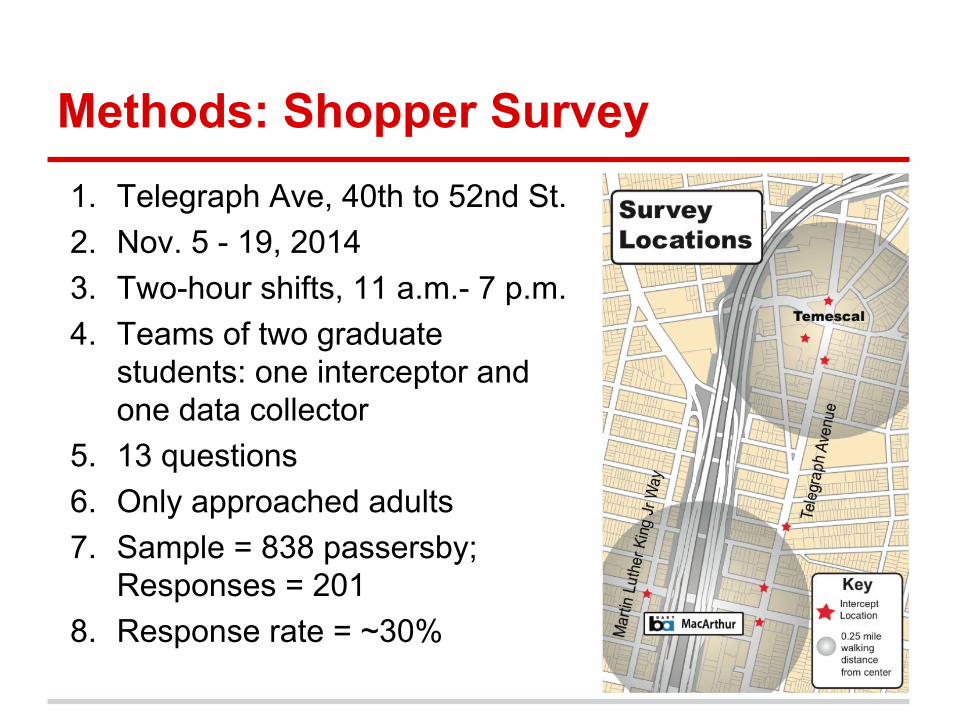
Methods: Shopper Survey1. Telegraph Ave, 40th to 52nd St.2. Nov. 5 - 19, 20143. Two-hour shifts, 11 a.m.- 7 p.m.4. Teams of two graduate
students: one interceptor and one data collector
5. 13 questions6. Only approached adults7. Sample = 838 passersby;
Responses = 2018. Response rate = ~30%

Methods: Shopper Survey1. Telegraph Ave, 40th to 52nd St.2. Nov. 5 - 19, 20143. Two-hour shifts, 11 a.m.- 7 p.m.4. Teams of two graduate
students: one interceptor and one data collector
5. 13 questions6. Only approached adults7. Sample = 838 passersby;
Responses = 2018. Response rate = ~30%
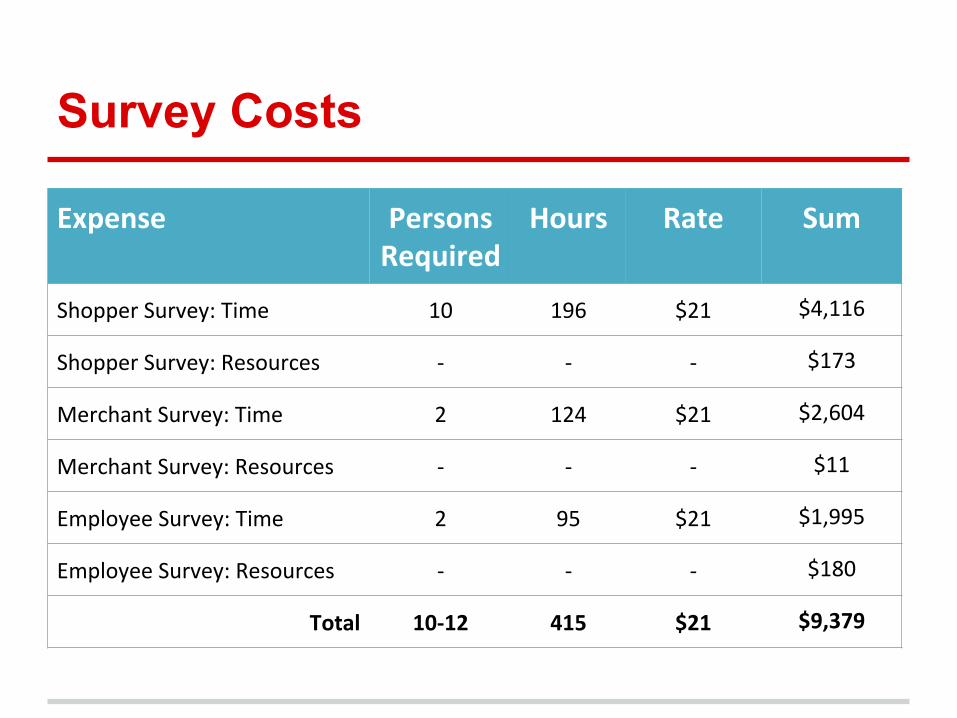
Survey Costs
Expense Persons Required
Hours Rate Sum
Shopper Survey: Time 10 196 $21 $4,116
Shopper Survey: Resources - - - $173
Merchant Survey: Time 2 124 $21 $2,604
Merchant Survey: Resources - - - $11
Employee Survey: Time 2 95 $21 $1,995
Employee Survey: Resources - - - $180
Total 10-12 415 $21 $9,379

Findings

Objective #1Understand merchant concerns and perceptions about how shoppers and employees travel to the Temescal District
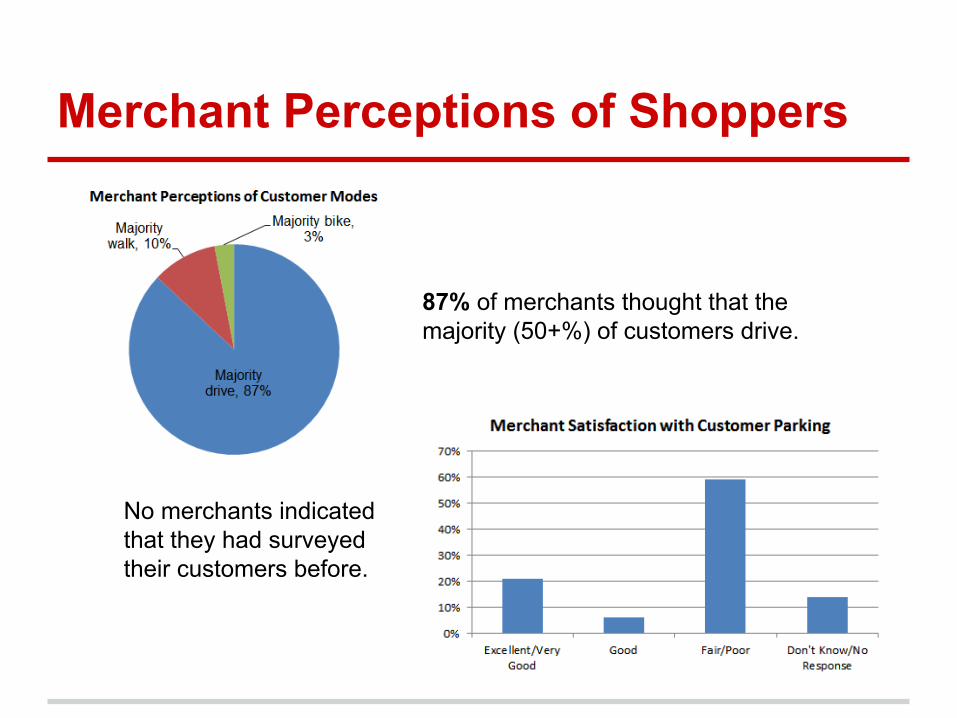
Merchant Perceptions of Customer Modes
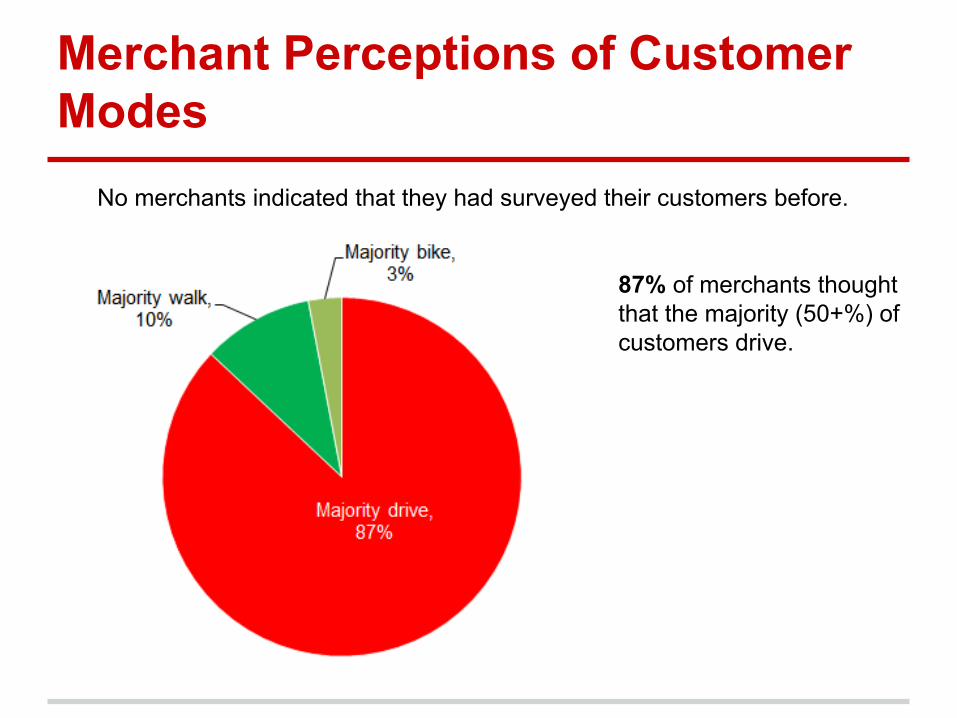
No merchants indicated that they had surveyed their customers before.
87% of merchants thought that the majority (50+%) of customers drive.

Merchant Satisfaction with Customer Parking
Almost 60% of merchants were dissatisfied with parking available for customers.

Merchant Perceptions of EmployeesEmployee Commute to Work
Merchant Perceptions of Employee Commute
Objective #2Quantify travel and spending behavior generated from commercial activity in the Temescal District

Shopper Travel Mode Share
N = 200
BART15%
Bus11%
Walk27%
Drive alone23%
Drive with others orcarpool
15%
Bicycle4%
Multiple modes6% On the Survey Day,
the largest share (27%) of shoppers reached the district by walking.
Other1%
Transit 25%
Active30%
Driving39%
Multiple/ Other6%

Weekday v. Weekend ComparisonSaturdayWeekday
N = 77 N = 123
BART16%
Bus12%
Walk29%
Drive alone23%
Drive with others
13%
Multiple modes, 5%
Other, 1%
Bicycle1%
BART14%
Bus10%
Drive alone23%
Drive with others
16%
Multiple modes, 7%
Bicycle5%
Walk26%
Survey Spending by Travel Mode
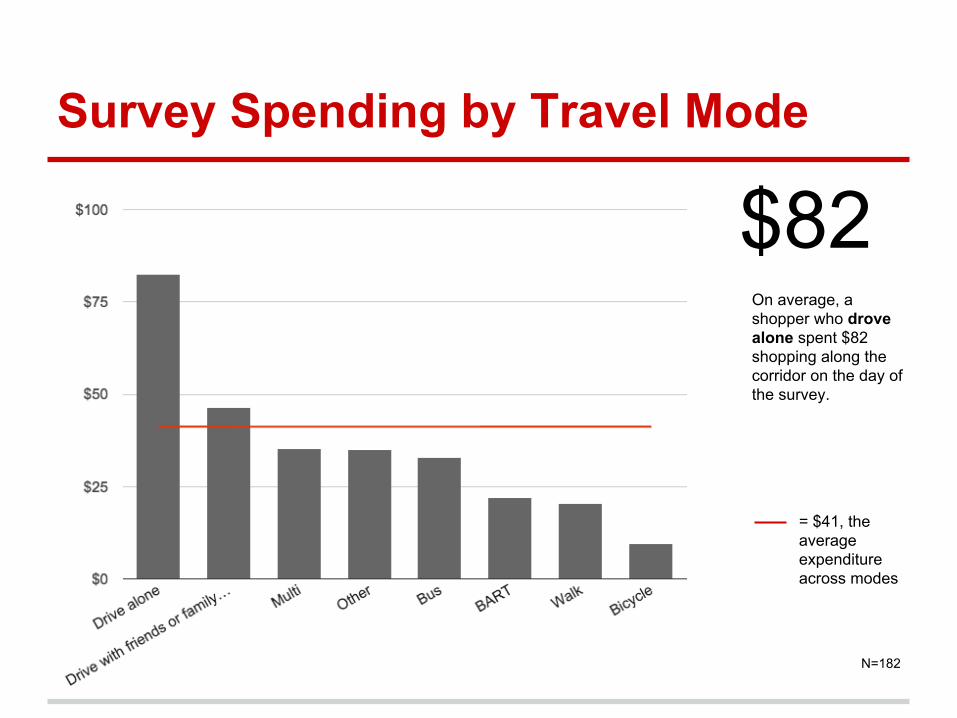
$82On average, a shopper who drove alone spent $82 shopping along the corridor on the day of the survey.
$45
$37
$33
$29 $24$22
$21 $20
N=182
= $41, the average expenditure across modes
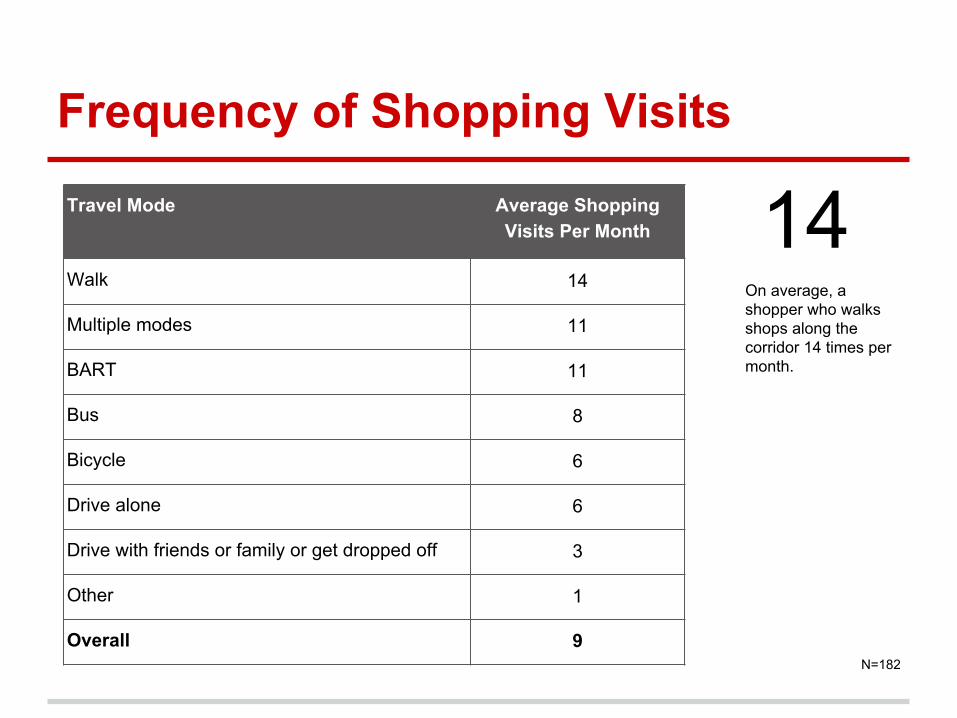
Frequency of Shopping Visits
Travel Mode Average Shopping Visits Per Month
Walk 14
Multiple modes 11
BART 11
Bus 8
Bicycle 6
Drive alone 6
Drive with friends or family or get dropped off 3
Other 1
Overall 9
On average, a shopper who walks shops along the corridor 14 times per month.
14
N=182
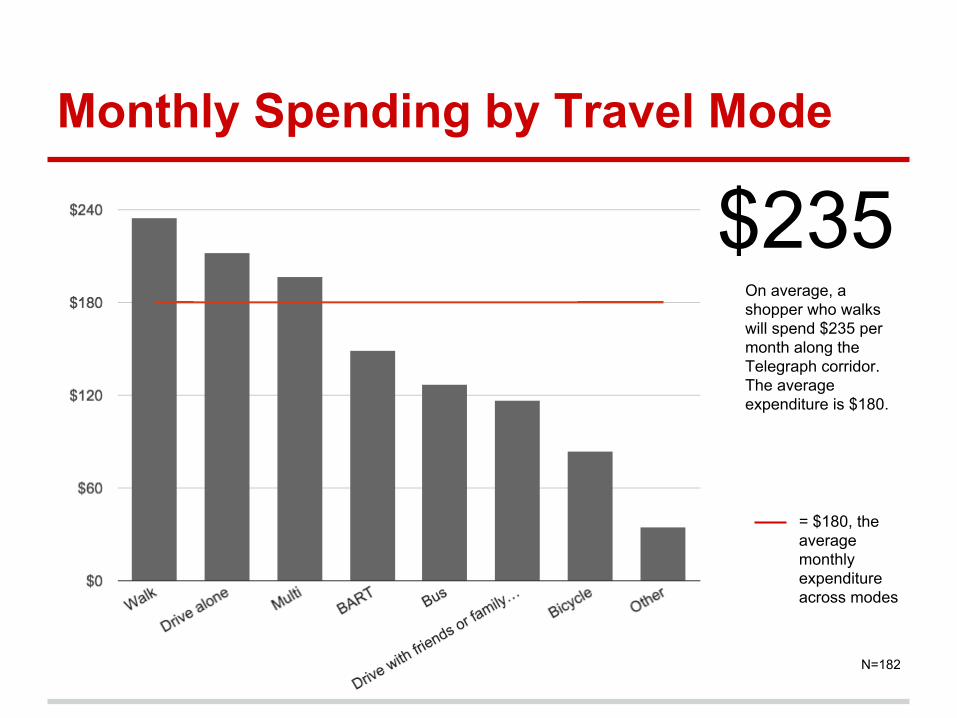
Monthly Spending by Travel Mode
$45
$37$33
$29$24
$22$21 $20
$322
$187$182
$132$109 $20
$54
$272
$191
N=182
On average, a shopper who walks will spend $235 per month along the Telegraph corridor. The average expenditure is $180.
$235
= $180, the average monthly expenditure across modes
Objective #3
Identify where shoppers live and how much they spend in relation to how far they live from the Telegraph Avenue shopping corridor

Shopper Residential LocationsLocal v. Regional Shoppers3 mi
2 mi
1 mi Local64%
Regional36%
Local is defined as a residential location within 3 miles of the Telegraph Avenue corridor.
N=177

Shopper Residential Locations
< 2 mi, 59%
> 2 mi, 41%
Travel modes of shoppers who live within 3 miles of theshopping corridor
N=114
BART10%
Bus14%
Walk39%
Drive alone18%
Drive with others orcarpool
11%
Bicycle5%
Other1%
Multiple modes2%
Transit 24%
Active45%
Multiple/Other3%
Driving29%

Conclusions
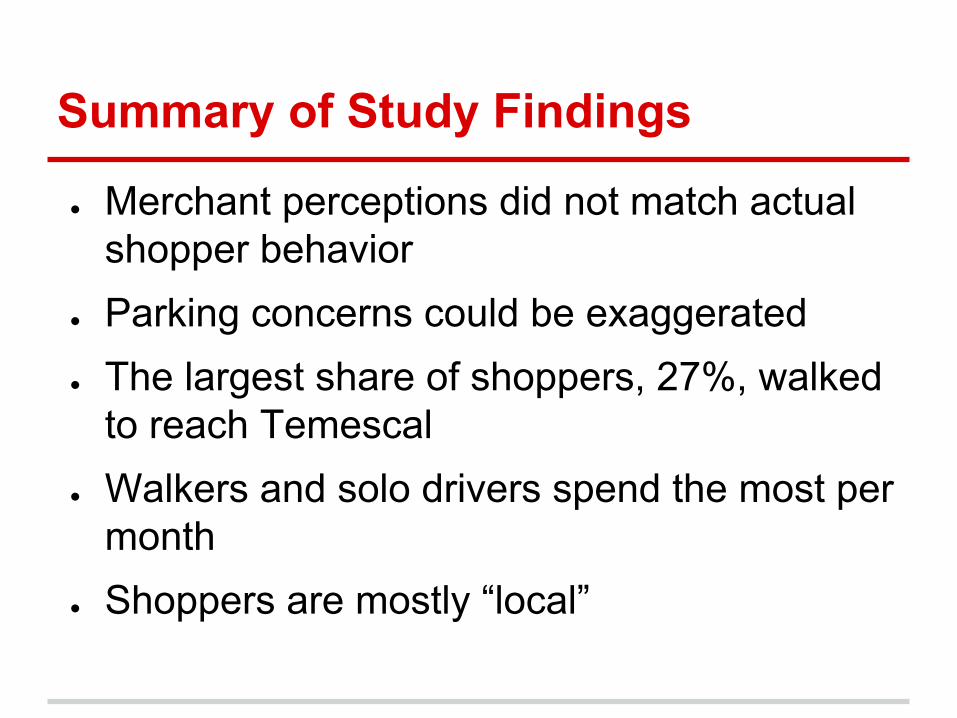
Summary of Study Findings
● Merchant perceptions did not match actual shopper behavior
● Parking concerns could be exaggerated● The largest share of shoppers, 27%, walked
to reach Temescal● Walkers and solo drivers spend the most per
month● Shoppers are mostly “local”

Key Takeaways
● Identified travel behavior that we wouldn’t have found with traditional methods
● Cost effective method (~$10,000)● Potential to apply methodology and findings
to other neighborhood commercial districts with similar characteristics
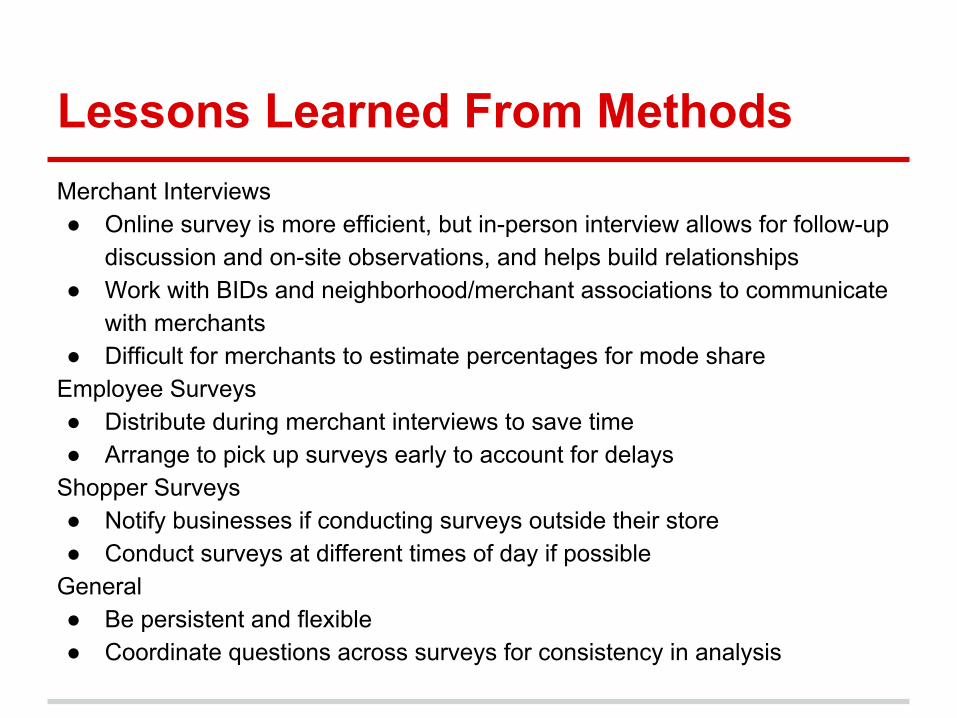
Lessons Learned From MethodsMerchant Interviews● Online survey is more efficient, but in-person interview allows for follow-up
discussion and on-site observations, and helps build relationships● Work with BIDs and neighborhood/merchant associations to communicate
with merchants ● Difficult for merchants to estimate percentages for mode share
Employee Surveys● Distribute during merchant interviews to save time ● Arrange to pick up surveys early to account for delays
Shopper Surveys● Notify businesses if conducting surveys outside their store● Conduct surveys at different times of day if possible
General● Be persistent and flexible● Coordinate questions across surveys for consistency in analysis

Thank You!Questions? Concerns?Sara Barz, Shared Mobility Coordinator, City of [email protected] | @skbarz
Jessica Nguyen, Planner, Alta Planning + [email protected]

Extra Slides
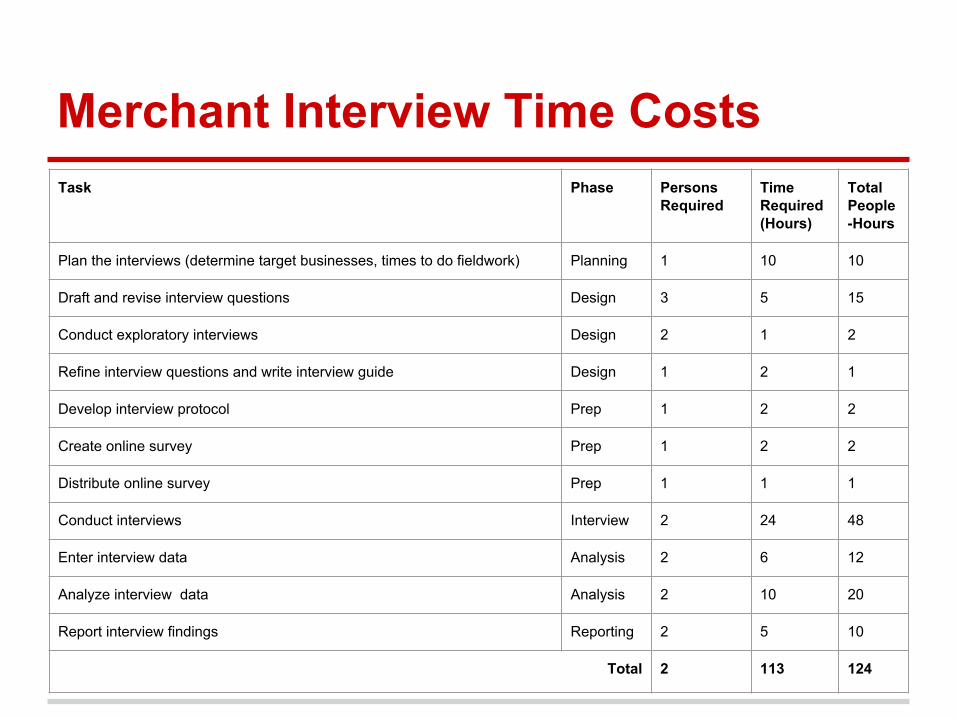
Merchant Interview Time CostsTask Phase Persons
RequiredTime Required (Hours)
Total People-Hours
Plan the interviews (determine target businesses, times to do fieldwork) Planning 1 10 10
Draft and revise interview questions Design 3 5 15
Conduct exploratory interviews Design 2 1 2
Refine interview questions and write interview guide Design 1 2 1
Develop interview protocol Prep 1 2 2
Create online survey Prep 1 2 2
Distribute online survey Prep 1 1 1
Conduct interviews Interview 2 24 48
Enter interview data Analysis 2 6 12
Analyze interview data Analysis 2 10 20
Report interview findings Reporting 2 5 10
Total 2 113 124
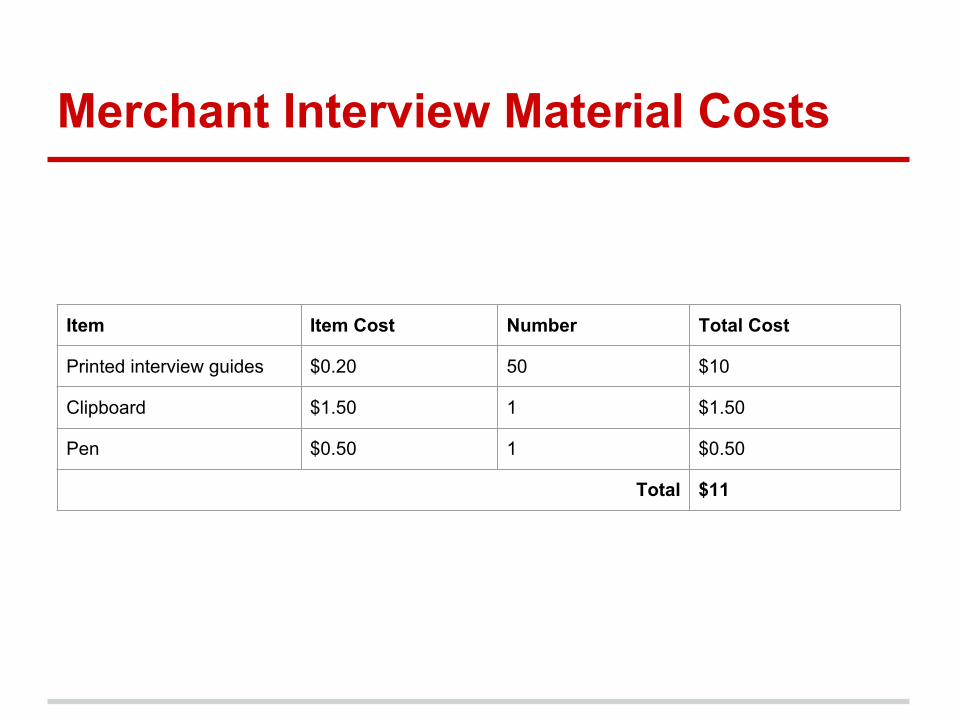
Merchant Interview Material Costs
Item Item Cost Number Total Cost
Printed interview guides $0.20 50 $10
Clipboard $1.50 1 $1.50
Pen $0.50 1 $0.50
Total $11
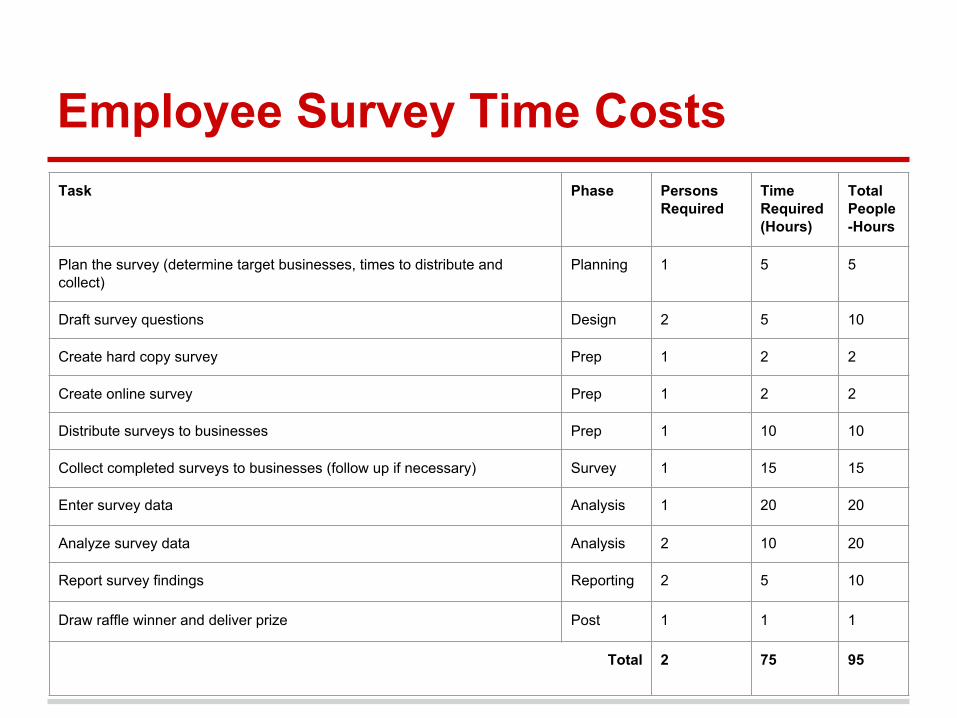
Employee Survey Time CostsTask Phase Persons
RequiredTime Required (Hours)
Total People-Hours
Plan the survey (determine target businesses, times to distribute and collect)
Planning 1 5 5
Draft survey questions Design 2 5 10
Create hard copy survey Prep 1 2 2
Create online survey Prep 1 2 2
Distribute surveys to businesses Prep 1 10 10
Collect completed surveys to businesses (follow up if necessary) Survey 1 15 15
Enter survey data Analysis 1 20 20
Analyze survey data Analysis 2 10 20
Report survey findings Reporting 2 5 10
Draw raffle winner and deliver prize Post 1 1 1
Total 2 75 95

Employee Survey Material Costs
Item Item Cost Number Total Cost
Printed employee surveys $0.30 100 $30
Small envelopes (individual survey storage)
$0.50 100 $50
Large envelope (survey storage)
$1 50 $50
Raffle prize (incentive) $50 1 $50
Total $180

Survey Spending by Travel Mode
$82On average, a shopper who drove alone spent $82 shopping along the corridor on the day of the survey, but the median expenditure was $30.
Travel Mode Average Expenditure
Median Expenditure
Number of shoppers
Drive alone $82 $30 44
Drive with friends or family or get dropped off
$46 $35 27
Other $35 $35 1
Multi $35 $28 8
Bus $33 $15 19
BART $22 $12 27
Walk $21 $20 50
Bicycle $10 $6 6
Overall $41 $20 182
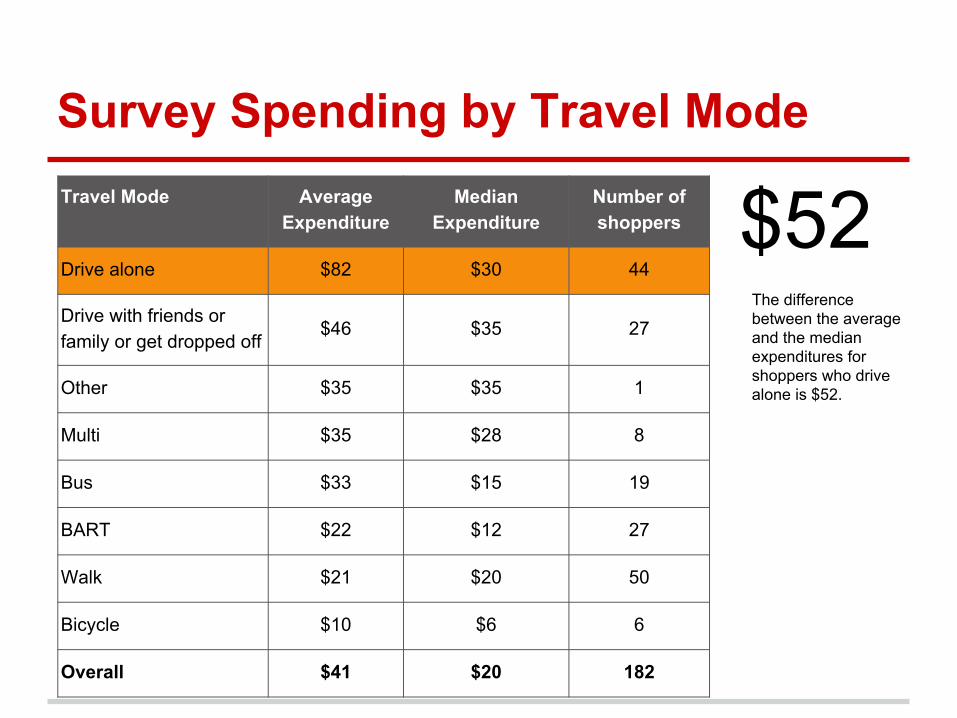
Survey Spending by Travel Mode
$52The difference between the average and the median expenditures for shoppers who drive alone is $52.
Travel Mode Average Expenditure
Median Expenditure
Number of shoppers
Drive alone $82 $30 44
Drive with friends or family or get dropped off
$46 $35 27
Other $35 $35 1
Multi $35 $28 8
Bus $33 $15 19
BART $22 $12 27
Walk $21 $20 50
Bicycle $10 $6 6
Overall $41 $20 182

Frequency of Shopping Visits
Num
ber o
f Sho
pper
s
Stated Frequency of Shoppers’ Visits by Mode Taken on the Survey Day N=200
Frequency of Shoppers' Visits to the Telegraph Corridor by Mode
Survey Spending by Travel Mode
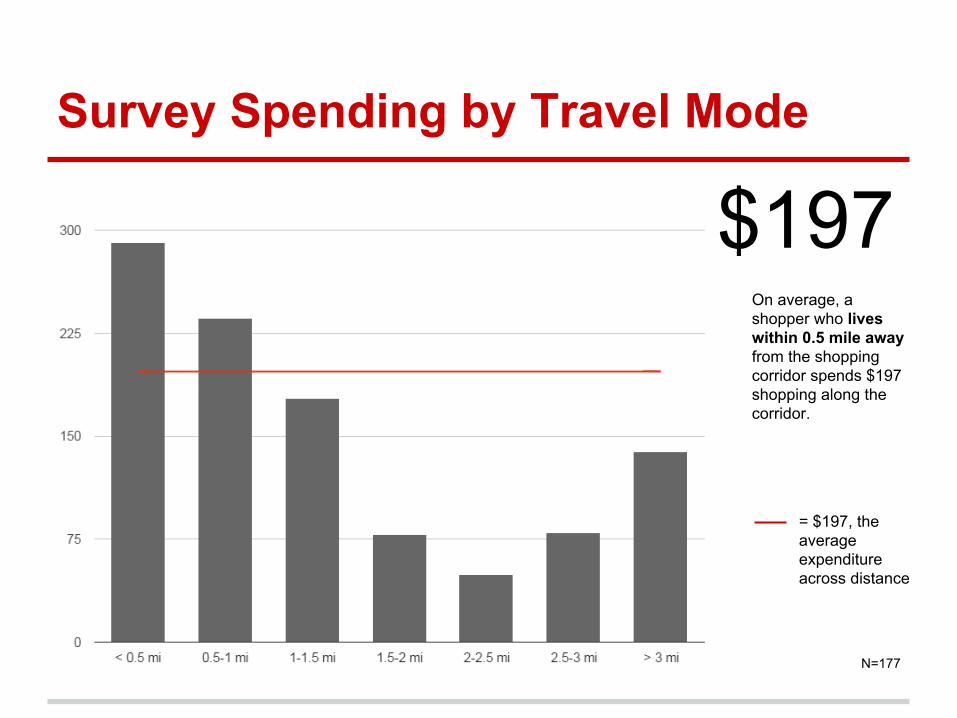
$197On average, a shopper who lives within 0.5 mile away from the shopping corridor spends $197 shopping along the corridor.
$29 $24$22
$21
N=177
= $197, the average expenditure across distance
Merchant Perceptions of Shoppers
No merchants indicated that they had surveyed their customers before.
87% of merchants thought that the majority (50+%) of customers drive.

Merchant Perceptions of Employees