ggd-76-87 state and county probation: systems in crisis
TRANSCRIPT

REPORT TO THE CONeR&S Of’33
BY THE COMPTROLLER GENdc TED STAT@
OF THE UNITED STATES C*HWVG OFF~E
fi@y s . L ( i&b’
State And County Probation: Systems In Crisis Law Enforcement Assistan”ce Administration Department of Justice
State and county probation systems are not adequately protecting the public; the major- ity of probationers do not successfully ’ complete probation. Probation systems are overburdened. Since most offenders are
4 ” i
sentenced to probation, probation systems must receive adequate resources. The prior- ity assigned to probation in the crimin justice system must be reevaluated.
Federal, State, and local governments must cooperate to improve probation systems. The Law Enforcement Assistance Administration can provide leadership, funds, and technical help.
GGD-76-87 t4AY 27,1976

D-171019
COMPTROLLER GENERAL OF THE UNITED STATES
WASHINGTON. D.C. 20548
TO the President of the Senate and the /
Speaker of the House of Representatives
The inadequacies of State and county probation systems and the limited extent to which Law Enforcement Assistance Administration funds were used to address them are discussed in this report.
We made this review because probation is the most fre- quent sentence in the United States and because of concern that probation departments have not been managed as adequately as possible. If the Nation's criminal justice system is to be more effective, probaticn systems must be improved. While this is primarily a State and local responsibility, the Fed- eral Government, through the Law Enforcement Assistance Ad- ministration, can lead the way by developing methods to improve probation management and by working with the States to identify, and help solve, probation's critical problems.
We made our review pursuant to the Budget and Account- ing Act, 1921 (31 U.S.C. 53), and the Accounting and Audit- ing Act of 1950 (31 U.S.C. 67).
We are sending copies of this report to the Director, Office of Management and Budget; the Attorney General; and the Administrator, Law Enforcement Assistance Administration.
Comptroller General of the United States

Contents --------
DIGEST
Page
i
CHAPTER
1 INTRODUCTION Federal involvement
2 WHAT IS PROBATION? Factors affecting probation management Probation organizational structures
3 INCREASED USE OF PROBATION
4 HOW EFFECTIVE IS PROBATION? Extent of success and failure Protection of society Conclusions
NEED TO PROVIDE BETTER INFORMATION FOR SENTENCING
Limited availability of pre-sentence reports
Inadequate pre -sentence reports Insufficient diagnosis and
treatment planning Conclusions
LACK OF SERVICES TO PROBATIONERS Services can help Probationers' needs were inadequately
identified or addressed Current probationers also not
receiving services Conclusions
WHY SERVICES WERE NOT DELIVERED 40 Excessive caseloads 40 Need for closer supervision 42 Other problems in service delivery 45 Conclusions 51
1 1
3 3 4
5
10 10 14 17
18
18 20
21 24
25 28
30
37 39

CHAPTER Page
8 PROBATION PREDICTION MODELS: TOOLS FOR DECISIONMAKERS
What are probation prediction models? Validating models Predictive powers of models How models can improve probation
management Conclusions
9 LEAA AND THE STATES NEED TO IMPROVE PROBATION MANAGEMENT
Inadequate LEAA assistance Inadequate probation department
information systems Limited use of technical assistance Inadequate probation funding
priorities Conclusions
10 OVERALL CONCLUSIONS, RECOMMENDATIONS, AND AGENCY COMMENTS
Overall conclusions Recommendations Agency comments
11 SCOPE AND APPROACH Closed-case approach Active-case approach
APPENDIX
80 81 82
I Statistical analysis of probation data 83
II Results of statistical tests to evaluate the effects of services on successful completion of probation
III Results of model validation
IV Charts of probationers' characteristics that we sampled
V April 28, 1976, letter from the As- sistant Attorney General for Admin- istration to GAO
VI Principal officials of the Department of Justice responsible for administer- ing activities discussed in this re- port
52 53 54 56
57 61
63 63
69 69
71 73
74 74 74 75
86
93
150
158
168

.
ABBREVIATIONS
FBI Federal Bureau of Investigation GAO General Accounting Office LEAA Law Enforcement Assistance Administration SPA State planning agency

COMPTROLLER GENERAL'S REPORT TO THE CONGRESS
STATE AND COUNTY PROBATION: SYSTEMS IN CRISIS Law Enforcement Assistance
Administration Department of Justice
DIGEST ------
Probation is the most frequent sentence in the United States. But probation is not achieving its objectives, which are:
--Rehabilitating the offender.
--Protecting the community.
Probation systems are in crisis. Probation officers have too many cases to effectively supervise probationers' activities and pro- vide them adequate services. Effective man- agement is lacking.
States and localities are primarily respon- sible for improving probation. Yet the Fed- eral Government, through the Law Enforcement Assistance Administration, can provide leader- ship, funds, and technical assistance to the States.
To date, the Law Enforcement Assistance Admin- istration's efforts have had little effect on improving probation systems. The agency and State agencies have not:
--Developed acceptable minimum probation standards, goals, and guidelines or other- wise assured adequate planning to correct probation problems.
--Insured that information systems were ade- quate to identify problems and assess the effectiveness of probation.
--Provided sufficient technical assistance to probation departments in developing and implementing programs.
--Established funding priorities to assure that resources were allocated to meet the needs of criminal justice systems. ( See PP= 63 to 73.)
Tear Sheet. Upon removal, the report cover date should be noted hereon. i GGD-76-87
BEST DOCUMENT AVAILABLE

GAO did its review in Maricopa County, Ari- zona; Multnomah County, Oregon; Philadelphia County, Pennsylvania; and King County, Wash- ington.
PROBATION EFFECTIVENESS
The behavior of the offenders in the community is the most critical test of the success of a probation program.
About 26 percent of the 1,200 former proba- tioners GAO sampled either had their proba- tion revoked or were convicted of crimes involving a sentence of more than 60 days, either while on probation or during a follow- up period-- which averaged 22 months--once they got off probation. (See pp. 11 and 12.)
An additional 19 percent were convicted of less serious crimes while on probation. Thus, over- all, 45 percent of the former probationers were convicted of new crimes during or not long after their probation period.
All together, about half of the former proba- tioners convicted of additional crimes while on probation remained on probation. The other half were imprisoned.
Additionally, about 37 percent of the 200 in- dividuals GAO sampled who were still on pro- bation remained on probation after being con- victed of additional crimes.
Overall, the four counties failed to success- fully deal with an estimated 55 percent of the former probationers--they fled, had their pro- bation revoked, or were convicted of new crimes. (See pp. 10 to 17.)
INADEQUATE INFORMATION AVAILABLE FOR SENTENCING
Sentencing is one of the most important func- tions of the criminal justice system and re- quires accurate, complete information on offenders.
Judges often lack information needed to ade- quately answer such questions as:
ii

--Who should be sent to prison and for how long?
--Who should be granted probation?
--Will available services benefit the proba- tioner?
--Will the risk to society be minimal?
The primary source of such information should be pre-sentence investigative reports--often prepared by probation departments.
In 46 percent of the cases sampled, pre-sentence investigations were not made. (See pp. 18 to 24.) When they were made, 64 percent contained sentence recommendations. But few contained rec- ommendations relating to the offender's threat to the community, the type of probation super- vision needed, or the probationer's chances of being rehabilitated. (See p. 20.) In only 15 percent of the cases were professional diagnoses of the probationers' problems and needs made before sentencing, (See up= 21 to 24.)
PROBLEMS IN PROVIDING SERVICES TO PROBATIONERS
A probationer receiving needed services will more likely complete probation successfully. If probation departments would allocate their scarce resources more effectively, they would begin to more adequately rehabilitate more of- fenders.
--In only 38 percent of the cases were rehabili- tation plans prepared.
--Only 41 percent of court-ordered conditions of probation and rehabilitation were enforced. Allowing probationers to continue or complete probation after violating the basic conditions set at the time of sentencing seriously inter- feres with rehabilitation. Under these con- ditions, repeat offenders do not take conditions of probation seriously.
--Overall, . . only about 23 percent of the proba- 4' tioners completed a treatment program. (See
PP* 25 to 39.)

EXCESSIVE CASELOADS--A DETRIMENT TO EFFECTIVE MANAGEMENT
Probation officers have too many cases. In the 4 counties reviewed, the individual case- load averaged 85 in December 1974. On the basis of a standard of 35 cases per officer (recommended by the President's Commission on Law Enforcement and Administration of Justice) the 4 counties would require 711 probation officers. They had 292. Wee PP= 40 to 42.)
Large caseloads force probation systems to focus services and attention on the probationers who need the most help and supervision. Neither the courts nor probation departments had adequate techniques to determine how much supervision or what types of services probationers needed.
PROBATION MODELS--WAYS TO IMPROVE ' RESOURCE ALLOCATION
Statistical models can be used to help predict (1) whether probationers can be rehabilitated, (2) how much supervision they need, and (3) how long probation should last.
Unfortunately, these models are not used, pri- marily because administrators have not been assured that a model developed in one location on one group of people would be valid elsewhere and that the models' predictive powers would be sufficient. But, GAO's extensive statistical tests of models showed they were highly trans- ferable among locations, and, among other things, that they selected for early release proba- tioners that had a higher rate of success than those selected by probation officers.
Models are objective, efficient, and able to systematically compare past or oresent exper- ience. By using models, probation officers could improve their judgments. (See pp. 52 to 62.)
COMMENDATIONS AND AGENCY COMMENTS
New ideas and more positive leadership are needed to improve probation at the State and local levels. If no action is taken, proba- tion systems will continue to be overburdened
iv

c and will deteriorate further, increasing the dangers to society.
' The Attorney General should direct the Admin- istrator, Law Enforcement Assistance Adminis- tration, to implement GAO recommendations so that:
Y++&.~s develop minimum standards covering s w cs workload and need for pre-sentence reports.
--Probation predictive models are used more frequently.
--Information systems are improved.
--Probationers receive needed services.
--States better identify probation problems.
--Better technical assistance is given.
--More funds controlled by the agency are spent to improve probation. (See pp- 74 and 75.)
But something more fundamental must happen. Since most offenders are placed on probation and many problems face probation departments, the priority given to probation in the cri- minal justice system must be reevaluated. Al- location of resources among the competing ele- ments of the criminal justice system should be looked at more closely. (See p. 74.)
:h
The Department of Justice generally agreed with GAO's recommendations and noted a series of actions the Law Enforcement Assistance Admin- istration will consider to improve State and local probation:
--The role it can play in developing and de- monstrating ways to predict the workability of probation.
--The need to develop better ways to meet proba- tioners' needs.
--The use of more discretionary funds for cor- rections.
Tear Sheet
v BEST DOCUMENAVAILABLE

While the Law Enforcement Assistance Admin- istration recognizes its obligation to pro- vide leadership to help States and localities to improve probation, it does not believe it can require the States to address the problem. The Department correctly noted that primary responsibility for improving probation opera- tions resides with State and local governments. Nevertheless, the Law Enforcement Assistance Administration can provide leadership. It should complete its consideration and study of the issues so action, not merely planning, can be taken. In doing so, it should recognize the research and evaluation leadership role the Congress envisioned for it and act accordingly. (See pp. 75 to 79.)
i

CHAPTER 1
INTRODUCTION
activity.
We wanted to determine if probation activities--sen- tencing, planning, diagnosis ana treatment, and delivering services--were being effectively managed. We therefore reviewed adult felon probation systems in Maricopa County, Arizona; Multnomah County, Oregon: Philadelphia County, Pennsylvania; and King County, Washington, to determine:
" t
Whether the Law Enforcement Assistance Administra- --tion (LEAA), the States and the county probation
departments were addres:ing the problems of developing probation systems that insure the public's safety and enable offenders to remain in the community and receive rehabilitation services.
I\ L--How much the services received by probationers increased their chances of successfully completing probation. k,r~
i? 7 --Whether systems existed to identify individuals
with good chances of completing probation and remaining out of contact with the criminal justice system and how such systems could be used to improve probation operations.
About 77 percent of the adult criminal offenders in the four counties were sentenced to probation in 1974.
Chapter 11 and appendix I discuss the scope of our work and our approach.
FEDERAL INVOLVEMENT
Probation is basically a State and local activity, but the Federal Government helps the States and localities primarily by providing funds as part of the LEAA program. LEAA was established by the Omnibus Crime Control and Safe Streets Act of 1968, as amended (42 U.S.C. 3701, et seq.). The Crime Control Act of 1973 extended the LEAA program through fiscal year 1976.
The purpose of the LEAA program is to (1) encourage States and local governments to evaluate State and local
1 BEST DOCUMENT AVALABLE

problems of law enforcement and criminal justice and develop comprehensive plans, (2) authorize grants to State govern- ments to improve law enforcement and criminal justice, and (3) encourage research and development directed toward im-
proving law enforcement and criminal justice and developing new methods for preventing and reducing crime and detecting, apprehending, and rehabilitating criminals. The 1968 act authorizes LEAA to make grants to establish and operate State planning agencies (SPAS) to carry out the program at the State level.
LEAA also makes discretionary grants according to its own criteria, terms, and conditions. Grants can be awarded to specific groups filing approved applications and are designed to
--advance national priorities,
--draw attention to programs not emphasized in State plans, and
--give special impetus to reform and experimentation.
LEAA block grants (called action funds) to improve law enforcement and criminal justice, including probation systems, are awarded to SPAS which in turn distribute the funds to other State agencies, local governments, or nonprofit organizations to implement specific projects.
To obtain block grant funds, an SPA must develop detailed, comprehensive plans in accordance with LEAA regulations and guidelines. SPAS must consult local and regional planning units in developing the plans. The plans are submitted to LEAA regional offices for review and approval.
The approved plans become the bases for Federal grants to the States. LEAA's regional offices have assigned repre- sentatives to each State to provide technical assistance to State and local agencies in developing their law enforcement improvement plans and implementing their crime control programs.
Through fiscal year 1975, LEAA awarded about $3.5 billion to the States. Of this amount, the States awarded about $278 million, less than 8 percent, for probation activities. For fiscal year 1974 (the latest year for which we could obtain specific data), three of the four States of the counties reviewed awarded $3.6 million to probation projects and Pennsylvania awarded about $14 million to pro- bation and parole projects.

CHAPTER 2
WHAT IS PROBATION?
Probation is a sentence under which the convicted individual is released into the community rather than placed in prison. The offender is subject to supervision by a probation organization and to the conditions of probation imposed by the court. According to the Manual of Correc- tional Standards issued by the American Correctional Asso- ciation, an effective probation program should insure the protection of society, rehabilitate the offender and help him adjust in the community.
FACTORS AFFECTING PROBATION MANAGEMENT
Four interrelated processes are involved in probation: (1) sentencing by the court, (2) diagnosing and planning
treatment for the offender's problems, (3) delivering services to the offender, and (4) obtaining the information needed to make sound decisions regarding the management and effectiveness of probation.
The sentencing process is important because it involves the judge's decision on whether the offender can be treated in the community or should be placed in prison. To make this decision the judge considers (1) applicable laws, (2) information and recommendations in police arrest reports,
prosecuting attorney pre-sentence reports, and probation department pre-sentence reports, (3) the seriousness of the crime, (4) prospects for rehabilitation, (5) rehabilitative services available in the community, (6) attitude of the offender, and (7) whether the offender's behavior would endanger society.
Diagnosing an offender's problems provides information useful in establishing sentences and conditions of probation and determining the nature of treatment needed to help rehabilitate the offender. To be complete, a diagnosis should provide adequate information on the offender's risk to society and recommend and locate treatment. The nature of available community resources should also be considered. If the offender is ultimately placed on probation, the diagnostic information provides a basis for establishing a treatment program to help the offender.
The treatment services are provided by a probation department or by community resources. Probation department officials perform counseling services, such as (1) explain- ing to probationers the reasons for and the conditions of
3

their probation, (2) helping probationers to deal with their . problems, and (3) making referrals to community resources. Community resources help probationers with problems in such areas as employment, training, housing, and health. Coor- dination between probation departments and community resources is obviously very important if the needs of pro- bationers are to be met.
PROBATION ORGANIZATIONAL STRUCTURES
Probation organizational structures vary from State to State. Thirty-two States have State-operated probation systems, 12 States have locally operated systems, and 6 States have combinations of State and locally operated systems. In the States visited, Oregon and Washington had State-operated systems, Arizona had a locally operated system in 2 counties with the other 12 counties having pro- bation officers under each judge, and Pennsylvania had a combined State-local system. These systems represent the organizational variations that can exist for probation.
Each probation system had the same basic objective--to protect society and rehabilitate offenders using community resources. The following sections describe the organizational structures in the four counties.
Maricopa County
The Arizona Department of Corrections is responsible for State institutions and supervising parolees. The Board of Parole is responsible for determining who is paroled or pardoned. There is no statewide probation system; probation programs are operated individually in each of the 14 counties.
Since December 1971, the Maricopa County probation department has been operated under the Maricopa County superior court. Previously, there was no formal department: each probation officer worked for, and reported directly to, a judge. The department makes pre-sentence investigations and supervises offenders sentenced to probation by Maricopa County superior court judges.
Multnomah County
The Oregon Department of Human Resources' corrections division is responsible for all adult corrections programs, including probation. The adult community services unit within the corrections division handles parole and probation activities. It has 8 regional and 23 district offices within the State. (Multnomah County also has a locally operated adult probation program that services mostly mis- demeanants. We did not review this program.)
4

Philadelphia County
In Pennsylvania, responsibility for supervising adult probationers is divided between the State and counties. 0 Under Pennsylvania law, judges have the discretion to assign individuals sentenced to probation to either the State pro- bation system or one of the county probation systems.
The Pennsylvania Board of Probation and Parole is responsible for the State's system. The board is organized into five bureaus: pre-parole, administrative services, special services, probation services, and parole supervision. The latter two bureaus are primarily responsible for carrying out the board's probation functions. The bureau of probation services establishes uniform statewide county standards for (1) supervising probationers, (2) quality of probation serv- ices, (3) pre-sentence investigations, and (4) personnel qualifications and minimum salaries. The bureau of parole supervision supervises parolees and probationers under the board's jurisdiction and administers its operations through 6 regional offices and 10 district offices.
Each of the 67 counties also has its own corrections institution and adult probation agency. The Philadelphia County Adult Probation Department (1) supervises adult misdemeanants and felons, parolees released from county prisons, and unsentenced individuals assigned to pretrial diversion programs and (2) conducts pre-se\ntence investi- gations, psychiatric examinations, and alcohol and drug evaluations, as requested by the courts.
King County
The Department of Social and Health Services and the Board of Prison Terms and Paroles are separate Washington agencies responsible for the State's adult correction system. Both report to the Governor. The board sets the minimum prison terms to be served and grants or revokes parole. The department manages the corrections system and supervises probationers and parolees.
The Department of Social and Health Services' office of adult probation and parole manages a centrally controlled system with regional offices in Seattle, Spokane, and Olympia, and 39 district offices. These offices conduct pre-sentence investigations and supervise probationers and parolees.
5

CHAPTER 3
INCREASED USE OF PROBATION
In 1973 the National Advisory Commission on Criminal Justice Standards and Goals1 stated that the failure of major institutions to reduce crime was incontestable and that a dramatic realignment of correctional methods was needed.
How many offenders are in the correction system? The President's Commission on Law Enforcement and Administration of Justice2 comprehensively studied corrections and arranged for the National Council on Crime and Delinquency3 to do a nationwide survey of correctional operations. This study showed that the average daily number of offenders under correctional authority in 1965 was 1.3 million. This infor- mation gave the first accurate national picture of the number of offenders under correctional authority.
Probation is the most frequent type of sentence. The survey (1) showed that in 1965, 684,088 offenders, or 53 percent, were on probation and (2) projected that by 1975, over 1 million, or 58 percent, would be on probation.
When the President's Commission began to study correc- tions, its most urgent task was to develop reliable informa- tion about correctional operations. There was no overall picture of the system, because no uniform reporting system provided similar information about either the operations of the system or the offenders within it. Ten years later, in 1975, probation statistics were still not compiled on a nationwide basis.
1 This Commission was funded by the Law Enforcement Assistance Administration in 1971. Membership was drawn from the police, courts, correction branches of State and local gov- ernments, industry, and citizen groups. Most members had working experience in the criminal justice area.
2This Commission was established by Executive Order 11236, issued by President Lyndon B. Johnson on July 23, 1965.
The council, a private, nonprofit organization, was estab- lished in 1909 to explore and develop innovative ways to prevent crime and juvenile delinquency.
6

We contacted the 50 States to try to develop current statistics. We were only partially successful because some States did not respond and, for those that did, much of the information was not comparable because of differences in the way States kept data. We, therefore, could not determine how many people were on probation or in the corrections system. However, the responses show that the percentage of offenders on probation between 1969 and 1974 increased much more than did the prison populations.
We obtained better information in the locations reviewed. The following table shows the sentences of pro- bation and prison for felons in each of the four counties for several years. Between 71 and 83 percent of the offend- ers received-sentences of probation in-1974. for the-counties was 77 percent during 1974.
County and sentence
1965
Maricopa: Probation (a) Prison Percent given
probation
Multnomah: Probation Prison (a) Percent given
probation
Philadelphia (note b): Probation Prison (a) Percent given
probation
King: Probation 367 Prison 349 Percent given
probation 51.3
1970 1971 - -
(a) (a)
(a) (a)
6,320 6,631 3,178 3,309
66.5 66.7
1,141 1,188 340 253
77.0 82.4
1972 1973 1974
1,778 2,017 2,220 312 360 466
85.1 84.9 82.7
958 744 1,032 390 378 429
71.1 66.3 70.6
9,410 8,535 8,596 3,888 4,380 3,461
70.8 66.1 71.3
1,659 1,601 304 284
84.5 84.9
1,622 345
82.5
The average
aData not available.
b Philadelphia data includes felony and misdemeanor except traffic offenses.
crimes

State corrections officials, judges, and corrections studies gave many reasons why the use of probation has increased.
--Probation offers a better chance of rehabilitation than prison.
--The cost of keeping offenders in prison as compared to probation is high: It costs about one-fourteenth as much to keep an offender on probation as it does to house him in prison. In the four States the costs were about as follows:
Annual Cost --
Arizona
Probation (note a) Prison
b$347 $5,665
Oregon 431 6,920
Pennsylvania 630 6,000
Washington 475 7,680
aCost for probation departments only (does not include community treatment cost, as data was unavailable).
b Maricopa County probation data.
--Probation is the only choice in many cases because State prisons are full.
--Under probation, offenders can earn money to pay fines and restitution to victims.
tion was the "brightest hope for corrections," but had failed to develop systems for determining who should be on probation and for giving offend- ers the support and services they need to live independently in a socially acceptable way.
The increased use of probation has overburdened the probation system.
--Offenders need more services than can readily be provided by existing community service agencies.
8 BEST DUCUMEl\iIT AVAILABLE

--The risk to society has increased.
--State and county budgets are strained as the need for resources builds.

CHAPTER 4
HOW EFFECTIVE IS PROBATION?
The offender's behavior in the community is the most critical test of the probation program. The four county probation systems we reviewed were achieving limited success in protecting society and rehabilitating offenders.
Overall, we estimated that about 55 percent of the of- fenders no longer on probation were unsuccessful in that they were either convicted of new offenses, had their probations revoked, or fled from probation supervision. Of the offend- ers still on probation, 37 percent had been convicted of additional crimes and remained on probation.
EXTENT OF SUCCESS AND FAILURE
To determine the effectiveness of probation, we random- ly selected 300 cases of former probationers in each of the 4 counties-- 1200 cases in all.
Completion of probation
The following table shows that 931 (78 percent) of the offenders sampled had completed probation.
Results of Counties' Efforts With Probationers
Completed Probation Sample probation revoked
County total Number Percent Number Percent
King 300 222 74 78 26
Maricopa 300 219 73 81 27
Multnomah 300 233 78 67 22
Recidivism among those who completed probation
Recidivism is a general term used to indicate the re- lapse of offenders into criminal behavior. LEAA defines "recidivism" as (1) conviction by a court for criminal acts
10 BEST DOCUMENTAVAflABLE

committed during or within 3 years after probation, or (2) technical violations of probation or parole which change the offender's legal status. We used a slightly more con- servative definition of recidivism for our study, because a conviction may include less serious crimes, such as traffic offenses. We considered a probationer to be a recidivist if he or she either (1) had probation revoked, or (2) was con- victed of an offense while still on probation or within a followup period. We counted only those convictions for which the person was sentenced for 60 days or more.
This definition is similar to the Federal Bureau of Prisons' definition of recidivism as either (1) parole revo- cation or (2) any new sentence of 60 days or more to prison, jail, or probation, for new offenses, including misdemeanors resulting from an arrest reported to the Federal Bureau of Investigation (FBI). In a recent study of recidivism of parolees, the Bureau of Prisons used a 2-year followup pe- riod. The followup period for our study was for at least a year and averaged about 22 months.
Rates of recidivism can indicate how effective a proba- tion program has been in rehabilitating offenders. We there- fore obtained the criminal history records for the 931 of- fenders who completed probation. From these records we determined how many probationers were convicted of new crimes while on probation or during our followup period. The fol- lowup data was obtained from the FBI and State and local police.
County
King
Maricopa
Multnomah
Results of Followup on Ex-probatroners
Convicted of Successfully Arrested but additIona completed
crimes dlspositrons
were Recrdrvism While on
probation After
Ex-probationers p and followup undetermrnable
robation p robation percentage
period (note a) (note b)
222 41 10 145 26 26
219 13 26 157 23 20
233 13 13 180 27 13
Philadelphia 257 64 30 106 - 57 - - 47
Total 931 131 79 588 = 133 26 -
aThe court sentences for these offenders could not be rdentifred from FBI or police crlmrnal hlstory records. However, each of the offenders had been arrested for an offense. we could not identify the court sentences,
Since
as successes or failures. we did not attempt to classify these probationers
bNumber convicted of addltional crrmes divided by the total of those convicted and those who successfully completed probatron (excludes undetermlnables).
11

The above data on the 931 former probationers shows that many of the probationers considered by the counties to have successfully completed probation were in conflict with the criminal justice system either during or after probation. Of the 798 offenders on whom we obtained complete information, 210, or 26 percent, fit our definition of recidivism.
Overall recidivism
In summary, of the 1,200 closed cases we sampled, 133 were arrested but their dispositions were undeterminable. Of the remaining 1,067 offenders, 45 percent either had their probation revoked (269) or were convicted of new crimes (210) and 588, or 55 percent, successfully completed proba- tion and were not convicted of any serious crimes for at least 1 year following.
Overall effectiveness
We discussed above what happened to our sample of in- dividuals no longer on probation using recidivism as a mea- sure of success. In the previous statistics we considered recidivism for offenders who did not have their probation revoked.
Some counties, however, are more liberal in their per- ception of success. For example, unlike King and Multnomah counties, Maricopa and Philadelphia county probation reports consider a probationer successful if the offender has fled probation supervision and has not committed a new crime during the rest of his sentence. This assumes the counties received information on newly committed crimes, which is not always the case.
We do not agree that absconders should be considered a success. Although some who flee may not commit crimes, the fact that they abscond indicates that they reject the re- strictions placed on them by the criminal justice system.
Because of inadequate data, we estimated how many pro- bation case files were closed due to flight during the period of our sample, as follows.
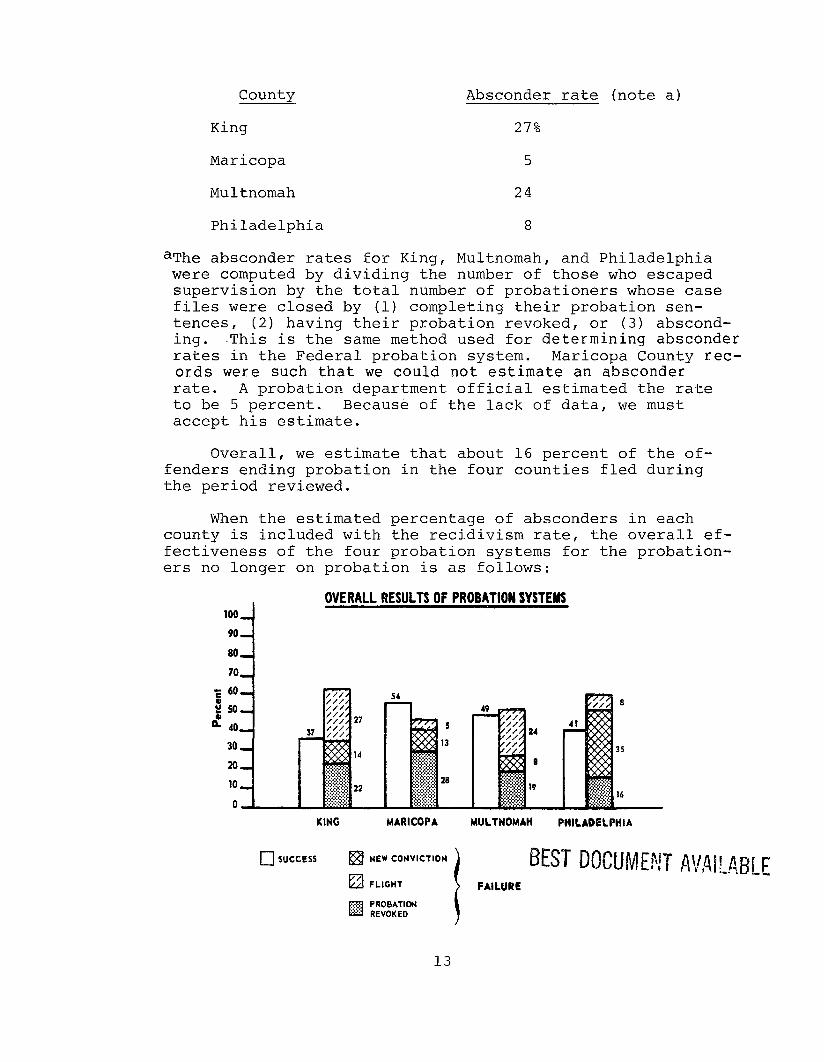
County Absconder rate (note a)
King 27%
Maricopa 5
Multnomah 24
Philadelphia 8
aThe absconder rates for King, Multnomah, and Philadelphia were computed by dividing the number of those who escaped supervision by the total number of probationers whose case files were closed by (1) completing their probation sen- tences, (2) having their probation revoked, or (3) abscond- ing. -This is the same method used for determining absconder rates in the Federal probation system. Maricopa County rec- ords were such that we could not estimate an absconder rate. A probation department official estimated the rate to be 5 percent. Because of the lack of data, we must accept his estimate.
Overall, we estimate that about 16 percent of the of- fenders ending probation in the four counties fled during the period reviewed.
When the estimated percentage of absconders in each county is included with the recidivism rate, the overall ef- fectiveness of the four probation systems for the probation- ers no longer on probation is as follows:
OVERALL RESULTS OF PROBATION SYSTEMS 100 90
80
70
KING MARICOPA MULTNOMH PHILADELPHIA
Cl SUCCESS El NEW CONVICTION
Ia FLIGHT
i
FAILURE
•j PROBATION REVOKED
13

The average failure rate for-the four counties was about 55 percent. Thus, overall, the probation systems were able to successfully rehabilitate about 45 percent of the offend- ers treated.
In comparison, in a 1975 report to the Congress on the effectiveness of 15 halfway houses in 4 States, we showed that about 50 percent of all offenders treated were rehabili- tated, in that they successfully completed the programs and were not convicted of additional crimes during the period of review. L/ A possible reason why offenders treated in halfway houses were more successful is that they were more closely supervised than probationers, who were relatively free to function as they liked in the community.
PROTECTION Ok' SOCIETY
Community-based treatment is a risk to society because probationers who might be in prison or other more struc- tured environments may commit additional crimes. To deter- mine if society is adequately protected we reviewed our sam- pled cases to see how many were arrested and convicted of crimes while on probation.
Closed cases e-m--me---
The following table shows the number of arrests and convictions for any crime, regardless of its severity or the length of sentence, committed during probation for 1,200 closed cases reviewed.
New Offenses Dxrlng Probation by Offenders -~ No Longer on Probation - -
Number of Number of offenders Percent of
Total offenders Number of convicted Number of county probationers
probationers arrested arrests (note a) convictions
-.-- Arrested Convicted
Klllg 300 183 328 158 b158 61 53
Maricopa 300 163 359 140 258 54 47
Multnomah 300 154 290 117 176 51 39
Philadelphia 300 180 542 128 222 60 43
Total 1,200 680 1,519 543 814 57 45
aData includes all convlctlons regardless of sentence. -
bAt least 158 offenders were convlcted. The total number 1s unknown.
l"Federa1 Guidance Needed If Halfway Houses Are To Be a Viable:.Alternative to Prison," GGD-75-70, May 28, 1975.
14 BEST DOCUMEi;i-f AVAILABLE

Of the 543 offenders convicted again, 274--or about 50 percent --remained on probation. The 680 probationers were arrested for the following types of crimes during probation.
Number of arrests
Crimes against people (14 percent):
Murder Negligent manslaughter Robbery Assault Rape Prostitution and pandering Other sex offenses
Crimes against property (26 percent):
Burglary Theft and larceny Vehicle theft Forgery and fraud
Other (60 percent):
Drug charges Marihuana Alcohol law violations Technical violations All others (note a) Not identified
12 3
69 60
5 50 13 --
212
131 160
58 42
391
103 50
155 103 491
14 916
aIncludes such crimes as possession of a gun, escape, and petty theft.
Open cases
We also examined the case files of 200 offenders (50 from each county), whose probation period had not been com- pleted to determine if the percentage of persons arrested and convicted of crimes while still on probation is similar to that for those who had completed probation.
BEST DOCUMEMT AVAt!,ABLE 15

county
King
iY?KlCOpd
Multnomah
Philadelphia
Tota 1
Offenses During Probation For Offenders on Probation
Number of Number of Percent of Total offenders Number of offenders Number of probationers
probationers arrestczd arrests convIcted convictions Arrested Convicted ---- - -___
50 28 57 22 36 56 44
5 0 23 49 18 33 46 36
50 28 63 22 39 56 44
50 18 44 18 36 24 - 12 -
200 97 21.3 74 126 49 37 III -- = YE=
As shown above, 37 percent of the offenders on proba- tion were convicted of new crimes. More importantly, society was not adequately protected; all of the offenders remained on probation.
The probationers were arrested for the following types of crimes during probation.
Number
Crimes against people (13 percent):
Robbery Assault Prostitution and pandering Other sex offenses
Crimes against property (23 percent):
11 12
1 5
29 -
Burglary Theft and larceny Vehicle theft Forgery and fraud
Other (64 percent):
13 31
1 5
50 -
Drug charges Marihuana Alcohol law violations All others Not identified
16 17 22 75
9 139
Total 218

A comparison of the percent of arrests and convictions of closed cases with open cases shows that while the offend- ers currently on probation had not been exposed as long to the criminal justice system, their rates of arrest and con- viction approached the rates shown for past offenders.
Our halfway house report (see p. 14) noted that a major concern of probationary programs should be the risk to public safety. About 15 percent of the offenders who went through the halfway houses were imprisoned for improper behavior while residing at the houses. In contrast, 22 percent of the 1,200 offenders no longer on probation were incarcerated for improper behavior while on probation. (See p. 10.)
CONCLUSIONS
Probation is an appropriate sentencing alternative to imprisonment when offenders (1) have a good potential for rehabilitation and (2) do not pose a serious risk to the well-being of the community.
However, the estimated overall 55-percent failure rate for persons no longer on probation raises serious questions as to the probation system’s ability to help offenders make a positive adjustment in the community. Furthermore, since about 45 percent of former probationers and 37 percent of current probationers had been convicted of crimes during probation, a lack of control and danger to the public are evident. We question whether society is adequately safe- guarded when criminal repeaters continue to return to the community in a probationary status without adequate super- vision and control.
Many factors could account for this situation. Some of the more important ones are discussed in the following chapters.

CHAPTER 5 -----
NEED TO PROVIDE BETTER INFORMATION --------------_--_-----_--------
FOR SENTENCING --------- Sentencing is one of the most important functions of
the criminal justice system. In the time between conviction and sentencing, the judge must determine whether to im- prison the offender or return him to the community. The process used by each judge to decide sentencing may vary, but accurate information on the offender must be available to answer such questions as:
--Who should be sent to prison and for how long?
--Who should be granted probation?
--Will available services benefit the probationer?
--How great will the risk to society be?
However, judges often lacked the information needed.
The primary source of sentencing information for judges should be the pre-sentence investigation reports. These reports --often prepared by probation departments--are useful as a source of information concerning the offender's past criminal record, family background, work experience, avail- able resources, and potential for rehabilitation, to help the court decide sentence. However, pre-sentence reports were often inadequate. They usually did not make sentence recommendations or provide an adequate rehabilitation plan.
LIMITED AVAILABILITY OF PRE-SENTENCE REPORTS
The 1973 National Advisory Commission on Criminal Jus- tice Standards and Goals' corrections report stated that a pre-sentence report should be made to the judge in every felony case. The report recommended that (1) a full pre- sentence report be prepared whenever the court considers it necessary, or incarceration for more than 5 years is possible and (2) a short report should be made in all other cases. Other recognized authorities in the judicial and correctional fields have recommended a pre-sentence report on all offend- ers, regardless of offense.
The following table shows ,$he percent of the 1,100 open and closed cases sampled.for whi&h pre-sentence reports were prepared. . I ,\ ;: i ,;i*" 'i&';::i "' "' '
3 $g: -.

Pre-sentence renorts made Cases sampled Closed cases A Open cases
County Closed Open Number Percent Number Percent
King (a) 50 (a) (a) 32 64
Maricopa 300 50 297 99 49 98
Multnomah 300 50 154 51 19 38
Philadelphia 300 50 - 30 12 24
Total 900 200 481 53 112 56
aInformation for the 300 closed cases was not available be- cause files were destroyed when probation periods were completed-- in accordance with probation department policy.
Overall, reports were prepared in 54 percent of the cases.
We sent questionnaires to judges in each of the counties reviewed and interviewed a number of them, to determine their feelings about the availability and quality of sentencing information, probation supervision, and rehabilitation.
Our questionnaire drew responses from 108 judges.
The Maricopa County judges who responded indicated that they receive and review pre-sentence reports in all cases. Our sample of 350 Maricopa County cases showed that pre- sentence reports were prepared almost 100 percent of the time. King County superior court rules and Arizona State law, with a few exceptions, required pre-sentence reports in all cases, but reports were prepared for only 64 percent of recent King County felony cases. Judges told us they some- times waived the reports if they understood the circumstances well enough. l/ Pre-sentence reports in Multnomah and Phila- delphia Counties are prepared when requested by the court. Philadelphia County Courts generally do not request reports, even though Pennsylvania State law states:
"Before sentencing any defendant to 1 year or longer, a presentence investigation and report shall be made, unless the sentence is death or a mandatory sentence to life imprisonment, or unless the court specifically orders to the contrary."
--- -----_--e
l/The Assistant Director of Washington's Adult Corrections - Division told us in January 1976 that King County was com- pleting pre-sentence investigations on 91 percent of the required cases.

INADEQUATE PRE-SENTENCE REPORTS
Even when pre-sentence reports were prepared, many lacked sentence recommendations and did not sufficiently discuss the offender's danger to the community and chance of successfully completing probation.
Both King and Multnomah counties have special pre- sentence-report preparation and diagnostic units funded by the Law Enforcement Assistance Administration. These units had been in existence for only a short time when we selected our closed cases, thus their impact was not reflected in our statistics of closed cases. For the cases reviewed, most of the pre-sentence reports analyzed were prepared by officers who also supervise probationers and parolees.
The Standards and Goals Commission's 1973 corrections report stated that a full pre-sentence report should contain:
--Verified information about the person's education, medical history, previous crimes, and other factors.
--Estimated chance of rehabilitation.
--A recommendation for sentencing.
--Analysis of the offender's motivations and ambitions.
The contents of the 593 pre-sentence reports made in the 1,100 cases we reviewed are summarized below.
20 BEST DOhJMENT AVAIlABlE
Probation officials said that much of the information in pre-sentence reports is taken from offenders' statements and is not verified due to lack of time. As noted earlier, the Standards and Goals Commission stated that information in such reports should be verified as far as possible. We did not attempt to confirm information in the reports, but the lack of routine verification raises doubt as to its accuracy. Probation departments should better assure the correctness of pre-sentence reports.
INSUFFICIENT DIAGNOSIS AND TREATMENT PLANNING
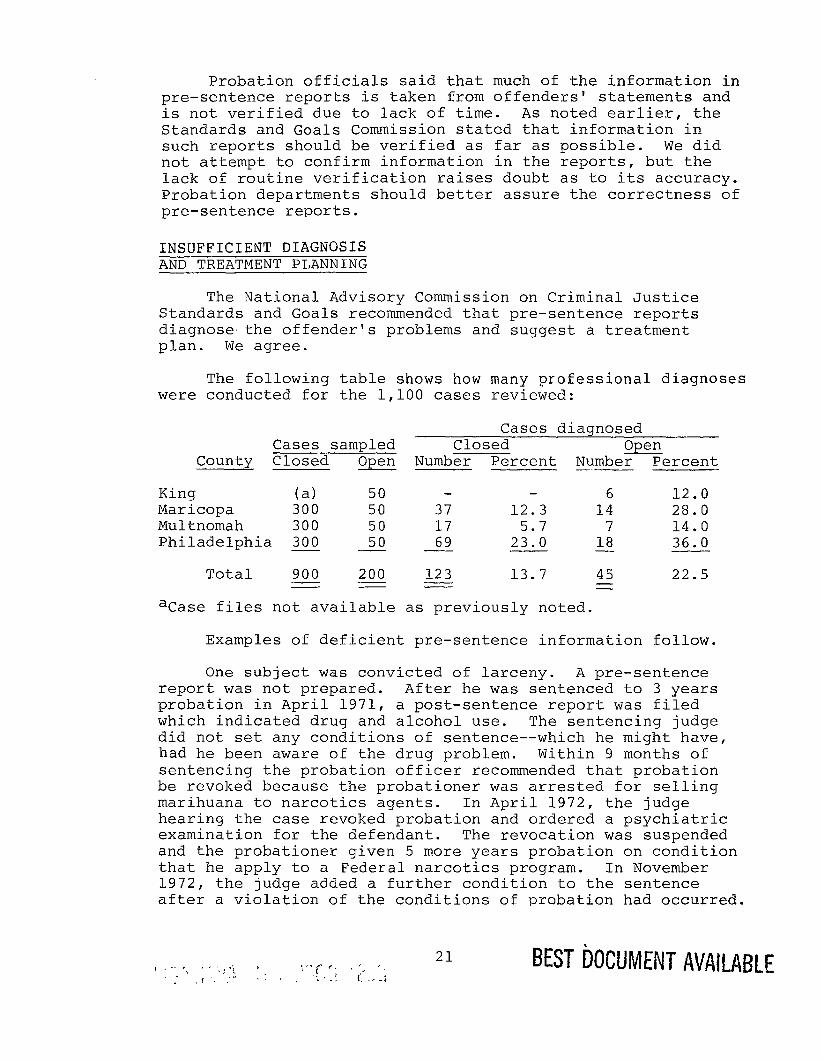
The National Advisory Commission on Criminal Justice Standards and Goals recommended that pre-sentence reports diagnose.the offender's problems and suggest a treatment plan. We agree.
The following table shows how many professional diagnoses were conducted for the 1,100 cases reviewed:
Cases diagnosed Cases sampled Closed Open
County Closed Number Open Percent Number Percent I~
King (a) 50 6 Maricopa 300 50 37 12.3 14 Multnomah 300 50 17 5.7 7 Philadelphia 300 50 69 23.0 18 - -
Total 900 200 123 13.7 45 - - aCase files not available as previously noted.
12.0 28.0 14.0 36.0
22.5
Examples of deficient pre-sentence information follow.
One subject was convicted of larceny. A pre-sentence report was not prepared. After he was sentenced to 3 years probation in April 1971, a post-sentence report was filed which indicated drug and alcohol use. The sentencing judge did not set any conditions of sentence--which he might have, had he been aware of the drug problem. Within 9 months of sentencing the probation officer recommended that probation be revoked because the probationer was arrested for selling marihuana to narcotics agents. In April 1972, the judge hearing the case revoked probation and ordered a psychiatric examination for the defendant. The revocation was suspended and the probationer given 5 more years probation on condition that he apply to a Federal narcotics program. In November 1972, the judge added a further condition to the sentence after a violation of the conditions of probation had occurred.
BEST ilOCUMENTAVAllABL&
He also ordered a mental hearing. The probationer was re- leased after 30 days at the State hospital, where he had been "destructive on the ward." January 1973,
He was deemed sociopathic. In as suggested by hospital personnel, he was
moved into a halfway house. In his first 7 days in the half- way house he had not sought work as required, and he left without permission. The probation officer again recommended that probation be revoked on January 30, 1973. A supplemental recommendation was written after the subject was arrested on February 4, 1973, for criminal activity in drugs sale. Probation was revoked, with a judicial recommendation for psychiatric treatment during imprisonment.
Another subject was arrested on March 8, 1970, for bur- glare, larceny, and receiving stolen goods. On March 30, 1970, he was arrested for illegal use of solvents, i.e., glue sniffing. In September 1970, he was given 2 years probation for the original charges and fined $100 for the glue sniffing charge. The case file contained no indication of any diagnosis made or services delivered during the 2 years in connection with the probationer's glue sniffing. The subject was arrested twice during pro- bation on charges of burglary, larceny, receiving stolen goods, conspiracy, and passing worthless checks. For one arrest, he was sentenced to 6 to 12 months in prison, of which he served 2 months before being paroled. For the second arrest, he received 4 years probation to begin in August 1972, and his original probation was revoked. In 1974, the subject was convicted of burglary and related charges. Both a pre-sentence investigation and a psychiatric evaluation were made in October 1974. These reports indicate a number of problem areas, including possible drug abuse and possible brain damage due to glue sniffing since age 11. Both reports recommended enroll- ment in a drug treatment program. The case file did not indi- cate the sentence.
Had these individuals received formal pre-sentence diagnoses and investigations, the mental health and drug problems might have been found and treatment ordered. Early treatment might have changed the outcome of these cases.
Existing diagnostic services
Although only a small percentage of probationers received formal diagnoses, each county reviewed had a diagnostic pro- cedure.
Maricopa
Written procedures for the Maricopa County Adult Pro- bation Department recommend that expert psychological evalua- tion be provided when the defendant is so emotionally dis- turbed as to prevent proper sentencing.
22
BEST DOCUMENT AVAILABLE

Evaluations requested by the court are performed by private psychologists or at the Arizona State Prison diagnos- tic center. We were told the center was used infrequently by the probation department because an evaluation took at least 60 days and court sentencing had to be postponed. However, only about 12 percent of the inactive cases and 28 percent of the active cases sampled included diagnostic evaluations.
Multnomah
Portland, using an LEAA-funded program, has designed a system to reduce certain crimes. Persons convicted of burglary, robbery, assault, murder, rape, or other stranger- to-stranger crimes receive certain diagnoses not given to other offenders. The diagnostic center (1) reports to the courts for use in developing treatment programs, the social, psychological, and physical needs of each adult convicted of one of these crimes and (2) recommends sentencing and treatment alternatives.
Little other diagnostic work is done in Multnomah County unless the convicted person is obviously mentally disturbed. The cases reviewed did not include any of those diagnosed by the center, as its first case was completed in November 1974. State corrections officials recognize the need for diagnosis, but they said caseloads were too large for a full implementa- tion of the proposed statewide client case management system, which would incorporate assessment and diagnostic tools into the client evaluation process.
King
About 40 percent of the felonys in King County received the services of the LEAA-financed community based diagnostic and evaluation project. (The rest received standard pre- sentence investigations.) Included were all offenders who committed certain serious crimes--first or second degree murder, manslaughter, first or second degree assault, arson, robbery, burglary, and all sex crimes, as well as others who displayed significant mental health problems or bizarre behavior.
Project teams which handle these offenders include a pre-sentence specialist and a community-resource specialist. Referrals may be made by these teams for psychological testing, psychiatric evaluation, vocational testing, and/or medical examinations. Client evaluation and recommendations to the court are based on staff's conclusions.
23 $EST DOCUMENT AVAILABLE

State officials believed they need similar diagnostic units in other areas. King County's diagnostic program had not been in operation long enough for us to review its effectiveness.
Philadelphia
The Philadelphia Adult Probation Department has a psychiatric unit to provide evaluations of offenders in addition to, or instead of, pre-sentence investigations. These evaluations are made when requested by a sentencing judge or a probation officer with the judge's approval. A psychiatric or psychological evaluation may be requested to (1) determine a defendant's competency to stand trial or (2) aid the judge in deciding sentence and the probation officer in helping the probationer.
The evaluations are aimed at diagnosing the subject, evaluating his threat to the community, and recommending treatment. If the subject is considered to be in an acute psychotic state or has a chronic or deteriorating mental condition, commitment to a mental hospital may be recommended. Probation may be recommended if the subject seems able to withstand the stress of normal community living, motivated towards self-improvement, and not dangerous to himself or the community. Finally, a subject who is emotionally unstable, has a criminal life style, and is a threat to the community may be recommended for imprisonment.
At the time of our review, the psychiatric unit had five psychiatrists and three psychologists under a contract with a local university. A psychiatrist and a psychologist team up to prepare an evaluation. Several Philadelphia judges indicated they request psychiatric evaluations for offenders who commit violent crimes or whose behavior appears strange. Of the 350 cases we sampled in Philadelphia, 87 had received a pre-sentence examination.
CONCLUSIONS
In about 46 percent of the 1,100 cases, no pre-sentence reports were prepared. Only about 15 percent of the offenders received professional evaluation to help the courts decide sentence. If each offender would be given simple diagnostic tests, such as educational, vocational, attitude, and aptitude, before sentencing, and followup comprehensive tests by psy- chiatrists and psychologists when necessary, judges would have better information which could improve sentencing decisions.
24 BEST DOCU[VIENT AVAILABLE

CHAPTER 6
LACK OF SERVICES TO PROBATIONERS
Important influences on whether probationers are reha- bilitated are the extent and effectiveness of services they receive. To assess these services, we reviewed the closed cases in Maricopa, Multnomah, and Philadelphia counties1 and sent questionnaires to probation officers who supervised or were familiar with the cases.
Although some offenders benefited from services provided during probation, many did not receive needed services.
--Only 23 percent completed programs designed to address their needs.
--About 59 percent of court-ordered conditions of sentence and rehabilitative services were not enforced by probation departments.
--There was a highly significant statistical relationship between the extent to which pro- bationers received needed services and success on probation, that is, as the probationer received more of the services he needed, he was more likely to complete probation successfully.
Probationers can receive services from community organizations and from the probation departments which supervise them. Probation officers should provide a number of direct services to offenders, such as
--arranging for necessary job training, education, drug or alcohol treatment, health care, and counseling,
--providing personal and family counseling, and
--providing direct assistance in changing housing or obtaining specific benefits like unemploy- ment insurance, welfare, or food stamps.
Some probation officers also perform investigations before writing pre-sentence reports. Probation officers also are
1We were unable to include cases from King County, Washington, because case files are usually destroyed after the probation period expires, in accordance with probation department pol- icy. /

required to carry out investigations and write revocation recommendations when offenders on probation either violate conditions of probation or commit new crimes.
The following charts show information about the 900 probationers we sampled to assess service delivery and effect. More complete information can be found in appendix IV. Having such information makes it easier to understand some of the probationers' problems and needs.
These key facts show that:
--At least 61 percent had not completed high school.
--40 percent were unemployed at arrest. Another 16 percent were employed in unskilled or manual labor.
--59 percent of the offenses committed were pxop- erty offenses, 19 percent were against persons, and 18 percent were drug offenses.
--At least 63 percent were not first-time offenders.
--57 percent of the major treatment needs were related to employment and vocational and academic education.

KEY FACTS ABOUT PROBATIONERS
MARITIAL STATUS HIGHEST GRADE LEVEL ATTAINED UNKNOWN 7%
SINGLE 49%
MARRIED 31%
NOT
OCCUPATION ROFESSIONAL
UNEMPLOYED
PRIOR CONVICTIONS UNKNOWN 4%
1ST CONVICTION)
NINETEEN 5
TWENTY AND OVER 1%
4%
HIGH SCHOOL
GRADUATION
CRIMES SENTENCE FOR
AGGRAVATED
ASSUALT 9
BURGLARY 26%
THEFT 19%
AND
ITER
4%
SERVICES NEEDED MEDICAL 6%
COHOL 7%
COUNSELING
EMPLOYMENT
DRU
HABIL
DUCATION 14%
27
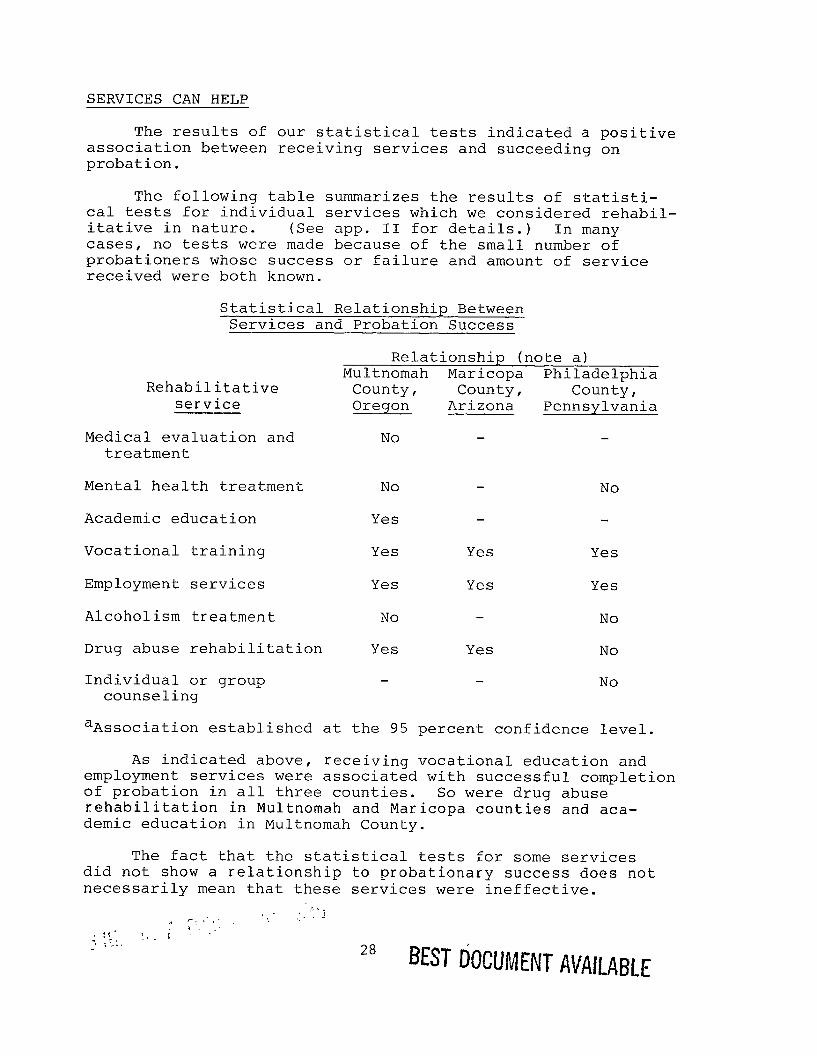
SERVICES CAN HELP
The results of our statistical tests indicated a positive association between receiving services and succeeding on probation.
The following table summarizes the results of statisti- cal tests for individual services which we considered rehabil- itative in nature. (See app. II for details.) In many cases, no tests were made because of the small number of probationers whose success or failure and amount of service received were both known.
Statistical Relationship Between Services and Probation Success
Rehabilitative service
Medical evaluation and treatment
Mental health treatment
Academic education
Vocational training
Employment services
Alcoholism treatment
Drug abuse rehabilitation
Individual or group counseling
Relationship (note a) Multnomah Maricopa Philadelphia
County, County, County, Oregon Arizona Pennsylvania
No
No
Yes
No
Yes
Yes
No
Yes
Yes
Yes
Yes
Yes
Yes
No
No
No
aAssociation established at the 95 percent confidence level.
As indicated above, receiving vocational education and employment services were associated with successful completion of probation in all three counties. So were drug abuse rehabilitation in Multnomah and Maricopa counties and aca- demic education in Multnomah County.
The fact that the statistical tests for some services did not show a relationship to probationary success does not necessarily mean that these services were ineffective.
3 --: : ,:. I ,a C.,-:
28 BEST IhCUMEivT AVAILABLE

For example, the fact that alcoholism treatment could not be shown to be statistically associated with successful pro- bation could be explained if a large number of probationers who received such treatment also had other problems which were untreated.
To avoid the problems associated with testing each service, we looked at the extent to which a probationer received the range of services listed on the previous page. We determined that there was a highly significant association in each of the three counties between the extent to which a probationer received needed services and success in probation. (See app. II.)
A recent study by Robert Martinson, an expert in criminal rehabilitation, concluded that rehabilitation has generally been unsuccessful and its role in the criminal justice system needed reexamining. 1 Qur test results do not negate his conclusions. But we have shown that in certain circumstances rehabilitative services can help reduce offenders' tendency to commit additional crimes.
Our findings could have important implications for decisionmakers interested in improving probation operations. If probation departments could allocate their scare resources more effectively, they could begin to more adequately rehabil- itate offenders.
Following is an example of an individual who was helped because his probation officer found the type of service needed and arranged for the probationer to participate. A 30-year-old offender was sentenced to 3 years probation for illegal possession of narcotics. A special condition of sentence required him to take part in the State rehabilitation program. The probation officer found the probationer at his parents' home under the influence of drugs, several months after the probation began. Instead of sending the client to the State hospital, the probation officer arranged for him to enter a self-help rehabilitation program. The pro- bation officer in this case was so impressed with his client's progress in removing himself from the drug scene and becoming involved in helping others with drug problems, that he recommended early end to probation, which was granted. A followup of this case after 19 months showed no further arrests or convictions.
l"What Works? - Questions and Answers About Prison Reform," Public Interest, No. 35, Spring 1974.

PROBATIONERS' NEEDS WERE INADEQUATELY IDENTIFIED AND ADDRESSED
To plan for services, a probation system should assess probationers' needs. Problem areas can thus be highlighted and priorities determined. This process makes it possible to specify how, for whom, when, and why the various needs are to be met. Specifying objectives in this manner makes it easier to evaluate the system's success in identifying and providing services.
In reviewing case files, we found (1) lack of rehabilita- tion plans, (2) failure to comply with court conditions, and (3) inadequate delivery of service for such needs as unemployment, drug and alcohol problems, and academic and vocational train- ing deficiencies.
Lack of a rehabilitation plan
Corrections experts generally agree that an effective rehabilitation program should include a plan for each indivi- dual which recognizes what services that person needs to become a useful member of society. Interim evaluations are also needed to assess the plan's effectiveness and to change when necessary.
The extent of probationers' needs, such as education, drug abuse treatment, and employment are shown in the charts on page 27. Most probationers, however, did not have a written rehabilitative plan that identified their needs because such plans were not required by probation departments. Pro- bation officers stated that an offender's plan is usually an unwritten composite of court-ordered conditions, probation- officer-analyzed conditions, and probationer-requested services. Responses to our questionnaires by 74 percent of the probation officers who supervised the 900 closed cases showed that written plans were prepared for only 38 percent of the probationers under their supervision.
Cases for which Total closed information was Cases having plans
County cases available on plans Number Percent
Maricopa 300 159 77 48 Multnomah 300 289 79 27 Philadelphia 300 220 99
Total 900 668 255 38
BEST. DOCUMENT AVAILABLE

Oregon's new client case management system provides for a full analysis of needs and a written rehabilitation plan. Probation officers and probationers agree on a written plan and then carry it out. Oregon State probation officials said probation officers have resisted the new system because of already excessive caseloads and the amount of added work required. We were told by State Corrections Department officials that an increase in the number of probation officers, needed to reduce caseloads, has been denied by the State legislature.
Each county required progress reports to the court on every case supervised. Such a report, although not a formal rehabilitation plan, at least provides some indication of an offender's progress. The problem is that these reports usually cannot measure progress against specific goals because rehabil- itation plans including such goals were not prepared. Maricopa and King county officers prepared progress reports every 120 days. Philadelphia County officers prepared reports about every 3 months. Multnomah County required progress reports semiannually, unless restitution or child-support payments were a condition of the offender's sentence. In such a case, or when the probation officer and his supervisor agreed that the case needed closer supervision, a quarterly report was submitted.
Most judges noted the need for formal rehabilitation plans. Of 101 judges responding to questionnaires in the 4 counties, 75 said a written, detailed rehabilitation plan is necessary to help assure treatment of diagnosed needs. In addition, 63 judges believed the plans should be approved by judges after the probation officers develop them.
Court-imposed conditions not met
At the time of sentence the court normally assigns certain standard conditions of probation, violation of which could cause probation to be revoked. Examples of standard conditions are
--remaining law-abiding,
--not leaving the State without the probation officer's approval,
--refraining from excessive use of intoxicating liquors, and
--not possessing or using drugs in violation of any law.

Judges may also require a probationer to fulfill special conditions, such as maintaining employment while on probation, paying restitution, or enrolling in rehabilita- tive programs.
We found that probationary conditions ordered by judges generally were not being met. The following table shows the extent of compliance with court-ordered conditions for the cases sampled in the three counties.
Court-ordered Number of Compliance conditions cases Number Percent
Restitution 145 89 61 Court costs 74 41 55 Mental health treatment 43 18 42 Medical evaluation 20 8 40 Alcoholism treatment 42 12 29 Drug abuse rehabilitation 79 17 22 Academic education 12 4 33 Vocational training 13 3 23 Employment (securing and keeping) 60 14 23 Counseling 19 3 16
Total a507 209 41
aThere were an additional 75 cases which had court-ordered conditions, but we could not determine compliance. There- fore, we did not include them in the analysis.
The average compliance with court-ordered conditions of probation in each county was as follows.
County Percentage
Maricopa 46 Multnomah 33 Philadelphia 51
Because only 41 percent of court-ordered conditions were met before probation ended and courts generally did not monitor compliance, all States should have an information sys- tem which would indicate probationers' compliance with conditions of sentence. The percentage of court conditions met also indicates a need for better probation department management.
Some improvements were being made to insure that court conditions were met. For example, Multnomah County recently initiated a computerized listing of the account status of
BESTDOCUFllENTAVAlLABLE

those probationers sentenced to pay fines and restitution. Judges receive a monthly report which shows how well proba- tioners whom they sentenced are meeting their obligations.
A similar tracking system has not been developed for monitoring the services that probationers are sentenced to receive. About 78 percent of the Multnomah County judges believed that probationers' compliance with conditions of probation has been only fair or poor, but neither the courts nor the probation department knew the extent of noncompliance with conditions. Information on fines and restitution payments should help probation departments make such deter- minations.
King County recently began requiring probation officers to write violation reports on all clients who do not comply with court conditions and commit technical violations. The judge then decides what action will be taken.
Following is an example of court conditions not enforced. In August 1973, an offender was sentenced to 5 years pro- bation for burglary and larceny. The court recognized that the offender was a drug addict, and as a condition of pro- bation, directed that the offender be placed in a drug re- habilitation unit and periodic urinalysis reports be provided to the court.
Our review of the case file shows the subject was assigned to the drug unit. The file contained no indication that urinalysis reports were ever provided the court. One year after being placed on probation, the probation officer notified the offender that an appointment had been made for a urinalysis test to comply with the court condition. The subject failed to appear for the scheduled test. In November 1974, the subject was arrested for robbery, theft, unlawful taking, receiving stolen property, criminal con- spiracy, possession of a weapon, and violation of the Uniform Firearms Act. He was held for trial, and at the time of our review, a detainer was in force pending disposition of the new charges.
Allowing probationers to continue or complete probation once they have violated the basic conditions of probation seriously interferes with rehabilitation. Under these conditions, repeat offenders do not take conditions of probation seriously.

Service deliverv inadecuate
Probationers needed various services, but those that needed rehabilitation did not participate in relevant pro- grams which might have helped meet those needs. Each county supplied a different amount of services.
We determined probationers' needs, participation in programs, and reception of services, by analyzing such in- formation in case files as pre-sentence reports, court-im- posed conditions, psychiatric diagnoses, and probation officer progress summaries. However, we cannot be sure that we identified all needs; for example, as noted on page 21, only about 14 percent of closed cases received a formal diagnosis. We did not determine the quality of the services provided.
The following graph shows the percentage of the major needs (medical, mental, academic, vocational, employment, alcohol and drug abuse rehabilitation, and counseling) that were satisfied for the 900 probationers sampled.
TOTAL IDENTIFIED NEEDS SATISFIED
COMPLETED COMPLETED
On~~~if~i36t;tl:1?3:.;per~ent-iof.~identified needs were satisfied in that an offender 'co'mpleted,'a treatment program.
34
BEST DOCUMENT AVAILABLE

The average percentage of services completed in each of the counties is shown below.
Maricopa 19% Multnomah 21 Philadelphia 26
The following table shows how many probationers had specific service needs and how many completed participation.
Service
MedIcal evaluation and treatment
Mentai health service Academic education Vocational tralnlnp Employment (securing
and keeping) Alcohol programs Drug programs Cou"sell"g (group
and individual)
Total
Services Provided to Probationers
Number partlcipatlng Percent cases of Partial of
ldentlfied or participation need Unknown none Complete (note a)
108 27 34 47 142 28 77 37 225 44 153 28 250 59 144 47
520 124
;i 288 143 78 22
226 37 142 47
156 46 85 25 - -
1,751 354 1,001 396 - - - -
58 32 15 25
2% 25
23
28
aconsiders only known cases. Probatron offlclals attributed the low particrpatlon (complete for only 28 percent of know" cases) to probationers' lack of motlvatlo" and probation officers' excessive caseloads. Althol?gh services were not always delIvered "or programs always attended, probation officers did make referrals to service agencies. For example, probatxoners had been referred to service agencres for treatment of at least 602 of their 1,751 ldentlfled needs (34 percent).
Detailed analysis of the sampled cases shows that pro- bationers generally had problems in the following areas-- employment, academic education, vocational training, drugs, alcohol, and mental health.
Lack of employment opportunities
Of the 900 probationers, at the time of arrest,
--363, or 40 percent, were unemployed. --377, or 42 percent, were employed. --65, or 7 percent, were not considered employable. --For 95, or 11 percent, employment was unknown.
At the completion or termination of probation:
--329, or 37 percent, were unemployed. --417, or 46 percent, were employed. --22, or 2 percent, were not considered employable. --For 132, or 15 percent, employment was unknown.
BEST DOCUMENT AVAILABLE

The lack of job opportunities in most locations we re- viewed limited the effectiveness of employment services. Unemployment rates were high and the types of jobs available to probationers were limited. For example, the seasonally adjusted unemployment rate for January 1975 was 9.6 percent in Maricopa County.
In the four States we visited, the unemployment rate for offenders was higher than the seasonally adjusted un- employment rate for the area. For example, while the un- employment rate for the Portland metropolitan area was 6.3 percent in December 1974, the unemployment rate for all offenders supervised by the Portland corrections division was 21 percent.
Many probationers were employed as waitresses, farmhands, and general laborers. While jobs were available for clerks, professionals, salespersons and manufacturing and construct- ion workers, most of these require particular skill, professional training, or education to qualify.
Limited academic education and vocational training
The lack of marketable skills has limited probationers' ability to obtain employment. However, most probationers do not complete academic education or vocational training programs.
Of the 250 probationers we identified as needing vocat- ional training, 37 percent were referred to service agencies by probation officers and 8 percent received services from probation officers without further referral. The other 55 percent were either not referred to programs or went on their own. The extent to which the 250 probationers participated in vocational training programs follows:
--34 percent did not participate, --24 percent participated partially. --19 percent completed programs. --Participation of 23 percent could not be
determined.
In addition, 225 probationers needed academic educat- ion. Probation officers referred only 20 percent of these to service agencies and provided services to only 6 percent. Of the 225 probationers,
--47 percent did not participate in any program, --22 percent participated partially,
36

--12 percent completed programs, and --could not determine the extent to which the
remaining 19 percent participated.
The high unemployment among the sample probationers, along with their low incomes, indicates that probationers need special assistance to obtain and compete for available job openings. Educational or remedial programs should help these probationers get jobs.
Drug, alcohol, and mental health problems
Many of the probationers included in our sample of 900 closed cases had drug, alcohol, or mental health problems that were not adequately treated. The following table shows the extent to which the 492 identified needs were treated.
Service
Cases of Service identified Referrals
need completions
Number Percent Number Percent
Drug program Alcohol program Mental health
service
226 116 51.3 47 20.8 124 54 43.6 22 17.7
142 68 47.9 37 26.1
Total 492 238 - zzz==zz 48.4 106 - 21.5
The reasons why probationers failed show the importance of addressing these needs. Analysis of 350 probationers who failed in 3 counties showed that many had drug, alcohol, or mental health problems that were insufficiently treated. While 273 treatment needs were identified among the 350 offenders who failed on probation, overall only 15 percent (41) of the needs were completely met. Service needs were adequately handled for 13 percent of drug problems, 11 per- cent of alcohol problems, and 22 percent of mental health problems.
CURRENT PROBATIONERS ALSO NOT RECEIVING SERVICES
To determine if probation services had improved since the closed cases were sampled, we also examined 200 active cases. About 65 percent of these active cases were not first-time offenders, compared with 63 percent of the 900 closed cases for which we obtained information. Service delivery has improved somewhat: however, a systematic assessment of all probationers' needs is still lacking, as is sufficient probationer participation in available rehabilitative programs.
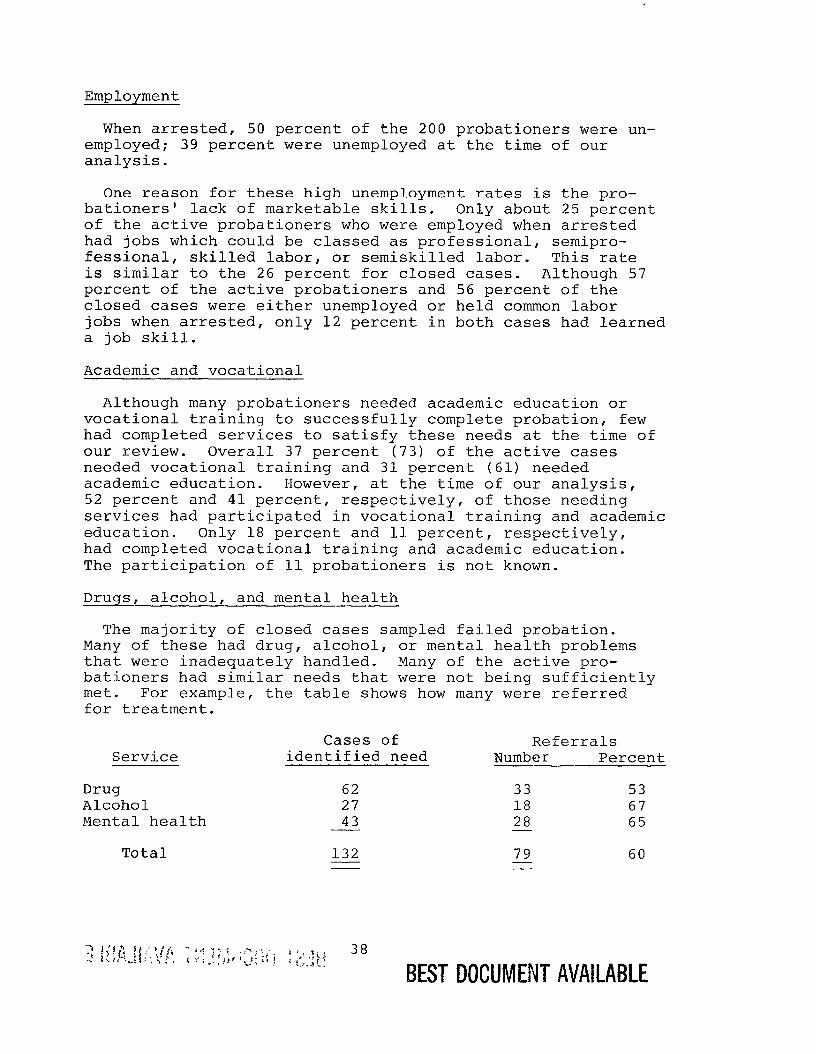
Employment
When arrested, 50 percent of the 200 probationers were un- employed; 39 percent were unemployed at the time of our analysis.
One reason for these high unemployment rates is the pro- bationers' lack of marketable skills. Only about 25 percent of the active probationers who were employed when arrested had jobs which could be classed as professional, semipro- fessional, skilled labor, or semiskilled labor. This rate is similar to the 26 percent for closed cases. Although 57 percent of the active probationers and 56 percent of the closed cases were either unemployed or held common labor jobs when arrested, only 12 percent in both cases had learned a job skill.
Academic and vocational
Although many probationers needed academic education or vocational training to successfully complete probation, few had completed services to satisfy these needs at the time of our review. Overall 37 percent (73) of the active cases needed vocational training and 31 percent (61) needed academic education. However, at the time of our analysis, 52 percent and 41 percent, respectively, of those needing services had participated in vocational training and academic education. Only 18 percent and 11 percent, respectively, had completed vocational training and academic education. The participation of 11 probationers is not known.
Drugs, alcohol, and mental health
The majority of closed cases sampled failed probation. Many of these had drug, alcohol, or mental health problems that were inadequately handled. Many of the active pro- bationers had similar needs that were not being sufficiently met. For example, the table shows how many were referred for treatment.
Service Cases of Referrals
identified need Number Percent
Drug 62 33 53 Alcohol 27 18 67 Mental health 43 28 65 -
Total 132 79 60 - -

The extent to which those referred will complete their treatment is unknown because they are still on probation and receiving services.
CONCLUSIONS
Our study showed that services provided do lead to success on probation. Therefore, probation departments should try to provide probationers with as many of the needed services as possible. At the same time, probation depends on the probationer's being positively motivated to (1) coop- erate with his probation officer and (2) avail himself of the various supportive services.
Federal, State, and local probation officials stressed the importance of probation and supportive services to the corrections system. The following chapter discusses problems which limit the delivery of services.

CHAPTER 7
WHY SERVICES WERE NOT DELIVERED
The services discussed in chapter 6 were not delivered for many reasons, some beyond the control of the probation department, or other elements of the criminal justice system. For example, probationers may not be motivated to accept or complete programs. Community programs may not have adequate ways to insure participation. But service delivery could be improved. Problems affecting the system's ability to adequately deliver services include
--excessive caseloads,
--inadequate supervision of probationers,
--limited use and availability of community resources,
--poor coordination between probation and service organizations, and
--insufficient sentencing alternatives.
EXCESSIVE CASELOADS
In 1967 the President's Commission on Law Enforcement and Administration of Justice recommended that probation and parole caseloads should average about 35 cases per probation officer. In the 4 counties we reviewed, caseloads ranged from 64 to 93 and averaged 85 in December 1974. Based on the Commission's standard, the 4 counties had 419 fewer proba- tion officers than recommended. The following table shows the number of additional probation officers needed.
Number of officers Based on Required to meet
County Actual caseloads of 35 staffing standard
King 51 136 85 Maricopa 33 60 27 Multnomah 42 79 37 Philadelphia 166 436 270
Total 292 711 419
In addition to supervising probationers, probation officers are responsible for preparing pre-sentence reports, violation reports, and other administrative reports. The effect of the large workload is that probationers are not closely supervise,d or provided necessary services.
40
BEST DOCUMENT AVAILABLE

The 1973 Standards and Goals report recommended a systems approaeh to identify service objectives and set up job tasks. This approach is similar to the workload concept which more accurately reflects the probation officer's re- sponsibilities and time requirements than the caseload standard. An appropriate workload should aid the probation officer by allowing more time to diagnose, counsel, provide, or refer probationers to needed services.
One State we visited had adopted and two States were considering adopting a workload concept so more services and better supervision could be provided probationers. Under this type of program, a probation officer's workload would be based upon the service needs of each case and the time the officer has available to provide services during a month. "Work units," ranging from 1 to 5, are assigned to each.probation case based on risk to society and service and time needs. An offender on minimum supervision would be 1 unit and an offender on maximum supervision would be 3 units. Other work such as pre-sentence investigations would also be assigned a number of work,units, such as 5. Thus, on a 120-work-unit standard an officer might handle any number of cases at any level of risk or service need, up to a total of 120 work units.
However, without increased funding for additional staff to handle the workload, the two States that were considering adopting the workload system cannot implement a systems or workload approach as recommended by the 1973 Standards and Goals study.
Sentencing practices can also affect the number of cases probation departments supervise. In Philadelphia County, for example, if a person on probation is convicted of a new crime, a second judge may place the offender on a second probation. The probation officer has two cases to handle and two judges to write reports for. For example, in April 1971 an offender was sentenced to 2 years probation for burglary. While on probation, the subject was arrested four times and convicted twice. As a result, the subject was serving three probation sentences simultaneously under three different judges.
However, in Multnomah County, if a defendant is guilty of a second criminal offense, the two judges would discuss the new offense. The judges may decide to (1) revoke the first probation or (2) extend probation and add specific court conditions.

Probation officer turnover
Another factor limiting service delivery and probationer supervision is probation officer turnover, caused by termi- nation of employment, promotion, or transfer. Probationers must therefore be reassigned to other probation officers, losing continuity of supervision and service delivery.
Staff changes are inevitable. But probation becomes less effective when new staff are assigned to work with probationers for whom no previous rehabilitation plan was prepared. Since written rehabilitation plans were prepared in only 38 percent of the closed cases (see p. 30), we believe the turnover rate has adversely affected probation departments' ability to properly supervise offenders. The following chart shows the county turnover rates.
County
1974 officer turnover rate
(note a)
King Maricopa Multnomah Philadelphia
24% 34
b;i
Average 27
a/Officer turnover rate equals the number of staff changes - for the year divided by the average number of probation officers employed during the year.
b/Excludes probation officers dismissed or asked to resign. -
Probation officers told us that reasons for probation officer turnover were lower salaries than in the Federal probation system, large caseloads, massive paperwork, and frustration with the system.
NEED FOR CLOSER SUPERVISION
Large caseloads limit time for supervising probationers. Supervision allows the officer (1) to counsel probationers and refer them to service agencies and (2) when their life styles or behavior change, to perform close surveillance which may protect the public and preclude a new offense.

Lack of supervision due to high caseloads contributed to probationers' committing crimes and violating conditions of probation. As noted in chapter 4, almost half of the probationers in our closed-case sample were convicted of crimes and violated probation conditions while on probation. Furthermore, 37 percent of those still on probation had been convicted of new crimes. Probationers need closer supervision.
One hundred four judges responding to our questionnaire indicated the supervision provided by the probation depart- ment should protect society. However, 78 (75 percent) of the judges believed this supervision was only poor to fair.
Efforts to improve
In October 1974, a workload measurement study was completed on Washington State's probation and parole pro- gram. The study showed:
--Probation officers spend 22 percent of their time with offenders. However, of the contacts between officers and probationers (9,827 over a 4-week period), 70 percent were in the probation office, 15 percent were in jails, and only 15 percent were in the field--i.e., offenders' homes or places of employment.
--The average time for case supervision was 34 minutes per month per offender, including all paperwork and contacts with family, employers, and the offender. (The average time is not the usual time, as officers may spend hours on some offenders and almost no time on others.)
--Probation officers respond to crises that affect offenders under their supervision and to public officials who want investigative reports.
--132 additional parole and probation officers are needed by the end of 1977.
--Many parolees and probationers are inadequately supervised. The public is thus not protected and offenders do not receive the help they need.
The Oregon Corrections Division--at the direction of the State legislature-- completed a similar study in February 1973 to develop a case management system. The study found probation officers spent 73 percent of their time on indirect
43 BEST DOCUMENT AWLABLE

activities such as investigatrons, reports, workload manage- ment, and travel: they spent only 27 percent of their time in face-to-face contact with clients and others. The study rec- ommended that the Corrections Division reduce the amount of an officer's time spent on activities not related to direct con- tact with the probationer and others involved in the case.
Probation departments have been trying to improve supervision and service delivery by studying probation officers' workloads and by requesting additional LEAA, State, and local funding. However, State and local funding con- straints have prevented reducing caseloads or purchasing needed services for probationers.
For example, in response to the workload measurement study conducted in Washington State, the Office of Adult Probation and Parole requested budgeting for 261 officers by the end of 1977, an increase of 132. The Governor's office reduced the request to 199 officers before submitting it to the legislature. Department officials estimated this re- duction would cause 17 percent of the offenders to receive less supervision than is desirable. However, the State legislature established no additional funding but authorized the probation office to apply to the State Criminal Justice Planning agency for a Law Enforcement Assistance Administration grant for 48 additional officers.
The Washington Office of Adult Probation and Parole began drafting the application for an LEAA grant during our review. If LEAA approves the application, a total of 177 officers will be available, 22 less than the Governor's re- quest. Therefore, more than the 17 percent of the offenders originally estimated will be undersupervised.
Likewise, the case management system to increase supervision of probationers developed by the Oregon Correct- ions Division was not implemented, because the State legis- lature did not provide funds.
Pennsylvania's Director of State Probation told us he is trying to reduce county caseloads from 95 -to 65. An addition- al 215 county probation officer positions would be needed at a cost of $2.5 million. The Director had asked for the of- ficers but believed it unlikely that the State legislature would provide the necessary funding for fiscal year 1975.

Use of minimum service caseloads
To provide more services and better supervision to probationers who need them, Maricopa and King Counties have adopted minimum service caseloads. Minimum service caseloads differ from regular caseloads in that probationers receive minimum supervision and do not see a probation officer or obtain services except by their request. Probationers mail in monthly reports. One minimum service probation officer may thus handle many cases. King County minimum service officers, for example, each have about 378 cases. This system reduces caseloads for other officers and allows them more time to provide services and supervision. As of May 1975, King County had 1,891 and Maricopa County had 201 offenders on minimum supervision.
One problem associated with the minimum service caseload is selection of cases. The chief of King County probation said subjective criteria are used, such as the probation of- ficer's opinion as to the potential for dangerous behavior and how well the probationer had done in the past. Maricopa County also established criteria for placing probationers on minimum service. The criteria include such factors as payment of restitution, arrests while on probation, attitude, and need for services. Predictive models (see chapter 8) could also help select offenders for minimum supervision.
OTHER PROBLEMS IN SERVICE DELIVERY
In all the counties reviewed, rehabilitation programs. were available but were not always used because of limitat- ions and lack of coordination among the various programs. As noted in chapter 6, there was a highly significant statistical relationship between providing needed services and successful probation: however, only about 23 percent of the service needs of probationers were satisfied.
Limited use and availability of community resources
Although community resource programs are needed, they were not always available to probationers because of limited capacity or various agency restrictions. We made a limited review of community services and did not evaluate the individual programs. However, examples were noted in two counties of either limited use or unavailability of community resources.
45 BEST DOCUMENT AVAILABLE

In Philadelphia County, probation officers said they cannot always refer probationers to a service agency because of factors which limit its availability to pro- bationers. Such factors include (1) number and nature of a probationer's crime (2) his age, residential location, and ability to pay, (3) other program requirements, and (4) backlogs of applicants.
One officer maintained that a probationer's criminal record is the biggest problem prohibiting acceptance by service agencies. Another indicated that some agencies will not accept probationers who are over 45 years old or drug users. Some mental health centers will not accept probationers who are 'too crazy or too violent." Some agencies do not want to accept sex offenders. Some accept only applicants whose residence is within specified geograph- ical limits. Others do not want court referrals, because they believe that such people may not want help and would disrupt their program.
In King County, community service agencies listed similar eligibility requirements that limited availability. These requirements included limitations as to a probationer's offense, age, sex, and residential location.
The following case illustrates some of the referral problems and the limited use and availability of community resources. An offender was sentenced to 2 years probation for burglary, beginning in April 1971. Information contained. in this probationer's case file shows that at least from the outset of probation, probation officials recognized that this individual (1) was a drug addict, (2) had previously had a nervous breakdown, (3) was living on welfare, and (4) may have been an excessive user of alcoholic beverages.
Throughout 1971, the probationer received little mean- ingful assistance from the probation department. On at least four occasions, the probationer was unable to enroll in drug rehabilitation programs or get treatment, because the programs were overcrowded or required waiting periods. The probation officer's assistance in this regard was limited to making telephone calls on the probationer's behalf and encouraging her to seek help.

In January 1972, after the probationer had been arrested twice and sentenced to 2 more years probation, she asked the probation officer to get her into a hospital for drug treat- ment. The officer telephoned an institution and was informed that no more room for female drug addicts would be available for an indefinite time.
The record shows that the probationer's drug addiction was a major reason for her criminal activity. Although this problem was recognized when the offender was first placed on probation in April 1971, she was not placed in a residential drug treatment program until June 1972.
In April 1973, the probationer was arrested on charges of prostitution and assignation. Although she was acquitted, in September 1973 another violation of probation hearing was held, and the judge terminated the probation sentence which began in April 1971. In October 1973 the probationer was arrested for larceny and subsequently was incarcerated in a State correctional institution for a maximum of 3 years.
Whether this probationer could have been rehabilitated is uncertain; however, the lack of prompt assistance from the probation department obviously did not help matters.
Need to improve coordination between probation and service organizations
Probationers' needs relating to drug and alcohol training, employment, and abuse rehabilitation are best provided for by outside agencies, because probation depart- ments do not have the necessary resources. These services are available but restricted. The 900 closed cases sampled in 3 counties had 1,751 identified needs for such things as drug and alcohol abuse rehabilitation, training, and employ- ment. Our data showed that probationers had been referred to service agencies for 34 percent of their identified needs.
One way to increase the probationers' participation in the various community programs would be to improve coordi- nation. Following are examples of the need for action.

The chief of field operations for the Oregon Employ- ment Division told us he has assigned eight full-time em- ployment specialists to work with the Corrections Division. Employment and corrections officials said all of the specialists work primarily with offenders in institutions. Only one of these specialists works part time with the probationers in one of the three Portland region probation offices. We believe that the employment service should be provided to all probation offices and that by better coordinating their efforts, these specialists could spend more time working with probationers.
In Maricopa County, probationers are referred to the Department of Economic Security for job leads, so proba- tioners receive at least limited employment assistance. However, the ex-offender service, a separate section of the Department of Economic Security, is not used by the probation department. Probation department officials stated that their employment coordinator had access to the same "job bank" data as the service and was more efficient in placing probationers. However, since 42 percent of the county's probationers were unemployed as of April 1975, we believe more probationers should be referred to the ex-offender service.
Maricopa County had only one inpatient drug abuse rehabilitation facility available to probationers, although we were told that 16 agencies provided rehabilitation in the county. The available facility has 59 beds and has operated at near capacity, with about 90 percent of the clients probationers. An April 1975 study showed that of the 3,058 active probation cases, 825 (27 percent) had a history of hardcore addiction. Thus additional facilities were needed to treat these probationers.
Before February 1973, probationers were being treated in the Narcotic Addict Rehabilitation Act facility in Phoenix. Subsequently, however, residents from IJIaricopa and six other Arizona counties were excluded from this facility by the Deputy Director of the National Institute for Drug Abuse, a community organization for drug abuse control which has a Federal grant to provide similar services. Since it invoked the residency restriction, the facility has treated an average of 20 clients below capacity. Probationers.had been treated there in the past, and probation department officials said they would have used the project's facility had it not been for the restriction. We were told that the facility officials in Phoenix were seeking to change the policy to allow Maricopa County residents to be treated.
48

None of the counties reviewed had a formal working relationship with drug, alcohol, or mental health agencies. The establishment of such relationships would improve the coordination of services.
Written agreements to formalize working relationships between probation and service organizations were also rare in the States we visited. Such agreements could
--facilitate probationers' use of programs,
--alleviate problems that may occur when a new probation officer makes client referrals, and
--set criteria for the type and frequency of feedback information.
Instead, probation officers generally had informal working relationships.
The Directors of Corrections in Washington and Oregon agreed written service agreements would be useful to improve service delivery because, with formal agreements and possible payment for the services, agencies are likely to be used more and provide better services. However, staff was generally not available to develop agreements. In addition, the clients anticipated that the service agencies would request funds from the probation program to provide the services. Funds were judged unavailable for this purpose due to limited State funding.
Insufficient sentencing alternatives
Sentencing alternatives for probationers should range from secure residential treatment centers, such as halfway houses, to no supervision. Judges said they prefer more supervision; however ineffectiveness, overcrowding, and unavailability are inhibiting the use of such programs.
Of 79 judges responding to our questionnaire, 47 judges indicated they do not fully use halfway houses because the programs were not available, too crowded, or not effective. Twenty-three judges indicated they do not use county jails and 36 judges indicated they do not use minimum security institutions for the same reasons. Thirty-four judges said they used work release because it is available and effective.
In April 1975, a Washington corrections development task force studied the State's correctional system and re- ported its findings to the legislature. This task force
49
BE§7 DOCUMENT AVAILABlE

concluded: "The * * * system has, in most instances, two alternatives: a secure facility or the street. Little of a real graduation of release exists." To resolve this situation, the task force recommended supervised residency and work or training opportunities, with controlled access to the community.
Probation systems could provide more secure facilities like halfway houses. But in Oregon, for example, they are only available to parolees after release from prison. Other types of facilities, such as drug or alcohol programs, which have an open door policy, need to increase supervision.
An Oregon judge cited a recent offender that he had sentenced to 20 years in prison because (1) the offender needed specific medicines to function in society, (2) the offender could not be responsible for his own medicine, and (3) no probation officer or treatment agency could insure that the medicine would be taken. The judge concluded that other sentencing alternatives were needed and the executive and legislative branches of State government should address the problem.
Probation officials in Pennsylvania and Oregon agreed that a greater variety of sentencing alternatives were needed for probationers. Each of the counties reviewed needed different services. In Philadelphia, examples of needed resources included the following.
--Drug and alcohol abuse rehabilitation and mental health facilities for female and inpatient pro- bationers.
--Residence centers for females.
--Halfway house for individuals with mental health problems.
--Vocational training facilities.
We recognize that the probation system does not control the community programs. However, better sentencing altern- atives are needed. .

CONCLUSIONS
Probation cannot effectively rehabilitate offenders and protect society so long as problems in delivering services exist. Eliminating these problems depends on the commitment of resources by all levels of government.
Making community resource agencies more responsive to probationers' needs may be beyond the authority of probation systems. But some improvement could be made through better cooperation and management. One of the challenges facing probation is to make the most effective use of available resources.
Decreasing caseloads in and of itself will not increase a probation system's effectiveness. A probation system must first systematically identify probationers' needs. It then must either directly satisfy these needs or arrange for them to be satisfied by other social institutions or resources. Furthermore, not only do probation officers need to be in- formed about the specific services available, they must also be able to evaluate the services to which probationers are referred and monitor probationers' progress.
Improvement in these areas, coupled with a reduction in caseloads, should help more probationers adjust to the community. The next chapter details a management process that could aid in such an effort.
51

CHAPTER 8
PROBATION PREDICTION MODELS: -
TOOLS FOR DECISIONMAKERS
To focus services and attention on the probationers who need the most help and supervision, better decision- making tools are needed. One such tool is the predictive model.
Much criminological research has been focused on estimating the danger to society posed by offenders under the various rehabilitation options. Probation officials must recommend type of sentence, level of supervision, and length of probation. Although a good deal has been written on possible use of statistically based prediction tables as aids or guides, probation administrators and L>ractitioners continue to rely almost solely on personal experience and subjective judgment to make these decisions. The failure to use statistical models appears to stem from doubts about
--validity, that is, whether a model developed in one location for one group of people would be valid in a different location for a different group of people, and
--predictive powerp that is, tioners'
the extent to which proba- predicted outcomes correspond to their actual
outcomes.
We tested the validity and predictive powers of existing models by applying them to the 900 closed cases in Maricopa, Multnomah, and Philadelphia counties.
We determined that:
--The models were transferable between locations. For example, three of the models were valid in each of the locations. Also, each of the other five models was valid or probably valid in at least one of the locations.
--Existing models may be useful in probation decisionmaking even though their predictive powers are less. thar)+might, be desired. In one coun~qr:,:.p~obhti~n~~~-~i~~ high model scores (indlc'at'ing high potential for success) were 93 percent successful whereas those with low model scores were only 17 percent successful.
52 BEST DOCUMENT AVA\LABL:
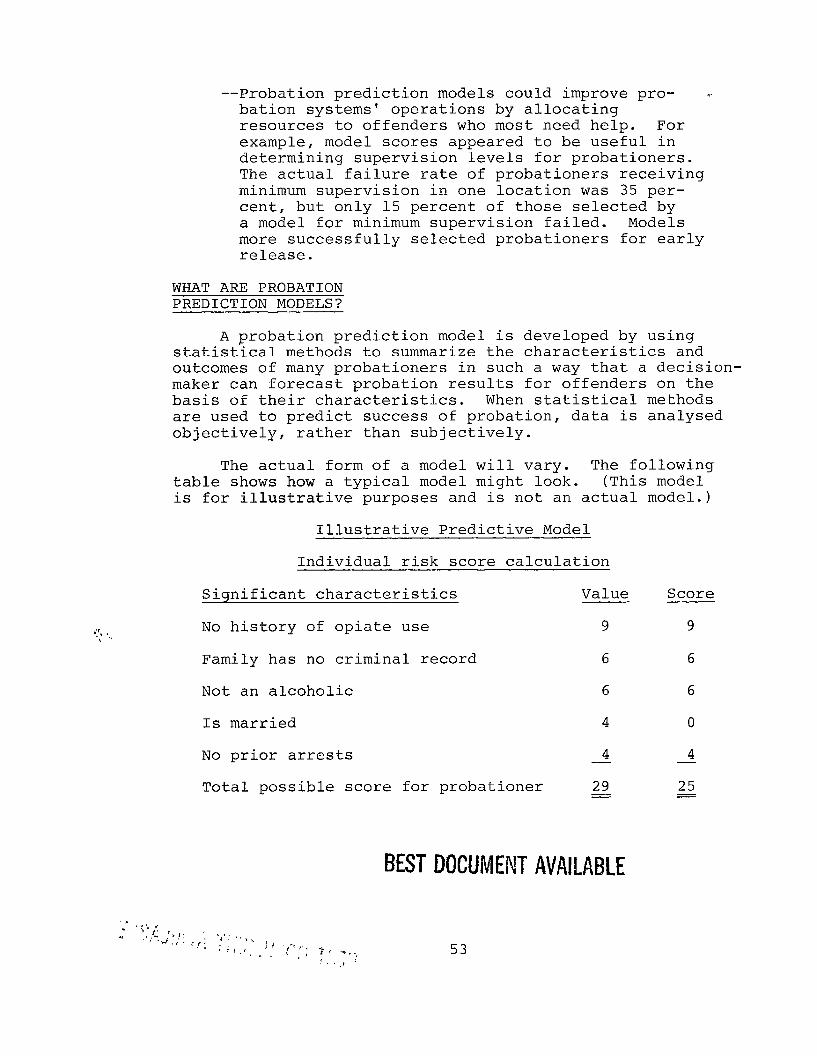
--Probation prediction models could improve pro- il bation systems' operations by allocating resources to offenders who most need help. For example, model scores appeared to be useful in determining supervision levels for probationers. The actual failure rate of probationers receiving minimum supervision in one location was 35 per- cent, but only 15 percent of those selected by a model for minimum supervision failed. Models more successfully selected probationers for early release.
WHAT ARE PROBATION PREDICTION MODELS?
A probation prediction model is developed by using statistical methods to summarize the characteristics and outcomes of many probationers in such a way that a decision- maker can forecast probation results for offenders on the basis of their characteristics. When statistical methods are used to predict success of probation, data is analysed objectively, rather than subjectively.
The actual form of a model will vary. The following table shows how a typical model might look. (This model is for illustrative-purposes and is not an actual
Illustrative Predictive Model
Individual risk score calculation
Significant characteristics Value
No history of opiate use 9
Family has no criminal record 6
Not an alcoholic 6
Is married 4
No prior arrests 4 -
Total possible score for probationer 29 I
BEST DOCUMENT AVAILABLE
model.)
Score
9
6
6
0
4 -
25
53

Summary risk table
Score
23-29
Success rate
90%
10-22 70
o-9 10
To develop such a model, information about the personal and criminal history of a large number of probationers would be obtained. A statistical technique, such as regression analysis, could then be used to identify the characteristics which seem to differentiate the most between successful and unsuccessful probationers. These characteristics become the basis for the model. The weight or importance given to a particular characteristic is also determined statistically.
To use the model, the decisionmaker would obtain infor- mation about an individual either through an interview (while preparing a pre-sentence report) or from existing records (prior probation records or criminal records). On the basis of this information, the individual's score would be computed. In the above example, if the individual did not have a history of opiate use, he would receive nine points, if he had such a history, no points for that item. The individual's total score is interpreted in light of past experience with pro- bationers having similar scores, to estimate the likelihood that he will succeed on probation.
In the sample model, an individual who scored 25 points would be considered a very good risk for probation. This information, along with other factors, could be used to decide whether the individual should be recommended for probation, subjected to only minimum supervision, or be re- leased from probation early.
VALIDATING MODELS
One reason usually given for the limited use of models is the need to validate a model, that is, determine its validity. For example, due to differences in group characteristics and experiences, a model that was developed using parolees in Arizona may not be predictive of the success or failure of probationers in Pennsylvania. We attempted to validate eight existing models--the "Oregon Form," the "N~wark;,,..New~ Jer~,ey~,~-Fqrm!!.: developed by Professor Daniel Gl'aser of;the.Uni"ver$ity of Southern California, four models developed by California correction agencies using data on California parolees, and the "Salient
54

Factors Form" developed for use by the Federal Board of Parole. (See app. III for additional details.)
These eight models were chosen, after a review of many existing models, because they were the only models for which we believed that data required for testing validity would be readily available from probation case files and criminal records. Of the eight models used, five were developed for parolees and three for probationers.
How models were validated
After collecting the necessary data for our sampled cases, we computed a score (or category) for each probationer. Additionally, we classified each case as a success or a failure using our definition of recidivism. (See p. 11.)
We then used statistical tests to determine whether the probationer's model score (or category) correlated significantly with his actual outcome. The tests (see app. III) indicated that each of the eight models reviewed was valid in each of the three counties for all probationers whose model scores and outcomes could be determined. (Some of the 300 probationers sampled in each county could not be included in our tests because of incomplete information in case files and criminal records.)
The following table summarizes our conclusions on the validity of the models for the probation populations reviewed. (The results of our statistical tests are contained in app. III.)
Results of Model Validation
Ycdel
T
TI
III-A
IV
v - A
VI-A
VII-A
VIIT-A
Eased on Multnomah Maricopa Philadelphia -
@regon Form Probably No conclusion No conclusion
Newark Form Probably No conclusion No conclusion
Glaser Model Yes Probably Probably
California Form 61A Probably No conclusion No conclusion
California Form 61B Yes Yes Yes
California Form 65A Yes Yes Yes
Association Analysis Yes Yes Yes
Salient Factors Yes Probably Probably
BEST DOCUMENT AVAILABLE
55

If at least two-thirds of the cases sampled were in- cluded in the statistical test, we concluded that the model tested was valid for the entire probation population under review (not just those probationers whose model scores and outcomes could have been determined). If at least half of the cases sampled were included in the statistical test, we concluded that the model was probably valid for the entire population. If less than half the cases sampled could be in the statistical tests, we reached no conclusion as to the model's validity for the entire population, even though the model was valid for the subpopulation for whom both model score and outcome could have been determined.
As shown above, three models were valid in each of the counties reviewed. If more complete information had been available, we would likely have found many of the other models to be valid in each location.
That we were able to validate three of the models in each location visited indicates that many of these models could be validated by local governments if need be. This contention is further supported by our overall results--of 24 possible validations (8 models at 3 locations), we ob- tained positive results in 46 percent and probable results in 29 percent.
PREDICTIVE POWERS OF MODELS
Even after a valid model is found for a given probation population, decisionmakers hesitate to use it, partly be- cause the models developed to date do not have extremely high predictive powers. However, several studies, including ours, indicate that existing models are sufficiently predictive to be useful in deciding who should be recommended for proba- tion, what level of supervision is needed, and who might be considered for early release.
While we did not make an exhaustive search of the suc- cessful users of models, we found three examples that we thought typified how models might be used.
In one use intended to reduce prison confinement costs, a large inmate population was screened, first by a parole model and then by prison personnel. A group of screened in- mates were considered for parole at an earlier date than originally scheduled. This resulted in substantial savings in prison costs with no increase in parole violations.
In another prison, giving minimum parole supervision to those predicted,-by a:model.;to be good risks enabled parole i: . .
, , I' .,) !, ._ -.

officers to spend more time with other cases without in- creasing the failure rate.
In a third application, inmates were initially classi- fied using model scores. Inmates in various classifications were provided with varying institutional treatment, some receiving earlier parole consideration. As a result, the prison population was reduced and money was saved.
These three examples relate to parolees rather than pro- bationers: however, the fact that some parole models proved valid in predicting probation outcomes indicates that they might be used for that purpose.
HOW MODELS CAN IMPROVE PROBATION MANAGEMENT
To-suggest possible applications by probation offices, we developed examples using model scores to decide who should be recommended for probation, what level of super- vision is needed, and who might be released early from probation.
These examples of applications were developed using Model VI-A, one of the three models found to be valid in all of the counties reviewed. Model VI-A is based on California Base Expectancy Form 65A and is shown in the following table.
MODEL VI-A California Base Expectancy Form 65A
To obtain raw scores, add
11 for all persons
19 if no more than
15 if not arrested
11
two prior arrests (note a)
for 5 years previously
14 if no known prior incarceration
8 if offense was not check fraud or buy@ary
> 0.6 times*iage of offender
': Base expectaniy 65A score
aBased on adult information if juvenile record unknown. . .
57
BEST DOCUMENT AVAltABLE

Given the scoring system for Model VI-A, one would ex- pect people with high model scores to be better risks on probation than people with low scores. This expectation is borne out by the table below, which shows the actual success rates of probationers in our samples whose Model VI-A scores fell within three ranges.
Model score Percent successful in county (note a)
Multnomah Maricopa Philadelphia
80.7 and above 89 93 93
41.3-80.6 68 65 52
41.2 and below 47 37 17
aThis analysis and all that which follows is based on only those probationers for whom both model score and probation outcome are known.
Usefulness of models in recommending sentencing
Probation models can assist probation and court offi- cials in recommending sentencing alternatives (prison, jail, or probation) for individual offenders. While recognizing that models used in this manner should be more broadly based and should include characteristics of those persons not placed on probation, we believe Model VI-A demonstrated pre- dictive ability.
In our test we computed scores for probationers in each of the three counties and considered the 10 percent with the lowest scores as ineligible for probation. We found that had the model been used for decisionmaking, the success rates in all three counties would have improved. The original rates and the rates projected if the model had been used to make the decision were as follows:
County Percent success
Without model With model
Multnomah 66 68
Maricopa 56 61
Philadelphia 44 49
58 BEST DOCUMENT AVAILABLE

Usefulness of models in deciding level of supervision
Because of caseload sizes and other considerations, probation officers must decide the level of supervision a probationer should receive. By giving only minimum (rather than medium or maximum) supervision to those who are most likely to succeed, probation officers have more time to spend with other probationers who are expected to need close supervision.
To determine the usefulness of the probation model in deciding who requires minimum supervision, we assessed our sample of probationers with complete records, using the model to select some for minimum supervision. We found that when model scores were used to select probationers for mini- mum supervision in each of the three counties:
--Probationers selected had lower failure rates than did the group actually selected by the probation offices.
--Those probationers selected by both the model and the probation offices had lower failure rates.
Our sample of 186 probationers from Maricopa County con- tained 57 probationers who had been placed on minimum super- vision. Of these, 14 did not successfully complete probation. When 57 probationers were selected for minimum supervision from the 186 using model scores alone, only 11 of the 57 were found to have failed. The following table shows the results of the selection process in terms of groups selected by the probation office, by the model, and by both.
Selected by Model Probation office Both
Number of people 33 33 24
Number of failures 9 12 2
Failure rate 27% 36% 8%
In Philadelphia County, Pennsylvania, 20 of 227 proba- tioners in our sample were placed on minimum supervision. Of this group, 7 failed on probation. When the model was used to select 20 probationers for minimum supervision, we found that only 3 failed.
BEST DOCUMENT AVAILABLE 59

Number of people 16 16 4
Number of failures 3 7 0
Failure rate 19% 44% 0%
In our sample of 251 probationers from Multnomah County, Oregon, 10 of the probationers were placed on minimum super- vision. Of these probationers, three did not successfully complete their period of probation. Of the 10 probationers the model would have assigned to minimum supervision, only one was considered a failure. In this county none of the people selected by the probation office were also selected by the model.
Model Selected by
Probation office Both
In each of the three counties, the group of probationers selected by model scores for minimum supervision had a lower failure rate than the group actually selected by the proba- tion office. Part of the lower failure rate of model selec- tions might be attributable to the fact that some of them received more than minimum supervision. More importantly, in each of the counties the groups selected for minimum supervision by both the probation office and model had lower failure rates than the groups selected by the probation office. This implies that basing selection on model score in conjunction with the probation officer's evaluation would improve results.
Usefulness of models in selecting probationers for early release
Two of the counties we visited evaluated probationers during the course of their probation with a view toward terminating probation early. We attempted to evaluate the model's usefulness in making such decisions.
A total of 124 probationers in Multnomah County and 148 in Maricopa County were granted early releases. When the same number of people were selected using model scores alone, probationers selected by model score had slightly lower failure rates than the group selected by the probation of- fice, and probationers selected for early release by both the model and the probation office had about the same or a lower failure rate.
The Multnomah County probation office selected 124 pro- bationers for early release. Of these, 16 (13 percent) failed to complete probation successfully. When 124
I I ": i I' : j I, : - ;. i ;; . ' ‘J " .'.;t:‘. ,i. a:. i i. : i , . . , I .

probationers were selected using model scores, 12 (10 per- cent) were found to be failures.
Selected by Model Probation office Both
Number of people 45 45 79
Number of failures 4 8 8
Failure rate 9% 18% 10%
As can be seen above, the group selected by both as well as the model-selected group had lower failure rates than did the group selected only by the probation office.
In Maricopa County, 148 probationers were selected for early release and 25 (17 percent) were considered failures. When the same number of probationers were selected for early release using model scores, 22 (15 percent) were found to be failures.
Selected by Model Probation office Both
Number of people 30 30 118
Number of failures 9 12 13
Failure rate 30% 40% 11%
Again, the group selected by both as well as the model- selected group had a lower failure rate than the group se- lected by the probation office only.
We recognize that part of the reason probationers se- lected for early release by the model had a lower failure rate than those selected by the probation office might be that some of these probationers were not released early. This extra time on probation might have helped them become successful. But can the entire difference in failure rates be attributed to this fact? If not, the model would appear to be useful in selecting people for early release. More importantly, as indicated by our results, better results might well be achieved if selection were based on both model score and the clinical evaluation of probation officials.
CONCLUSIONS
Probation models do nothing more than statistically summarize and weigh the experience and characteristics of

probationers. In this way they function much like experi- enced probation officials --based on past experience, they attempt to predict the outcome of a probationer. The actual outcomes of probationers are then compared to those pre- dicted and this new information helps make decisions on the next group of probationers.
The major advantages of models are their objectivity and efficiency as well as the fact that they provide a method to transfer past experience systematically. The advantages of human judgment relate to such factors as compassion and intuition.
We tried to validate existing models at locations other than those at which they had been developed and to establish their utility. Some of the existing models could be vali- dated, three of them in all the locations visited. While the predictive powers of these models were far from perfect, they seem to be greater than those of probation officials. More importantly, even better accuracy could be obtained if both model score and human evaluations were used to make probation decisions. Although existing models have some utility, the full benefits of models for purposes of proba- tion can only be obtained through additional use and research. This research should include:
--Systematically collecting data (1) on characteristics which might have predictive power, including those found to be predictive in other models, and (2) neces- sary to test hypotheses found in criminal behavior theory.
--Developing models for specific subgroups of the pro- bation population, such as by type or number of of- fenses, age, etc.
--Evaluating the many mathematical techniques used to combine predictive characteristics.
62

CHAPTER 9 --------
LEAA AND THE STATES NEED TO ______------me- -- -----
IMPROVE PROBATION MANAGEMENT _____III-------d-- We tried to determine how much the Law Enforcement Assis-
tance Administration and the State planning agencies were doing to help States and localities to solve the problems discussed in previous chapters.
Although the responsibility for probation systems rests with State or local governments, LEAA and State criminal justice planning agencies can provide leadership, guidance, and expertise to improve probation systems. However, LEAA's efforts had a limited effect on probation operations. Among the areas in which LEAA and the SPAS were inadequate are:
--Developing minimum probation standards, goals, and guidelines, or otherwise insuring adequate planning to correct probation problems.
--Insuring that information systems were adequate to identify problems and evaluate the effectiveness of probation.
--Providing sufficient technical assistance to proba- tion departments in developing and implementing programs.
--Establishing funding priorities to insure that re- sources are allocated to meet the needs of criminal justice systems.
INADEQUATE LEAA ASSISTANCE
LEAA and SPAS cannot decide State or county policy. Their leverage lies in the conditions they place on the use of Federal grant funds and in their recommendations and encouragement to State and local officials.
Since most of LEAA's funds are provided to the States as block grants, its leverage for bringing about positive changes is through approval of the States' comprehensive plans for spending money. These plans are required to in- clude the States' strategies for developing standards and goals, analyses of needs and problems, and lists of priori- ties. LEAA, however, has provided only limited technical assistance to States in these areas.
63

Need to improve probation standards and goals
A 1973 report by the National Advisory Commission on Criminal Justice Standards and Goals, "A National Strategy to Reduce Crime," stated the importance of standards and goals as follows:
II* * * Operating without standards and goals does not guarantee failure, but does invite it.
"Specific standards and goals enable professionals and the public to know where the system is heading, what it is trying to achieve, and what in fact it is achieving."
Although the standards and goals recommended by the National Advisory Commission do not necessarily represent LEAA's official position, each of the States we reviewed had been awarded an LEAA grant to study and develop stand- ards and goals. LEAA has endorsed the development processes but not the specific standards and goals.
In December 1973 LEAA first issued planning guidelines requiring States to include their proposed approach to es- tablish State standards. States were- told to develop a comprehensive set of standards for inclusion in the fiscal year 1976 comprehensive state plan.
However, LEAA did not provide the States with adequate, specific guidance for preparing standards and goals. For example, LEAA's initial guidelines for the 1974 plan for standards and goal development recommended that the States:
rl* * * define the kind of law enforcement deemed 'ideal' yet attainable for the State and its local- ities in terms of manpower, training, equipment, facilities, workloads, operational standards, and services provided, even though achievement, under optimal conditions, will require several years (e.g., five to ten years).
"This definition [ideal law enforcement] should be as concrete as possible in terms of goals and capa- bilities to be pursued, e.g., * * * information system capabilities, * * *."
In March 1975, LEAA issued guidelines for the 1976 plans that require the States to discuss their standards and goals. These guidelines provide a broad framework within
::which,,the .Stat,es can develop specific standards and goals, , I L .;. ".: j. .:,. '.. . . ". 7
64

but not adequate guidance on specific issues. The guidelines require the SPAS to describe long range criminal justice improvements. The SPAS were not specifically directed to address the diagnosis of offenders' needs, use of models, or coordination between probation systems and community resources for needed services.
.- Among the States we reviewed, only Oregon had developed
long term standards and goals, which are to be implemented by 1980. Oregon had adopted the Commission's probation case- load standard of 35 probationers per probation officer. Oregon's standards and goals did not address such probation issues as the diagnosis of offenders, use of models, coordi- nation between probation departments and community service agencies, and recidivism rate goals.
Arizona was considering adopting a portion of the Com- mission's standards for service delivery and for diagnosis. Washington State was reviewing the standards and goals, but had not adopted any. Pennsylvania was studying its criminal justice needs to determine to what extent the national stand- ards and goals would meet the State's specific needs. This project was scheduled for completion in September 1975.
To effectively consider probation problems, SPAS should discuss these areas in their State plans. Without such in- formation, it is difficult for an SPA to assume the leader- ship and coordination role LEAA has given it.
LEAA has required that by the end of fiscal year 1976 States establish at least a preliminary set of systemwide criminal justice goals. These standards and goals must ap- pear in each State's fiscal year 1977 comprehensive plan. LEAA, in reviewing and ultimately approving the State plans, should not just look to determine that the States have in- corporated standards and goals. To exercise the type of leadership we believe the Congress intended when it passed the 1973 Crime Control Act, LEAA should bring together appro- priate State officials and, working with them and the data and information available from the LEAA-funded evaluation efforts, develop minimum standards and criteria by which LEAA can assess that portion of the States' comprehensive plans.
Inadequate State plans
We reviewed the 1975 comprehensive State plans for Arizona, Oregon, Pennsylvania, and Washington to determine if they were sufficiently detailed to identify probation system problems. We also reviewed LEAA's 1975 guidelines
1. a Eor State comprehensive plans and found them too general to

be effective. The 1975 State plans thus contained insufficient information about probation system problems to enable LEAA, SPAS, or the States to develop corrective strategies.
Although LEAA required the SPAS to discuss such needs as legislative change, research and information systems, and noninstitutional rehabilitation alternatives, it did not re- quire these issues to be discussed in relation to each component --institutions, probation, parole, community-based activities-- in the corrections system. Thus, the State plans did not address these needs on a component basis.
Furthermore, LEAA guidelines and the State plans did not discuss two major factors which the National Advisory Commission considered important for probation to achieve its full potential: the development of systems for (1) deter- mining which offenders should be on probation and (2) deliver- ing the support and services offenders need.
The 1975 Arizona comprehensive plan included basic sta- tistics such as the numbers of probation cases under super- vision and probation officers available. However, the State plan did not contain recidivism data to indicate probation effectiveness or show the treatment needs of probationers. Information in the State plan was inadequate for the SPA to establish priorities. The State plan noted that preparing a simple list of priorities was impossible because every activity in the plan had high priority.
The 1975 Oregon plan likewise included basic probation descriptive data but lacked the type of recidivism informa- tion required by LEAA. The plan failed to define who should be sentenced to probation, although it recognized that sen- tencing decisions were important. The plan stated, however,
"Perhaps the most important thing that the criminal justice planner has to say about the [trial- sentencing] sector is that we know very little about it."
The Oregon plan had insufficient information on rehabilita- tive services. The plan listed the estimated percentages of probationers and parolees who needed services in several problem areas but did not indicate the availability of such services or how the State intended to match needs and serv- ices. According to the plan:
"Staff shortages, inadequate referral processes, in- adequate resources, the absence of specially de- signed treatment plans, the failure to monitor the progress of individuals in the rehabilitation pro- cess, all contribute to the high rates of recidivism."

The 1975 Pennsylvania plan stated the number of offend- ers on probation, number of probation officers, and average caseload and noted that the LEAA requirement for monitoring the progress and performance of the correctional system was not being met. The plan recommended that the State and county correctional systems analyze their needs, resources, and gaps in service and develop a systematic plan to imple- ment the services: however, the number of probationers who needed treatment was not shown. Methods of determining who should be on probation were not discussed. Moreover, the plan showed that one problem area was the lack of informa- tion on establishing supervision levels and treatment needs.
The 1975 Washington State plan also included the numbers of offenders on probation and parole, probation officers, and caseloads; however, it did not enumerate the services needed by the State's probationers. Nor did it indicate any methods, such as decision models, to help determine who should be sentenced to probation.
The lack of such basic information in a State plan limits its effectiveness as a management tool.
LEAA's fiscal year 1976 planning guidelines for State plans were much more specific as to how the States were to describe their needs and problems. For example, the 1975 guidelines merely required the States to:
II* * * Provide an overview of major needs and prob- lems as they exist throughout the State in all as- pects of law enforcement and criminal justice. Statements of needs and problems in each of the State's areas of high crime incidence/law enforce- ment activity are to be included."
But the 1976 guidelines required States to:
"Provide a thorough, total, and fully integrated analysis of major needs and problems in the State and its political subdivisions, with emphasis on analysis of crime patterns and trends and on analysis of the problems faced by the criminal justice and juvenile justice systems in their ef- forts to prevent, reduce, and control crime and delinquency. Deficiencies of the criminal justice system must be identified, making clear the rela- tionship between current system capabilities, the crime problems faced, and goals and standards. Analysis of problems anticipated in plan implemen- tation, including technical assistance, manpower, and training needs, must be included. Analysis of

States' high crime areas are to [be] included. Sources of data utilized, limits on the quality of the data, and gaps in the data are to be identified, along with the presentation of as much data as are required to support the analyti- cal conclusions."
In meeting this requirement LEAA noted that the appro- priate section of the 1976 plan should include an:
'* * * analysis of problems faced by the law en- forcement, criminal justice and juvenile justice agencies in dealing with the problems identified in the earlier sections of the analysis and with other problems identified by other methods. De- ficiencies of the system should be stated clearly. This part of the analysis should take account of the capabilities of existing agencies, the extent, nature, scope, and trends in the crime problems and criminal justice system problems faced by the system, and should describe deficiencies in terms of the capability or lack thereof of the system to achieve the standards and goals set by the State for its criminal and juvenile justice sys- tems. Deficiencies in technical assistance, in manpower, in training, and in other areas should be included here. This analysis may be organized by city, county, metropolitan area, region, and State; or by component of the criminal justice system (police, courts, corrections, etc.) or by categories the State believes appropriate. How- ever, it must be a total analysis of all aspects of law enforcement, criminal justice, and juven- ile justice at the State and local level."
These requirements go a long way toward providing an adequate framework for discussing the important problems facing the various components of the criminal justice system.
LEAA still permits the States to decide how to carry on this discussion. We support such a concept, but in certain instances LEAA could go further and suggest that the States address specific issues. LEAA could take such action when it has determined that certain problems are so great that they call for all States to set forth solutions. In deter- mining the need for such action, LEAA should consult with the States but decide from a national perspective which problem areas should be addressed by all States. LEAA could thus play an active role in improving State plans and in insuring that States address critical needs. These needs

could change from year to year, depending on the State's ability to meet them.
One problem area LEAA should require States to address is probation.
INADEQUATE PROBATION DEPARTMENT INFORMATION SYSTEMS
To effectively plan their probation systems, operating agencies need data on the effectiveness of their programs. However, according to State officials, none of the States we reviewed had management information systems with the data needed to tell them how effective their systems were, what the needs of the probationers were, and what services were provided to meet probationers' needs. Instead, offi- cials in most States relied on periodic, manually prepared, descriptive reports. These reports contained such data as the numbers of probationers under supervision, officer con- tacts with offenders, arrests and revocations. Statistics regarding numbers of probationers needing drug or alcohol abuse rehabilitation, mental health service, or vocational training were unavailable. So was information on recidivism of discharged probationers. None of the four counties re- viewed did followup studies to obtain such information.
Multnomah County had an LEAA-funded information project to develop offender data. However, LEAA officials said the project was having operational difficulties and the proba- tioner information was never compiled.
Although the Crime Control Act of 1973 requires State plans to provide for monitoring of the progress of the correctional system, the lack of information systems pre- cluded such monitoring. Monitoring data was to include rates of prisoner rehabilitation and recidivism compared with the previous performance of the State or local correc- tional systems.
However, the four States we reviewed submitted 1975 plans to LEAA with insufficient data to allow LEAA and the SPAS to monitor probation program effectiveness. None of the four supplied adequate information on recidivism rates: needs of probationers, met and unmet: or the availability of community resources.
LIMITED USE OF TECHNICAL ASSISTANCE
One way to improve probation is with adequate technical assistance. LEAA has defined technical assistance to include:

'* * * conferences, lectures, seminars, workshops, on-site assistance training, and publications, as those activities are provided to planning and operating agencies to assist them in developing and implementing comprehensive planning and man- agement techniques, in identifying the most ef- fective techniques of controlling specific crime problems, in implementing new programs and tech- niques, and in assisting citizens and other groups in developing projects to participate in crime re- duction and criminal justice improvements."
According to LEAA's guidelines for the 1976 comprehensive State plan, technical assistance is "primarily a way to respond efficiently and effectively to the problems and needs addressed in the State plan, and ultimately is a major vehicle for ensuring effective plan implementation."
Each regional office had correction specialists to give technical assistance to States, their planning agencies, and grant recipients. In general, if a technical assistance request required significant research, the regions referred the request to LEAA headquarters staff who, in turn, handled it through consultants.
However, technical assistance to some State probation programs has been limited. The chiefs of probation and parole in Oregon and Washington said they had made few tech- nical assistance requests because they did not either know that assistance was available or have sufficient staff to contact the SPAS to identify their capabilities. Informa- tion describing the nature, extent, and cost of assistance had not been provided to the State.
SPA officials in Oregon and Washington indicated that technical assistance was provided only on request because of limited staff.
Maricopa County appeared to have adequate access to LEAA technical assistance. For example, one important tech- nical assistance request led to a 1971 study of adult proba- tion in the county by consultants from the University of Georgia. They depicted the program "almost devoid of admin- istrative structure." A final technical assistance report for 1972 prepared by one of the original consultants stated that all of the major changes suggested had been meticulously executed. Further, the consultant stated that the revised adult probation department was equal to or better than most adult probation departments in the United States.
‘ I
_’ I.,“,‘
70
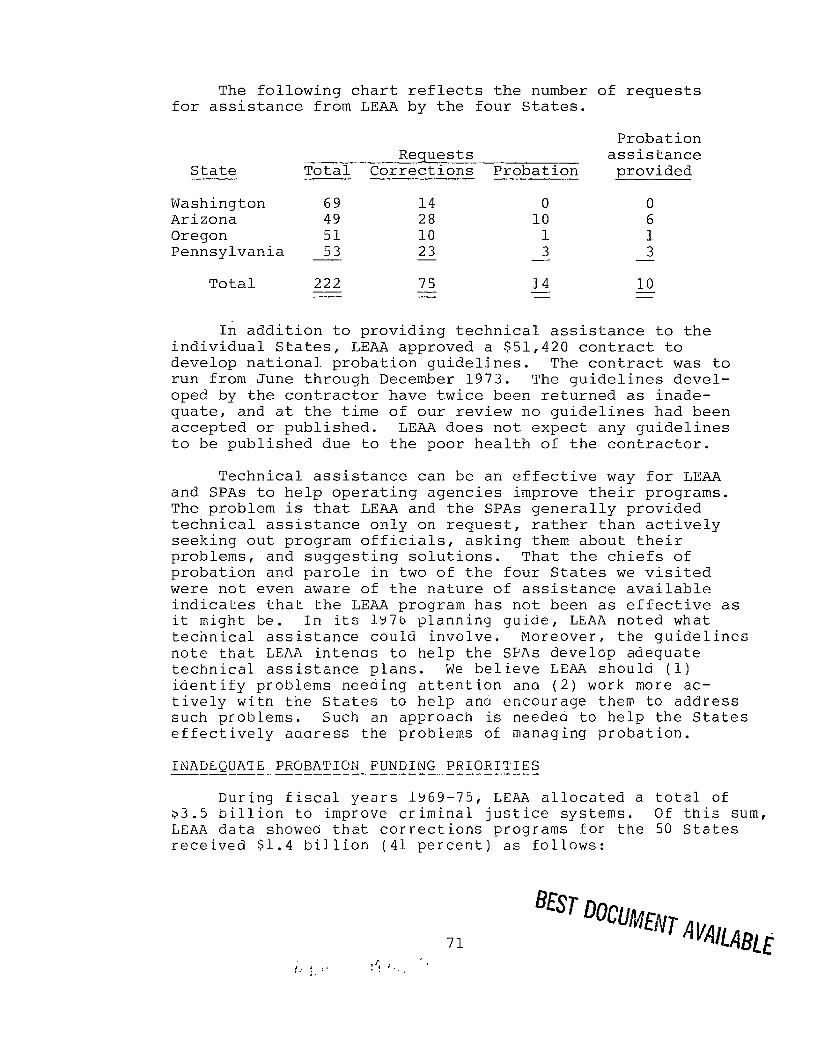
The following chart reflects the number of requests for assistance from LEAA by the four States.
Probation
State Requests assistance
Total Corrections Probation provided
Washington 69 14 0 0 Arizona 49 28 10 6 Oregon 51 10 1 1 Pennsylvania 53 23 3 3 - -
Total 222
In addition to providing technical assistance to the individual States, LEAA approved a $51,420 contract to develop national probation guidelines. The contract was to run from June through December 1973. The guidelines devel- oped by the contractor have twice been returned as inade- quate, and at the time of our review no guidelines had been accepted or published. LEAA does not expect any guidelines to be published due to the poor health of the contractor.
Technical assistance can be an effective way for LEAA and SPAS to help operating agencies improve their programs. The problem is that LEAA and the SPAS generally provided technical assistance only on request, rather than actively seeking out program officials, asking them about their problems, and suggesting solutions. That the chiefs of probation and parole in two of the four States we visited were not even aware of the nature of assistance available indicates that the LEAA program has not been as effective as it might be. In its lY76 planning guide, LEAA noted what technical assistance could involve. Moreover, the guidelines note that LEAA intenas to help the SPAS develop adequate technical assistance plans. We be1 ieve LEAA should (1) identify problems needing attention and (2) work more ac- tively with the States to help and encourage them to address such problems. Such an approach is needed to help the States effectively aclaress the problems of managing probation.
ItiADEGUA'IE PROBATION FUNDING PRIORI'IIES -------_-_-----_~~.--~~~~--~I~~I~~
During fiscal years lY69-75, LEAA allocated a total of $3.5 billion to improve criminal justice systems. Of this sum, LEAA data showed that corrections programs for the 50 States received $1.4 billion (41 percent) as follows:
71
!.. i. i‘ :< :, . .

Probation Parole Community-based corrections Institutions
Total
Number of projects Funds --- ---- -----
(million)
4,167 277.8 2,956 272.0 4,754 450.4 5,901 .--m.3
17,778 $1,436.1
Percent -----
19.3 18.9 31.4 30.4
100.0
Source: LEAA Grants' Management Information System--projects funded from fiscal year 1969 through March 1975. (Not audited by GAO.)
The four States in our review were awarded about $194 million for their criminal justice systems for fiscal years 1969-74. The four States distributed $50 million to correction programs. Only about 35 percent ($17.6 million) of this was awarded to probation-related projects, even though probation was the most commonly used sentencing alternative. Thus, probation received only 9 percent of the total money awarded to the criminal justice systems in the States.
The following table shows the funding of various probation projects (FY 1969-74) in the States reviewed.
Pro:@Ct~yurpose Washington Oregon ArlZOIIa ~- Pennsylvania
New or lnnovatlve PI-OJeCtS $1,181,820 $546,901 $211,978 $ 6,348,074
Tralnmg personnel 296,489 174,127 12,752 666,785
Expanding ser"~ces 381,187 7,359 228,136 1,029,616
ImprovIng services 313,301 4,268 34,396 5,863,437
Studying ser"~ces 214,918 79,883 _
Total $2,387,715 $732,655 $487,262 $13,987,795 __--
Percent Total of allocation -
$ 8,288,773 47.1
1,150,153 6.5
1,646,298 9.4
6,215,402 35.3
294,801 1.7
$17,595,427 100.0
As indicated above, Oregon and Arizona allocated only limited funding to studying and improving existing systems. Overall, about 47 percent of funds spent on probation-related projects in the four States were used to fund new and innova- tive projects.
The directors of corrections in Washington and Oregon agreed that the SPAsPh:ave not provided enough funds to fully .I;'~‘, . . .a‘;- : : , .

evaluate their probation systems. They considered state funds insufficient to do more than keep probation systems operating at current levels.
An LEAA official said probation was a priority area through LEAA discretionary funding several years ago, but it is not now. He added that specific probation programs are left to the initiative of individual States.
LEAA now requires SPAS to describe in their State plans their statewide priorities and to note which goals and standards will be addressed in what order. The priorities must be related to an analysis of crime and criminal justice problems and must reflect a determined effort to improve system performance.
The SPAS must establish their own priorities. But, given (1) the fact that most offenders are sentenced to probation and (2) the problems facing probation systems, the SPAS should consider whether probation activities are receiving sufficient priority when LEAA funds are allocated. The lack of data on probation problems may have kept SPAS from developing corrective strategies. By refining their management efforts, SPAS should be able to obtain better data so they will have a greater assurance that their allocation of resources corresponds to criminal justice systems' needs.
CONCLUSIONS
The States and localities must solve the problems facing probation systems. The legal framework exists for both LEAA and the SPAS to help States and localities better manage probation systems, develop standards and guidelines, and improve information systems for identifying problems and evaluating effectiveness. More action by both LEAA and the SPAS is needed.
BEST DUCUk4EffT AVAILABLE 73

CHAPTER lo --_
OVERALL CONCLUSIONS, RECOMMENDATIONS --- --- ,
AND AGENCY COMMENTS
OVERALL CONCLUSIONS
State and county probation systems are not adequately protecting the public; the majority of probationers do not successfully complete probation. Federal, State, and local government must cooperate to improve the situation. The Law Enforcement Assistance Administration can help by providing leadership, funds, and technical assistance, and our recom- mendations focus on actions LEAA should take to foster im- provements.
But something more fundamental is needed. The priority given to probation in the criminal justice system must be reevaluated. One serious problem is the limited time that probation officers had to adequately supervise offenders assigned to them. The system is simply overburdened. Additionally, judges we questioned believed there were inadequate sentencing alternatives. They did not believe there were sufficient community-based sentencing alternatives, such as halfway houses or regional jails. Such facilities allow offenders to remain in the community but provide more protection for the public than does probation.
Deciding whether adequate resources are assigned to probation efforts or to other elements of the criminal justice system will ultimately be a political matter. But political leaders and the public need to know more about the programs that must compete for such resources. Our review of State and county probation systems indicates, at a minimum, that the allocation of criminal justice resources needs scrutiny. If action is not taken to correct probation systems' problems, the systems will probably deteriorate further, increasing the danger to the public and the amount of recidivism.
RECOMMENDATIONS
We recommend that the Attorney General direct the Administrator, LEAA, to:
--Work with the States to develop probation guide- lines and minimum standards for improving State and local probation systems. Standards should cover such areas as probation officer workloads, pre-sentence investigations, levels of supervision,
; ::'r, :: .and, pr.ob.ati,one,r.reporting frequencies. 'j \ _ .,I ,-i, 7 ," . : ' ; I ,,I' : I.,:" I.
74

--Improve sentencing by developing a model or similar approach to help judges and probation officials choose offenders for probation.
--Improve service delivery by developing a system to identify probationer's rehabilitative needs, refer probationers to services needed, and followup to determine whether persons actually received services.
--Improve information systems, evaluation, and accountability of probation programs by working with the States to (1) develop a standard formula for determining the success or failure of pro- bation systems, (2) establish a standard range of expected results that can be used to evaluate pro- bation systems, and (3) develop uniform probation statistical reporting systems.
--Develop and maintain national statistics on such probation areas as offenders on probation and caseloads.
--Require State planning agencies, as part of their analysis of problems faced by the criminal justice system, to address the problems of probation and their solutions. (This recommendation could be met by modifying the language that appeared in LEAA's "Fiscal Year 1976 Guideline for State Planning Agency Grants," M 4lOO.lD, ch. 3, par. 61(b) (5).)
--Develop better ways to provide technical assistance to probation organizations by addressing the type, depth, and cost of assistance to be offered.
--Evaluate the priorities for allocating discretionary funds, to assure that moneys are available to help States and counties implement systems to (1) better predict an offender's chances of successful pro- bation, (2) improve diagnostic analysis and re- habilitation planning, and (3) better coordinate service delivery and supervision of probationers.
AGENCY COMMENTS
The Justice Department, by an April 28,1976, letter, re- sponded to our December 8, 1975, request for comments on the report. The agency generally agreed with our findings, con- clusions, and recommendations, noting a series of actions LEAA will take or is taking to implement our recommendations. (See app. V.)

The Department stated that, "The need to improve Federal leadership and provide sufficient funds to seriously impact on State and local probation services is a view commonly shared by both LEAA and GAO."
The Department addressed our recommendations by stating that:
--LEAA has aggressively worked with the States to fund their development and implementation of standards.
--LEAA has revised the guideline manual for SPA grants. States must specify in detail how they will implement advance correctional practices. However, the Depart- ment noted it did not believe LEAA could require the States to address certain problems.
--LEAA is further considering the role it can play in developing and demonstrating predictive tools to improve sentencing.
--LEAA intends to devote further study to the appro- priate mechanism for developing a model service de- livery system.
--LEAA is addressing the need to develop better infor- mation about probation activities in its National Criminal Justice Information and Statistics Service and is studying the feasibility of committing funds to develop a national probation reporting system.
--LEAA recognizes the need to provide technical assis- tance and has revised its planning guidelines to try to assure that better technical assistance is provided.
--LEAA recognizes that probation services traditionally have recieved the smallest share of the correctional dollar at the State and local level and is now con- sidering establishing funding priorities.
The Department's comments indicated that LEAA plans to take action to try to improve State and local probation systems. We believe LEAA's consideration and study of such issues as the need to improve sentencing and service de- livery and to use more discretionary funds for probation should be completed as soon as possible. Action, not merely planning, must be taken. But the Department correctly notes that "the primary role for improving probation operations continues to remain with the States and local governments." Nevertheless, we continue to believe that:
,._ ^ .
,I’ !” *. .i‘.
: ’ c _* ”
76

--LEAA could strongly urge and encourage, if not re- quire, the States to address problems of probation when developing State plans. Most offenders are sentenced to probation. Wee PP* 68 and 69.)
--LEAA, in considering the role it should play in developing predicative tools and model service de- livery systems, should recognize the research and leadership role the Congress envisioned for LEAA and act accordingly.
--More LEAA discretionary funds should be applied to probation problems.
The Department had additional comments relating to specific -issues of the report, some of which warrant com- ment.
The Department noted that we did not adequately point out that State and local probation systems are part of a broader framework of probation systems, such as those oper- ated by the executive and judicial branches of the Federal Government. The Department implied that standards developed for one governmental level of probation activities should apply to all levels. We are not aware of any concerted ef- fort by various agencies of the Justice Department to develop such standards. We made this review to address a problem which we believe is within the scope of the Justice Depart- ment's responsibility: to try to help State and local gov- ernments solve the problem, according to the legislative mandate given to LEAA in the Omnibus Crime Control and Safe Streets Act of 1968, as amended. Delaying the development of standards, goals, and guidelines for State and local oro- bation, in accord with the provisions of LEAA's authorizing legislation, is unnecessary just because of a need to consider their possible effects on the Federal system.
The Department noted that our use of the word "diagnosis" appeared related to the "mental health model." We do not believe such a "model" should be applied in all cases and never so stated. Diagnosis can mean merely having the pro- bation officer assess a probationer's needs. Nevertheless, in certain circumstances, additional psychiatric examinations, for example, might be worthwhile. This is clearly the posi- tion taken on page 24, and apparently this philosophy was put into practice by King and Multnomah counties in the operation of their LEAA-funded diagnostic centers.
The Department incorrectly inferred that, because we de- tailed in a table in the report certain key facts about pro- bationers (such as their marital status, educational and

employment backgrounds), we only used such factors in assess- ing probation needs. This is not correct. On page 34 we note that we determined the extent that probationers had needs and received services by "analyzing" information in case files, such as pre-sentence reports, court-imposed con- ditions, psycniatric diagnosis, and progress summaries.
The Justice Department also questioned whether, based on the statistical analyses we did, it was appropriate to conclude that a positive statistical relationship existed between services provided and probation success. But the Department provided no analytical evidence to contradict the results of our tests and our conclusion that rehabilitative services can help reduce an offender's willingness to commit additional crimes.
Generally, the States and localities agreed with our conclusions and recommendations relating to the need to improve probation systems and said they tried to support ef- forts to improve probation systems. Some were concerned that critics of probation might use the results of our report to challenge whether probation should be used. While we believe much can be done to make probation more effective, we support its use as a sentencing alternative.
Several officials pointed out that action is being taken to adopt probation standards. For example, the Administrator, Corrections Division, Oregon Department of Human Resources, noted that certain corrections standards published by the Na- tional Advisory Commission on Criminal Justice Standards and Goals relating to community classification teams, development of community-based alternatives to confinement, and organiza- tion and services of probation were accepted by the member- ships of the three major professional organizations of adult corrections in the United States. The Acting Chairman, Penn- sylvania Board of Probation and Parole, noted the efforts in the State to develop and implement probation standards and uniform administration of State and LEAA grants to the coun- ties. For example, standards cover such areas as
--probation officer workloads,
--pre-sentence investigations, and
--levels of supervision and probationer reporting fre- quencies.
Moreover, when awarding State and LEAA grants to Pennsylvania counties, the standards must be implemented. The Acting

Director pointed out that, while our report adequately dealt with probation in Philadelphia County, it did not adequately address all the positive State efforts to improve probation, because the Philadelphia system "bears no resemblance to the other counties in the Commonwealth."

CHAPTER 11
SCOPE AND APPROACH
Our findings and conclusions are based on work at the Law Enforcement Assistance Administration's headquarters and three regional offices and at four State planning agencies and detailed work at probation offices in Maricopa County, Arizona; Multnomah County, Oregon; Philadelphia County, Penn- sylvania; and King County, Washington. Our fieldwork was done between September 1974 and June 1975. The review covered adult felon probation activities.
We randomly selected samples of 50 active probation cases and 300 closed probation cases at each of the 4 loca- tions-l In Arizona and Pennsylvania active cases were selected from those current on October 1, 1974, and closed cases were selected from those closed between July 1, 1972, and September 30, 1973. In Oregon the samples were selected from the probation cases which were active as of January 1975 and closed as of July 1973. In Washington, the sample cases were active April 1974 and closed from July 1, 1972, to March 30, 1973. The time periods varied because of the date we began the work at each location and the availability of records.
The probation universes from which we selected our sample cases2 follow:
Universe size Active Closed
Maricopa County 1,024 403
Portland region (note a) 2,887 300
Philadelphia County 2,264 928
King County 2,641 644
Total 8,816 2,431
aThe Portland region included six Oregon counties--Multnomah, Washington, Clackamas, Tillamook, Columbia, and Clatsop--at the time of our review. E'or report purposes, the Portland region is referred to as Multnomah County.
IIn Multnomah, we reviewed all closed cases to achieve consis- tency in numbers among the counties for analytical purposes.
2See app. IV for a description of the characteristics of the probation cases in our sample.
80

We reviewed LEAA's processes for improving the probation system and the States' processes for identifying probation needs and problems. The review was made primarily by (1) reviewing the diagnostic process used to determine probationers' problems and needs, (2) analyzing the activities of probation officers after diagnosis, (3) determining the type of services that offenders received while on probation, and (4) ascertain- ing how many offenders, for closed cases only, were arrested or convicted of a new crime during probation or within a followup period averaging 22 months after their probation ended. In all cases the minimum followup time was 1 year.
We talked with various law enforcement officials, includ- ing judges, administrators, corrections specialists, and pro- bation officers. We also contacted government agencies and community service organizations. Our review included examining documents relating to annual State plans and to pertinent statistics regarding probation, parole, and recidivism.
We recognize that certain factors, such as high unemploy- ment rates, community service availability, and limited job training slots cannot be influenced by probation services and play a major role in determining whether probationers have the skills and employment to become rehabilitated. We did not measure how these factors directly affect the ability of probationers to become rehabilitated. We obtained general information, statistics, and probation officials' opinions on the prevalence of these factors in each location.
CLOSED-CASE APPROACH
These individuals were no longer under supervision. Therefore, our goal was to determine if services had helped them to complete probation. We reviewed closed cases to determine:
--Whether probationers' needs were diagnosed suffi- ciently to permit development of adequate treatment plans.
--Whether probationers completed court-ordered conditions of probation.

--Whether probationers received services1 and, if so, whether the services were of the type that could help them complete probation.
--Whether probationers were able to complete pro- bation without a new conviction and a year without arrest or conviction after the probationary period.
ACTIVE-CASE APPROACH
These offenders were still being supervised by the courts and probation officers. Therefore, our primary goal was to determine whether services were helping them complete pro- bation. We determined:
--Whether sufficient diagnoses had been performed to develop adequate treatment plans.
--Whether services needed were adequately provided.
_-_-----------e--e
1 Although we were able to obtain followup arrest data about our sample cases in King County, we were unable to analyze case files. The chief,,-probation officer stated that most .case..files were, .dest!roged after the probationers completed
.:kheir* sentences because of probation department policy.
82 BEST DOCUMENT AVAlLA3LE

APPEiilDIX I APPENDIX I
STATISTICAL ANALYSIS OF PROBATION DATA
We used statistical techniques to supplement our fieldwork. Our approach to the statistical analysis of pro- bation data is described below.
SAMPLE SELECTION AND DATA COLLECTION
We selected random samples of 300 closed cases and 50 open cases in each of 4 locations from case files or computer listings supplied by local probation officials. We then collected data selected characteristics of probationers in our samples and program information.
PURPOSE OF ANALYSIS
Our analysis was intended to verify our empirical findings and conclusions rather than to serve as the sole basis for these conclusions.
STATISTICAL TECHNIQUES USED
Our analysis used three statistical techniques: the chi-square test of independence, the t-test, and the point biserial coefficient of correlation.
Chi-square tests of independence
These tests were made to establish whether there is an association (dependency relationship) between the variables we tested and to determine the strengths of identified associa- tions.
For example, in the table below we can see that those who received needed vocational training were more successful on probation.
Received vocational training
No Number Row percent
Yes Number Row percent
Total Number Row percent
Probation outcome Success Failure Total
37 30 67 55.2 44.8 100
19 3 22 86.4 13.6 100
56 33 89 62.9 37.1 100

APPENDIX I APPENDIX I
But is the difference in proportions significant or merely the result of chance? The chi-square test of indepen- dence can be used to evaluate these possibilities.
We determined the significance of the associations between the variables tested and confidence levels which represent the probabilities that the associations were not products of chance.
We interpreted the confidence levels obtained with the chi-square tests of independence using the following definitions.
Confidence that observed association
is not a product of chance Definition of
association
95 percent or greater 90 to 94 percent 80 to 89 percent Less than 80 percent
Highly significant Significant Borderline significant Insignificant
Our chi-square tests of independence were made for categorical variables and continuous variables expressed in terms of ranges. Continous model scores were grouped into ranges to make the proportions of cases falling into each of the extreme categories roughly equal and containing enough cases to bring the expected cell frequencies to at least five.
T-test
Our t-test was to determine if statistically significant differences existed between the means of specific variables for successful and unsuccessful probationers.
We used the t-test to test the hypothesis that the mean of one population was less than or equal to the mean of another. For example, we hypothesized that the mean model score of successful probationers was less than or equal to the mean model score of unsuccessful probationers.
Using a t-statistic, we determined the significance of the difference between the sample means and a confidence level, which represents the probability that the difference was not a product of chance.
We interpreted the t-test confidence levels using the same set of definitions.
On the basis of the t-test results, we either accepted the hypothesis or the alternative hypothesis that the successful probationers had a higher mean model score.
". * . ., _.'
84 'BEST DOCUMENT AVAILABLE

APPENDIX I APPENDIX I
Point biserial coefficient of correlation
The point biserial coefficient of correlation was computed to show the strength of the relationship between a dichotomous variable-- such as success or failure on probation--and a continuous variable--such as model score. The absolute value of the coefficient can range from zero to one. A value of zero would indicate no relationship between the two variables while an absolute value of one would indicate a perfect reli-r- tionship.
85 ‘..

APPENDIX II APPENDIX II
RESULTS OF STATISTICAL TESTS TO -----m------------e-
EVALUATE THE EFFECTS OF SEKVICES --_--_---_----------------
ON SUCCESSFUL COMPLETION OF PROBATION -P------------c-_-----
A probationer was considered to have received a service if he participated in at least 75 percent of the program or treatment.
Chi-square tests were done as shown in table I for all services, whenever data allowed an expected cell frequency of at least five. Successful and unsuccessful outcomes are defined on pages 10 and 11 of the report.
Tabel II,summarizes the results of chi-square tests for independence 1/ done to determine the relationship between receiving a needed service and successful probation.
Table I
Sample Analysis of Association Between Receipt of Vocational Training and Probation Outcome
Multnomah County, Oregon
Received services
Probation outcome Success Failure --- Total .-
No Number 37 30 67 Row percent 55.2 44.8 100
Yes Number 19 3 22 Row percent 86.4 13.6 100
Total Number 56 33 89 Row percent 62.9 37.1 100
Significance of association High
Chi-square 5.614 Degrees of freedom 1 Confidence level . 98
1/ - See app. I for explanation of statistical methods.
86
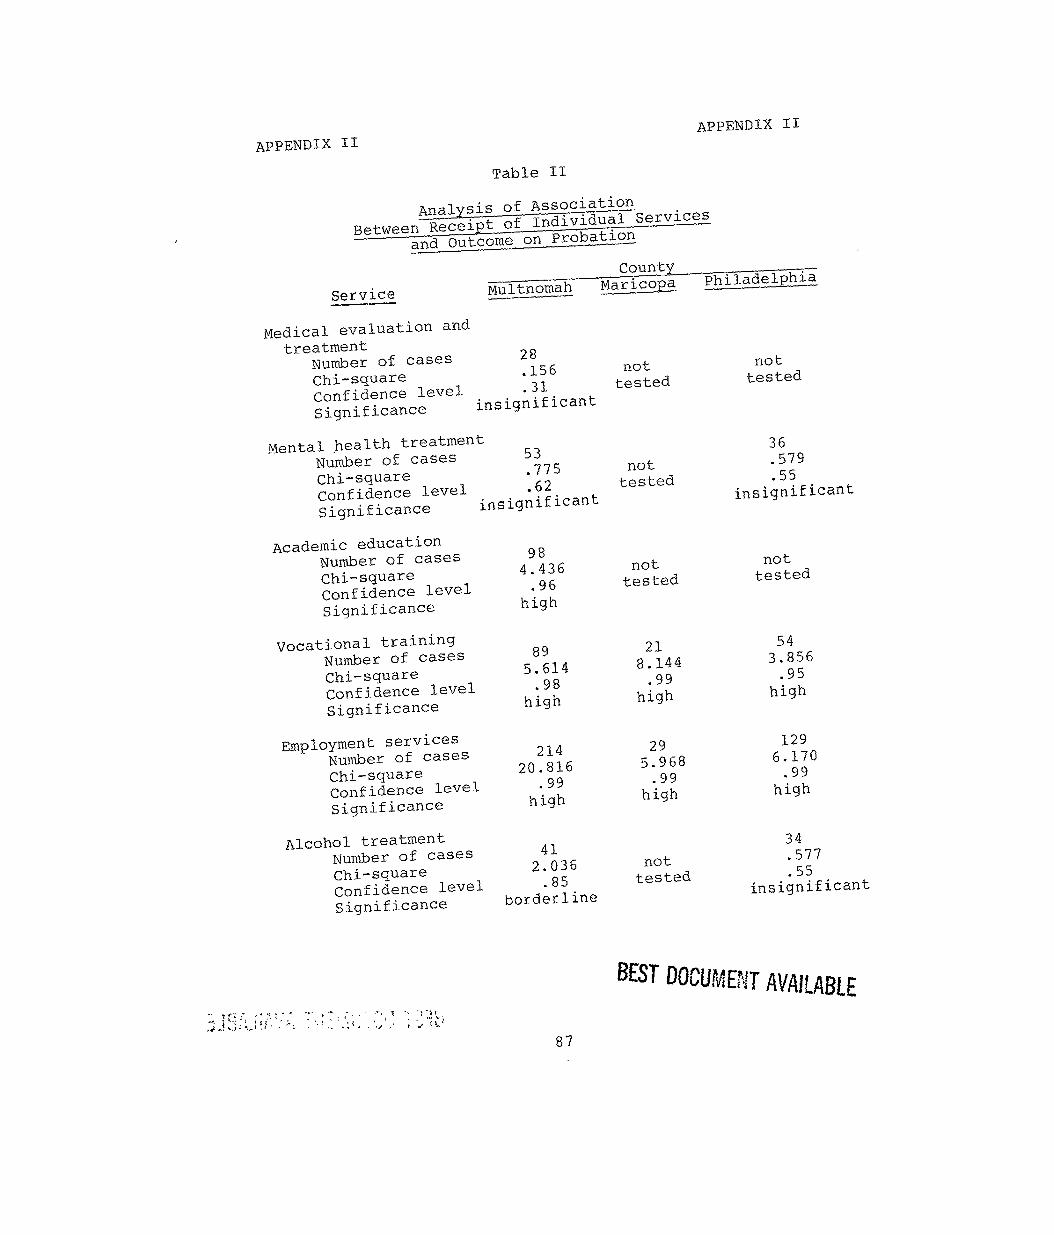
APPENDIX II APPENDIX 11
Table II
Analysis of Association Between Receipt of Individual Services
and Outcome on Probation
Service County
Multnomah Maricopa m
Medical evaluation and treatment
Number of cases 28 Chi-square . 156 Confidence level .31 Significance insignificant
Mentalhealth treatmer Number of cases 35 -_< . ..nC
Chi-square . .f -/ 5 1lUL
Confidence level l 62 tested Significance insignificant
not tested
Academic education Number of cases Chi-square Confidence level Significance
Vocational training Number of cases Chi-square Confidence level Significance
Employment services Number of cases Chi-square Confidence level Significance
Alcohol treatment Number of cases Chi-square Confidence level Significance
98 4.436
.96 high
89 5.614
.98 high
214 20.816
.99 high
41 2.036
. 85 borderline
not tested
21 a.144
.99 high
29 5.968
-99 high
not tested
not tested
36 .579 . 55
insignificant
not tested
54 3.856
.95 high
129 6.170
.99 high
34 -577 .55
insignificant
87

APPENDIX II APPENDIX II
County Multnomah Maricopa Philadelphia -
Drug treatment Number of cases 63 53 53 Chi-square 4.379 11.244 1.392 Confidence level . 96 99 Significance high high
. 76 insignificant
Individual and group counseling
Number of cases 26 Chi-square not not 2.521 Confidence level tested tested . 89 Significance borderline
In addition to testing services individually, we tried to determine if services in general had any impact on probation outcome. The services considered were:
Medical evaluation and treatment
Mental health treatment Academic education Vocational training
Employment services Alcohol treatment Drug treatment Individual and group
counseling
We felt that if a person needed two or more of the above services, receiving only one of the needed services would not be enough to affect his outcome on probation but receipt of all needed services might improve his chances of success.
We hypothesized that the extent to which all needed services were received would be related to probation out- come.
An index of the extent to which needed services were received was constructed as described below for those pro- bationers who needed one or more services. First, data on the percent of each needed service received was categorized as follows:
Percent of services received Value
O-24 2 25-49 3 50-74 4 75-100 5
NEST DOCUMENT AVAiLABLE 88

APPENDIX II APPENDIX II
Then the "average" extent of services received was computed by adding the values for each needed service and dividing by the number of services needed. Probationers were then divided into two categories. Those probationers with average values between 2.0 and 3.5 were considered to have received a low extent of needed services, and the rest were considered to have received a high extent.
Tables III through V show the results of chi-square tests of the association between the extent to which all needed services were received and probation outcome.
_ 1’.
BEST DOCUME8T AVAILABLE ’
f’; ..% .;f !:
:.;“I, # : _ : : : : /’ ., ;.
: ,;i
89

APPENDIX II APPENDIX II
Table III
MULTNOMAH COUNTY
Analysis of Association Between Extent to Which Services Were Received and Outcome on Probation
Extent of service received
Low No. of cases Row percent
High No. of cases Row percent
Total No. of cases Row percent
Significance of association Chi-square Degrees of freedom Confidence level
Probation outcome Success Failure Total
50 60 110 45.5 54.5 100
81 17 98 82.7 17.3 100
131 77 208 63.0 37.0 100
High 29.184 1 .99+
90

APPENDIX II APPENDIX II
Table IV
MARICOPA COUNTY
Analysis of Association Between Extent to Which Services Were Received and Outcome on Probation
Probation outcome Success Failure Total
Extent of service received
Low Number 5 Row percent 12.5
High Number 22 Row percent 61.1
Total Number 27 Row percent 35.5
Significance of association High Chi-Square 17.483 Degrees of freedom 1 Confidence level .99+
35 40 87.5 100
14 36 38.9 100
49 76 64.5 100
91

APPENDIX II APPENDIX II
Table V
PHILADELPHIA COUNTY
Analysis,of Association Between Extent to Which Services Were Received and Outcome on Probation
Probation Outcome Failure Total Success
Extent of service received
Low Number 26 Row percent 32.5
High Number 30 Row percent 58.8
Total Number 56 Row percent 42.7
Significance of association High Chi-square 7.775 Degrees of freedom 1 Confidence level .99
. . .
54 80 67.5 100
21 51 41.2 100
75 131 57.3 100
BEST DOCUMENT AVAfIA6;
92

APPENDIX III APPENDIX III
RESULTS OF MQDEL VALIDATION
Validation studies were done for eight predictive models in each of the three counties reviewed, to determine if there was a relationship between a probationer's model score (or category) and his success or failure on probation. For purposes of these studies, a person was considered a failure if
--his probation was revoked,
--he was incarcerated during probation, or
--he was sentenced to 60 days or more for a crime committed during probation or a followup period of at least 12 months after the termination of probation.
All others were considered successful.
Validation results for the eight existing models are summarized on page 55.
MODEL SELECTION
Certain models were chosen for review because it was felt that information to test the validity of these models would be readily available from probation case files or criminal history records. Other existing models could not be vali- dated because they included either subjective characteristics or those which could not be determined from case files. For example, judgments on whether the probationer's values are predominantly conventional or criminal and information about the probationer's childhood.
PROBATION MODELS
Model I, the Oregon Form
Model I (see fig. I) is based on a model used by Oregon probation officers in deciding the level of probation supervision. It is a judgmentally modified version of a California parole model. Model I differs from the Oregon Form actually in use in one respect. We were unable to determine from case files whether the probationers had stable marriages for 18 months or longer before probation. There- fore, we replaced this element with the element, "legally married and living with spouse at time of arrest." Valida- tion results are shown in figures I-A through I-C.

APPENDIX III APPENDIX III
Model II, the Newark Form
Model II (see fig. II) is based on a model used by the Newark, New Jersey, probation office. That office is gather- ing model scores on current probationers so that a validation study can be done. Validation results are shown in figures II-A through II-C.
Model III, the Glaser Model
Model III (see fig. III) is based on a model presented in a paper by Daniel Glaser. The Glaser Model was developed using data on 190 men sentenced to probation for 1 year or more during 1947 and 1948 in the U.S. District Court for the Northern District of Illinois.
Glaser's model assigns a score for each of six attri- butes --work record, residence stability, dependency, age at first arrest, total previous detention, and previous convic- tions. Model III assigns a score based on the same six attri- butes: however, on four of the six attributes different information was used to measure the attributes as follows:
Glaser Model
Employed 80 percent or more of time in the labor market, or student never in labor market
Model III
Work record
Employed at least 25 percent or student or unemployable at least 75 percent of last 2 consecutive years of civil- ian life
Employed less than 80 per- Employed less than 25 percent cent of time in the labor of time and not a student or market unemployable 75 percent of
time or more
Residence stability
One address for a year or more at time of offense
More than one address in year preceding offense
12 or more months in State when arrested
Less than 12 months in State
BEST DOCUi!E~!T AK4ILABlE

APPENDIX III APPENDIX III
Dependency
No debts overdue and no Employed full time when dependency in year preceding arrested offense
Relief, dependency, or "eco- Not employed full time when nomic marginality" in year arrested preceding offense
Total previous detention
None None
Less than 6 months One previous detention
6 months or more Two or more previous deten- tions
Validation results are shown in figures III-A through III-C.

APPENDIX III APPENDIX III
FIGURE I
Model I-- Oregon Form
Base Expectancy Score Calculation
Circle points if characteristic is APPLICABLE. Cross out points if characteristic is NOT APPLICABLE.
CODE CHARACTERISTICS
A.
B.
C.
D.
E.
F.
G.
H.
I.
J.
K.
L.
M.
Arrest-free period of five or more consecutive years
No history of any opiate use.
Few jail commitments (none, one or two).
Not checks, forgery or burglary. (Most recent court commitment)
No family criminal record.
No alcohol involvement.
Married and living with wife at time of arrest.
Six or more consecutive months for one employer.
No aliases.
Full-time employment available.
Favorable living arrangement.
Few prior arrests (none, one or two).
( ) BE SCORE, 00-76, Sum of Circled Points. _.
POINTS
12
9
8
7
,I “, i L ‘.J
, ‘, , 1 L& : . * ’ q Medium High
-+':-“, : .* . 00-32 33-45 46-76 _.
Compiled by: Office: Date of Calculation:
96

APPENDIX III APPENDIX III
FIGURE I-A
Results of Statistical Tests
Model I--Oregon Form
Multnomah County
Distribution of Model Scores
Score 9-42
Number of Successes Failures
Percent successful
76 - Highest 18 2 90 61 - 66 23 7 77 46 - 60 49 15 77 36 - 45 23 14 62
Lowest - 35 7 11 39 -
Total 120 49 71 - -
Significance of association Chi-square value Degrees of freedom Level of confidence
High 15.356
4 .99+
Successes Failures
Mean score 54.9 45.7 Standard deviation 11.3 14.6
Difference between means t-value Confidence level Significance of difference
3.95 .99+
High
Point biserial correlation coefficient (model score r vs. actual outcome) pb= .3214
BEST DOCUMEI\JT AVAILABLE
97

APPENDIX III APPENDIX III
Score qroue
64 - Highest 41 - 63
Lowest - 40
Total
FIGURE I-B
Results of Statistical Tests
Model I-- Oregon Form
Maricopa County
Distribution of Model Scores
Number of Successes Failures
14 0 17 10
3 -
34 =
11 -
21 - -
Significance of association High Chi-square value 18.338 Degrees of freedom 2 Level of confidence .99+
Successes Failures
Mean score 60.1 Standard deviation 12.3
Difference between means t-value Confidence level Significance of difference
42.5 11.8
5.22 .99+
High
Point biserial correlation coefficient (model score vs. actual outcome)
r pb= -5826
Percent successful
100 63 21
62

APPENDIX III APPENDIX III
Score group
50 - Highest 34 T 49
Lowest - 33
Total
FIGURE I-C
Results of Statistical Tests
Model I --Oregon Form
Philadelphia County
Distribution of Model Scores
Number of Successes Failures
Percent successful
12 7 63 13 19 41
2 17 11 - -
27 43 39 - - - -
Significance of association Chi-square value Degrees of freedom Level of confidence
High 11.212
2 .99+
Successes Failures
Mean score 49.6 37.1 Standard deviation 13.6 12.0
Difference between means t-value Confidence level Significance of difference
Point biserial correlation coefficient (model score vs. actual outcome)
3.90 .99+
High
r pb= .4371

APPENDIX III APPENDIX III
FIGURE II
Model II--Newark, N.J., Form
The Base Expectancy Scoring Form is as Follows:
POINTS
12 (A)
9 (B) 8 (Cl
7 CD)
4
5 (J) 4 (K) 4 (L)
(El (F) (G) (H)
(1)
CHARACTERISTIC SCORE
Arrest free period of five or more consecutive years. No history of any opiate use. Few jail commitments (not more than two). No checks, forgery or burglary (most recent court commitment). No family criminal record. No alcohol involvement. Not first arrested for auto theft. 12 or more consecutive months for one employer (prior to present offense). 4 to 11 months with one employer (if given 6 for H, add 4 f&r this.)
No aliases. Favorable living arrangement, Few prior arrests (note more than two).
Total Base Expectancy Score
100

APPENDIX III
Score group
69 - Highest 62 - 68 51 mi 61 44 - 50
Lowest - 43
Total
APPENDIX III
FIGURE II-A
Results of Statistical Tests
Model II --Newark Form
Multnomah County
Distribution of Model Scores
Number of Successes Failures
23 5 24 5 38 13 29 12 11 17 -
125 52 - -
Significance of association High Chi-square value 17.474 Degrees of freedom 4 Level of confidence .99+
Percent successful
Successes Failures
Mean score 57.2 Standard deviation 11.2
Difference between means t-value 3.59 Confidence level .99+ Significance of difference High
Point biserial correlation coefficient (model score r vs. actual outcome) pb= .2814
49.6 13.5
82 83 75 71 39
71

APPENDIX III APPENDIX III
Score group
70 - Highest 48 - 69
Lowest - 47
Total
FIGURE II-B
Results of Statistical Tests
Model II--Newark Form
Maricopa County
Distribution of Model Score
Number of Successes Failures
19 0 15 14
8 11 - -
42 25 - - - -
Percent successful
100 52 42
63
Significance of association High Chi-square value 16.240 Degrees of freedom 2 Level of confidence .99+
Successes Failures
Mean score 63.1 47.6 Standard deviation 12.0 10.9
Difference between means t-value 5.29 Confidence level .99+ Significance of difference High
Point biserial correlation coefficient (model score vs. actual outcome) 'pb= . 5484
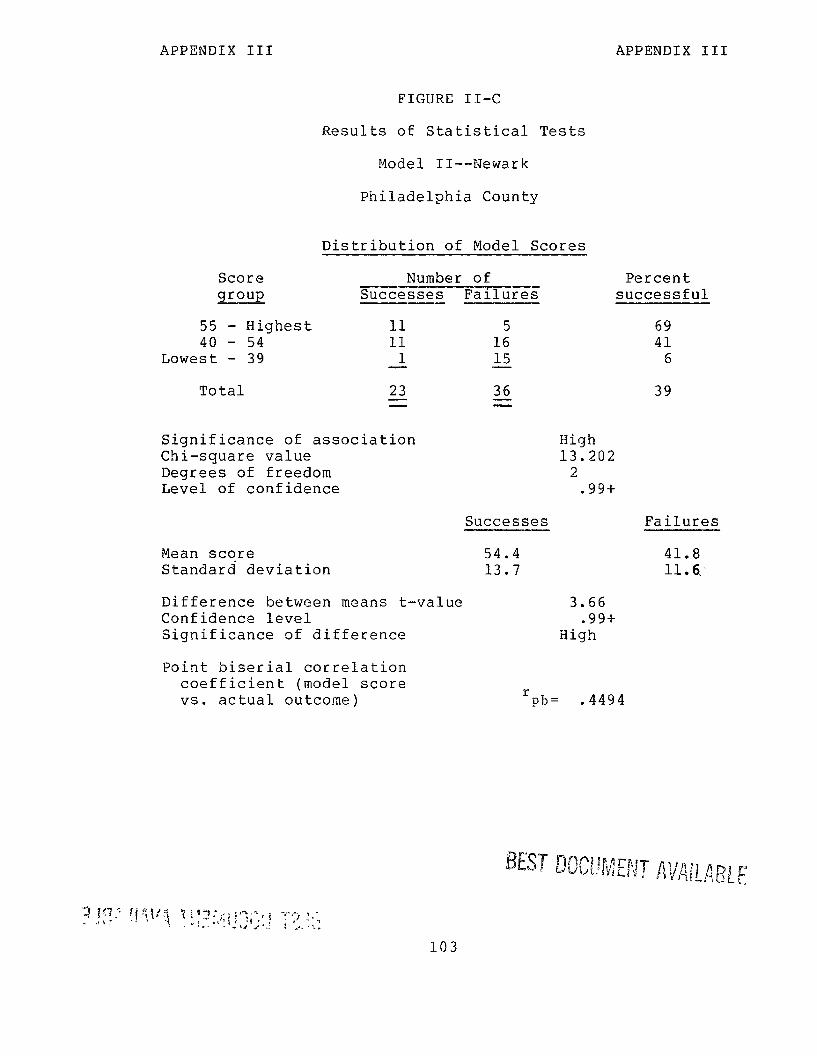
APPENDIX III APPENDIX III
FIGURE II-C
Results of Statistical Tests
Model II --Newark
Philadelphia County
Distribution of Model Scores
Score Number of group Successes Failures
55 - Highest 11 5 11 16
1 15 - -
Total 23 36 - - - -
Significance of association High Chi-square value 13.202 Degrees of freedom 2 Level of confidence .99+
Percent successful
69 41
6
39
Successes Failures
Mean scqre 54.4 41.8 Standard deviation 13.7 11.6,
Difference between means t-value 3.66 Confidence level .99+ Significance of difference iIigh
Point biserial correlation coefficient (model score vs. actual outcome)
r Rb= .4494
103

APPENDIX III APPENDIX III
FIGURE III
Model III--Glaser Model
Characteristic
Work record in last 2 consecutive years of civilian life:
Score value
Employed at least 25% of time or student or unemployable at least 75% of time 1
Employed or student less than 25% of time or unemployable less than 75% of time -1
Residence stability when arrested:
12 or more months in State Less than 12 months in State
Dependency when arrested:
Employed full time Not employed full time
Age when first arrested:
30 years or over 20 to 29 years Under 20
Total previous detention:
None 1 2 or more
Previous convictions:
None Misdemeanors only Felonies
0 -1
1 0
1 0
-1
1 0
-1
1 0
-1
104

APPENDIX III APPENDIX III
FIGURE III-A
Results of Statistical Tests
Model III --Glaser Model
Multnomah County
Distribution of Model Scores
Score group
Number of Successes Failures
Percent successful
4-5 27 4 84 3. 26 6 81 l-2 49 12 80
-1 - 0 33 24 58 -5 - 2 13 21 38 -
Total 148 67 69 - -
Significance of association Chi-square value Degrees of freedom Confidence level
High 28,896
4 .99+
Successes Failures
Mean score 1.5 -. 3 Standard deviation 2.1 2.4
Difference between means t-value Confidence level Significance of difference
5.10 .99+
High
Point biserial correlation coefficient (model score vs. actual outcome) 'pb= .3455
105

APPENDIX III APPENDIX III
FIGURE III-B
Results of Statistical Tests
Model III-- Glaser Model
Maricopa County
Distribution of Model Score
Score Number of Percent group Successes Failures successful
3- 5 32 6 o- 2 34 22
-5 - -1 15 16 - -
Total 81 44 - - - -
Significance of association High Chi-square value 10.348 Degrees of freedom 2 Confidence level .99+
84 61 48
65
Successes Failures
Mean score 1.6 .2 Standard deviation 1.9 1.9
Difference between means t-value 4.08 Confidence level .99+ Significance of difference Hiqh
Point biserial correlation coefficient (model score vs. actual outcome) 'Pb= .3449
106

APPENDIX III APPENDIX III
Score Number of Percent group Successes Failures successful
FIGURE III-C
Results of Statistical Tests
Model III --Glaser Model
Philadelphia County
Distribution of Model Score
3- 5 9 5 -21 2 16 22 -5 - -3 1 13 - -
Total 26 40 - - =
Significance of association Chi-square value Degrees of freedom Confidence level
64 42
7
39
High 9.849 2
. 99+
Successes Failures
Mean score 1.2 -1.1 Standard deviation 2.1 2.3
Difference between means t-value 4.18 Confidence level .99+ Significance of difference High
Point biserial correlation coefficient (model score vs. actual outcome) r pb= .4627
107

APPENDIX III APPENDIX III
PAROLE MODELS
California parole models
Models IV through VII (see figs. IV through VII) are based on models developed and validated using data on men paroled in California during 1956. California Base Expectancy Forms 61A and 61B were derived through multiple regression analysis on 873 parolees and validated on a sample of 937 parolees. A third model was developed using association analysis. These three models were developed using a 2-year followup on each parolee. Later, when 8 years of followup information was available for the parolees, another regression analysis resulted in a fourth model called Form 65A.
Model IV is the same as California Form 61A except that it omits, as inapplicable to probationers, whether the subject sentence is the first in imprisonment.
Models V and VI are California Forms 61B and 65A, re- spectively. Model VII is the California model developed using association analysis. Validation results are shown following each model.
Model VIII
Model VIII (see figure VIII) is a model developed for the use of the Board of Parole using a sample of Federal parolees of fiscal years 1966 and 1968. Chi-square tests were used to determine which characteristics were predictive of parole outcome. Theselcharacteristics were then weighted using the Burgess method. The parole board currently uses the model scores to help decide parole. Validation results are shown in figures VIII-A through VIII-C.
lThe Burgess method assigns equal weights to each of a large number of characteristics.

APPENDIX III APPENDIX III
FIGURE IV
Model IV-- California Base Expectancy Form 61A
(modified)
TO OBTAIN RAW SCORES:
Characteristics
Arrest free 5 or more years
No history of any opiate use
Less than three jail commitments
Offense not checks, fraud or burglary
No criminal record among family
No alcohol involvement
Not first arrested for auto theft
6 months or more in any one job
No aliases
Favorable living arrangement
Less than three prior arrests
Total
Score
12
9
8
7
6
6
5
5
5
4
4
71
109

APPENDIX III APPENDIX III
FIGURE IV-A
Results of Statistical Tests
Model IV--California Form 61A
Multnomah County
Distribution of Model Scores
Score group
Number of Successes Failures
Percent successful
67 - Highest 14 3 82 61 - 66 26 7 79 47 - 60 53 17 76 40 - 46 23 13 64
Lowest - 39 9 12 43 -
Total 125 52 71 E
Significance of association High Chi-square value 11.652 Degrees of freedom 4 Confidence level .98
Mean Score 54.8 47.8 Standard deviation 10.0 13.0
Difference between means t-value Confidence level Significance of difference
Point biserial correlation coefficient (model score vs. actual outcome)
Successes Failures
3.48 .99+
High
r pb= .2808
110

APPENDIX III APPENDIX III
Score group
67 - Highest 45 - 66
Lowest - 44
Total
FIGURE IV-H
Results of Statistical Tests
Model IV--California Form 61A
Maricopa County
Distribution of Model Scores
Number of Percent Successes Failures successful
16 1 20 13
6 11 - -
42 25 - - - -
Significance of association High Chi-square value 12.695 Degrees of freedom 2 Confidence level .99+
94 61 35
63
Successes Failures
Mean score 59.1 45.0 Standard deviation 11.4 10.4
Difference between means t-value 5.05 Confidence level .99+ Significance of difference High
Point biserial correlation coefficient (model score vs. actual outcome)
r pb= .5308
111
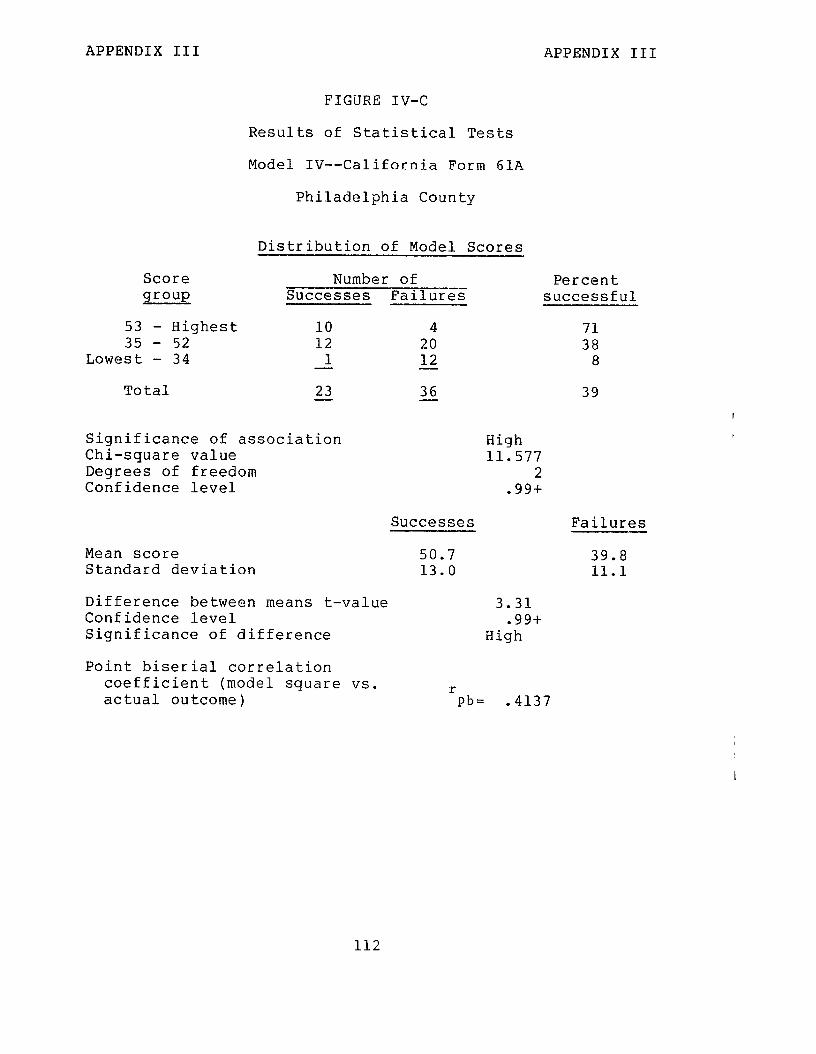
APPENDIX III APPENDIX III
FIGURE IV-C
Score group
Results of Statistical Tests
Model IV--California Form 61A
Philadelphia County
Distribution of Model Scores
Number of -- Successes Failures
Percent successful
53 - Highest 10 4 71 35 - 52 12 20 38
Lowest - 34 1 12 8 - -
Total 23 36 39 - -
Significance of association Chi-square value Degrees of freedom Confidence level
High 11.577
2 .99+
Successes Failures
Mean score 50.7 39.8 Standard deviation 13.0 11.1
Difference between means t-value Confidence level Significance of difference
3.31 .99+
High
Point biserial correlation coefficient (model square vs. r actual outcome) pb= .4137
112

APPENDIX III APPENDIX III
FIGURE V
MODEL V
California Base Expectancy Form 61B
TO OBTAIN RAW SCORES:
If
A. Arrest free five or more years
Ko history of any opiate use
No family criminal record
$ Not checks or burglary (subject offense)
B. Age at subject offense times .6
21 is added for all persons
C. Subtotal: A+B
D. Aliases: -3 times number
E. Prior incarcerations: -5 times number
F. Subtotal: D+E
G. Score: Subtract F from C
Add
16
13
8
13
21 --
L-.-J
/---7 --- -- L-J
113

APPENDIX III APPENDIX III
FIGURE V-A
Score group
Results of Statistical Tests
Model V--California Form 6lH
Multnomah County
Distribution of Model Scores
Number of Successes Failures
Percent successful
86.7 - Highest 22 1 96 76.5 - 86.6 38 8 83 58.5 - 76.4 65 28 70 43.5 - 58.4 27 19 59
Lowest - 43.4 9 15 38 -
Total
Significance of association Chi-square value Degrees of freedom Confidence level
Mean score Standard deviation
Difference between means t-value Confidence level Significance of difference
Point biserial correlation coefficient (model score vs. actual outcome)
69
High 25.236
4 .99+
Successes Failures
70.2 57.2 15.6 18.6
5.12 .99
High
r pb= .3401
114

APPENDIX III APPENDIX III
Score group
FIGURE V-B
Results of Statistical Tests
Model V--California Form 61B
Maricopa County
Distribution of Model Scores
Number of Successes Failures
Percent successful
86.1 - Highest 13 1 93 7.1.3 - 86.0 25 4 86 50.8 - 71.2 33 21 61 30.3 - 50.8 9 23 28
Lowest - 30.2 3 11 21 - -
Total 60 - - 58
Significance of association Chi-square value Degrees of freedom Confidence level
High 36.090
4 .99+
Mean score Standard deviation
Successes Failures
70.1 45:7 18.1 20.6
Difference between means t-value Confidence level Significance of difference
7.36 .99+
High
Point biserial correlation coefficient (model score vs. actual outcome)
r pb= .5346
115

APPENDIX III APPENDIX III
FIGURE V-C
Results of Statistical Tests
Model V--California Form 61B
Philadelphia County
Distribution of Model Scores
Score Number of Percent group Successes Failures successful
78.9 - Highest 14 1 93 63.9 - 78.8 10 8 56 45.5 - 63.8 7 21 25 31.9 - 45.4 3 15 17
Lowest - 31.8 1 14 7 - -
Total 35 59 37 - - - -
Significance of association Chi-square value Degrees of freedom Confidence level
Successes
High 33.833
4 .99+
Mean score 70.2 44.9 Standard deviation 20.0 18.3
Difference between means t-value Confidence level Significance of difference
Point biserial correlation coefficient (model score vs. actual outcome)
6.26 .99+
High
r pb= .5468
Failures
116

APPENDIX III APPENDIX III
FIGURE VI
MODEL VI
California
Base Expectancy Form 65A
TO OBTAIN RAW SCORES, ADD
11 for all persons
19 if no more than two prior arrests
15 if arrest free five or more years or if never before arrested
14 if no prior incarceration
8 if subject offense was not checks or burglary
. 6 times age at subject offense
Base Expectancy 65A Score
117
11
/ /

APPENDIX III APPENDIX III
FIGURE VI-A
Results of Statistical Tests
Score group
Model VI --California Form 65A
Multnomah County
Distribution of Model Scores
Number of Successes Failures
Percent successful
81.5 - Highest 23 3 88 77.6 - 81.4 43 8 84 45.7 - 77.6 62 33 65 31.1 - 45.6 25 24 51
Lowest - 31.0 14 12 54 -
Total 167 80 68 =
Significance of association Chi-square value Degrees of freedom Level of confidence
High 20.307
4 .99-t
Successes Failures
Mean score 64.0 51.2 Standard deviation 19.0 18.5
Difference between means t-value Confidence level Significance of difference
4.98 .99+
High
Point biserial correlation coefficient (model score vs. actual outcome)
r pb= .3030
118

APPENDIX III APPENDIX III
FIGURE VI-!3
Score grouq?
80.3 - Highest 64.7 - 80.2 35.9.- 64.6 29.7 - 35.8
Lowest - 29.6
Total
Results of Statistical Tests
Model VI-- California Form 65A
Maricopa County
Distribution of Model Scores
Number of --- Successes Failures
25 2 33 9 52 35 18 27
6 20 -
134 93 - -
Significance of association Chi-square value Degrees of freedom Level of confidence
High 39.862
4 .99+
Percent successful
Successes Failures
93 79 60 40 23
59
Mean score 59.6 41.6 Standard deviation 20.4 16.4
Difference between means t-value Confidence level Significance of difference
7.36 .99+
High
Point biserial correlation coefficient (model score vs. actual outcome )
r pb= .4271
119

APPENDIX III APPENDIX III
FIGURE VI-C
Results of Statistical Tests
Model VI --California Form 65A
Philadelphia County
Distribution of Model Scores
Score Number of wow Successes Failures
77.9 - Highest 13 1 59.3 - 77.8 14 10 37.7 - 59.2 13 21 24.9 - 37.6 6 18
Lowest - 24.8 0 14 - -
Total 46 64 - - - -
Percent successful
93 58 38 25
0
42
Significance of association Chi-square value Degrees of freedom Level of confidence
High 30.712
4 .99+
Successes Failures
Mean score 64.8 Standard deviation 19.3
Difference between means t-value Confidence level Significance of difference
42.1 16.9
6.40 .99+
High
Point biserial correlation coefficient (model score vs. actual outcome) -pb= .5329
120
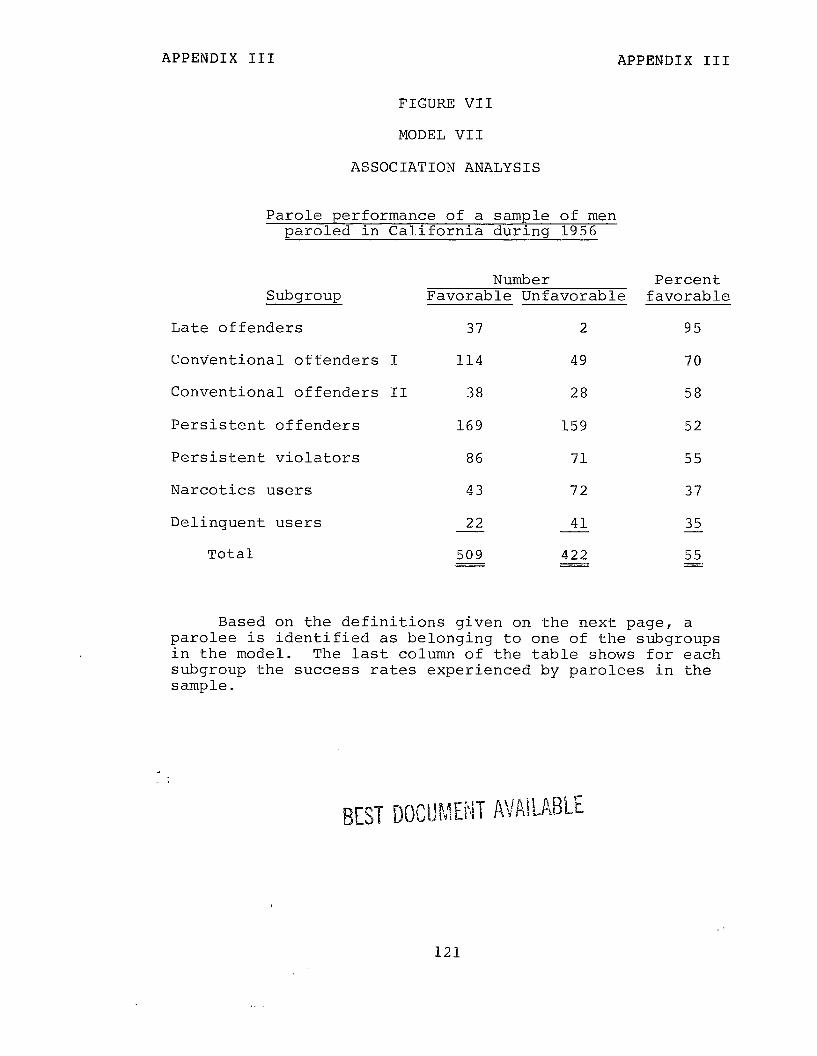
APPENDIX III APPENDIX III
FIGURE VII
MODEL VII
ASSOCIATION ANALYSIS
Parole performance of a sample of men paroled in California during 1956
Subgroup
Late offenders
Conventional offenders I
Conventional offenders II
Persistent offenders
Persistent violators
Narcotics users
Delinquent users
Total
Number Favorable Unfavorable
37 2
114 49
38 28
169 159
86 71
43 72
22 41
509 422 - -
Percent favorable
95
70
58
52
55
37
35 -
55 =
Based on the definitions given on the next page, a parolee is identified as belonging to one of the subgroups in the model. The last column of the table shows for each subgroup the success rates experienced by parolees in the sample.
121

APPENDIX III APPENDIX III
CLASSIFICATION OF OFFENDERS INTO SEVEN SUBGROUPS
(A) Late
Offender Conwctlon
Yes Y No
Offender II
1 Offender 1
Opiate
Drug Use?
1 * 2- rl tent
Yes
Violator 1
(F) 1 Narcotics User
(G) )- Delin-
quent
I User

APPENDIX III APPENDIX III
FIGURE VII-A
Model VII-- Association Analysis Multnomah County
Subgroup
Late offenders
Conventional ers I
Conventional ers II
offend-
offend-
Persistent offenders
Persistent violators
Narcotics users
Delinquent users
Total
Cate- gory
A
Significance of association Chi-square value Degrees of freedom Level of confidence
Number of Percent Successes Failures Successful
53 10 84
69 28 71
2
18
11
15
2
170
High 21.817
6 . 99+
6 25
11 62
6 65
11 58
5 29 - -
77 69 - =
123

APPENDIX III APPENDIX III
FIGURE VII-B
Model VII-- Association Analysis Maricopa County
Subgroup
Late offenders
Conventional offend- ers I
Conventional offend- ers II
Persistent offenders
Persistent violators
Narcotics users
Delinquent users
Total
Cate- gory
A
Significance of association High Chi-square value 46.854 Degrees of freedom 6 Level of confidence .99+
Number of Percent Successes Failures Successful
28 4 88
50 17
6 6 50
25 27 48
7 3
14 21
3 21
133 99 =
75
70
40
13 -
57 =
124

APPENDIX III APPENDIX III
FIGURE VII-C
Model
Subgroup
Late offenders
Conventional offend- ers I
Conventional offend- ers II
Persistent offenders
Persistent violators
Narcotics users
Delinquent users
Total
VII--Association Analysis Philadelphia County
Cate- gory
A
Number of Percent Successes Failures Successful
13 6 68
11 6 65
4
55
3
4
7
97
Significance of association High Chi-square value 32.812 Degrees of freedom 6 Level of confidence .99+
BEST DOCUMENT AVAIlABLE
10 29
43 56
4 43
15 21
37 16 -
121 44 =

APPENDIX III APPENDIX III
FIGURE VIII
Model VIII--Salient Factors
Case Name Register Number
Item A
No prior convictions (adult or juvenile) = 2 One or two prior convictions = 1 Three or more prior convictions = 0
Item B L-1
No prior incarcerations (adult or juvenile) = 2 One or two prior incarcerations = 1 Three or more prior incarcerations = 0
Item C = //
Age at first commitment (adult or juvenile) 18 years or older = 1 Otherwise = 0
Item D /
Subject offense did not involve auto theft = 1 Otherwise = 0
Item E L-1
Never had parole revoked or been committed for a new offense while on parole = 1 Otherwise = 0
Item F
No history of heroin, cocaine, or barbiturate dependence = 1 -: i 9 ";I, : R -i , * ,*. "1 - Otherwise = 0 -J a 1 6.: >I"."," ,. ., J ;>dI,..':i .i
/L.-/
Item G L-1
Has completed 12th grade or received a high school equivalency certificate = 1 Otherwise = 0
BEST DOCUMENT AVAILABLE 126

APPENDIX III APPENDIX III
Item H L-1
Verified employment (or full-time school attendance) for a total of at least 6 months during the last 2 years in the community = 1 Otherwise = 0
Item I
Release plan to live with spouse and/or children = 1 Otherwise = 0
Total Score
127
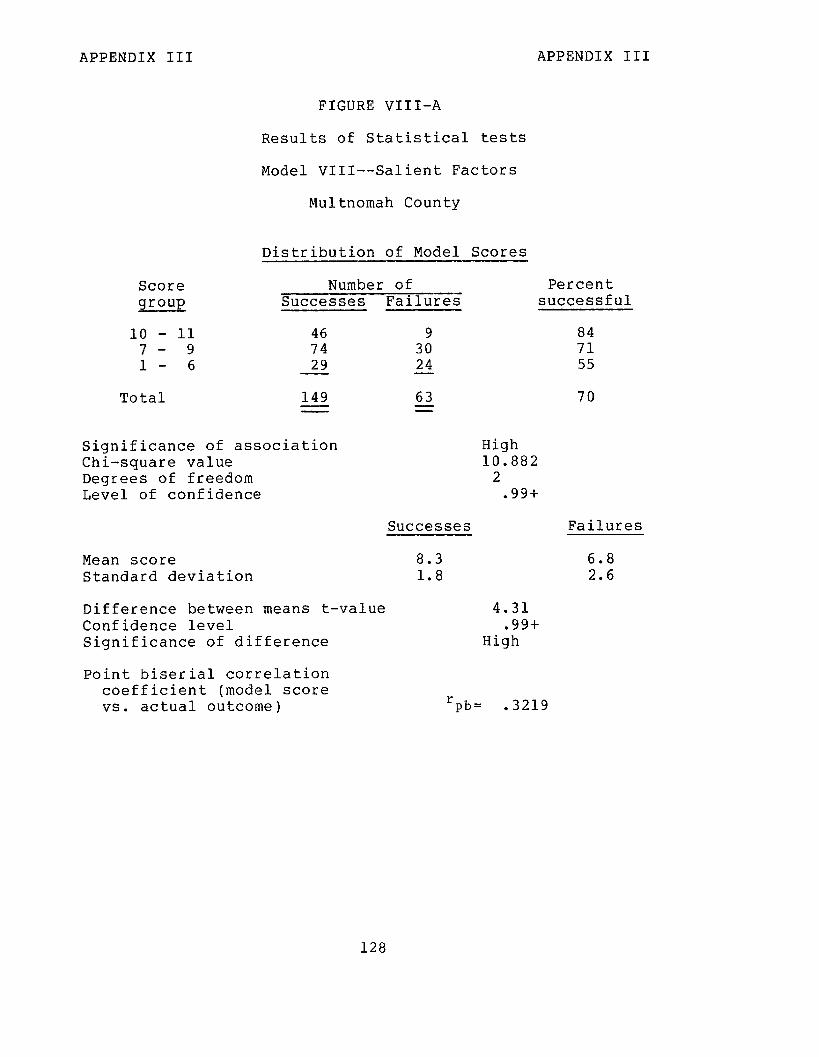
APPENDIX III APPENDIX III
Score grow
FIGURE VIII-A
Results of Statistical tests
Model VIII-- Salient Factors
Multnomah County
Distribution of Model Scores
Number of Percent Successes Failures successful
10 - 11 46 9 7- 9 74 30 l- 6 29 24 -
Total 149 63 - -
Significance of association Chi-square value Degrees of freedom Level of confidence
Successes
Mean score 8.3 Standard deviation 1.8
Difference between means t-value Confidence level Significance of difference
Point biserial correlation coefficient (model score vs. actual outcome)
84 71 55
70
High 10.882
2 .99+
Failures
6.8 2.6
4.31 .99+
High
rpb= .3219
128

APPENDIX III APPENDIX III
FIGURE VIII-B
Results of Statistical Tests
Model VIII-- Salient Factors
Maricopa County
Distribution of Model Scores
Score Number of Percent group Successes Failures successful
10 - 11 36 5 8- 9 38 14 l- 7 23 24 - -
Total 97 43 - - - -
88 73 49
69
Significance of association High Chi-square value 16.105 Degrees of freedom 2 Level of confidence .99+
Successes Failures
Mean score 8.6 6.8 Standard deviation 1.7 2.1
Difference between means t-value 4.88 Confidence level .99+ Significance of difference High
Point biserial correlation coefficient (model score vs. actual outcome) rpb= .4088
129

APPENDIX III APPENDIX III
FIGURE VIII-C
Results of Statistical Tests
Model VIII --Salient Factors
Philadelphia County
Distribution of Model Scores
Score group
Number of Successes Failures
Percent successful
9 - 11 12 3 80 6- 8 10 19 34
Lowest - 5 3 16 16 - -
Total
Significance of association Chi-square value Degrees of freedom Level of confidence
Mean score Standard deviation
Difference between means t-value 4.11 Confidence level .99+ Significance of difference High
Point biserial correlation coefficient (model score vs. actual outcome)
High 15.046
2 .99+
Successes Failures
7.9 5.6 2.3 1.9
rpb= .4806
130

APPENDIX III APPENDIX III
SUMMARY OF VALIDATION RESULTS
Statistical results for the eight models validated are summarized in the tables below:
Multnomah MarlcOP.
M& Based on NO. of correlation NO. of corre1atmn s coeffrclent s coefflc1ent
I Oregon Form 169 .321 55 .583
II Newark Form 177 .281 67 ,548
III Glaser Model 215 .346 125 ,345
IV callfornla Form 61A 177 .281 67 .531
" callfornla form 618 232 .340 143 .533
.VI Callfornla Form 65A 247 .303 227 .427
VIII Sallent Factors 212 .322 140 .409
Phlladelphla No. of corre1at1on cases coefflcrent
70 ,437
59 .449
66 .463
59 .414
94 .547
110 .533
63 .481
Chi-square Tests for Independence Between Model Category and Probation Outcome
(Model VII --Association Analysis)
Multnomah Maricopa Philadelphia
No. of cases 247 232 218
Chi-square 21.817 46.854 32.812
Confidence level .99+ .99+ .99+
As shown in the above tables, each model was statisti- cally valid in each of the three counties.
However, the lack of information needed to determine model score or (success or failure) caused a large number of the 300 cases in each county to be excluded from the tests of most models. This lack of information was especially noticeable for the Maricopa and Philadelphia samples and on the probationer's juvenile criminal record, employment, and family's criminal record.
MODIFIED MODELS
After reviewing the kind and extent of missing informa- tion problems, we modified four models to increase the num- ber of cases which could be included in the validation.
Model III-A (see fig. IX) is based on Glaser's model and differs from model III in the following respects:
131

APPENDIX III APPENDIX III
--"Age at first arrest" and "total previous detention" were determined using only adult information when juvenile information was unknown.
--"Work record" was scored depending on whether the offender was employed when arrested, rather than on percent of employment in last 2 consecutive years of civilian life.
Validation results are summarized in figures IX-A through IX-C.
Model V-A (see fig. X) is based on California Form 61B and is the same as model V except that "family criminal record" is deleted, and "prior incarcerations" was changed to "prior known incarcerations." Validation results are shown in figures X-A through X-C.
Model VI-A (see fig. XI) is based on California Form 65A and is the same as model VI except that "prior arrests" are based on only adult information if juvenile records are unavailable and "prior incarcerations" was changed to "prior known incarcerations." Validation results are shown in figures XI-A through XI-C.
Model VIII-A (see fig. XII) is based on Salient Factors and differs from model VIII in that item H became "employed when arrested" instead of "verified employment for at least 6 months during the last 2 years in the community." Also "prior incarcerations" was changed to "prior known incarcera- tions" and IIage at first commitment" was based on only adult history when juvenile record was unavailable. Validation results are shown in figures XII-A through XII-C.
Statistical results for the four modified models are summarized in table III below. Each model was statistically valid for the cases tested in each of the three counties.
TABLE III
Point Blserial Correlation Between Model Score and Probation Outcome
Model Based On Multnomah Maricopa
No. of Correlation No. of Philadelphia
Correlation NO. of Correlation cases coefficient cases coefficient cases -- coefficient
III-A Glaser Model 235 .343 175 .400 159 .414
V-A California Form 61B 253 .370 253 .506 209 -521
VI-A California Form 65A 258 ,299 262 .410 229 .458
VIII-A Salient Factors 227 .324 192 .44a 175 .431
132

APPENDIX III APPENDIX III
FIGURE IX
Model III-A
Score value
Work record
Employed at time of arrest Unemployed at time of arrest
Residence stability
12 or more months in State at time of arrest Less than 12 months
Dependency
Employed full-time at time of arrest Not employed full-time at time of arrest
Age at first known arrest (note a)
30 years or over 20 to 29 years under 20
Total known previous detention (note a)
None 1 2 or more
1 -1
0 -1
1 0
1 0
-1
1 0
-1
Previous convictions
None 1 Previous misdemeanor convictions only 0 Previous felony conviction -1
aBased on only adult information when juvenile information is unknown.
133

APPENDIX III APPENDIX III
FIGURE IX-A
Results of Statistical Tests
Model III-A
Multnomah County
Distribution of Model Scores
Score group
Number of Successes Failures
Percent successful
4- 5 27 1 96 3 22 7 76
o- 2 70 27 72 -2 - -1 30 19 61
Lowest - -3 12 20 38 -
Total 161 74 69 - -
Significance of association Chi-square value Degrees of freedom Level of confidence
High 26.913
4 .99-t
Successes Failures
Mean score 1.0 -. 8 Standard deviation 2.3 2.4
Difference between means t-value Confidence level Significance of difference
Point biserial correlation coefficient (model score vs. actual outcome)
5.42 .99+
High
"pb= .3425
134

APPENDIX III APPENDIX III
FIGURE IX-H
Results of Statistical Tests
Model III-A
Maricopa County
Distribution of Model Scores
Score group
Number of -- Successes Failures
3- 5 29 1 -2.- 2 63 50 -5 - -3 12 20 -
Total 104 71 = =
Percent successful
97 56 38
59
Significance of association High Chi-square value 24.269 Degrees of freedom 2 Level of confidence .99+
Successes Failures
Mean score .8 -1.2 Standard deviation 2.4 2.0
Difference between means t-value 5.91 Confidence level .99+ Significance of difference High
Point biserial correlation coefficient (model score vs. actual outcome)
r pb= .3995
135

APPENDIX III APPENDIX III
FIGURE IX-C
Results of Statistical Tests
Model III-A
Philadelphia County
Distribution of Model Scores
Score group
Number of Successes Failures
Percent successful
2- 5 29 10 74 -l- 1 30 49 38 -5 - -2 7 34 17 - -
Total 66 93 42 - - - -
Significance of association Chi-square value Degrees of freedom Level of confidence
Mean score Standard deviation
Difference between means t-value 5.70 Confidence level .99+ Significance of difference i-ligh
Point biserial correlation coefficient (model score vs. actual outcome)
High 27.824
2 .99+
Successes Failures
1.1 -. 9 2.1 2.2
'pb= .4139
136

APPENDIX III APPENDIX III
FIGURE X
Model V-A
TO OBTAIN RAW SCORES:
A.
B.
C.
D.
E.
F.
G.
If Add -
Arrest free five or more years 16
No history of any opiate use 13
Not checks or burglary (subject offense) 13
Age at subject offense times .6
21 is added for all persons 21
Subtotal: A+B / /
Aliases: -3 times number
Prior known incarcerations: -5 times number
Subtotal: D+E / /
Score: Subtract F from C L-J
137

APPENDIX III APPENDIX III
Score group
FIGURE X-A
Results of Statistical Tests
Model V-A
Multnomah County
Distribution of Model Scores
Number of Successes Failures
Percent successful
77.9 - Highest 24 1 96 72.5 - 77.8 42 9 82 52.9 - 72.4 72 29 71 37.7 - 52.8 23 28 45
Lowest - 37.6 10 15 40 -
Total 171 82 68 CZZZ C
Significance of association Chi-square value Degrees of freedom Level of confidence
Mean score Standard deviation
Difference between means t-value Confidence level Significance of difference
Point biserial correlation coefficient (model score vs. actual outcome)
High 35.380
4 .99+
Successes Failures
64.0 50.5 14.5 18.5
5.78 .99+
High
?$Jb= .3697
138

APPENDIX III APPENDIX III
FIGURE X-B
Score group
Results of Statistical Tests
Model V-A
Mar icopa County
Distribution of Model Scores
Number of Successes Failures
Percent successful
77.5 - Highest 25 2 93 61.9 - 77.4 39 10 80 44.5 .- 61.8 64 37 63 27.5 - 44.4 13 36 27
Lowest - 27.4 4 23 15
Total
Significance of association Chi-square value Degrees of freedom Level of confidence
High 64.100
4 .99+
Mean score 61.5 40.9 Standard deviation 16.7 18.4
Difference between Confidence level
means t-value 9.15 .99+
High Significance of difference
Point biserial correlation coefficient (model score vs. actual outcome)
Successes
'pb= .5057
57
Failures
139

APPENDIX III APPENDIX III
FIGURE X-C
Results of Statistical Tests
Model V-A
Philadelphia County
Distribution of Model Scores
Score group
Percent successful
75.9 - Highest 22 0 100 63.3 - 75.8 27 13 68 42.9 - 63.2 35 49 42 26.9 - 42.8 9 32 22
Lowest - 26.8 3 19 14 -
Total 96 113 46 - -
Significance of association Chi-square value Degrees of freedom Level of confidence
High 52.738
4 .99+
Successes Failures
Mean score 64.5 43.7 Standard deviation 17.6 16.7
Difference between means t-value Confidence level Significance of difference
Point biserial correlation coefficient (model score vs. actual outcome)
8.78 .99+
High
rpb= .5208
140

APPENDIX III
FIGURE XI
APPENDIX III
Model VI-A
To obtain raw scores, ADD
11 for all persons 11
19 if no more than two prior arrests (note a)
15 if arrest free five or more years or if never before arrested
14 if no prior know incarceration
8 if subject offense was not checks or burglary
0.6 times age at subject offense
Base expectancy 65A score
a/ Based on adult information if juvenile record unknown. -
141
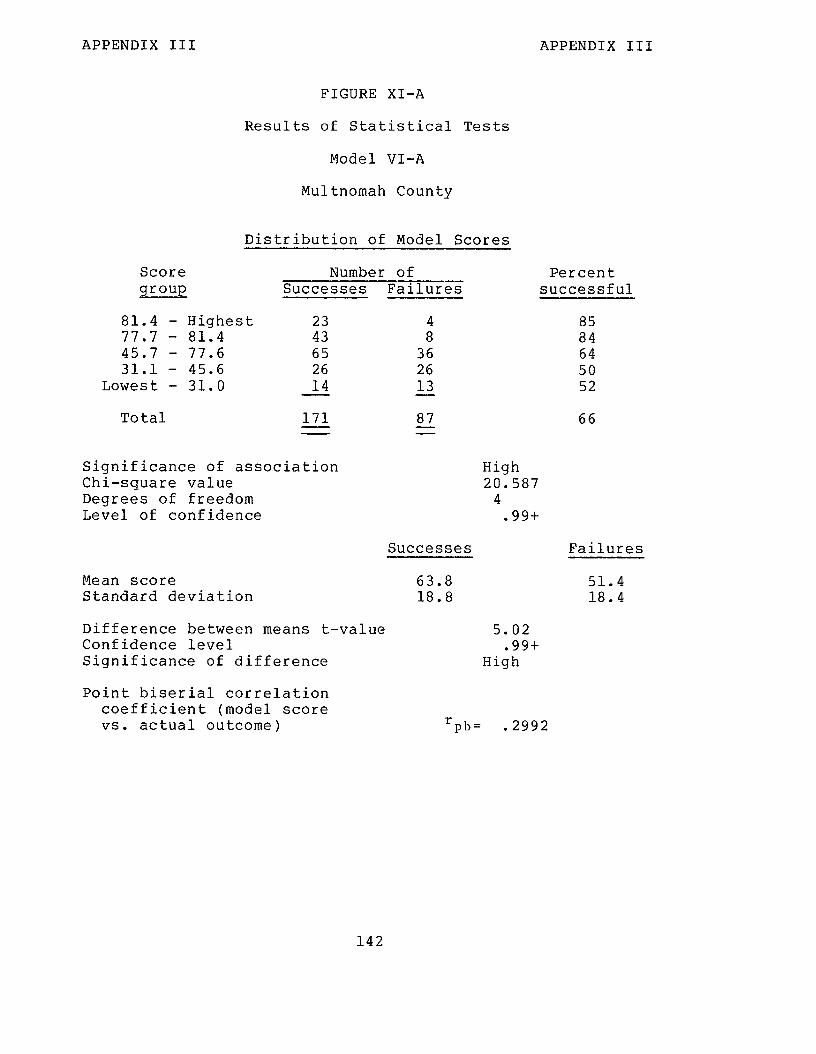
APPENDIX III APPENDIX III
FIGURE XI-A
Results of Statistical Tests
Model VI-A
Multnomah County
Distribution of Model Scores
Score group
Number of Successes Failures
81.4 - Highest 23 4 77.7 - 81.4 43 8 45.7 - 77.6 65 36 31.1 - 45.6 26 26
Lowest - 31.0 14 13 -
Total 171 87 - -
Significance of association Chi-square value Degrees of freedom Level of confidence
Mean score 63.8 51.4 Standard deviation 18.8 18.4
Difference between means t-value 5.02 Confidence level .99+ Significance of difference High
Point biserial correlation coefficient (model score vs. actual outcome)
High 20.587
4 .99+
Percent successful
85 84 64 50 52
66
Successes Failures
'pb= .2992
142
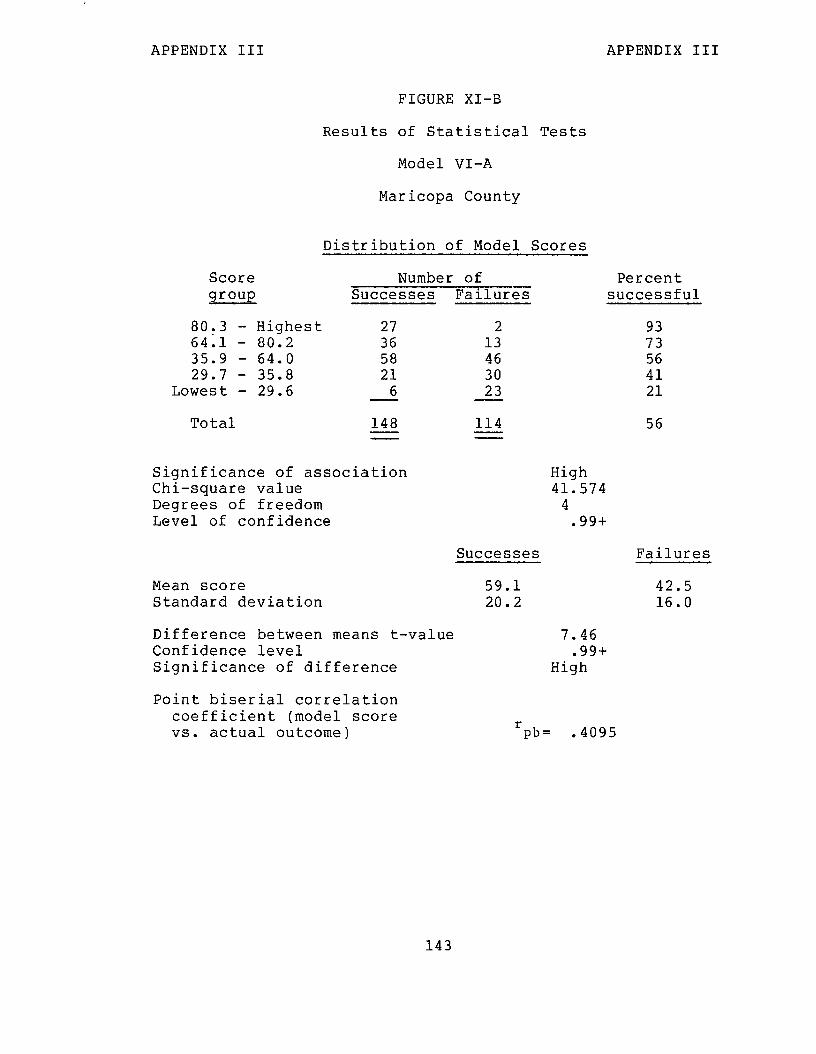
APPENDIX III APPENDIX III
FIGURE XI-B
Results of Statistical Tests
Model VI-A
Maricopa County
Distribution of Model Scores
Score group
Number of Successes Failures
80.3 - Highest 27 2 93 64;l - 80.2 36 13 73 35.9 - 64.0 58 46 56 29.7 - 35.8 21 30 41
Lowest - 29.6 6 23 21
Total 148 114
Significance of association Chi-square value Degrees of freedom Level of confidence
Mean score 59.1 42.5 Standard deviation 20.2 16.0
Point biserial correlation coefficient (model score vs. actual outcome)
High 41.574
4 .99+
Percent successful
56
Difference between means t-value Confidence level Significance of difference
Successes Failures
7.46 .99+
High
'Pb= .4095
143

APPENDIX III APPENDIX III
FIGURE XI-C
Results of Statistical Tests
Model VI-A
Philadelphia County
Distribution of Model Scores
Score Number of group Successes Failures
78.5 - Highest 22 3 70.1 - 78.4 30 la 41.3 - 70.0 37 50 26.7 - 41.2 11 33
Lowest - 26.6 1 24
Total 101 128
Percent successful
88 63 43 25
4
44
Significance of association Chi-square value Degrees of freedom Level of confidence
High 49.041
4 . 99+
Successes Failures
Mean score 66.2 Standard deviation 17.9
Difference between means t-value Confidence level Significance of difference
47.5 la.3
7.76 .99+
High
Point biserial correlation coefficient (model score vs. actual outcome) 'pb= .4578
144

APPENDIX III APPENDIX III
FIGURE XII
Model VIII-A
Case Name
Item A ---_--_-_--------- ------------------------------//
No prior convictions (adult or juvenile) = 2 One or two prior convictions = 1 Three or more prior convictions = 0
Item B ------------------------------------------------~/
No prior known incarcerations (adult or juvenile) = 2 One or two prior incarcerations = 1 Three or more prior incarcerations = 0
Item C ------------------------------------------------~/
Age at first commitment (adult or juvenile) 18 years or older = 1
Otherwise = 0 (note a)
Item D ------------------------------------------------~/
Subject offense did not involve auto theft = 1 Otherwise = 0
Item E ------------------------------------------------~/
Never had parole revoked or been committed for a new offense while on parole = 1
Otherwise = 0
Item F ------------------------------------------------/
No history of heroin, cocaine, or barbiturate dependence = 1
Otherwise = 0
Item G ------------------------------------------------/
Has completed 12th grade or received GED = 1 Otherwise = 0
Register Number
a/Based on adult history only if juvenile history unknown. -
145

APPENDIX III APPENDIX III
Item H ------------------------------------------------~/
Employed at time of arrest = 1 Otherwise = 0
Item I ------------------------------------------------~/
Probation plan to live with spouse and/or children = 1
Otherwise = 0 _
Total Score ,I -------------------------------~----~~~~~~~ L-J
146

APPENDIX III APPENDIX III
FIGURE XII-A
Results of Statistical Tests
Model VIII-A
Multnomah County
Distribution of Model Scores
Score Number of Percent group Successes Failures successful
10 - 11 36 6 6- 9 104 43
Lowest - 5 17 21 -
Total 157 Z
Significance of association Chi-square value Degrees of freedom Level of confidence
70 =
86 71 45
69
High 16.198
2 .99+
Successes Failures
Mean score 8.1 Standard deviation 1.8
Difference between means t-value Confidence level Significance of difference
6.6 2.4
4.58 .99+
High
Point biserial correlation coefficient (model score r vs. actual outcome) pb= .3240
147

APPENDIX III APPENDIX III
FIGURE XII-H
Results of Statistical Tests
Model VIII-A
Maricopa County
Distribution of Model Scores
Score group
Percent successful
10 - 11 33 1 97 6- 9 74 40 65 l- 5 11 33 25 -
Total
Significance of association Chi-square value Degrees of freedom Level of confidence
Mean score Standard deviation
Difference between means t-value Confidence level Significance of difference
Point biserial correlation coefficient (model score vs. actual outcome)
39
High 43.457
2 .99+
Successes Failures
8.0 5.8 2.0 2.3
6.69 .99+
High
r pb= .4478
148

APPENDIX III APPENDIX III
FIGURE XII-C
Results of Statistical Tests
Model VIII-A
Philadelphia County
Distribution of Model Scores
Score group
9 - 11 6- 8
Lowest - 5
Number of Successes Failures
37 11 34 46
7 40 - -
Percent successful
77 43 15
Total 78 97 45 - - - -
Significance of association Chi-square value Degrees of freedom Level of confidence
High 37.432
2 . 99+
Successes Failures
Mean score 8.0 6.1 Standard deviation 1.9 2.1
Difference between means t-value 6.33 Confidence level .99+ Significance of difference High
Point biserial correlation coefficient (model score vs. actual outcome) rPb= .4308
149

APPENDIX IV APPENDIX IV
CHARTS OF PROBATIONERS' CHARACTERISTICS THAT WE SAMPLED
1. Sex
2. As=
3. Race
4. Total prior convictions
5. Time on probation
6. Employment status at time of arrest
7. Crimes sentenced for
150

APPENDIX IV APPENDIX IV
SEX
I Closed Cases
MARICOPA COUNTY
1 90 -
80 -
70 -
60 -
5 z 50 -
% 40 -
30 -
20 -
10 -
O- MALE FEMALE
PHILADELPHIA COUNTY
90 -
80 -
70 -
5 60 -
g z 50-
40 -
Open Cases
MULTNOMAH COUNTY
100 1
90 -
80 -
70 -
5 60 -
i 50-
E 40 -
30 -
20 -
10 -
o- MALE FEMALE
KING COUNTY
Table is Limited to Open Cases Because Closed Files Were
MALE FEMALE MALE FEMALE
151

APPENDIX IV APPENDIX IV
50 5 e 40 a k!
30
20
1[
c
I -
I -
I- 20 or Less 21-30 31-40 Over 40 Unknown 20 or Less 21-30 31-40 Over40 Unknown
60
50
I-
5 40 a E
30
20
ia
0
AGE
18 or Under Closed Cases Open Cases
MARICOPA COUNTY MULTNOMAH COUNTY
AGE AGE
PHILADELPHIA COUNTY KING COUNTY
20 or Less 21-30 31-40 Over40 Unknown 20 or Less 21-30 31-40 Over 40 Unknown
AGE AGE
70
60
50
l- z
z 40 a
k!
30
20
10
0
60
50
!z ti 40
E
Table is Limited to Open Cases
Because Closed Files Were
Destroyed
30
20
10
0
152

APPENDIX IV APPENDIX IV
RACE
l-l Closed Cases
MARICOPA COUNTY
‘ii;
80 -
70 -
k ia Z
2 50 -
h 40 -
30 -
20 -
10 -
o- White Black Spanish- Other
American
PHILADELPHIA COUNTY
‘OOT 90
80
70 F
I- 6o 5
g 50
2 40
30
20
10
0 I white slack Spanish- Other White Black Spanish- Other
American American
lza Open Cases
MULTNOMAH COUNTY
looI 1 90 -
80 -
70 -
I- 6o z g 50-
L 40 -
30 -
20 -
IO -
O- White Black Spanish- Other
American
KING COUNTY 100 11
90
80
60
30
20
Table is Limited to Open Cases Because Closed Case Files had Been Destroyed
153
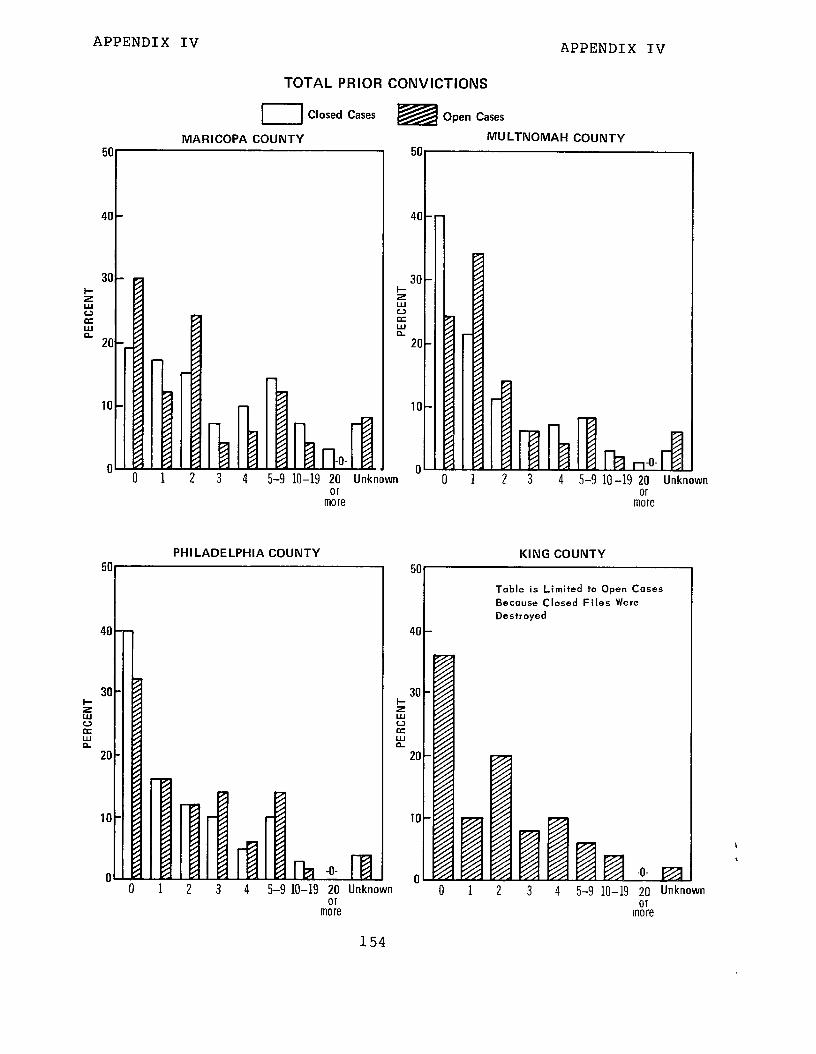
APPENDIX IV
TOTAL PRIOR CONVICTIONS
APPENDIX IV
n Ciosed Cases
MARICOPA COUNTY
50,
3OC
z ii! E
20
10
0 1 ,
40 -
30 - 2 iI!! a it!
zo-
lo-
O- 4 5-9 lo-19 20 Unknown
01 more
PHILADELPHIA COUNTY
Open Cases
MULTNOMAH COUNTY
I
KING COUNTY
or more
Table is Limited to Open Cases
Because Closed Files Were
Destroyed
40 t
3 4 5-9 IO-19 20 Unknown 0 1 2 3 4 5-9 lo-19 20 lMmwn 01
more m0o:e
154
30 5 E LT k
20
10
0

APPENDIX IV APPENDIX IV
50
5 40
E
E
30
20
10
TIME ON PROBATION (Closed Cases)
MARICOPA COUNTY
Average Time = 24.4 Months
38% 31%
18% 1 6% 1
12 Months or Less 13-24 25-36 37-48 49 or More MONTlk
MULTNOMAH COUNTY
Average Time = 25.7 Months
44%
33%
13% 4% I 1 1 6% 1
12 Months or Less 13-24 25-36 37-48 49 or More MONTHS
PHILADELPHIA COUNTY
Average Time = 26.8 Months 50 -
40 - !z E 30 - LT k 43%
20 - 37%
10 - 13%
1 6% i 1%
12 Months or Less 13-24 25-36 37-48 49 or More MONTHS
155

APPENDIX IV APPENDIX IV
EMPLOYMENT STATUS AT TIME OF ARREST
r-l Closed Cases Open Cases
MULTNOMAH COUNTY MARICOPA COUNTY
60-
50
40 5 ti 30 % 20 I 10
PHILADELPHIA COUNTY 60[
50
40
!z s 30 if! P
20
/ 10
60
50
40
!z i 30
ii 20
10
60
50
40
5 f 30 E
20
10
z z KING COUNTY
Table is Limited to Open Cases _ Because.Closed Files Were
Destroyed
156

APPENDIX IV APPENDIX IV
CRIMES SENTENCED FOR
I Closed Cases
lizzl Open Cases
MARICOPA COUNTY MU LTNOMAH COUNTY I 5
4’
; 3’
z Lu n 21
II
5C
40
5 30
s a 2
20
10
cl
KING COUNTY
1;;
PHILADELPHIA COUNTY
5oT
5 30
Lu u a
E 20
APPENDIX V APPENDIX V
UNITED STATES DEPARTMENT OF JUSTICE
WASHINGTON, D.C. 20530
Apr. 28, 1976
Mr. Victor L. Lowe Director General Government Division United States General Accounting Office Washington, D.C. 20548
Dear Mr. Lowe:
This letter is in response to your request for comments on the draft report entitled "State and County Probation: Systems in Crisis."
Generally, we agree with the report and share GAOls concern regarding the need to address the problems of improving State and county probation systems. Recognizing this need, the Administrator of LEAA appointed a Blue Ribbon Consultant Committee in June 1975 to assist in the develop- ment of an LEAA corrections strategy. The Committee recently submitted its final report, It contains a number of observe- tions similar to those included in the GAO report pertaining to various inadequacies present in State and county probation systems. As in the GAO report, the Blue Ribbon Consultant Committee concluded that probation was not effective in keep- ing a considerable number of offenders from committing furthey crimes.
While both the GAO and the Committee reports note the same or similar deficiencies and effects, there are some significant distinctions. In particular, the members of the Committee were much more dubious about the efficacy of rehabili- tation. Xevertheless, GAO and the Committee clearly recognize that neither restraint nor rehabilitation services are adequately and effectively provided today, if provided at all. The need to improve Federal leadership and provide sufficient funds to seriously impact on State and local probation services is a view commonly shared by both LEAA and GAO.
158

APPENDIX V APPENDIX V
To foster needed improvements in State and county pro- bation systems, GAO recommends that LEAA:
1.
2.
3.
4.
5.
6.
7.
8.
Work with the States to develop probation guidelines with minimum standards to assist State and local governments to improve their probation systems.
Require the State Planning Agencies (SPAS), as part of their analysis of problems faced by the criminal justice system, to address the problems of probation in their States and how these prob- lems are to be overcome.
Improve sentencing by developing a system to assist judges and probation officials to determine which offenders should be on pro- bation based on a probation expectancy model, or similar approach.
Improve service delivery by developing a model service delivery system.
Improve information systems, evaluation, and accountability of probation programs by working with the States.
Develop and maintain national corrections statistics.
Develop better ways to provide technical assistance to probation organizations which covers the type, depth, and cost of assistance to be offered,
Evaluate the priorities assigned to use of discretionary funds to provide assurance that moneys are available to assist States and counties to implement systems to (a) better predict an offender's chances of succeeding on probation, (b) improve diagnostic analysis and rehabilitation planning, and (c) better coordinate service delivery and supervision of probationers.
159

APPENDIX V APPENDIX V
With respect to the first recommendation, it must be recognized that LEAA has taken a number of significant steps to promote the development of probation guidelrines with minimum standards to assist State and local governments to improve their probation systems. Not only have LEAA guide- lines to SPAS called for the development and implementation of correctional standards, goals, and priorities, the I&AA Office of National Priority Programs has aggressively marketed the standards and goals concept to States and provided both discretionary funding and the technical assistance necessary for the development and implementa- tion of the standards. In addition to these continuing efforts LE;AA funded a report undertaken by the National Advisory Com- mission on Criminal Justice Standards and Goals. The Commis- sion's report, issued in six volumes, contains one volume entitled "Corrections," which includes standards for probation services. While LEAA can contribute to the improvement of probation systems through the issuance of guideline requirements and standards, it is the interest and aggressiveness of the States and local jurisdictions in meeting these standards that will determine the extent to which probation systems are upgraded. If local governments are not committed to improving probation systems, they simply will not "buy-in" to an LEAA program, particularly if strict standard-setting requirements are conditioned with the grant.
In reference to the second recommendation, LEAA has revised its Guideline Manual for State Planning Agency Grants so that States must specjfy in detail how they will meet the conditions required by Part E of the Crime Control Act relating to corrections. Also, LEAA regional offices have been instructed to enforce State and local governments receiving Federal funds to comply with the conditions stated in Part E of the Crime Control Act. This portion of the Act calls for implementation of advance correctional practices. Again, we must point out that the Crime Control Act, while imposing certain conditions for approval of grants which SPAS must meet, leaves selection and implementation of law enforcement programs in the hands of the States. LEAA interprets its role as being limited to increasing the capabilities of State and local governments by means of example, experiment, research, development, and funding incentives which encourage, but do not force, fund recipients to adopt Federally supported projects or project gpals. LEAA has and will continue to lend technical assist- ance and support to States to the greatest extent possible, but the primary role for improving probation operations continues to remain with the States and local governments.
160

APPENDIX V APPENDIX V
With respect to the third recommendation, the LEAA Blue Ribbon Consultant Committee recommended additional research before predictive tools, such as probation expect- ancy models, be considered reliable and valid. LEAA is giving further consideration to the role it can play in the development and demonstration of predictive tools, including the appropriate mechanism for providing funds for development and testing.
The recommendation that LEAA improve service delivery by developing a model service delivery system has considerable merit, and LEAA intends to devote further study to the appropriate mechanism for developing such a service delivery model.~ It would appear that a model delivery system, at the very least, would apprise probation officials of the types of services that, under ideal conditions, would con- tribute to a more effective probation program. This approach would hopefully encourage probation officials to seek out those services available at the local and State levels and, where needed services are not available, initiate actions to bring these services into being. As an additional benefit, a service delivery model would be a useful tool for SPAS to evaluate existing State and local systems, and would serve as a guide to LEAA regional offices in evaluating the adequacy of SPA planning grant applications and State comprehensive plans.
Regarding recommendations five and six, LEAA agrees that information systems, evaluation, accountability and statistical data are all necessary components for an effective probation system. Currently, LEAA is addressing the need to improve information systems and develop statistical data concerning probation programs through systems development grants administered by LEAA's National Criminal Justice Information and Statistics Service. In addition, LEAA is studying the feasibility of committing funds to develop a national probation reporting system. In the long run, LEAA believes that the development and continuation of such efforts should improve the quality of information and pro- vide additional knowledge on corrections and probation.
Regarding recommendation seven, LEAA recognizes the need to develop better ways to provide technical assistance to State and local units of government. In June 1974, LEAA undertook an analysis of LEAA and SPA technical assistance capability and found that both the LEAA and the SPAS were not adequately fulfilling their responsibility for providing technical assistance to State and local units of government. As a result of this analysis, the State planning guidelines for
161

APPENDIX V APPENDIX V
fiscal year 1976 were changed to require that the States develop a plan for the provision of technical assistance within their own States. It required that a needs assess- ment be conducted and an identification of resources within the State be developed so that such resources could be matched to identifiable needs. In support of this change in the guidelines, a policy instruction was issued which specified in detail the roles the regional offices and various headquarters offices must play in ensuring that technical assistance be delivered promptly and effectively.
Regarding the final recommendation, LEAA recognizes that probation services traditionally have received the smallest share of the correctional dollar at the State and local level. Similar to the recommendation of the GAO report, the Blue Ribbon Consultant Committee called upon LF,AA to commit a sizeable portion of its Part E discre- tionary grant funds for probation services. A decision establishing funding priorities to meet the needs of criminal justice systems is currently pending.
Several aspects of the report are of concern to organizational elements within the Department other than LEAA. Those aspects of principal concern involve (a) improving Federal, State and local probation activ- ities in concert, rather than focusing independently on State and local probation activities, (b) developing or explaining the base for presentation of statistical data, (c) meaning of the term "diagnosis," as it relates to the presentence report, and (d) using simplistic assumptions, particularly regarding probation supervision. In our opinion, the basic weaknesses we see in these areas tend to lessen the impact of the report. The following comments, which are referenced to the applicable pages, attempt to point out the basis for the criticisms.
The cover page of the report states that "Federal, State, and local governments must cooperate in developing better ways to improve probation systems." While we agree with this statement, the report deals only with State and local probation activities as indicated on pages 6 and 7 of Chapter 2. The report does not adequately point out that State and local probation systems are only elements of a much broader spectrum of probation activities. The report overlooks the fact that in addition to State, State/local or local probation systems, probation systems are operative within the Executive and Judicial Branches of the Government, as well as in combinations between the two.
GAO note: Page numbers refer to draft report.
162

APPENDIX V APPENDIX V
The report also overlooks the fact that there may be com- bination adult and juvenile systems. Viewing probation activities in this broader framework, it is important to recognize that the development of overall standards, goals and guidelines must be in concert with probation systems at all levels, not only the State and county levels. Con- sequently, the development of these standards, goals and guidelines is a formidable task.
Our use of the statistical presentations in the report indicated some differences that we were unable to reconcile, For example, the table on page 21 shows that 22 percent of the probationers in Kings County had their probation revoked, whereas a table on page 15 indicates 26 percent. Similar differences are noted among the other three counties. Likewise, it appears from the table on page 21 that 14 percent of the probationers in Kings County were convicted of new crimes and failed probation; but a table on page 17 indicates that the recidivism factor for those convicted of new crimes was 26 percent. Percentage differences were also noted on pages 18 and 21 relating to offenders who successfully completed Probation and were not convicted of a serious crime. If the differences in the above percentages arise from the use of different baseline figures, the report should so indicate. [See GAO note below.]
A statement is made on page 25 that "37 percent of the pffenders on probation were convicted of new crimes. More zmportantly, society was not adequately protected because all of the offenders remained on probation." This statement Gears to be a judgmental evaluation implying that all persons on probation convicted of new crimes without regard to type or seriousness of the crime, should have had their probation revoked in order to adequately protect society. An entirely different viewpoint was taken in determining recidivism. The report states on page 16 that in determining recidivism some convictions should be discounted because they "may include less serious crimes such as traffic offenses." We believe the latter statement is of equal significance in determining whether an offender should remain on probation.
Page 33 provides an analysis of the adequacy of recommendations contained in 593 presentence reports relating to sentence recommendations, risk classifications, types of supervision recommended and likeliness to succeed on proba- tion. The criteria used as the basis for evaluating the
GAO note: $ie state on page 13 that the second set of percentages is based on data that includes estimated absconder rates.
163

APPENDIX V APPENDIX V
adequacy of the information would be beneficial to LEAA and the States as a basis for performing similar evaluations and developing guidelines with minimum standards for prepara- tion of presentence investigations. Accordingly, we would like to have this criteria made available to the LEAA staff.
Page 34 begins a discussion on "diagnosis," followed by a section on "existing diagnostic services." It appears that the basic concept of the word "diagnosis" as it relates to the probation field has been misunderstood--the mental health model has been used. This conclusion is reached based on the description of the "existing diagnostic facilities" in the four probation units studied by GAO and by a conclud- ing statement made by GAO on pages 39-40. The statement reads, "Only about 15 percent of the offenders received expert professional evaluation to aid the courts in making critical sentencing decisions. If each offender would be given relatively simple diagnostic tests prior to sentencing, and follow up comprehensive tests by psychiatrists and psychologists when deemed necessary, we believe better infor- mation would be available to judges which could improve sentencing decisions." Individuals directly associated with probation activities are aware that the word "diagnosis" as used in many correctional publications does not imply the utilization of psychiatrists and psychologists. The word "diagnosis" simply means that the probation officer preparing the report will be expected to make an analysis of what he believes to be the causal factors. In our opinion, the manner in which the term "diagnosis" has been used with respect to the presentence report weakens the significance of the chapter.
Chapter 6 has a very basic weakness in that the report recognizes, but treats very lightly the issue concerning the need to secure information from probationers as to what they define as their needs and priorities. In our opinion, this is one of the more significant approaches to determining a probationer's needs and developing an effective individualized rehabilitation plan. However, the subject is covered in four sentences and then abandoned. The report suggests that the records be used to determine which services should be provided. Essentially, this means probation officers define the problems and the services to be given based on records.
164

APPENDIX V APPENDIX V
Besearch in the field of probation and parole indicates that (a) probation staffs are usually unable to describe or define adequately the problems and services needed, and (b) there is a considerable disagreement about the problems and services required when both staff and probationers are asked to list them.
A further weakness in this chapter is an assumption that by providing some "key facts about probationers," their major needs can then be interpreted. In our opinion, the key facts reported in the table on page 42a are not suffisient to identify service needs that will enhance probation success. The key facts diagrammed in the report relate to marital status, education attained, employment background, crimes committed, and prior convic- tions. Another diagram in the same table lists the treat- ment needs, e.g., vocational, academic, drug, counseling, mental, medical, alcohol, etc. In our opinion, the key facts shown in the table are not sufficient to determine a particular probationer's service needs.
To further emphasize the importance of providing services to probationers, the report attempts to establish a statistical relationship between services provided and probation success. Based on the statistical tests, a state- ment is made on page 45 that "in certain circumstances, rehabilitative services can help in reducing offenders' propensity to commit additional crimes." We consider the relationships to be overstated. We doubt whether many researchers in the probation field would be willing to make a similar statement based on the same data utilized in this report.
Page 50 concerns the subject of compliance with court- ordered sentence conditions. We agree that when conditions of probation are not enforced, offenders do not take any of them very seriously. However, it is difficult to interest judges in taking seriously the enforcement of some conditions, such as "securing and keeping employment." In fact, employ- ment is one of the conditions of probation cited as having low compliance. In this regard, page 57 points out the pro- blems probationers have in securing employment and indicates that the unemployment rate for offenders is significantly higher than the unemployment rate for the area. ijnder these circum- stances, the probationer's failure to fulfill court-ordered
165

APPENDIX V APPENDIX V
employment conditions must be carefully evaluated in terms of his attempts to seek employment. In general, we have no problem with the development of a monitoring system to determine a probationer's compliance with his conditions of sentence and preparation of violation reports when required. We are concerned, however, as to whether we can expect the court to be concerned and react to noncompliance with such probation conditions as securing and keeping employment, being counseled, obtaining academic training, etc. Without a reaction from the courts, little will be accomplished despite the efforts put forth.
Page 64 lists excessive caseloads as one of the reasons services are not being adequately delivered and states that "the President's Commission on Law Enforcement and Administra- tion of Justice recommended that probation and parole caseloads should average about 35 cases per probation officer." A casual reader is likely to assume that lower caseloads mean better protection to the public or better service to the probationers; neither assumption is valid.
The discussion on page 68 concerning the need for closer supervision of probationers implies that there is a relation- ship between the amount of time the staff spends with proba- tioners and their successful rehabilitation. While it is not our intent to disparage the time studies done in Washington and Oregon, we do question the assumption that increasing the time spent by staff members with probationers will change the outcome of a probation case.
A rather simplistic assumption is made on page 68 that services needed by probationers are available in the community, agencies will willingly provide these services, and staff members need only make referrals and probationers will get the services. This is not the experience of most probation agencies. Obtaining such services is a much more time-consuming aspect of the supervisor's work than the report leads one to believe. In fact, this problem has become so critical that probation agencies are now seeking to train their staffs in the techniques of negotiating with service agencies to secure their commitment to provide services when referrals are made. This is another subject needing coverage in the report.
We agree with the point made on pages 79 and 80 that a greater variety and number of sentencing alternatives are needed for use by the courts and probation agencies.
166

APPENDIX V APPENDIX V
With respect to community resource agencies, we are not in full accord with the statement on page 81 that "Problems concerning the degree to which community resource agencies can be made more responsive to probationers' needs are beyond the scope of what probation systems can directly affect." We believe probation agencies can strongly influence the services community resource agencies provide. Xuch more needs to be done by probation agencies to focus the attention of the community on the need for certain services, negotiate to have these services performed, and establish a referral system that encourages participation by community resource agencies. Realistically, if one accepts the premise of the reintegration model, the probation agencies are committed to the task of attempting to secure some modifications in the acceptance of the probationers by the community.
Chapter 8 is one of the more pertinent sections of the report. This chapter makes an excellent case for using probation prediction models as decision-making tools to improve probation success and more effectively allocate resources. This mode! is based on characteristics having predictive power to compute success or failure on probation. Similarly, the "diagnostic information" required on the pre- sentence report is geared to determining service needs that will enhance probation success. While both are con- cerned with probation success, the key characteristics designed for use in the probation model are much more pertinent than those designed for the presentence report-- a point which we made earlier. The probation models designed in this chapter use about six to eight pertinent items such as prior arrests, age at time of arrest, work record, and residence stability. In contrast to the "key facts" established for presentence reports, these models do not contain any information on marital status, social history, family relationships and other factors.
We appreciate the opportunity given us to cotlment on the draft report. Should you have any further questions, please feel free to contact us.
Sincerely,
tant Attorne for Administra
167

APPENDIX VI APPENDIX VI
PRINCIPAL OFFICIALS OF THE DEPARTMENT OF JUSTICE -- -- --
RESPONSIBLE FOR ADMINISTERING ACTIVITIES -- -
DISCUSSED IN THIS REPORT -
Tenure of office -- ---- From To -- -
ATTORNEY GENERAL: Edward H. Levi William B. Saxbe Robert H. Bork (acting) Elliot L. Richardson Richard G. Kleindienst Richard G. Kleindienst
(acting) John N. Mitchell
Feb. 1975 Present Jan. 1974 Feb. 1975 Oct. 1973 Jan. 1974 May 1973 Oct. 1973 June 1972 May 1973
Mar. 1972 June 1972 Jan. 1969 Feb. 1972
ADMINISTRATOR, LAW ENFORCEMENT ASSISTANCE ADMINISTRATION:
Richard W. Velde Donald E. Santarelli Jerris Leonard Vacant Charles H. Rogovin
Sept. 1974 Present Apr. 1973 Aug. 1974 May 1971 Mar. 1973 June 1970 May 1971 Mar. 1969 June 1970
168
Copies of GAO reports are available to the general public at a cost of $1.00 a copy. There 15 no charge for reports Purnlshed to Members of Congress and congressional commlttee staff members. Offlclals of Federal, State, and local governments may receive up to 10 copies free of charge. Members of the press; college Ilbrarles. faculty members, and students, non-profat organlzatlons; and representa- tlves of foreign governments may receive up to 2 copies free of charge. Requests for larger quantltles should be accompanied by payment.
Requesters entltled to report5 wlthout charge ihould address their requests to:
U.S. General Accounting Offtce Dlstrlbutlon Sectlon. Room 4522 441 G Street . NW. Washington, D.C. 20548 .
Requesters who are required to pay for reports should send their requests with checks or money orders to:
U.S. General Accounting Offlce Dlstrlbutlon Sectton P.O. Box 1020 WashIngton. D.C. 20013
Checks or money orders should be made payable to the U.S. General Accounting OffIce. Stamps or Superintendent of Documents coupons will not be accepted. Please do not send cash.
To expedite fllllng your order, U~P the report number In the lower left corner and the ddte In the lower right corner of the front cover.

AN EQUAL OPPORTUNITY EMPLOYER
UNITED STATES GENERAL ACCOUNTING OFFICE
WASHINGTON, D.C, 20548
OFFICIAL BUSINESS
PENALTY FOR PRIVATE USE,$300
POSTAGE AND FEES PAID
U. S. GENERAL ACCOUNTING OFFICE
SPECIAL FOURTH CLASS RATE BOOK
Q