ghani automobile industries limited annual report 2013.pdf · 2.2 critical accounting estimates and...
TRANSCRIPT
Ghani Automobile Industries Limited
The Power of Perfection

1Ghani Automobile Industries Limited
CONTENTS
Corporate Information
Vision and Mission
Directors’ Report
Six Years at Glance
Statement of Compliance
Auditors’ Review on Compliance Report
Auditors’ Report
Balance Sheet
Profit and Loss Account
Statement of Comprehensive Income
Cash Flow Statement
Statement of Changes in Equity
Notes to the Financial Statements
Notice of Annual General Meeting
Pattern of Shareholding
Form of Proxy
2
3
4
7
8
11
12
13
14
15
16
17
18
28
34

Corporate Information
BOARD OF DIRECTORS
AUDIT COMMITTEE
COMPANY SECRETARY
CHIEF FINANCIAL OFFICER
AUDITORS
LEGAL ADVISORS
SHARE REGISTRAR
BANKERS
HEAD OFFICE ®ISTERED OFFICE
Imtiaz Ahmad Khan Chairman
Aftab Ahmad Khan Chief Executive Officer
Anwaar Ahmad Khan
Reema Anwaar
Ayesha Aftab
Junaid Ghani
Obaid Ghani
Jubair Ghani
Chairman
Member
Member
Chairman
Member
Member
Hafiz Mohammad Imran Sabir
Umer Farooq Khan
Hassan Farooq & Company
Chartered Accountants
Ally Law Associates
Ch. Muhammad Siddique
Corplink (Pvt) Ltd.
Wings Arcade, 1-K Commercial Model Town Lahore, Pakistan
Phones : (042) 35916714, 35916719 Fax : (042) 35869037
Albaraka Islamic Bank
Allied Bank of Pakistan Limited
Habib Bank Limited
Meezan Bank Limited, Islamic Banking
Soneri Bank Limited, Islamic Banking
Burj Bank Limited
Habib Metropolitan Bank Limited
Bank Alfalah Limited
40-L Model Town Lahore, Pakistan
UAN : (042) 111 949 949
Fax : (042) 3517 2263
E-mail :[email protected]
http://www.ghaniautomobiles.com
MARKETING OFFICE
AUTOMOBILE PLANT
12 D/3, Chandni Chowk KDA Scheme No. 7-8 Karachi - 74000
UAN : (021) 111 949 949, Fax : (021) 3492 6349
E-mail : [email protected]
49-KM, Multan Road, (from Lahore)
HR & R COMMITTEE Anwaar Ahmad Khan
Ayesha Aftab
Obaid Ghani
Dr. Amjad Aqeel
Ayesha Aftab
Jubair Ghani
Zahra Aftab
Dr. Amjad Aqeel
2Ghani Automobile Industries Limited

Mission Statement
To be successful by
effectively & efficiently
Utilizing our Philosophies,
so that We achieve & Maintain
constantly the High Standards of
Product Quality
&
Customer Satisfaction
Vision & Philosophy
Nothing in this earth or in the heavens
Is hidden from ALLAH
To indulge in honesty, integrity and self determination,
to encourage in performance and
most of all to put our trust in ALLAH,
so that we may, eventually through our efforts and belief,
become the leader amongst automobile products
manufacturers
3Ghani Automobile Industries Limited

4Ghani Automobile Industries Limited

5Ghani Automobile Industries Limited

6Ghani Automobile Industries Limited

2013 2012 2011 2010 2009 2008
Production (Nos.) 6,162 11,360 14,062 12,452 7,028 8,315
Sales 173,262 367,740 429,162 381,699 230,005 245,142
Gross profit / (loss) 562 (19,117) 30,274 28,813 365 33,879
Net profit / (loss) (10,574) (41,314) 3,092 23,833 (42,164) 1,135
Earning per share (0.53) (2.07) 0.15 1.19 (2.11) 0.06
Current assets 363,639 386,221 434,212 363,800 286,847 327,938
Current liabilities 365,676 380,506 390,032 313,615 243,419 239,441
Share holders equity 62,606 73,180 114,495 111,403 87,570 129,734
Six Years at Glance
(Rupees in thousands)
7Ghani Automobile Industries Limited

8Ghani Automobile Industries Limited

9Ghani Automobile Industries Limited
10Ghani Automobile Industries Limited
11Ghani Automobile Industries Limited

12Ghani Automobile Industries Limited

Ju
ne
30,
2013
Ju
ne
30
,2
01
2Ju
ne
30,
2013
Ju
ne
30
,2
01
2
NO
TE
Ru
pe
es
Ru
pees
NO
TE
Ru
pe
es
Ru
pees
EQ
UIT
Y&
LIA
BIL
ITIE
SA
SS
ET
S
SH
AR
EC
AP
ITA
LA
ND
RE
SE
RV
ES
NO
NC
UR
RE
NT
AS
SE
TS
Au
tho
rized
Sh
are
Cap
ital
20
,00
0,0
00
(20
12
:2
0,0
00
,00
0)
ord
inary
PR
OP
ER
TY,
PL
AN
TA
ND
EQ
UIP
ME
NT
10
40,8
76,5
47
43
,69
8,8
18
sh
are
so
fR
s.1
0each
200,0
00,0
00
20
0,0
00
,00
0
Issu
ed
,su
bscri
bed
an
dp
aid
up
cap
ital
4200,0
00,0
00
20
0,0
00
,00
0S
EC
UR
ITY
DE
PO
SIT
S667,3
86
66
7,3
86
Accu
mu
late
dlo
sses
(137,3
93,8
65)
(12
6,8
19
,78
4)
62,6
06,1
35
73
,18
0,2
16
DE
FE
RR
ED
TA
XA
SS
ET
11
23,0
98,8
48
23
,09
8,8
48
NO
NC
UR
RE
NT
LIA
BIL
ITIE
S
Lo
ng
Term
Dim
inis
hin
gM
ush
ara
ka
Fin
an
cin
g5
--
CU
RR
EN
TL
IAB
ILIT
IES
CU
RR
EN
TA
SS
ET
S
Cu
rren
tp
ort
ion
oflo
ng
term
Mu
sh
ara
ka
-3
,90
0,0
00
Sto
res,sp
are
san
dlo
ose
too
ls813,6
30
60
4,5
60
Sh
ort
term
Ban
kF
inan
cin
g6
91,7
45,6
45
97
,10
8,6
99
Sto
ck
intr
ad
e12
104,5
42,0
71
10
2,9
95
,65
2
Lo
an
fro
msp
on
so
rs7
168,1
05,0
00
80
,60
5,0
00
Tra
de
deb
tors
-u
nsecu
red
bu
tco
nsid
ere
dg
oo
d191,3
49,5
91
19
6,2
40
,94
5
Cre
dito
rs,accru
ed
an
do
ther
liab
ilities
8104,9
59,1
23
19
8,8
92
,48
6A
dvan
ces
an
do
ther
receiv
ab
les
13
62,1
31,8
23
61
,34
9,2
22
Pro
vis
ion
for
Taxa
tio
n866,3
09
-C
ash
an
db
an
kb
ala
nce
s14
4,8
02,3
16
25
,03
0,9
70
365,6
76,0
77
38
0,5
06
,18
5363,6
39,4
31
38
6,2
21
,34
9
CO
NT
ING
EN
CIE
SA
ND
CO
MM
ITM
EN
TS
9-
-
428,2
82,2
12
45
3,6
86
,40
1428,2
82,2
12
45
3,6
86
,40
1
Th
ean
nexe
dn
ote
s1
to3
2fo
rman
inte
gra
lp
art
ofth
ese
fin
an
cia
lsta
tem
en
ts.
__________________
DIR
EC
TO
R
Bala
nce
Sh
eet
AS
AT
JU
NE
30,2013
CH
IEF
EX
EC
UT
IVE
OF
FIC
ER
______________________
13Ghani Automobile Industries Limited
June 30, 2013 June 30, 2012
NOTE Rupees Rupees
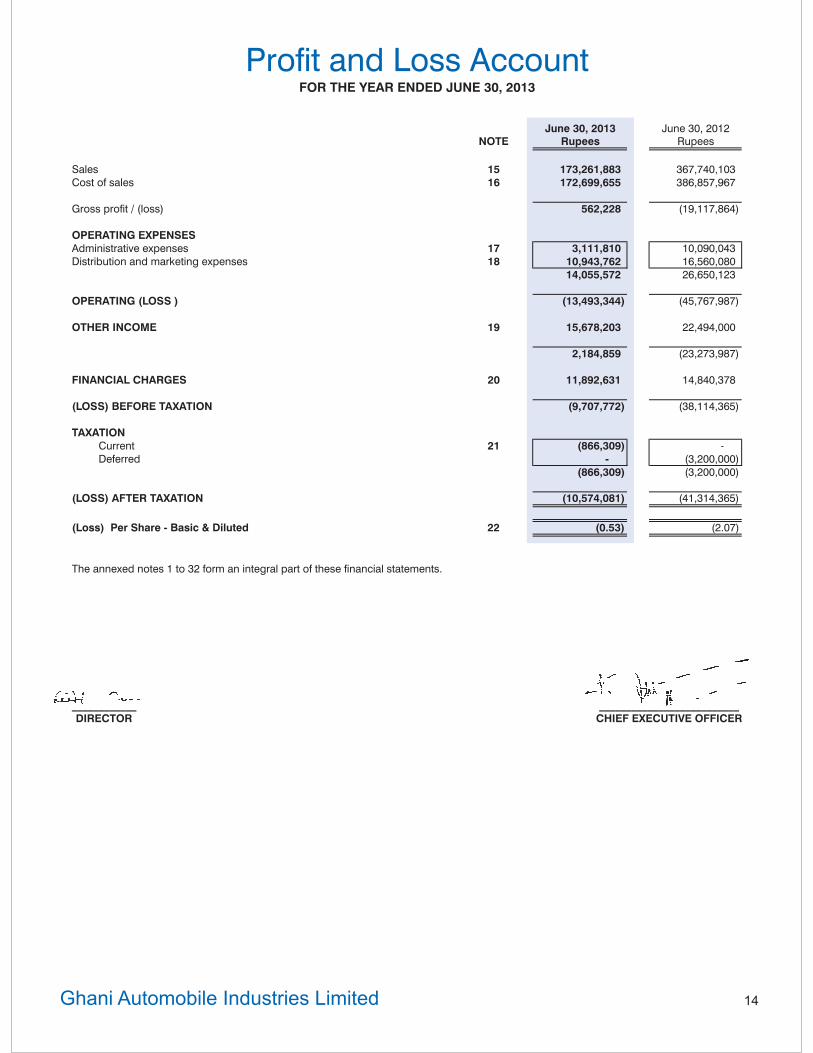
Sales 15 173,261,883 367,740,103
Cost of sales 16 172,699,655 386,857,967
Gross (loss)profit / 562,228 (19,117,864)
OPERATING EXPENSES
Administrative expenses 17 3,111,810 10,090,043
Distribution and marketing expenses 18 10,943,762 16,560,080
14,055,572 26,650,123
OPERATING (LOSS ) (13,493,344) (45,767,987)
OTHER INCOME 19 15,678,203 22,494,000
2,184,859 (23,273,987)
FINANCIAL CHARGES 20 11,892,631 14,840,378
(LOSS) BEFORE TAXATION (9,707,772) (38,114,365)
TAXATION
Current 21 (866,309) -
Deferred - (3,200,000)
(866,309) (3,200,000)
(LOSS) AFTER TAXATION (10,574,081) (41,314,365)
(Loss) Per Share - Basic & Diluted 22 (0.53) (2.07)
The annexed notes 1 to 32 form an integral part of these financial statements.
____________
DIRECTOR
__________________________
CHIEF EXECUTIVE OFFICER
Profit and Loss AccountFOR THE YEAR ENDED JUNE 30, 2013
14Ghani Automobile Industries Limited

____________
DIRECTOR
__________________________
CHIEF EXECUTIVE OFFICER
June 30, 2013 June 30, 2012
Rupees Rupees
(LOSS) AFTER TAXATION (10,574,081) (41,314,365)
-Other Comprehensive Income -
TOTAL COMPREHENSIVE (LOSS) (10,574,081) (41,314,365)
The annexed notes 1 to 32 form an integral part of these financial statements.
Statement of Comprehensive IncomeFOR THE YEAR ENDED JUNE 30, 2013
15Ghani Automobile Industries Limited
June 30, 2013 June 30, 2012NOTE Rupees Rupees
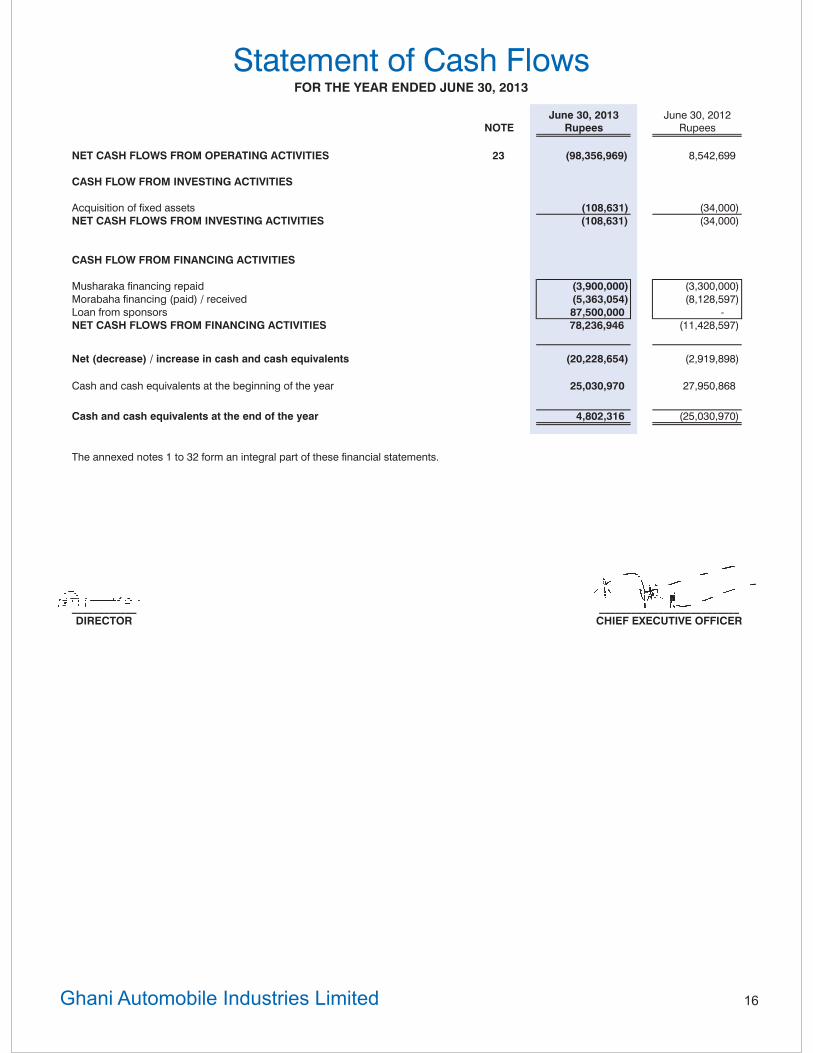
NET CASH FLOWS FROM OPERATING ACTIVITIES 23 (98,356,969) 8,542,699
CASH FLOW FROM INVESTING ACTIVITIES
Acquisition of fixed assets (108,631) (34,000)
NET CASH FLOWS FROM INVESTING ACTIVITIES (108,631) (34,000)
CASH FLOW FROM FINANCING ACTIVITIES
Musharaka financing repaid (3,900,000) (3,300,000)
Morabaha financing (paid) / received (5,363,054) (8,128,597)
Loan from sponsors 87,500,000 -
NET CASH FLOWS FROM FINANCING ACTIVITIES 78,236,946 (11,428,597)
Net (decrease) / increase in cash and cash equivalents (20,228,654) (2,919,898)
Cash and cash equivalents at the beginning of the year 25,030,970 27,950,868
Cash and cash equivalents at the end of the year 4,802,316 (25,030,970)
The annexed notes 1 to 32 form an integral part of these financial statements.
Statement of Cash FlowsFOR THE YEAR ENDED JUNE 30, 2013
____________
DIRECTOR
__________________________
CHIEF EXECUTIVE OFFICER
16Ghani Automobile Industries Limited

Share Capital Accumulated Total
Capital LossRupees Rupees Rupees
Balance as on June 30, 2011 200,000,000 (85,505,419) 114,494,581
Loss for the year - (41,314,365) (41,314,365)
Balance as on June 30, 2012 200,000,000 (126,819,784) 73,180,216
Loss for the year - (10,574,081) (10,574,081)
Balance as on June 30, 2013 200,000,000 (137,393,865) 62,606,135
The annexed notes 1 to 32 form an integral part of these financial statements.
Statement of Changes in EquityFOR THE YEAR ENDED JUNE 30, 2013
____________
DIRECTOR
__________________________
CHIEF EXECUTIVE OFFICER
17Ghani Automobile Industries Limited
3.4 Capital Work in Progress
3.5 Stores, Spares and Loose Tools
All cost/expenditure connected with specific assets, incurred during the acquisition \erection period are carried under this head. These are
transferred to property, plant and equipment as and when assets are available for use.
These are valued at lower of cost and net realizable value. Cost is determined at moving average, except items in transit, which are valued at
cost accumulated up to the balance sheet date. Provision is made against obsolete items.
1
2 BASIS OF PREPARATION
2.1 Basis of Measurement
These financial statements have been prepared under the historical cost convention.
2.2 Critical Accounting Estimates and Judgments
- Useful lives of property, plant and equipment
- Taxation
2.3 Statement of Compliance
2.4 Functional and Presentation Currency:
3 SUMMARY OF SIGNIFICANT ACCOUNTING POLICIES
3.1 Basis of Accounting
These financial statements have been prepared under the accrual basis of Accounting.
3.2 Property, Plant and Equipment
3.3 Impairment of Assets
An impairment loss is reversed if there has been a change in estimates used to determine the recoverable amount but limited to the extent of
carrying value that should have been had the impairment loss not been recognized.
The management assesses at each balance sheet date whether there is any indication that an asset is impaired, If any such indication exists,
the management estimates the recoverable amount of the asset. Impairment loss is recognized for the amount by which the carrying value of
asset exceeds the recoverable amount. Impairment loss is charged to profit and loss account in the period it is recognized.
The estimates and underlying assumptions are reviewed on an on-going basis. Revisions to accounting estimates are recognized in the
period in which the estimates are revised if the revision affects only that period, or in the period of the revision and future periods if the
revision affects both current and future periods.
The company reviews the rate of depreciation, useful life, residual value and value of assets for possible impairment on an annual basis. Any
change in the estimates in future year might affect the carrying amount of the respective items of property, plant and equipment with a
corresponding affect on the depreciation charge and impairment.
These financial statements have been prepared in accordance with the approved accounting standards as applicable in Pakistan. Approved
accounting standards comprise of such International Financial Reporting Standards (IFRS) issued by the International Accounting Standards
Board as are notified under the Companies Ordinance, 1984, provisions of and directives issued under the Companies Ordinance, 1984. In
case requirements differ, the provisions of and directives of the Companies Ordinance, 1984 shall prevail.
Property, plant and equipment except free hold land are stated at cost less accumulated depreciation. Depreciation is charged on reducing
balance method over the useful life of the assets at the rates mentioned in Note 10. Full month’s depreciation is charged in the month of
addition while no depreciation is charged in the month of disposal. Maintenance and normal repairs are charged to income as and when
incurred. Major renewal and replacements are capitalized. Gain or loss on disposal of fixed assets is recognized in income statement.
Judgments made by the management in the application of approved accounting standards, as applicable in Pakistan, that have significant
effect on the financial statements and estimates with a significant risk of material adjustment in the next year are as follows:
Notes to the Financial StatementsFOR THE YEAR ENDED JUNE 30, 2013
COMPANY AND ITS OPERATIONS
The company is a public listed company incorporated in Pakistan under the Companies Ordinance, 1984 in September 1987. The registered
office of the company is situated at 50-L Model Town, Lahore. The shares of the company are quoted on all Stock Exchanges in Pakistan.
The name of the company has been changed from Ghani Textile Limited to Ghani Automobile Industries Limited with effect from March 31,
2004. The Company is principally engaged in manufacture, assemble and trade of Automotive Vehicles of all kinds and sorts. Before 2004, the
Company business was manufacture and trade of grey cloth.
The preparation of financial statements in conformity with approved accounting standards, as applicable in Pakistan, requires management
to make judgments, estimates and assumptions that affect the application of policies and the reported amounts of assets, liabilities, income
and expenses.
The estimates and associated assumptions are based on historical experience and various other factors that are believed to be reasonable
under the circumstances, the results of which form the basis of making the judgments about the carrying values of assets and liabilities that
are not readily apparent from other sources. Actual results may differ from these estimates.
These financial statements are presented in Pakistan Rupees which is the functional currency of the company and figures are rounded off to
the nearest thousand of rupees unless otherwise specified.
18Ghani Automobile Industries Limited

3.6 Stock in Trade
3.7 Trade Debts
3.8 Revenue Recognition
3.9 Related Party Transactions
3.10 Employee Benefits
3.10.1 Defined Contribution Plan
3.11 Taxation
3.11.1 Current
3.11.2 Deferred
3.12 Foreign Currencies
Deferred tax is calculated at the rates that are expected to apply to the period when the differences reverse based on tax rates that have been
enacted or substantively enacted by the balance sheet date. Deferred tax is charged or credited in the income statement.
Revenue from sales is recognized on dispatch of goods to customers and dealers when the risk and rewards of ownership are transferred to them.
Stock of raw materials, work-in-process and finished goods, except for those in transit are valued principally at the lower of weights average
cost and net realizable value. Cost of work-in-process and finished goods comprises cost of direct materials, labour and appropriate
manufacturing overheads.
Net realizable value signifies the estimated selling price in the ordinary course of business less costs necessary to be incurred in order to
make a sale. Provision is made in the financial statements for obsolete and slow moving stock in trade based on management's estimate.
Deferred tax liability is generally recognized for all taxable temporary differences and the deferred tax assets are recognized to the extent that
it is probable that taxable profits will be available against which the deductible temporary differences, unused tax losses can be utilized.
All transactions between the Company and a related party in respect of purchases of materials are at Comparable Uncontrolled Price method.
Deferred tax is accounted for using the balance sheet liability method in respect of all temporary differences arising from differences between
the carrying amount of assets and liabilities in the financial statements and the corresponding tax bases used in computation of the taxable
profit.
Provision for current taxation is provided on taxable income at the current rates of taxation after taking into account tax credit and rebates
available, if any.
The Company operates a provident fund scheme for its permanent employees. Equal monthly contributions are made by the Company andits employees. Obligation for contributions to the fund are recognized as an expense in the profit and loss account when they are due.
Known bad debts are written off and provision is made for debts considered doubtful.
Transactions in foreign currencies are accounted for in Pak Rupees at the rates of exchange ruling at the date of transactions. Assets andliabilities in foreign currencies except for foreign currency balance covered by forward exchange risk cover are translated into Pak Rupee atthe exchange rates prevailing at the balance sheet date. Foreign currency balance covered by forward exchange risk cover is converted atContracted rates. Any exchange gain/ loss is charged to current year's income.
Defined contribution plan is a post employment benefit plan for the Company Employees
3.13 Financial Instruments
3.14 Borrowing Cost
3.15 Off Setting
3.16 Cash and Cash Equivalents
Cash and cash equivalents are comprised of cash and bank balances.
3.17 Provisions
3.18 Trade and other payables
3.19 Earnings Per Share
3.20
All other financial assets and liabilities are recognized at cost which is the fair value of the consideration received or given at the time when
the company becomes a party to the contractual provisions of the instrument by following trade date accounting. Any gain or loss on
subsequent measurement and derecognition is charged to income.
Profit and other charges on financing are capitalized up to the date of commissioning of the respective property, plant and equipment,
acquired out of the proceeds of such borrowings. All other mark-up, interest and other charges are charged to profit.
Provisions are recognized in the balance sheet when the company has a legal or constructive obligation as a result of past event, and it is
probable that outflow of economic benefits will be required to settle the obligation. However, provisions are reviewed at each balance sheet
date and adjusted to reflect current best estimate.
Financial assets and financial liabilities are set off and the net amount is reported in the financial statements when there is a legally
enforceable right to set off and the Company intends either to settle on a net basis, or to realize the assets and to settle the liabilities
Dividend and appropriation to reserves are recognized in the financial statements in the period in which these are approved.
Dividend and appropriation to reserves
Liabilities for trade and other payables are carried at cost, which is the fair value of consideration to be paid in future for goods and services
received, whether or not billed to the Company.
The Company presents earnings per share (EPS) data for its ordinary shares. EPS is calculated by dividing the profit attributable to ordinary
shareholders of the Company by the weighted average number of ordinary shares outstanding during the period.
simultaneously.
19Ghani Automobile Industries Limited

20Ghani Automobile Industries Limited
6 SHORT TERM BANK FINANCING
Morabaha from Soneri Bank Limited 5.1 81,763,400 84,745,200
Morabaha from Habib Metropolitan Bank Limited 5.2 9,982,245 9,949,684
Morabaha from Burj Bank Limited 5.3 - 2,413,815
91,745,645 97,108,699
6.1
6.2
6.3
7 LOAN FROM SPONSORS
This represents an unsecured, interest free loan obtained from directors of the Company.
8 CREDITORS, ACCRUED AND OTHER LIABILITIES
Creditors:
Trade 79,205,534 74,090,711
Import - 20,206,212
Others 15,426,665 25,217,051
94,632,199 119,513,974
Advances from customers 389,036 62,967,544
Accrued expenses and other liabilities 5,476,858 9,969,060
Income tax deducted at source 3,851,284 4,333,396
Un-claimed Dividend 609,746 609,746
Sales Tax Payable - 1,498,766
104,959,123 198,892,4869 CONTINGENCIES AND COMMITMENTS
CONTINGENCIES
9.1
9.2
9.3
COMMITMENTS
9.4
Morabaha facility availed from Habib Metropolitan Bank Limited with maximum limit of Rupees 10.000 million at the profit rate of 6 months
KIBOR plus 2.00% (2012 : six months KIBOR plus 2.00%). The liability is secured by legal mortgage of Rs. 0.5 million and Equitable
mortgage on land and building measuring 20 kanal 18 marlas valuing Rupees 33.613 million and FSV is Rupees 28.571 million. Charge
registered with SECP for Rupees 25.0 million on same assets, Lien/Pledge of 280,000 shares of M/s. Ghani Glass Limited in the name of the
directors at 40.00% margin of market value. Charge on current assets of the Company registered with SECP of Rupees 20 Million.
Morabaha facility availed from Burj Bank Limited (formerly Dawood Islamic Bank Limited), carries a maximum limit of Rs 50.000 Million at
profit rate of Deposit Rate plus 1% (2012 : Deposit Rate plus 1% ). The facility is secured by 110% Cash Deposit in Burj Bank Limited savings
account of Mr. Anwaar Ahmed Khan and Mr. Aftab Ahmed Khan under a perfect lien of Burj Bank Limited.
Morabaha / Salam Facility availed from Soneri Bank Limited with maximum limit of rupees 85 Million at the profit rate of six months KIBOR
plus 1.15% (2012 : six months KIBOR plus 1.15%) . The liability is secured by equitable mortgage of Rs. 83.000 million over the Company's
fixed assets i.e. Building, Machinery / Plant and land measuring 1 kanal situated at 49-KM Multan road (Mouza Kamogill Tehsil Chunian Distt
Kasur) valuing Rs. 83.720 million as per the valuation report of M/s. Unicorn International Surveyors (as approved valuator of SBP). Forced
sale value is Rs. 71.152 million, pledge of shares Rs. 150.000 Million of Ghani Glass Ltd. duly lodged with CDC and personal guarantees of
directors of the Company
The Company has given bank guarantee of Rupees 729,000 (2012: Rupees 729,000/-) to WAPDA.
There is a contingent liability of Rupees 1,727,290 (2012: Rupees 1,727,290) in respect of income tax for assessment up to assessment year2001-2002 against order under section 62 and 52 of repealed Income Tax Ordinance, 1979.The company has filed the appeals againstabove orders.
The Punjab Employees Social Security Institution has raised a demand of Rupees 2,245,057/- (2012: Rupees 2,245,057) as lesspayment of contribution for the period from 1989 to 1995. The company has not acknowledged this demand and filed appeal under section57 of the Social Security Ordinance, 1965. After remand of the case by Labour Court, appeal is now under process with AdditionalCommissioner, Punjab Employees Social Security Institute.
Letter of credit in transit other than capital expenditure are Rupees 4,086,748/- (2012: Rupees 9,004,472/-).
4 Share CapitalJune 30, 2013 June 30, 2012 June 30, 2013 June 30, 2012
Rupees Rupees
4.1 Authorized Capital 19,250,000 19,250,000 192,500,000 192,500,000
4.2 ISSUED, SUBSCRIBED AND PAID UP CAPITAL
19,250,000 19,250,000 192,500,000 192,500,000
250,000 250,000 2,500,000 2,500,000
500,000 500,000 5,000,000 5,000,000
20,000,000 20,000,000 200,000,000 200,000,000
5 LONG TERM DIMINISHING MUSHARAKA FINANCING
Diminishing Musharaka Financing - 3,900,000Less : Current portion - 3,900,000
- -
The company has executed Diminishing musharaka agreement with Habib Metropolitan Bank Limited for purchase of plots measuring about
20 Kanals and 10 marlas situated at Kamun Gil Mouza Tehsil Chunian Distt Kasur. The liability is repayable in 60 equal monthly installments
starting from July 24, 2008 and subject to profit charged @ 6 months KIBOR plus 1% p.a.(2012: 6 MONTH KIBOR PLUS 1%) to be reviewed on
The facility is secured by a Legal mortgage of rupees 500,000/- and balance equitable mortgage to be created on project Land and Building
to be purchased through the facility in the name of company. A charge is registered with the Securities and Exchange Commission of
Pakistan (SECP) on the same property for rupees 25.000 million. Further more pledge of shares of M/s. Ghani Glass Limited (Director's
personal holding) at 40% margin of market price.
six monthly basis also capped at minimum 11% p.a and maximum 18% p.a.
Ordinary shares of Rs. 10 eachfully paid other than cash
Ordinary shares of Rs. 10 eachissued as bonus shares
Ordinary shares of Rs. 10 eachfully paid in cash
Number of Shares
Ordinary share of Rs. 10 each
NOTE
10
PR
OP
ER
TY,
PL
AN
TA
ND
EQ
UIP
ME
NT
Fre
eh
old
Lan
dB
uild
ing
on
Fre
eh
old
Lan
d
Pla
nt
an
d
Mach
ine
ry
Fu
rnit
ure
an
dF
ixtu
res
Lo
ose
Too
lsE
lectr
ical
Eq
uip
me
nt
Ele
ctr
ical
Insta
llati
on
Co
mp
ute
rsV
eh
icle
sTo
talO
pe
rati
ng
Asse
ts
As
at
30
Ju
ne
2011
Co
st
14
,93
2,1
80
37
,83
2,6
45
14
,65
0,5
19
1,4
07
,11
11
,27
5,5
76
97
5,8
83
1,5
61
,11
47
89
,14
51
,96
0,1
29
75
,38
4,3
02
Accu
mu
late
dd
ep
recia
tio
n-
(18
,86
1,7
78
)(5
,17
8,0
72
)(7
82
,74
7)
(58
3,8
61
)(5
32
,60
3)
(67
1,3
78
)(4
64
,57
7)
(1,3
60
,38
0)
(28
,43
5,3
96
)N
et
bo
ok
valu
e1
4,9
32
,18
01
8,9
70
,86
79
,47
2,4
47
62
4,3
64
69
1,7
15
44
3,2
80
88
9,7
36
32
4,5
68
59
9,7
49
46
,94
8,9
06
Ye
ar
en
de
d30
Ju
ne
2012
Op
en
ing
net
bo
ok
valu
e1
4,9
32
,18
01
8,9
70
,86
79
,47
2,4
47
62
4,3
64
69
1,7
15
44
3,2
80
88
9,7
36
32
4,5
68
59
9,7
49
46
,94
8,9
06
Ad
ditio
ns
--
-2
2,5
00
-1
1,5
00
--
-3
4,0
00
Dep
recia
tio
n-
(1,8
97
,08
7)
(94
7,2
45
)(6
3,8
74
)(6
9,1
72
)(4
4,9
03
)(4
4,4
87
)(9
7,3
70
)(1
19
,95
0)
(3,2
84
,08
8)
Clo
sin
gn
et
bo
ok
valu
e1
4,9
32
,18
01
7,0
73
,78
08
,52
5,2
02
58
2,9
90
62
2,5
43
40
9,8
77
84
5,2
49
22
7,1
98
47
9,7
99
43
,69
8,8
18
At
30
Ju
ne
2012
Co
st
14
,93
2,1
80
37
,83
2,6
45
14
,65
0,5
19
1,4
29
,61
11
,27
5,5
76
98
7,3
83
1,5
61
,11
47
89
,14
51
,96
0,1
29
75
,41
8,3
02
Accu
mu
late
dd
ep
recia
tio
n-
(20
,75
8,8
65
)(6
,12
5,3
17
)(8
46
,62
1)
(65
3,0
33
)(5
77
,50
6)
(71
5,8
65
)(5
61
,94
7)
(1,4
80
,33
0)
(31
,71
9,4
84
)N
et
bo
ok
valu
e1
4,9
32
,18
01
7,0
73
,78
08
,52
5,2
02
58
2,9
90
62
2,5
43
40
9,8
77
84
5,2
49
22
7,1
98
47
9,7
99
43
,69
8,8
18
Ye
ar
en
de
d30
Ju
ne
2013
Op
en
ing
net
bo
ok
valu
e1
4,9
32
,18
01
7,0
73
,78
08
,52
5,2
02
58
2,9
90
62
2,5
43
40
9,8
77
84
5,2
49
22
7,1
98
47
9,7
99
43
,69
8,8
18
Ad
ditio
ns
--
70
,00
0-
--
-3
8,6
31
-1
08
,63
1
Dep
recia
tio
n-
(1,7
07
,37
8)
(85
3,1
04
)(5
8,2
99
)(6
2,2
54
)(4
0,9
88
)(4
2,2
62
)(7
0,6
57
)(9
5,9
60
)(2
,93
0,9
02
)
Clo
sin
gn
et
bo
ok
valu
e14,9
32,1
80
15,3
66,4
02
7,7
42,0
98
524,6
91
560,2
89
368,8
89
802,9
87
195,1
72
383,8
39
40,8
76,5
47
At
30
Ju
ne
2013
Co
st
14
,93
2,1
80
37
,83
2,6
45
14
,72
0,5
19
1,4
29
,61
11
,27
5,5
76
98
7,3
83
1,5
61
,11
48
27
,77
61
,96
0,1
29
75
,52
6,9
33
Accu
mu
late
dd
ep
recia
tio
n-
(22
,46
6,2
43
)(6
,97
8,4
21
)(9
04
,92
0)
(71
5,2
87
)(6
18
,49
4)
(75
8,1
27
)(6
32
,60
4)
(1,5
76
,29
0)
(34
,65
0,3
86
)N
et
bo
ok
valu
e14,9
32,1
80
15,3
66,4
02
7,7
42,0
98
524,6
91
560,2
89
368,8
89
802,9
87
195,1
72
383,8
39
40,8
76,5
47
De
pre
cia
tio
nra
te(%
)-
10
10
10
10
10
53
02
0-
2013
20
12
Ru
pe
es
Ru
pees
10.1
Co
st
ofsale
s2,8
88,4
83
3,2
31
,06
4
Dis
trib
utio
nan
dm
ark
etin
g42,4
19
53
,02
4
2,9
30,9
02
3,2
84
,08
8
--
--
--
--
--
--
--
--
--
--
--
--
--
--
--
--
--
--
--
--
--
--
--
--
--
--
--
--
--
--
-R
UP
EE
S-
--
--
--
--
--
--
--
--
--
--
--
--
--
--
--
--
--
--
--
--
--
--
--
Th
ed
ep
recia
tio
nch
arg
efo
rth
eye
ar
has
be
en
allo
cate
das
follo
ws:
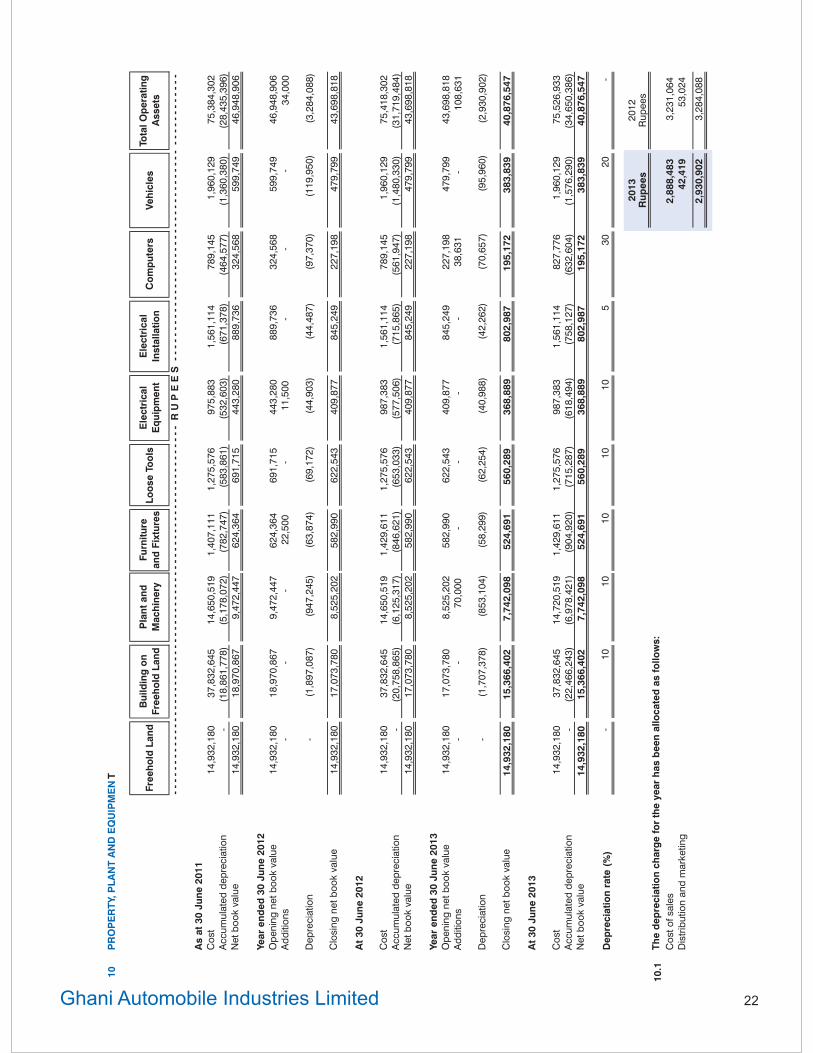
22Ghani Automobile Industries Limited
June 30, 2013 June 30, 2012
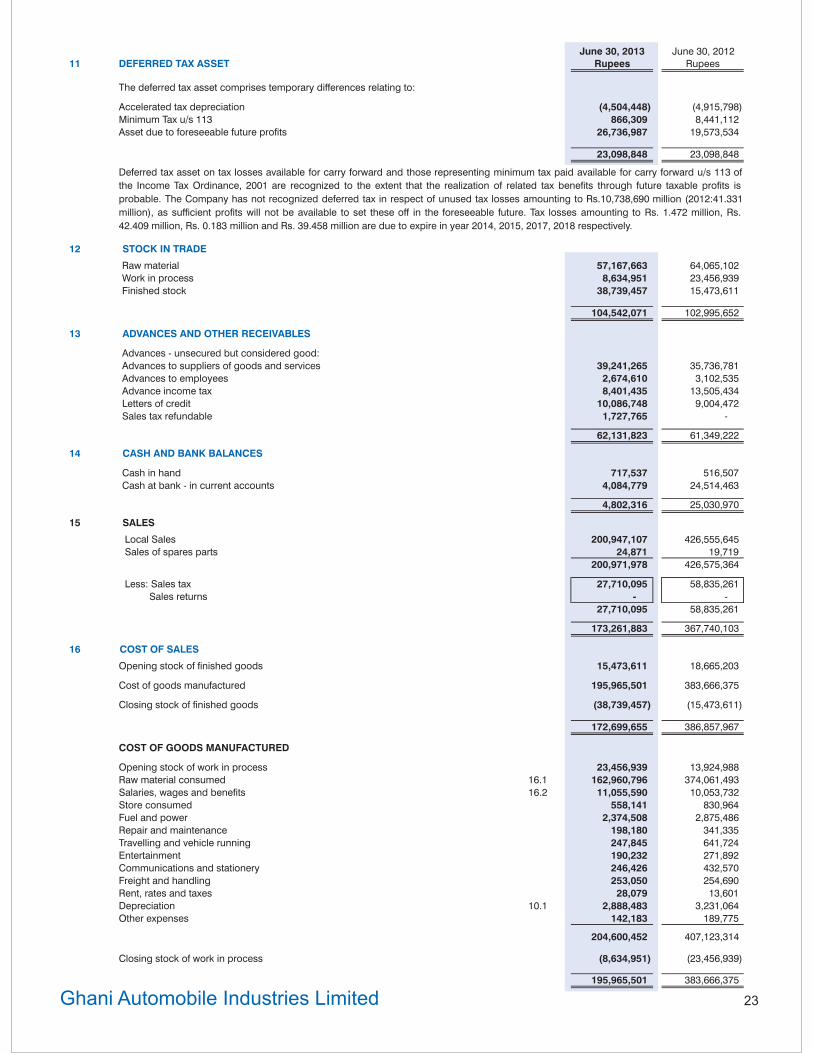
11 DEFERRED TAX ASSET Rupees Rupees
The deferred tax asset comprises temporary differences relating to:
Accelerated tax depreciation (4,504,448) (4,915,798)
Minimum Tax u/s 113 866,309 8,441,112
Asset due to foreseeable future profits 26,736,987 19,573,534
23,098,848 23,098,848
12 STOCK IN TRADE
Raw material 57,167,663 64,065,102
Work in process 8,634,951 23,456,939
Finished stock 38,739,457 15,473,611
104,542,071 102,995,652
13 ADVANCES AND OTHER RECEIVABLES
Advances - unsecured but considered good:
Advances to suppliers of goods and services 39,241,265 35,736,781
Advances to employees 2,674,610 3,102,535
Advance income tax 8,401,435 13,505,434
Letters of credit 10,086,748 9,004,472
Sales tax refundable 1,727,765 -
62,131,823 61,349,222
14 CASH AND BANK BALANCES
Cash in hand 717,537 516,507
Cash at bank - in current accounts 4,084,779 24,514,463
4,802,316 25,030,970
15 SALES
Local Sales 200,947,107 426,555,645
Sales of spares parts 24,871 19,719
200,971,978 426,575,364
Less: Sales tax 27,710,095 58,835,261
Sales returns - -
27,710,095 58,835,261
173,261,883 367,740,103
16 COST OF SALES
Opening stock of finished goods 15,473,611 18,665,203
Cost of goods manufactured 195,965,501 383,666,375
Closing stock of finished goods (38,739,457) (15,473,611)
172,699,655 386,857,967
COST OF GOODS MANUFACTURED
Opening stock of work in process 23,456,939 13,924,988
Raw material consumed 16.1 162,960,796 374,061,493
Salaries, wages and benefits 16.2 11,055,590 10,053,732
Store consumed 558,141 830,964
Fuel and power 2,374,508 2,875,486
Repair and maintenance 198,180 341,335
Travelling and vehicle running 247,845 641,724
Entertainment 190,232 271,892
Communications and stationery 246,426 432,570
Freight and handling 253,050 254,690
Rent, rates and taxes 28,079 13,601
Depreciation 10.1 2,888,483 3,231,064
Other expenses 142,183 189,775
204,600,452 407,123,314
Closing stock of work in process (8,634,951) (23,456,939)
195,965,501 383,666,375
Deferred tax asset on tax losses available for carry forward and those representing minimum tax paid available for carry forward u/s 113 of
the Income Tax Ordinance, 2001 are recognized to the extent that the realization of related tax benefits through future taxable profits is
probable. The Company has not recognized deferred tax in respect of unused tax losses amounting to Rs.10,738,690 million (2012:41.331
million), as sufficient profits will not be available to set these off in the foreseeable future. Tax losses amounting to Rs. 1.472 million, Rs.
42.409 million, Rs. 0.183 million and Rs. 39.458 million are due to expire in year 2014, 2015, 2017, 2018 respectively.
23Ghani Automobile Industries Limited

June 30, 2013 June 30, 2012
16.1 Raw Material Consumed Rupees Rupees
Opening balance 64,065,102 88,914,870
Local purchases 122,961,083 220,279,559
Import purchases 33,102,274 128,932,166
Closing stock (57,167,663) (64,065,102)
162,960,796 374,061,493
16.2 Salaries, Wages and other benefit include Rs. 534,757 (2012: 597,276) in respect of staff retirement benefits.
17 ADMINISTRATIVE EXPENSES
Staff Salaries benefits 17.1 839,870 6,181,117
Travelling and vehicle running 187,460 458,032
Entertainment 423,337 533,097
Repair and maintenance 3,380 16,150
Communications and stationery 540,218 1,072,283
Auditor's remuneration
Annual audit fee 95,000 95,000
Half yearly review 45,000 45,000
Other certification 12,500 12,500
152,500 152,500
Fee and Subscription 965,045 1,599,403Miscellaneous expenses - 77,461
3,111,810 10,090,043
17.1 Salaries, Wages and other benefit include Rs. 52,013 (2012: 60,204) in respect of staff retirement benefits.
18 DISTRIBUTION AND MARKETING EXPENSES
Salaries, wages and benefits 18.1 3,445,902 5,559,105
Travelling and vehicle running 3,038,772 3,326,316
Entertainment 1,465,847 1,912,643
Advertising and sales promotion 542,280 2,065,230
Rent, rates and taxes 51,900 201,000
Communications and stationery 433,700 922,888
Insurance expenses 506,930 748,749
Freight and handling 589,159 967,361
Depreciation 10.1 42,419 53,024
Ijarah rental on vehicles 18.2 129,923 501,634
Other expenses 696,930 302,130
10,943,762 16,560,080
18.1 Salaries, Wages and other benefit include Rs. 184,800 (2012: 290,889) in respect of staff retirement benefits.
18.2 Total Future Ijarah Payments
Not later than one year - 128,303
Not later than five years - -
- 128,303
19 OTHER INCOME
Freight on delivery of goods is charged to customers and dealers.
20 FINANCIAL CHARGES
Diminishing musharaka financing 233,926 774,570
Morabaha financing 11,416,626 13,745,955
Bank charges 242,079 319,853
11,892,631 14,840,378
21 TAXATION
Current Year Provision (866,309) -
Deferred Tax Loss - (3,200,000)
(866,309) (3,200,000)
22 EARNING PER SHARE - Basic
(Loss) / profit after tax - Rupees (10,574,081) (41,314,365)
Weighted average number of shares 20,000,000 20,000,000
(Loss) / earnings per share - Rupees (0.53) (2.07)
24Ghani Automobile Industries Limited

25Ghani Automobile Industries Limited
June 30, 2013 June 30, 2012
23 CASH FLOWS FROM OPERATING ACTIVITIES Rupees Rupees
(Loss) for the year before tax (9,707,772) (38,114,365)
Adjustment for :
Depreciation 2,930,902 3,284,088
Financial charges 11,892,631 14,840,378
14,823,533 18,124,466
Operating profit before working capital changes 5,115,761 (19,989,899)
(Increase) / decrease in current assets
Store, spares and loose tools (209,070) 122,130
Stock in trade (1,546,419) 18,509,409
Trade debtors 4,891,354 4,775,777
Advances and other receivables (5,886,600) 20,849,685
(2,750,735) 44,257,001Increase in current liabilities
Creditors, accrued and other liabilities (93,451,251) 1,609,033
(91,086,225) 25,876,135
Financial charges paid (11,892,631) (13,855,177)
Taxes paid 4,621,887 (3,478,259)
Net cash flows from operating activities (98,356,969) 8,542,699
24 REMUNERATION OF CHIEF EXECUTIVE, DIRECTORS AND EXECUTIVE
2013 2012 2013 2012 2013 2012
Rupees Rupees Rupees Rupees Rupees Rupees
Managerial remuneration - - - - - -
House rent - - - - - -
Utilities - - - - - -
Traveling expenses - - - - - -
Medical - - - - - -
- - - - - -
Number of persons 1 1 2 2 3 3
25 TRANSACTIONS WITH RELATED PARTIES
Name of Related Party
Ghani Glass Ltd. 923,434 -
Anwar Ahmed Khan
(director), Aftab Ahmed
Khan (director),Obaid
Ghani (spouse) and Junaid
Ghani (spouse)
150,000,000 150,000,000
150,923,434 150,000,000
26 CAPACITY AND UTILIZATION
Production capacity 25,000 25,000
Actual production 6,162 11,360
Reason For Shortfall
Actual production is lower than the maximum production capacity due to low market demand and energy crisis in the country.
27 NUMBER OF EMPLOYEES
Number of employees at year end. 86 95
Avg. Number of Employees 90 98
28 Provident Fund Related Disclosures
The company operates funded contributory provident fund scheme for all its permanent and eligible employess . The following information is
based on the audited finanacial statements of provident fund for the year ended 30 June 2013.
TotalDirector
Nature of Transaction
Sale of Motorcycles
2.913 million shares of M/s Ghani
Glass Limited have been pledged
against morabha facility availed by
the company from Soneri Bank
Limited. These shares are valued at
Rs. 150 million.
None of the officers of the Company were paid basic yearly salary of Rupees five hundred thousand or more. Therefore, none of them falls
within the category of executive as defined in the Companies Ordinance, 1984.
The related parties comprised of associated undertakings, directors and key personnel. The directors of the related companies are close
members of the family of the directors of the company. The company in the normal course of business carries out transactions with the
related parties. Transactions with related parties during the period are as follows:
Chief Executive
Size of the fund - Total Assets
Cost of investments made
Percentage of investment made
Fair value of investment
1,239,08314,711
1%14,711
453,579
314,834
69%
314,834
28.1 The break-up of fair value of investments is:20122013
Rupees % Rupees %
Bank Account 14,711 100% 314,834 100%
14,711 1.00 314,834 1.00
The investment out of provident fund have been made in accordance with the provision of Section 227 of the Companies Ordinance 1984 and
the rules formulated for the purpose.

29
FA
IRV
ALU
EO
FF
INA
NC
IAL
AS
SE
TS
AN
DL
IAB
ILIT
IES
29.1
FIN
AN
CIA
LIN
ST
RU
ME
NT
SA
ND
RE
LA
TE
DD
ISC
LO
SU
RE
Matu
rity
wit
hin
on
eye
ar
Matu
rity
mo
re
than
on
eye
ar
bu
t
less
than
5ye
ars
Matu
rity
wit
hin
on
eye
ar
Matu
rity
mo
re
than
on
eye
ar
bu
t
less
than
5ye
ars
Ru
pe
es
Ru
pe
es
Ru
pe
es
Ru
pe
es
Ru
pe
es
Ru
pees
Fin
an
cia
lA
sse
ts
Secu
rity
Dep
osits
--
-6
67
,38
6667,3
86
66
7,3
86
Tra
de
Deb
tors
--
19
1,3
49
,59
1-
191,3
49,5
91
19
6,2
40
,94
5
Ad
van
ces
an
dO
ther
Receiv
ab
les
--
62
,13
1,8
23
-62,1
31,8
23
61
,34
9,2
22
Cash
an
dB
an
kB
ala
nces
--
4,8
02
,31
6-
4,8
02,3
16
25
,03
0,9
70
Ye
ar
2013
--
258,2
83,7
30
667,3
86
258,9
51,1
16
28
3,2
88
,52
3
Year
20
12
--
28
2,6
21
,13
76
67
,38
62
83
,28
8,5
23
-
Fin
an
cia
lliab
ilit
ies
Dim
inis
hin
gM
ush
ara
ka
--
--
-3
,90
0,0
00
Mo
rab
ah
a-S
on
eri
Ban
kLim
ited
81
,76
3,4
00
--
-81,7
63,4
00
84
,74
5,2
00
Mo
rab
ah
a-H
ab
ibM
etr
op
olit
an
Ban
kLim
ited
9,9
82
,24
5-
--
9,9
82,2
45
9,9
49
,68
4
Mo
rab
ah
a-B
urj
Ban
kLim
ited
--
--
-2
,41
3,8
15
Ijara
hP
aym
en
ts-
--
--
12
8,3
03
Lo
an
fro
mS
po
nso
rs-
-1
68
,10
5,0
00
-168,1
05,0
00
80
,60
5,0
00
Cre
dito
rs,A
ccru
ed
an
dO
ther
Lia
bili
ties
--
10
4,9
59
,12
3-
104,9
59,1
23
19
8,8
92
,48
6
Ye
ar
2013
91,7
45,6
45
-273,0
64,1
23
-364,8
09,7
68
380,6
34,4
88
Year
20
12
10
1,0
08
,69
9-
27
9,6
25
,78
9-
38
0,6
34
,48
8-
Th
eeffective
inte
rest
/m
ark
up
rate
sfo
rm
on
eta
ryfin
an
cia
lassets
an
dlia
bili
ties
are
men
tio
ned
inre
sp
ective
no
tes
toth
efin
an
cia
lsta
tem
en
ts.
Th
ecarr
yin
gvalu
eo
ffin
an
cia
lassets
an
dfin
an
cia
llia
bili
ties
are
estim
ate
dto
ap
pro
xim
ate
their
resp
ective
fair
valu
es.
Fair
valu
eis
the
am
ou
nt
for
wh
ich
an
asset
co
uld
be
exc
han
ged
,o
ra
liab
ility
sett
led
,b
etw
een
kn
ow
led
geab
le,w
illin
gp
art
ies
inan
arm
'sle
ng
thtr
an
sactio
n.
De
scri
pti
on
Inte
rest/
Mark
-up
Be
ari
ng
No
nIn
tere
st/
Mark
-up
Be
ari
ng
Tota
l2
01
2To
tal2013
26Ghani Automobile Industries Limited
30 FINANCIAL RISK MANAGEMENT
30.1 Credit Risk
30.2 Market Risk
30.3 Currency Risk
30.4 Liquidity Risk
30.5 Yield Risk
31 EVENTS AFTER THE BALANCE SHEET DATE
There are no subsequent events occurring after the balance sheet date.
32 AUTHORIZATION TO ISSUE
These financial statements have been authorized for issuance by the Board of Directors of the Company on September 17, 2013.
Credit risk represents the accounting loss that would be recognized at the reporting date if counterparties fail completely to perform as
contracted and arises potentially from trade receivables. The Company believes that it is not exposed to major concentration of credit risks.
The company has not publicized any credit terms for trading on credit. For the purpose of provision of credit the management
monitors the credit exposure towards the customers taking into account the customer's financial position, past experience and other
factors. The company initiates recovery process through marketing department personnel after a reasonable credit period has expired.
Concentration of credit risk arises when a number of counter parties are engaged in similar business activities or have similar
economic features that would cause their abilities to meet contractual obligation to be similarly effected by the changes in economic,
political or other conditions. The company believes that it is not exposed to major concentration of credit risk.
Market risk is the risk that changes in market price, such as foreign exchange rates, interest rates and equity prices will effect the
company's income or the value of holdings of financial instruments.
Company obtains forward cover to manage material foreign currency risk, if considered necessary. However, the company is not
exposed to major currency risk exposure.
Liquidity risk is the risk that the company will not be able to meet its financial obligations as they fall due. The management closely
monitors its liquidity and cash flow position and takes appropriate steps to maintain liquidity at an appropriate and satisfactory level.
The company, however is not exposed to any material liquidity risk.
The company manages yield risk by matching the repricing of assets and liabilities through risk management strategies.
____________
DIRECTOR
__________________________
CHIEF EXECUTIVE OFFICER
27Ghani Automobile Industries Limited
28Ghani Automobile Industries Limited
6.
29Ghani Automobile Industries Limited

30Ghani Automobile Industries Limited
5

31Ghani Automobile Industries Limited
PROJECTED BALANCE SHEET Rupees
Year 0 Year 1 Year 2 Year 3 Year 4 Year 5
EQUITY & LIABILITIES
SHARE CAPITAL AND RESERVES
Issued, subscribed and paid up capital 500,000,000 500,000,000 500,000,000 500,000,000 500,000,000 500,000,000
Reserves (274,172,693) (250,534,585) (217,747,865) (178,770,812) (136,525,746) (88,748,777)
Accumulated losses
225,827,307 249,465,415 282,252,135 321,229,188 363,474,254 411,251,223
Non current liabilities - - - - -
Current liabilities
Short term Bank Financing 95,011,600 45,011,600 15,011,600 15,011,600 15,011,600 15,011,600
Loan from sponsors 135,005,000 105,005,000 105,005,000 90,005,000 75,005,000 60,005,000
Creditors, accrued and other liabilities 82,640,498 90,570,214 102,836,205 114,012,998 128,513,685 144,245,956
Provision For Income Tax 1,276,200 1,276,200 1,276,200 1,276,200 1,276,200 1,276,200
313,933,298 241,863,014 224,129,005 220,305,798 219,806,485 220,538,756
CONTINGENCIES AND COMMITMENTS
539,760,605 491,328,429 506,381,139 541,534,986 583,280,739 631,789,980
ASSETS
Non current assets
Property, plant and equipment 57,008,900 63,408,900 69,808,900 76,208,900 82,608,900 89,008,900
Security deposits 667,400 667,400 667,400 667,400 667,400 667,400
Deferred tax asset 16,746,161 5,622,345 - - - -
Current assets
Stores, spares and loose tools 1,409,600 1,524,900 1,648,200 1,780,100 1,921,001 2,017,051
Stock in trade 111,060,225 115,799,041 120,816,268 126,119,039 131,715,562 137,652,204
Trade debtors - unsecured but considered good 165,408,629 195,019,411 210,000,000 235,000,000 250,000,000 275,000,000
Advances and other receivables 58,148,272 55,000,000 55,000,000 55,000,000 55,000,000 55,000,000
Cash and bank balances 129,311,418 54,286,432 48,440,371 46,759,548 61,367,876 72,444,425
465,338,145 421,629,784 435,904,840 464,658,687 500,004,439 542,113,680
539,760,605 491,328,429 506,381,140 541,534,986 583,280,739 631,789,980

32Ghani Automobile Industries Limited
PROJECTED CASH FLOW Rupees
Year 0 Year 1 Year 2 Year 3 Year 4 Year 5
CASH FLOWS FROM OPERATING ACTIVITIES
Profit / (loss) for the period before tax 19,852,072 34,761,923 48,215,764 57,319,197 62,125,097 70,260,249
Adjustment for :
Depreciation 3,600,000 3,600,000 3,600,000 3,600,000 3,600,000 3,600,000
Financial charges 9,501,160 4,501,160 1,501,160 1,501,160 1,501,160 1,501,160
13,101,160 8,101,160 5,101,160 5,101,160 5,101,160 5,101,160
Operating profit / (loss) before working capital changes 32,953,232 42,863,083 53,316,924 62,420,357 67,226,257 75,361,409
(Increase) / decrease in current assets
Store, spares and loose tools (595,970) (115,300) (123,300) (131,900) (140,901) (96,050)
Stock in trade (2,491,605) (4,738,816) (5,017,227) (5,302,770) (5,596,524) (5,936,642)
Trade debtors 32,338,175 (29,610,781) (14,980,589) (25,000,000) (15,000,000) (25,000,000)
Advances and other receivables - 3,148,272 - - - -
29,250,600 (31,316,625) (20,121,117) (30,434,670) (20,737,424) (31,032,692)
Increase / (decrease) in current liabilities
Creditors, accrued and other liabilities (40,310,778) 7,929,716 12,265,991 11,176,793 14,500,687 15,732,272
21,893,054 19,476,174 45,461,798 43,162,480 60,989,519 60,060,989
Financial charges paid (9,501,160) (4,501,160) (1,501,160) (1,501,160) (1,501,160) (1,501,160)
Taxes paid - - (9,806,699) (18,342,143) (19,880,031) (22,483,280)
NET CASH FLOWS FROM OPERATING ACTIVITIES 12,391,894 14,975,014 34,153,939 23,319,177 39,608,328 36,076,549
Security deposits
Acquisition of fixed assets (20,000,000) (10,000,000) (10,000,000) (10,000,000) (10,000,000) (10,000,000)
NET CASH FLOWS FROM INVESTING ACTIVITIES (20,000,000) (10,000,000) (10,000,000) (10,000,000) (10,000,000) (10,000,000)
Issue of share capital 150,000,000
Loan from sponsors (30,000,000) (30,000,000) - (15,000,000) (15,000,000) (15,000,000)
Musharaka financing repaid (1,800,000) - - - - -
Murabaha financing repaid - (50,000,000) (30,000,000) - - -
NET CASH FLOWS FROM FINANCING ACTIVITIES 118,200,000 (80,000,000) (30,000,000) (15,000,000) (15,000,000) (15,000,000)
Net increase / (decrease) in cash and cash equivalents 110,591,894 (75,024,986) (5,846,061) (1,680,823) 14,608,328 11,076,549
Cash and cash equivalents at the beginning 18,719,540 129,311,418 54,286,432 48,440,371 46,759,548 61,367,876
Cash and cash equivalents at the end 129,311,418 54,286,432 48,440,371 46,759,548 61,367,876 72,444,425
PROJECTED PROFIT AND LOSS ACCOUNT Rupees
Year 0 Year 1 Year 2 Year 3 Year 4 Year 5
Sales 548,855,907 659,093,363 792,656,540 949,444,707 1,132,662,096 1,355,704,543
Cost of Goods Sold 502,733,815 601,061,432 721,837,706 866,974,560 1,042,388,548 1,253,565,805
Gross Profit 46,122,092 58,031,930 70,818,834 82,470,147 90,273,548 102,138,738
Administrative expenses 6,418,860 6,602,222 6,794,750 6,997,177 7,210,305 7,429,926
Selling and marketing expenses 11,950,000 13,766,625 15,907,160 18,252,614 21,036,985 24,547,404
Financial charges 9,501,160 4,501,160 1,501,160 1,501,160 1,501,160 1,501,160
Other income (1,600,000) (1,600,000) (1,600,000) (1,600,000) (1,600,000) (1,600,000)
26,270,020 23,270,007 22,603,070 25,150,951 28,148,451 31,878,490
Net profit before tax 19,852,072 34,761,923 48,215,764 57,319,197 62,125,097 70,260,249
Provision for tax 6,352,663 11,123,815 15,429,045 18,342,143 19,880,031 22,483,280
Net Profit 13,499,409 23,638,108 32,786,720 38,977,054 42,245,066 47,776,969
DISCOUNT AMORTIZATION SCHEDULE
Rupees Rupees Rupees Rupees
Y0 150,000,000
Y1
Y2
Y3
Y4
Y5
150,000,000
130,000,000
100,000,000
70,000,000
35,000,000
-
(20,000,000)
(30,000,000)
(30,000,000)
(35,000,000)
(35,000,000)
150,000,000
130,000,000
100,000,000
70,000,000
35,000,000
-
150,000,000 (150,000,000)
Opening
balance
Charge for the
year
Amortised for
the year
Closing
balance
33Ghani Automobile Industries Limited
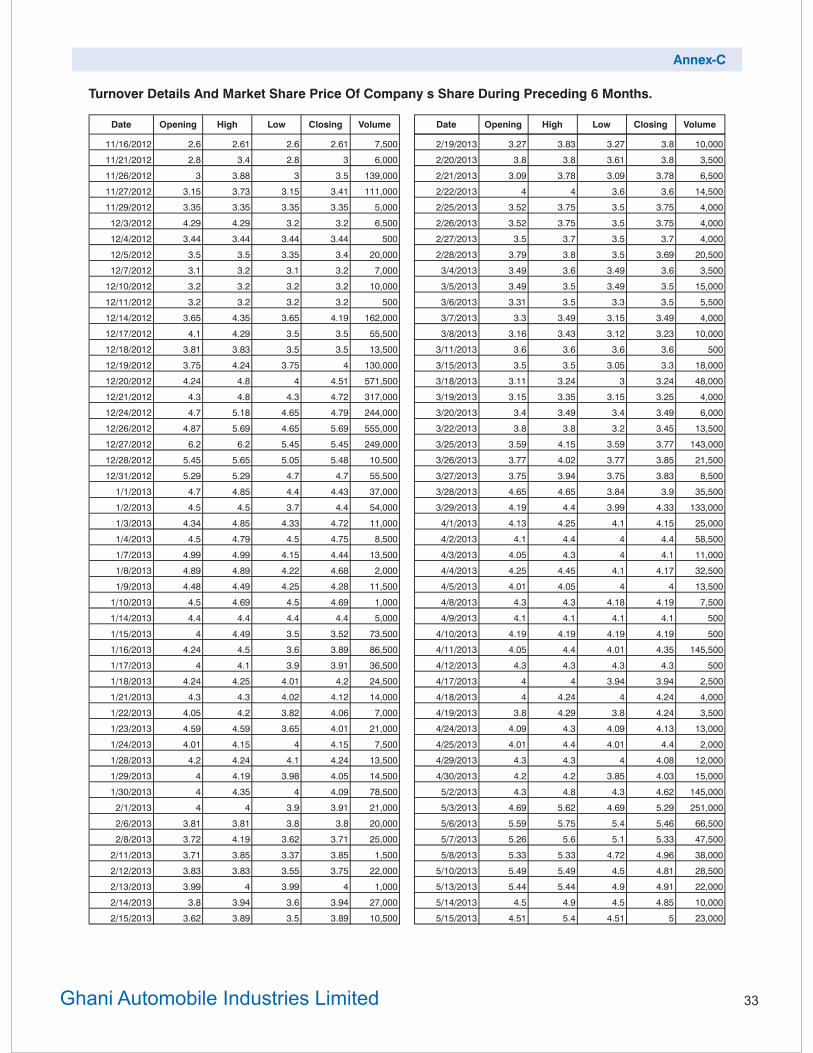
Annex-C
Date Opening High Low Closing Volume
11/16/2012 2.6 2.61 2.6 2.61 7,500
11/21/2012 2.8 3.4 2.8 3 6,000
11/26/2012 3 3.88 3 3.5 139,000
11/27/2012 3.15 3.73 3.15 3.41 111,000
11/29/2012 3.35 3.35 3.35 3.35 5,000
12/3/2012 4.29 4.29 3.2 3.2 6,500
12/4/2012 3.44 3.44 3.44 3.44 500
12/5/2012 3.5 3.5 3.35 3.4 20,000
12/7/2012 3.1 3.2 3.1 3.2 7,000
12/10/2012 3.2 3.2 3.2 3.2 10,000
12/11/2012 3.2 3.2 3.2 3.2 500
12/14/2012 3.65 4.35 3.65 4.19 162,000
12/17/2012 4.1 4.29 3.5 3.5 55,500
12/18/2012 3.81 3.83 3.5 3.5 13,500
12/19/2012 3.75 4.24 3.75 4 130,000
12/20/2012 4.24 4.8 4 4.51 571,500
12/21/2012 4.3 4.8 4.3 4.72 317,000
12/24/2012 4.7 5.18 4.65 4.79 244,000
12/26/2012 4.87 5.69 4.65 5.69 555,000
12/27/2012 6.2 6.2 5.45 5.45 249,000
12/28/2012 5.45 5.65 5.05 5.48 10,500
12/31/2012 5.29 5.29 4.7 4.7 55,500
1/1/2013 4.7 4.85 4.4 4.43 37,000
1/2/2013 4.5 4.5 3.7 4.4 54,000
1/3/2013 4.34 4.85 4.33 4.72 11,000
1/4/2013 4.5 4.79 4.5 4.75 8,500
1/7/2013 4.99 4.99 4.15 4.44 13,500
1/8/2013 4.89 4.89 4.22 4.68 2,000
1/9/2013 4.48 4.49 4.25 4.28 11,500
1/10/2013 4.5 4.69 4.5 4.69 1,000
1/14/2013 4.4 4.4 4.4 4.4 5,000
1/15/2013 4 4.49 3.5 3.52 73,500
1/16/2013 4.24 4.5 3.6 3.89 86,500
1/17/2013 4 4.1 3.9 3.91 36,500
1/18/2013 4.24 4.25 4.01 4.2 24,500
1/21/2013 4.3 4.3 4.02 4.12 14,000
1/22/2013 4.05 4.2 3.82 4.06 7,000
1/23/2013 4.59 4.59 3.65 4.01 21,000
1/24/2013 4.01 4.15 4 4.15 7,500
1/28/2013 4.2 4.24 4.1 4.24 13,500
1/29/2013 4 4.19 3.98 4.05 14,500
1/30/2013 4 4.35 4 4.09 78,500
2/1/2013 4 4 3.9 3.91 21,000
2/6/2013 3.81 3.81 3.8 3.8 20,000
2/8/2013 3.72 4.19 3.62 3.71 25,000
2/11/2013 3.71 3.85 3.37 3.85 1,500
2/12/2013 3.83 3.83 3.55 3.75 22,000
2/13/2013 3.99 4 3.99 4 1,000
2/14/2013 3.8 3.94 3.6 3.94 27,000
2/15/2013 3.62 3.89 3.5 3.89 10,500
Date Opening High Low Closing Volume
2/19/2013 3.27 3.83 3.27 3.8 10,000
2/20/2013 3.8 3.8 3.61 3.8 3,500
2/21/2013 3.09 3.78 3.09 3.78 6,500
2/22/2013 4 4 3.6 3.6 14,500
2/25/2013 3.52 3.75 3.5 3.75 4,000
2/26/2013 3.52 3.75 3.5 3.75 4,000
2/27/2013 3.5 3.7 3.5 3.7 4,000
2/28/2013 3.79 3.8 3.5 3.69 20,500
3/4/2013 3.49 3.6 3.49 3.6 3,500
3/5/2013 3.49 3.5 3.49 3.5 15,000
3/6/2013 3.31 3.5 3.3 3.5 5,500
3/7/2013 3.3 3.49 3.15 3.49 4,000
3/8/2013 3.16 3.43 3.12 3.23 10,000
3/11/2013 3.6 3.6 3.6 3.6 500
3/15/2013 3.5 3.5 3.05 3.3 18,000
3/18/2013 3.11 3.24 3 3.24 48,000
3/19/2013 3.15 3.35 3.15 3.25 4,000
3/20/2013 3.4 3.49 3.4 3.49 6,000
3/22/2013 3.8 3.8 3.2 3.45 13,500
3/25/2013 3.59 4.15 3.59 3.77 143,000
3/26/2013 3.77 4.02 3.77 3.85 21,500
3/27/2013 3.75 3.94 3.75 3.83 8,500
3/28/2013 4.65 4.65 3.84 3.9 35,500
3/29/2013 4.19 4.4 3.99 4.33 133,000
4/1/2013 4.13 4.25 4.1 4.15 25,000
4/2/2013 4.1 4.4 4 4.4 58,500
4/3/2013 4.05 4.3 4 4.1 11,000
4/4/2013 4.25 4.45 4.1 4.17 32,500
4/5/2013 4.01 4.05 4 4 13,500
4/8/2013 4.3 4.3 4.18 4.19 7,500
4/9/2013 4.1 4.1 4.1 4.1 500
4/10/2013 4.19 4.19 4.19 4.19 500
4/11/2013 4.05 4.4 4.01 4.35 145,500
4/12/2013 4.3 4.3 4.3 4.3 500
4/17/2013 4 4 3.94 3.94 2,500
4/18/2013 4 4.24 4 4.24 4,000
4/19/2013 3.8 4.29 3.8 4.24 3,500
4/24/2013 4.09 4.3 4.09 4.13 13,000
4/25/2013 4.01 4.4 4.01 4.4 2,000
4/29/2013 4.3 4.3 4 4.08 12,000
4/30/2013 4.2 4.2 3.85 4.03 15,000
5/2/2013 4.3 4.8 4.3 4.62 145,000
5/3/2013 4.69 5.62 4.69 5.29 251,000
5/6/2013 5.59 5.75 5.4 5.46 66,500
5/7/2013 5.26 5.6 5.1 5.33 47,500
5/8/2013 5.33 5.33 4.72 4.96 38,000
5/10/2013 5.49 5.49 4.5 4.81 28,500
5/13/2013 5.44 5.44 4.9 4.91 22,000
5/14/2013 4.5 4.9 4.5 4.85 10,000
5/15/2013 4.51 5.4 4.51 5 23,000
Turnover Details And Market Share Price Of Company s Share During Preceding 6 Months.
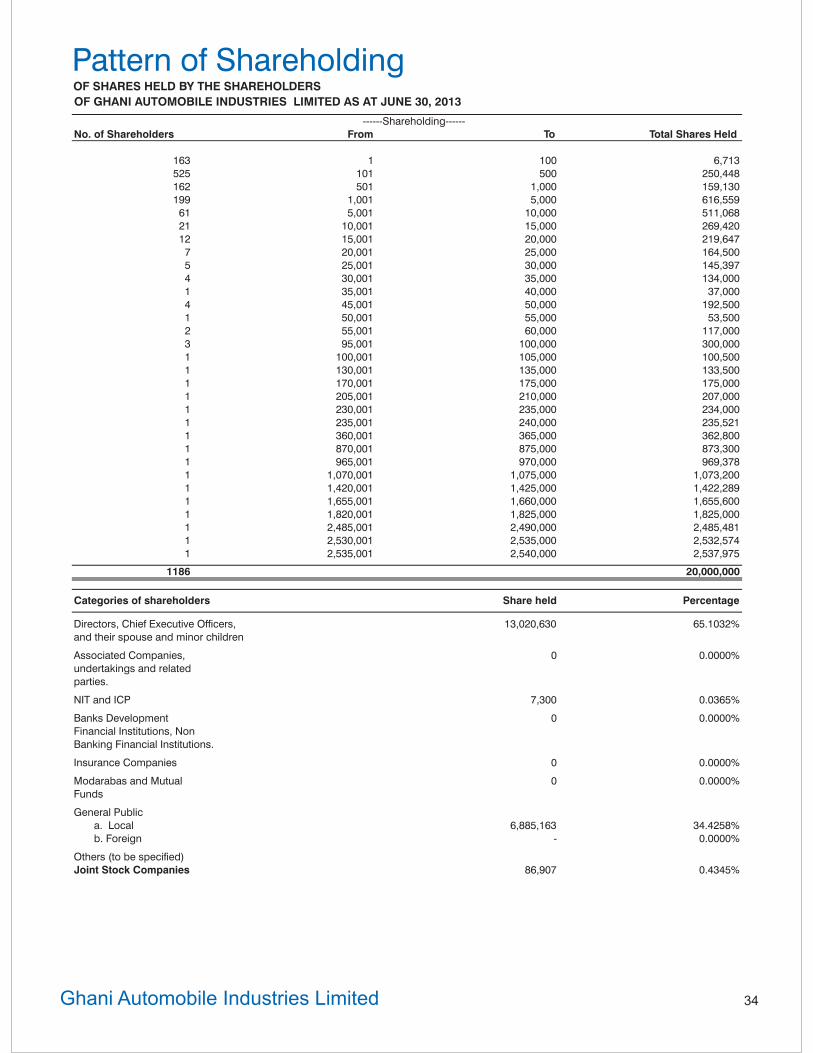
Pattern of ShareholdingOF SHARES HELD BY THE SHAREHOLDERS
OF GHANI AUTOMOBILE INDUSTRIES LIMITED AS AT JUNE 30, 2013
------Shareholding------
No. of Shareholders From To Total Shares Held
163 1 100 6,713
525 101 500 250,448
162 501 1,000 159,130
199 1,001 5,000 616,559
61 5,001 10,000 511,068
21 10,001 15,000 269,420
12 15,001 20,000 219,647
7 20,001 25,000 164,500
5 25,001 30,000 145,397
4 30,001 35,000 134,000
1 35,001 40,000 37,000
4 45,001 50,000 192,500
1 50,001 55,000 53,500
2 55,001 60,000 117,000
3 95,001 100,000 300,000
1 100,001 105,000 100,500
1 130,001 135,000 133,500
1 170,001 175,000 175,000
1 205,001 210,000 207,000
1 230,001 235,000 234,000
1 235,001 240,000 235,521
1 360,001 365,000 362,800
1 870,001 875,000 873,300
1 965,001 970,000 969,378
1 1,070,001 1,075,000 1,073,200
1 1,420,001 1,425,000 1,422,289
1 1,655,001 1,660,000 1,655,600
1 1,820,001 1,825,000 1,825,000
1 2,485,001 2,490,000 2,485,481
1 2,530,001 2,535,000 2,532,574
1 2,535,001 2,540,000 2,537,975
1186 20,000,000
Categories of shareholders Share held Percentage
Directors, Chief Executive Officers, 13,020,630 65.1032%
and their spouse and minor children
Associated Companies, 0 0.0000%
undertakings and related
parties.
NIT and ICP 7,300 0.0365%
Banks Development 0 0.0000%
Financial Institutions, Non
Banking Financial Institutions.
Insurance Companies 0 0.0000%
Modarabas and Mutual 0 0.0000%
Funds
General Public
a. Local 6,885,163 34.4258%
b. Foreign - 0.0000%
Others (to be specified)
Joint Stock Companies 86,907 0.4345%
34Ghani Automobile Industries Limited

Information Under Clause XVI (J)
S. No. NAME HOLDING
ASSOCIATED COMPANIES, UNDERTAKINGS & RELATED PARTIES NIL
MUTUAL FUNDS NIL
DIRECTORS, CEO THEIR SPOUSE AND MINOR CHILDREN
1 MR. IMTIAZ AHMAD KHAN 3,613,274
2 MR. ANWAAR AHMAD KHAN 4,193,575
3 MR. AFTAB AHMAD KHAN 4,310,481
4 MR. JUNAID GHANI (CDC) 234,000
5 HAFIZ OBAID GHANI 105,000
6 MR. JUBAIR GHANI 500
7 MRS. REEMA ANWAAR 100,000
8 MRS. AYESHA AFTAB 100,000
9 MS. ZAHRA AFTAB 500
10 DR. AMJAD AQEEL 500
11 MRS. RUBINA IMTIAZ. W/O IMTIAZ AHMED KHAN (CDC) 362,800
13,020,630
EXECUTIVES 1,026,378
PUBLIC SECTOR COMPANIES & CORPORATIONS NIL
BANKS, DEVELOPMENTS FINANCE INSTITUTIONS, NON BANKING FINANCIE NIL
COMPANIES, INSURANCE COMPANIES, TAKAFUL, MODARABAS & PENSION FUNDS
SHAREHOLDERS HOLDING 5% OR MORE VOTING INTEREST IN THE LISTED COMPANY
1 MR. IMTIAZ AHMAD KHAN 3,613,274
2 MR. ANWAAR AHMAD KHAN 4,223,575
3 MR. AFTAB AHMAD KHAN 4,310,481
4 FAISAL JUNAID 1,422,289
5 MR. MOHAMMAD SALIM LAKHANI (CDC) 1,051,378
During the financial year the trading in shares of the company by the Directors,
CEO, CFO, Company Secretary and their spouses and minor children is as follows
NAME SALE PURCHASE
MR. ANWAAR AHMAD KHAN (CDC) 30,000 -
OF THE CODE OF CORPORATE GOVERNANCE AS ON JUNE 30, 2013
35Ghani Automobile Industries Limited
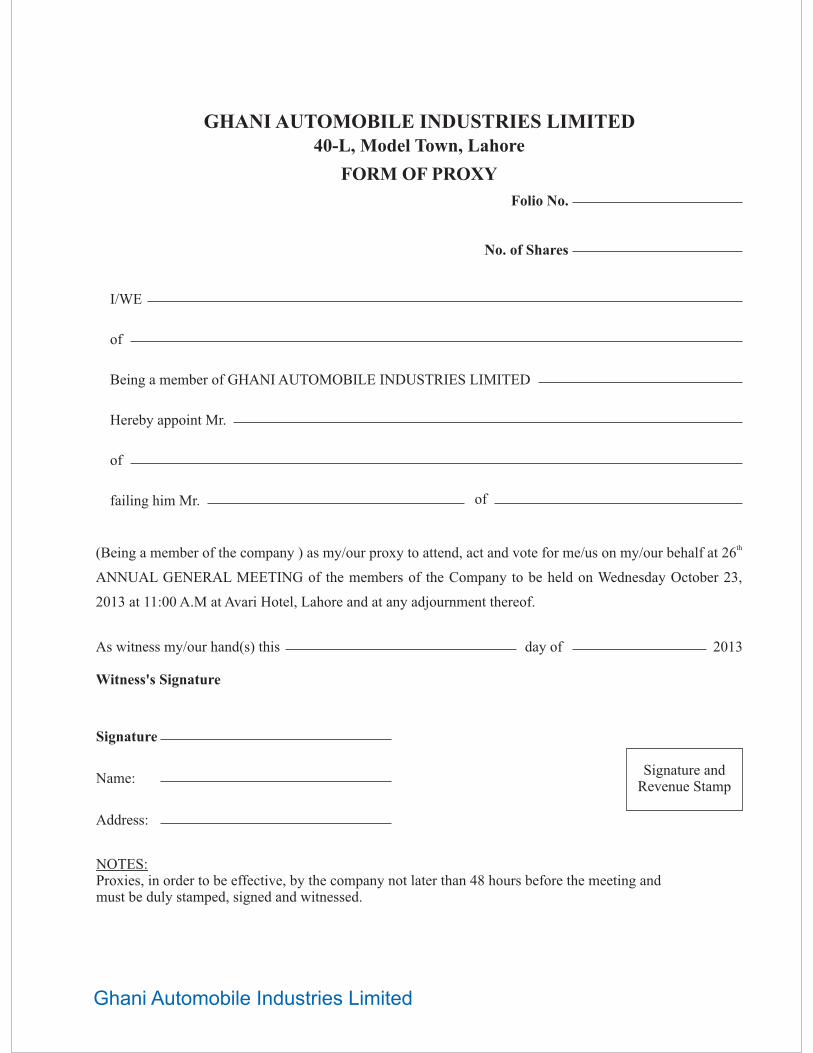
40-L, Model Town, Lahore
FORM OF PROXY
Folio No.
No. of Shares
I/WE
of
Being a member of GHANI AUTOMOBILE INDUSTRIES LIMITED
Hereby appoint Mr.
of
failing him Mr.
(Being a member of the company ) as my/our proxy to attend, act and vote for me/us on my/our behalf at 26
ANNUAL GENERAL MEETING of the members of the Company to be held on Wednesday October 23,
2013 at 11:00 A.M at Avari Hotel, Lahore and at any adjournment thereof.
th
As witness my/our hand(s) this day of 2013
Witness's Signature
Signature
Name:
Address:
of
NOTES:Proxies, in order to be effective, by the company not later than 48 hours before the meeting andmust be duly stamped, signed and witnessed.
Signature andRevenue Stamp
GHANI AUTOMOBILE INDUSTRIES LIMITED
Ghani Automobile Industries Limited

The Power of Perfection
Head Office:
40-L, Model Town, Lahore, Pakistan.
UAN: +92-42-111 949 949
Fax: + 92-42-35172263
www.ghaniautomobiles.com
Fara
n:0300-4
431538,0333-4
357984