ghent university faculty of pharmaceutical...
TRANSCRIPT
GHENT UNIVERSITY
FACULTY OF PHARMACEUTICAL SCIENCES
Department of Pharmaceutics
Laboratory of Pharmaceutical Technology
Academic year 2008‐2009
TABLET FORMULATION OF POROUS SILICON
MICROPARTICLES FOR IMPROVED DISSOLUTION
OF POORLY SOLUBLE DRUG MATERIALS
Liesbeth VANDERHAEGEN
First Master in Drug Development
Promoters Prof. Dr. C.Vervaet Prof. Dr. J. Yliruusi
Commissioners
Prof. Dr. S. De Smedt Dr. E. Mehuys
“The author and the promoters give the authorization to consult and to copy parts of this thesis
for personal use only. Any other use is limited by the laws of copyright, especially concerning
the obligation to refer to the source whenever results from this thesis are cited.”
June 2nd , 2009
Promotor Author
Prof. dr. C. Vervaet Liesbeth Vanderhaegen
ACKNOWLEDGEMENTS
First of all I would like to thank Prof. C. Vervaet and
the Faculty of Pharmaceutical Sciences for creating the opportunity
to write my master’s thesis abroad.
I am also grateful to Dr. J. Heinämäki, for his guidance during this period.
I would like to express my gratitude to Tanja Rotko for
all her help and patience during the experiments
and for her help with the analysis of our results.
I would also like to thank Leena Peltonen for her help with the results.
My thanks also go to Helder Santos for his assistance with the dissolution tests
and Timo Laaksonen for his help with the TEM pictures.
Without all these researcher my work would have been impossible.
A special thank goes to Simon who always stood me by in the laboratory and during our four
months in Helsinki.
I am also grateful to all the staff from the Division of Pharmaceutical Technology for their great
welcoming and for creating a very nice atmosphere.
They were always ready to help.
I especially want to thank Kati(Germany) and Jordane(France) for creating a nice ambience in
the lab.
My deepest thanks goes to my mother who gave me the chance to study in Helsinki.
TABLE OF CONTENT
LIST OF USED ABBRIVIATIONS
1 INTRODUCTION ...................................................................................................... 1
1.1 THE USE OF MESOPOROUS SILICON PARTICLES .................................................... 1 1.2 SILICON PARTICLES FOR ORAL DRUG DELIVERY .................................................... 3 1.2.1 Fabrication of mesoporous silicon particles ............................................. 3
1.2.2 Drug loading into the mesoporous silicon particles .................................. 6
1.3 TABLETING ............................................................................................................ 7 1.3.1 Compaction .............................................................................................. 7
1.3.2 Tablet excipients .................................................................................... 10
1.4 TABLETING OF POROUS MATERIALS ................................................................... 10 1.4.1 Porous Calcium Silicate .......................................................................... 10
1.4.2 Mesoporous silicon particles .................................................................. 13
2 THE AIMS OF THE STUDY ...................................................................................... 16
3 MATERIALS AND METHODS ................................................................................. 17
3.1 MATERIALS .......................................................................................................... 17 3.2 METHODS ........................................................................................................... 18 3.2.1 Tableting ................................................................................................ 18
3.2.2 HPLC analyses ........................................................................................ 19
3.2.3 Characterization of Tablets .................................................................... 19
3.2.3.1 Crushing strenght ................................................................................. 19 3.2.3.2 Thickness .............................................................................................. 20 3.2.3.3 Friability ............................................................................................... 20 3.2.3.4 Disintegration test ............................................................................... 20 3.2.3.5 Dissolution test .................................................................................... 20
3.2.4 Transmission electron microscope (TEM) ............................................... 23
4 RESULTS AND DISCUSSION ................................................................................... 24
4.1 TOPSI –IBUPROFEN TABLETS ............................................................................... 24 4.2 TOPSI – INDOMETHACIN TABLETS ...................................................................... 34 4.2.1 Dissolution profile of TOPSi – Indomethacin tablets compared with TOPSi – Indomethacin particles and pure Indomethacin powder. ..................................... 37
5 CONCLUSIONS ...................................................................................................... 43

6 REFERENCES ......................................................................................................... 44
LIST OF USED ABBREVIATIONS
GI: gastrointestinal
IUPAC: International Union of Pure and Applied Chemistry
HF: hydrofluoric
PSi: porous silicon
TOPSi: thermal oxidized porous silicon particles
TCPSi: thermal carbonized porous silicon particles
THCPSi: thermal hydrocarbonized mesoporous silicon
MCC: microcrystalline cellulose
PVP: polyvinylpyrrolidone
TEM: transmission electron microscope
1 INTRODUCTION
1.1 THE USE OF MESOPOROUS SILICON PARTICLES
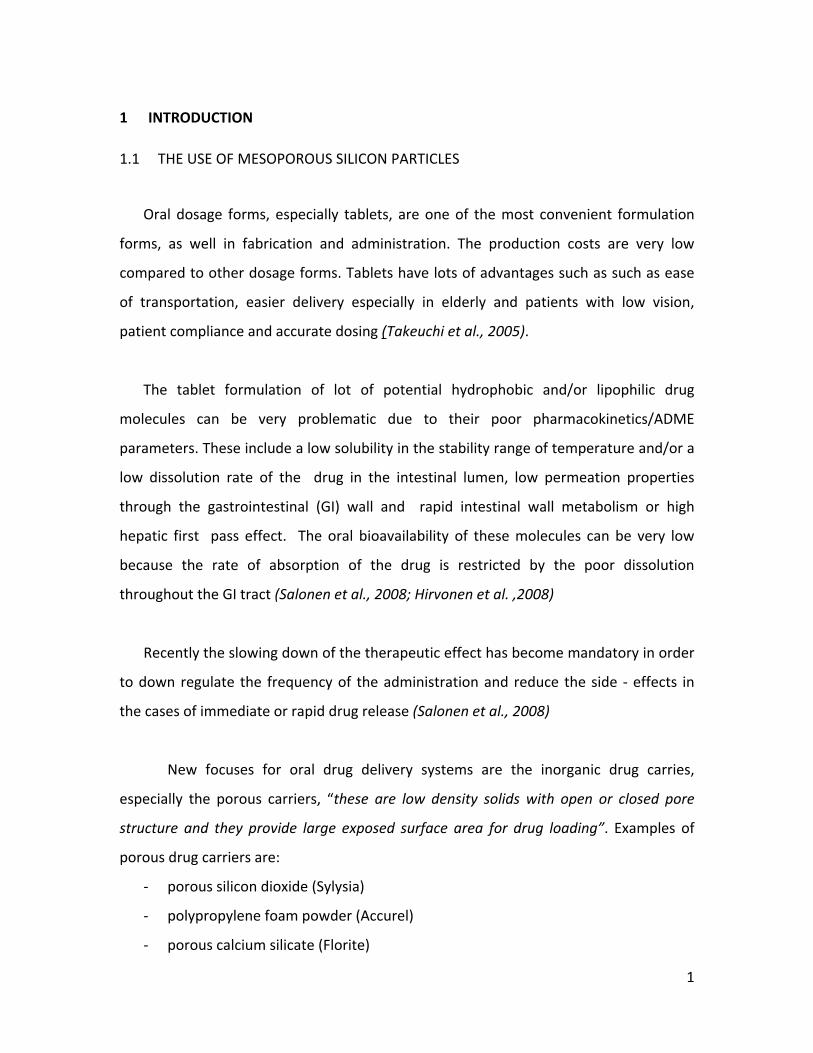
Oral dosage forms, especially tablets, are one of the most convenient formulation
forms, as well in fabrication and administration. The production costs are very low
compared to other dosage forms. Tablets have lots of advantages such as such as ease
of transportation, easier delivery especially in elderly and patients with low vision,
patient compliance and accurate dosing (Takeuchi et al., 2005).
The tablet formulation of lot of potential hydrophobic and/or lipophilic drug
molecules can be very problematic due to their poor pharmacokinetics/ADME
parameters. These include a low solubility in the stability range of temperature and/or a
low dissolution rate of the drug in the intestinal lumen, low permeation properties
through the gastrointestinal (GI) wall and rapid intestinal wall metabolism or high
hepatic first pass effect. The oral bioavailability of these molecules can be very low
because the rate of absorption of the drug is restricted by the poor dissolution
throughout the GI tract (Salonen et al., 2008; Hirvonen et al. ,2008)
Recently the slowing down of the therapeutic effect has become mandatory in order
to down regulate the frequency of the administration and reduce the side ‐ effects in
the cases of immediate or rapid drug release (Salonen et al., 2008)
New focuses for oral drug delivery systems are the inorganic drug carries,
especially the porous carriers, “these are low density solids with open or closed pore
structure and they provide large exposed surface area for drug loading”. Examples of
porous drug carriers are:
‐ porous silicon dioxide (Sylysia)
‐ polypropylene foam powder (Accurel)
‐ porous calcium silicate (Florite)
1
‐ magnesium aluminimeta silicate (Neusilin)
‐ porous ceramic
‐ Mesoporous silicon particles (Sharma et al., 2005).
In this study we will focus on the use of mesoporous silicon particles for oral use in
tablets. The mesoporous silicon particles show a lot of interesting properties considering
drug delivery applications. The International Union of Pure and Applied Chemistry
(IUPAC) defines mesoporous particles as inorganic drug carrier molecules with pore size
between 2 and 50 nanometres. These small pores “engage the effects of the surface
interactions of the drug molecules and the pore wall” (Salonen et al., 2008).
The pores of the silicon particles are just a few times larger than a drug molecule.
Due to the confined space inside the pores of the silicon particles, the drug molecules
cannot align themselves into crystals. Thus the mesoporous carriers confine the drug
molecules in their amorphous, noncrystalline form. The drug leaves the pore in its
amorphous form, which is far more soluble because the often high crystal energy has
not to be overcome. The drug release out of the particles is not hampered by the
electrostatic interactions nor chemical bonds between the particles and the drug, as
these forces are very weak in silicon. The dissolution rate is also improved by the better
wetting properties of the silicon particles and the greatly expanded surface area (up to
several hundreds of m²/g).
These mesoporous carriers can be used as well to produce formulations with
controlled or sustained release. The carrier molecule helps to release a steady flow of
the drug into the circulation and it can be used as a magic bullet as it directs the drug
into a specified target (e.g. cancer cells) (Hirvonen et al., 2008).
2
The pore size and surface chemistry of the pore walls can be modified quite
easily. (Salonen et al., 2008). The surface properties will influence the affinity of the
compound drug towards the particle and the release of drug and increase drug stability.
(Salonen et al., 2005a).
The mesoporous materials can, besides improving the dissolution, also enhance
the permeability of large hydrophobic molecules in addition to the classical oral
permeation enhancers (Hirvonen et al., 2008).
1.2 SILICON PARTICLES FOR ORAL DRUG DELIVERY
1.2.1 Fabrication of mesoporous silicon particles
During the fabrication of the particles for oral use, it must be ensured that they
can resist the acid environment of the stomach and the harsh conditions of the GI
lumen. They have to preserve their physicochemical properties and their function as
non‐erosive drug carrier (Salonen et al., 2008).
The first production of PSi was actually about 40 years ago by Uhlir. He
discovered that during electropolishing of silicon in an aqueous hydrofluoric acid (HF)
medium, the surface of the silicon became black, brown or red (Uhlir, 1956). But the
porous nature of the silicon was not yet recognized. The porous nature was first
discovered in the early seventies. (Watanbe et al., 1971)
Usually, porous silicon (PSi) particles are manufactured by cavitation during
electrochemical anodization of silicium wafers in hydrofluoric (HF) acid solutions
(Salonen et al., 2005a). During this process, the pores are etched into the material. The
process is mostly regulated by an anodic current because this method gives a better
control of the porosity and thickness and the fabrication is more reproducible. The
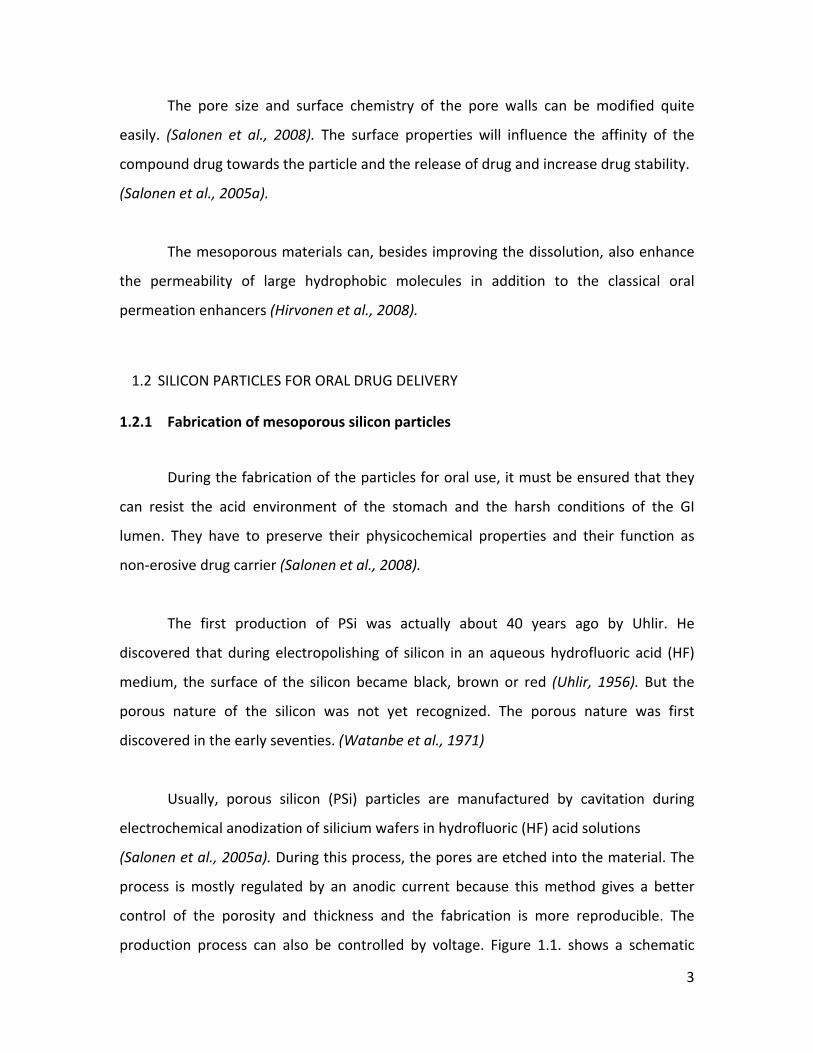
production process can also be controlled by voltage. Figure 1.1. shows a schematic
3
setup of this process. A strip of Si is dipped into the HF acid solution and the etching
current is laid on between the two electrodes. As the process continues the porous
layers are formed on the surface of the positive Si anode. Usually the cathode is made of
platinum and the fabrication cell must be made of an HF resistant material, like Teflon
for example. The used electrolyte can also be an ethanolic HF solution. The ethanol is
added to lower the surface tension and to absorb hydrogen, thus to reduce the
formation of hydrogen bubbles (insulators) but also to improve the permeability of the
electrolyte in the pores, which results in a more uniform PSi layer. When the fabrication
is completed, freestanding porous films can be obtained by abruptly increasing the
current density. Porous powder with specific particle size can be obtained by ball milling
and sieving of the films (Hirvonen et al., 2008). In our study the production of powder is
very important, as we want to make tablets out of the loaded particles samples.
FIG 1.1.: SCHEMATIC PRESENTATION OF THE ANODIZATION OF SILICON IN A TEFLON
CELL, FILLED WITH A HF ACID – EHANOL SOLUTION (Hirvonen et al., 2008)
As seen previously, the surface chemistry of the porous particles is very
important concerning their properties. The as‐anodized hydrogen terminated (Si‐H, Si‐
H2, Si‐H3) PSi surface is hydrophobic and very susceptible for oxidation, even at room
temperature. This leads to changes in its properties and structure.
4
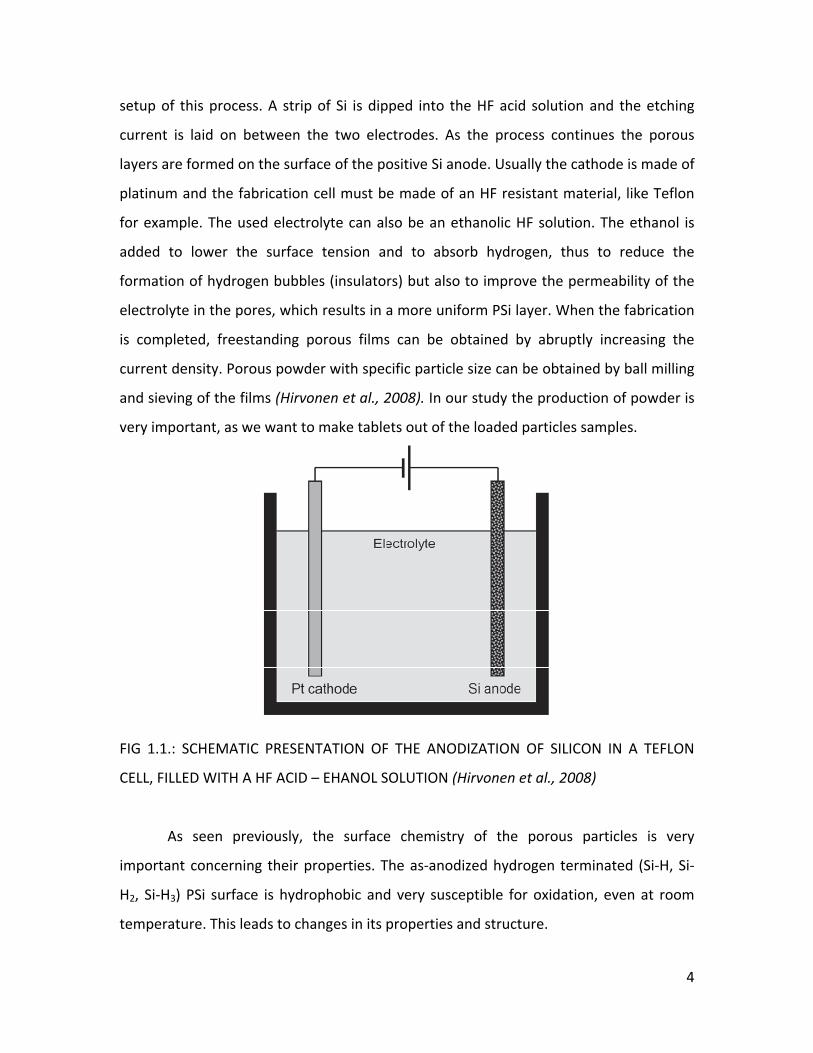
The simplest modification of the surface is thermal oxidation. The oxidation is
usually performed in quite mild conditions (300°C), this causes back‐bond oxidation of
the PSi. Instead of replacing the hydrogen atoms, oxygen – bridges are formed between
different layers of the PSi (Figure 1.2.). The structure modification does not only
improve the stability of the particles, but also turns the surface from hydrophobic to
hydrophilic. A slight decrease in pore diameter is noticed after the oxidation. This type
of silica particle is not applicable for every drug delivery system because the surface is
still partially chemically unstable. These particles are called thermal oxidized porous
silicon particles (TOPSi) (Hirvonen et al., 2008).
FIG 1.2.: OXYGEN BRIDGES BETWEENS LAYERS OF SILICA (Anglin et al., 2008)
Particles produced by thermal carbonization are chemically more stable. Two
different types of surfaces can be obtained, depending on the used technique. Both
particles are produced by the adsorption of acetylene to the PSi surface. Gaseous
acetylene is used because of its small size and due to its ability to diffuse quite fast into
the pores. After the adsorption at room temperature, the temperature is increased. This
causes desorption of the hydrogen atoms while the acetylene atoms bind to the Si
atoms. This results in a carbonized surface. When the temperature is kept below 700°C
and there is a continuous flow of acetylene, a partially carbonized surface is obtained.
The surface of these particles still consist hydrogen atoms, these particles are called
thermally hydrocarbonized PSi (THCPSi). When the temperature is raised above 700°C,
thermally carbonized PSi’s are formed. During this process the acetylene flow has to be
stopped before the temperature is raised. The high temperature treatment removes all
the hydrogen atoms, so the surface is completely carbonized. Before the modification
5
the PSi particles are first dipped in an aqueous HF – solution to ensure that the surface is
hydrogen determinate (Salonen et al., 2005b), because the surface was oxidized during
the milling procedure (Salonen et al., 2005a). This procedure is not necessary before the
thermal oxidation modification.
TOPSi and TCPSi both show hydrophilic behaviour, with low contact angle
towards water. This explains why the porous silicon particles have better wetting
properties. The particles with this kind of surface are applicable for oral drug
formulations (Salonen et al., 2005a)
This fabrication process determines the pore architecture while the surface
modifications are important for interactions with the PSi particles (Hirvonen et al.,
2008).
1.2.2 Drug loading into the mesoporous silicon particles
The particles are immersed into a drug solution to get them drug loaded. The
choice of a solvent depends on the solubility characteristics of the drug (Salonen et al.,
2008).. Afterwards the particles are filtered out of the loading solution, rinsed with the
drug‐free solvent and dried to powder (Salonen et al., 2005a).
An alternative drug loading method is impregnation. Here a controlled amount
of drug solution is added to the silicon particles. Capillary forces infuse the drug into the
pores. Both methods can be performed at room temperature and do not expose the
drug to any harsh chemical conditions. The first method can be better dose‐controlled.
The capillary infusion method is more usable in case of expensive drugs, small amounts
of drugs or when the porous particles are still attached on the Si wafer (Salonen et al.,
2008).
6
1.3 TABLETING
Powders, granules, pellets or film coated multiple pellets can be used for the
direct production of tablets. This is only possible when the materials show good
compressibility properties to form a tablet, which means that a material is able to
undergo a stable reduction in volume as a result of the applied pressure. The
compressibility can be presented as a plot of the tablet porosity towards the
compaction pressure.
The simplest method to produce tablets is by direct compression. The active
ingredient and the suitable excipients are dry mixed and then compacted. Although it is
a simple procedure, the powder must have specific properties to have a successful
compaction. These properties include high flowability, low segregation tendency and
high compactibility. The compactibility is defined by Patel et al. (2006) as the ability of a
material to produce tablets with a sufficient strength under the effect of densification
and is represented by a plot of tablet tensile strength against tablet porosity. In general
particle modification is necessary prior to the direct compaction because a lot of
pharmaceutical powders do not have these properties. The most common procedure for
particle modification is the production of granules, the particles are agglomerated to
form larger secondary particles. These are more porous than the primary particles (Patel
et al., 2006).
1.3.1 Compaction
Compaction is one of the most important steps in the formulation of tablets
because during this process the following properties of a tablet are determined:
‐ Mechanical properties
• Friability Tablet integrity • Hardness
7
‐ Physicochemical properties
• Disintegration in watery environment Bio availability
• Solubility
The reliability of the compaction depends on the physicochemical properties of
the drug and the excipients. Especially their deformation behaviour contributes to
successful tableting. Besides the components of the tablets, also the settings of the
tableting instrument are important to get a standardized compaction.
The compaction process can be divided into 2 main stages, a compression and
consolidation step. During the initial compression there is a reduction in the bulk
volume due to an expulsion of trapped air. Further volume reduction is accomplished by
a tighter packing of the powder particles, as the smaller particles nestle themselves
between the larger ones. This results in a less porous structure. When the compaction
force is further increased, the subsequent volume reduction is accomplished by particle
deformation.
The consolidation step involves particle‐particle interactions, these
interparticulate bond formations are made possible as the powder particles became
closer to each other during the volume reduction. Consolidation is very important in the
fabrication of tablet as it gives them the mandatory mechanical strength.
The actual compaction cycle consist of 5 stages:
1. Precompression: loading of the compressive device
2. Initial compression: expulsion of trapped air
3. Particle deformation
‐ Reversible compression: elastic deformation of the particles
‐ Exceeding critical pressure: plastic deformation (irreversible)
‐ Irreversible compression: fragmentation of particles
8
4. Removing the compression: partial elastic recoil or decompression
5. Ejection of the tablet: avoid adhesion
The kind of particle deformation is based on the mechanical properties of the
powder but is as well dependent on the rate and magnitude of the applied force and of
the duration of the induced pressure. Elastic deformation is a reversible process, while
the shape of the particles only changes temporarily, and occurs when the applied stress
does not reach the critical deformation value. Plastic deformation is irreversible as the
original shape of the particles changes permanently. This kind of deformation takes
place when a critical stress is exceeded. Further fragmentation of particles into smaller
ones is called brittle fraction, it starts while exceeding a threshold called crushing
compression. These smaller particles reallocate which results in minute further volume
reduction, by particle deformation, in part elastic and in part plastic. A single particle
can undergo this circle of deformation for several times (Patel et al., 2006; Alderborn,
2002)
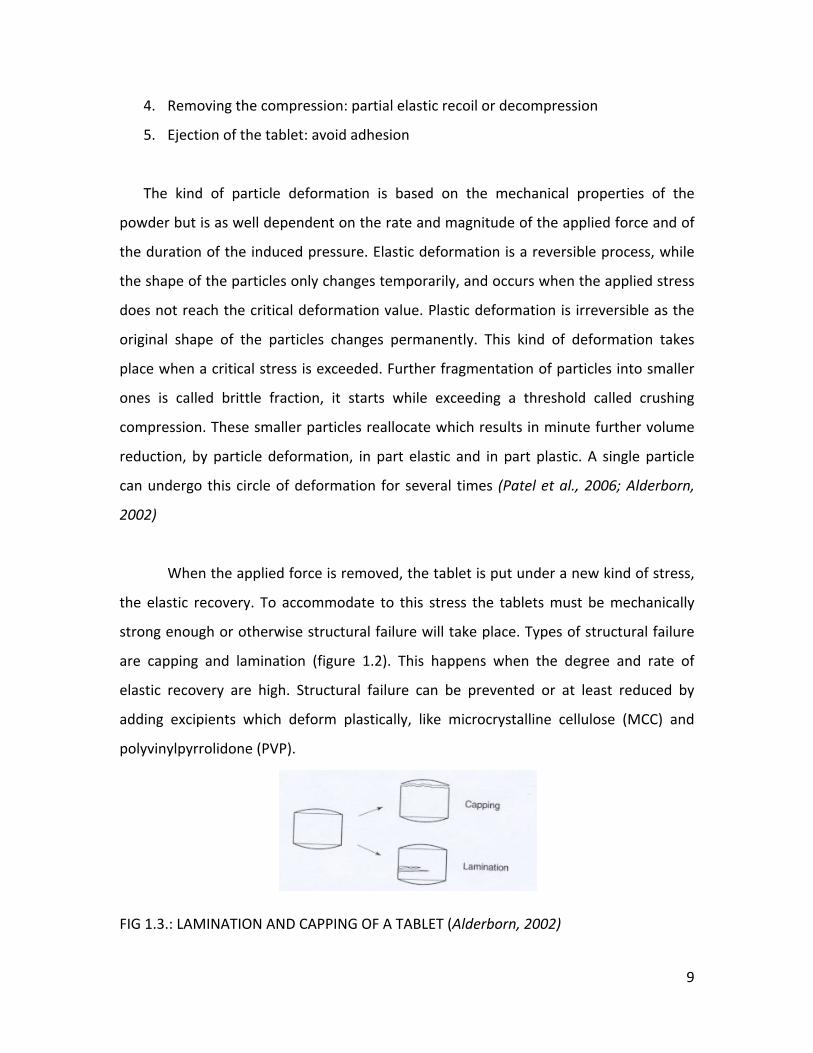
When the applied force is removed, the tablet is put under a new kind of stress,
the elastic recovery. To accommodate to this stress the tablets must be mechanically
strong enough or otherwise structural failure will take place. Types of structural failure
are capping and lamination (figure 1.2). This happens when the degree and rate of
elastic recovery are high. Structural failure can be prevented or at least reduced by
adding excipients which deform plastically, like microcrystalline cellulose (MCC) and
polyvinylpyrrolidone (PVP).
FIG 1.3.: LAMINATION AND CAPPING OF A TABLET (Alderborn, 2002)
9
The next and last step in the compression cycle is the ejection phase. In this
stage the tablets are removed from the die. There is a force needed to break the
adhesion between the die and the formed tablet. To reduce this stress a lubricant can
be used (Patel et al., 2006).
1.3.2 Tablet excipients
Excipients are essential in the formulation of tablets, the most commonly used
are a filler or diluents, a binder, a disintegration accelerator and a lubricant. Less used
are antiadherents, sorbents, flavouring components and colorants (Alderborn, 2002)
The diluents are the most important of all the excipients listed above as they are
present in amounts higher than all the other excipients (Patel et al., 2006). They are
used to increase the bulk volume of the powder, as tablets have a minimum weight
(commercially available tablets 50mg). A disintegration accelerator is used to facilitate
the formation of smaller particles when the tablet comes in contact with liquids. The
formation of these smaller particles increases the dissolution rate, as the total surface
area enlarges. The binders are added to the tablet blend to ensure that tablets are
formed with the right mechanical force. These are mostly added in a very low
concentration, only 2‐10 % of the tablet weight. Lubricants lower the disintegration and
dissolution rate as most of them are hydrophobic. This negative effect is strongly related
to the amount of lubricant used, normally the concentration is 1% or even lower
(Alderborn, 2002).
1.4 TABLETING OF POROUS MATERIALS
1.4.1 Porous Calcium Silicate
10
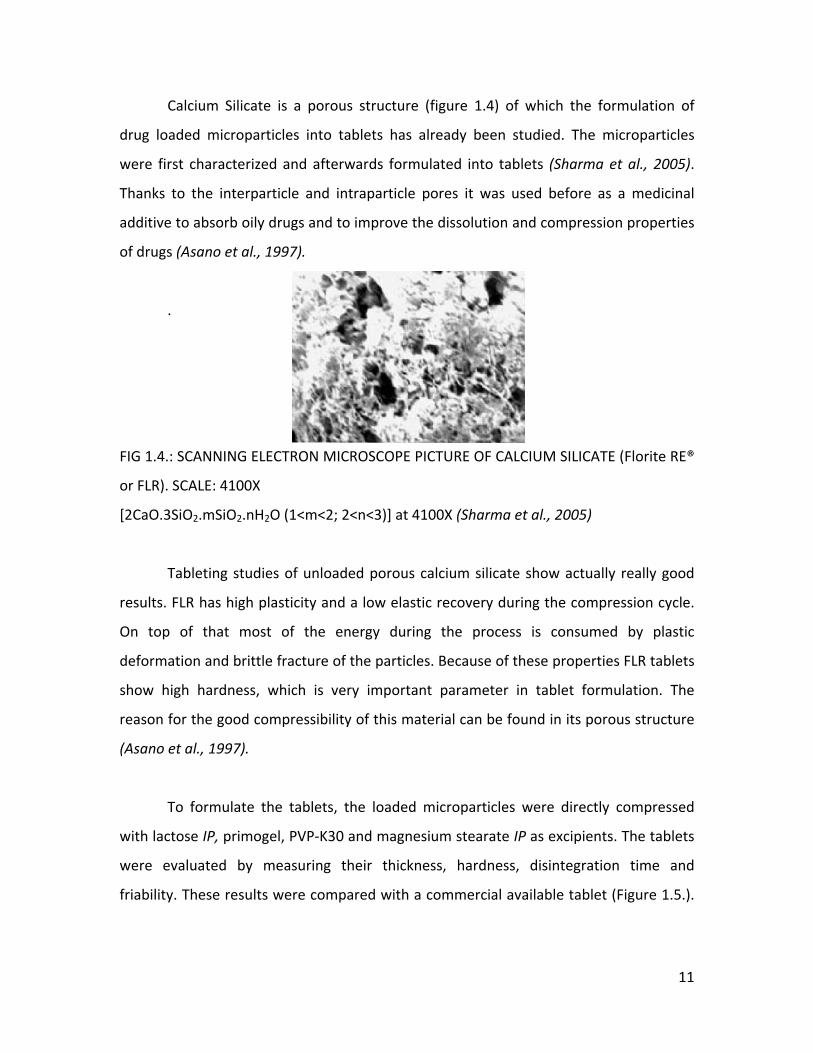
Calcium Silicate is a porous structure (figure 1.4) of which the formulation of
drug loaded microparticles into tablets has already been studied. The microparticles
were first characterized and afterwards formulated into tablets (Sharma et al., 2005).
Thanks to the interparticle and intraparticle pores it was used before as a medicinal
additive to absorb oily drugs and to improve the dissolution and compression properties
of drugs (Asano et al., 1997).
.
FIG 1.4.: SCANNING ELECTRON MICROSCOPE PICTURE OF CALCIUM SILICATE (Florite RE®
or FLR). SCALE: 4100X
[2CaO.3SiO2.mSiO2.nH2O (1<m<2; 2<n<3)] at 4100X (Sharma et al., 2005)
Tableting studies of unloaded porous calcium silicate show actually really good
results. FLR has high plasticity and a low elastic recovery during the compression cycle.
On top of that most of the energy during the process is consumed by plastic
deformation and brittle fracture of the particles. Because of these properties FLR tablets
show high hardness, which is very important parameter in tablet formulation. The
reason for the good compressibility of this material can be found in its porous structure
(Asano et al., 1997).
To formulate the tablets, the loaded microparticles were directly compressed
with lactose IP, primogel, PVP‐K30 and magnesium stearate IP as excipients. The tablets
were evaluated by measuring their thickness, hardness, disintegration time and
friability. These results were compared with a commercial available tablet (Figure 1.5.).
11
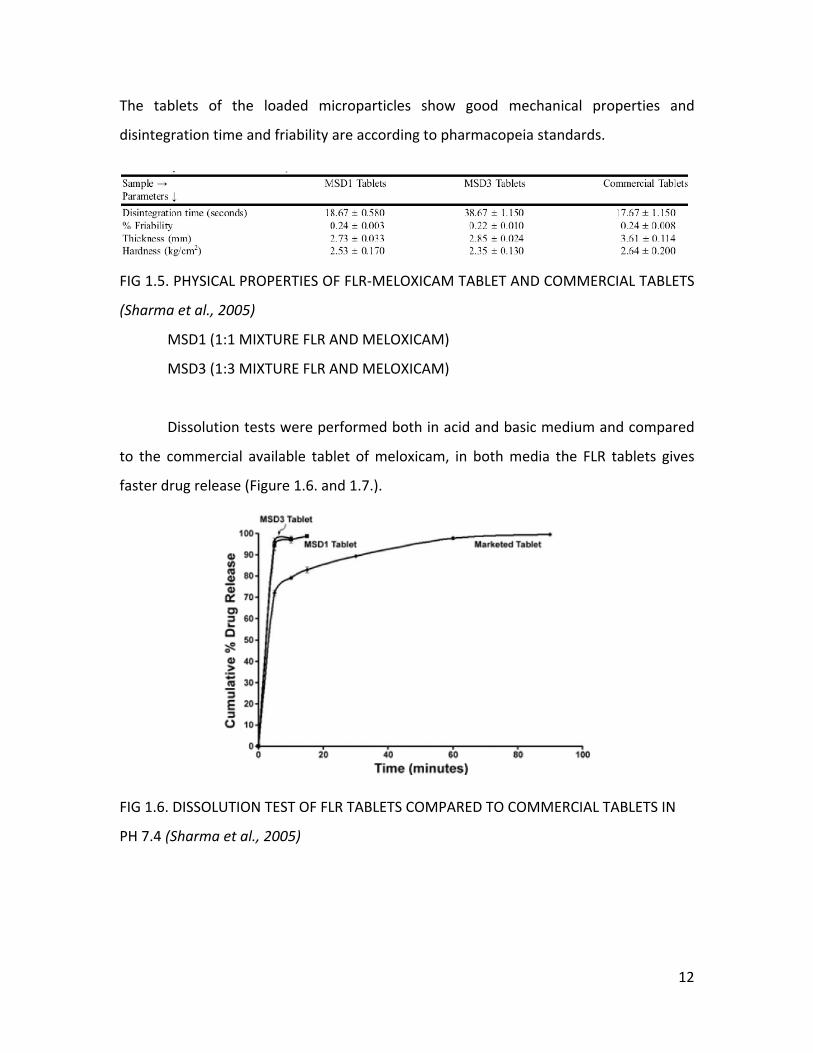
The tablets of the loaded microparticles show good mechanical properties and
disintegration time and friability are according to pharmacopeia standards.
FIG 1.5. PHYSICAL PROPERTIES OF FLR‐MELOXICAM TABLET AND COMMERCIAL TABLETS
(Sharma et al., 2005)
MSD1 (1:1 MIXTURE FLR AND MELOXICAM)
MSD3 (1:3 MIXTURE FLR AND MELOXICAM)
Dissolution tests were performed both in acid and basic medium and compared
to the commercial available tablet of meloxicam, in both media the FLR tablets gives
faster drug release (Figure 1.6. and 1.7.).
FIG 1.6. DISSOLUTION TEST OF FLR TABLETS COMPARED TO COMMERCIAL TABLETS IN
PH 7.4 (Sharma et al., 2005)
12
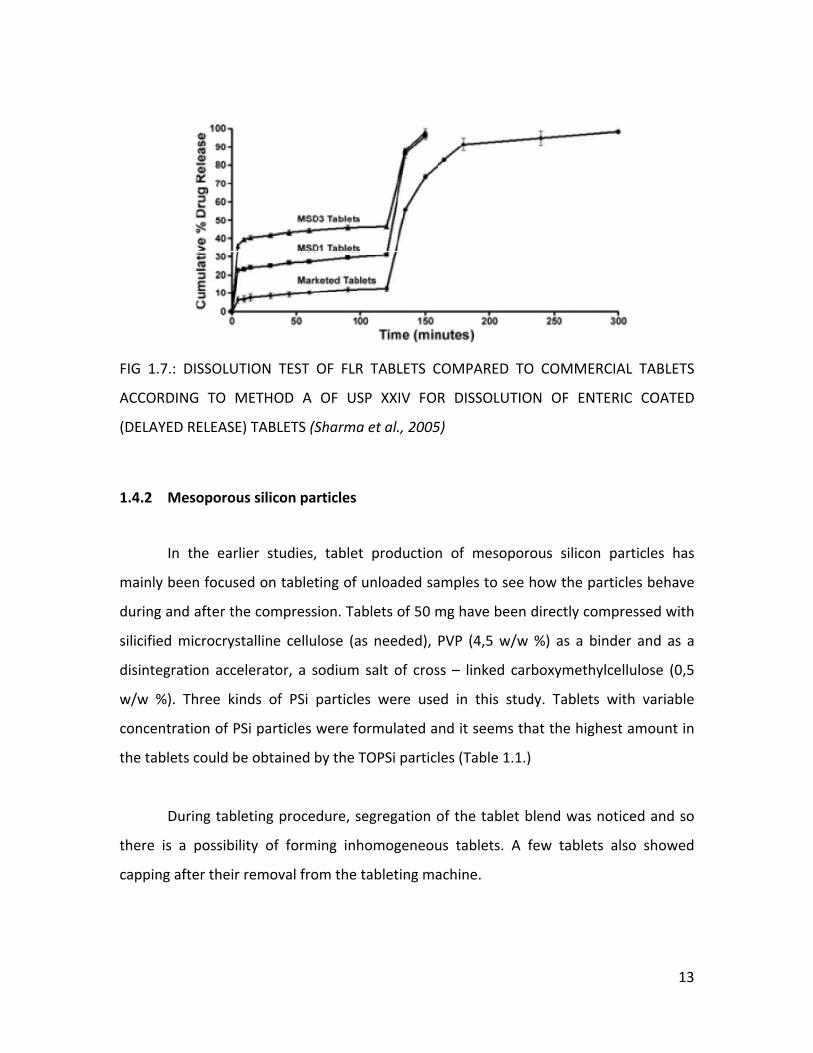
FIG 1.7.: DISSOLUTION TEST OF FLR TABLETS COMPARED TO COMMERCIAL TABLETS
ACCORDING TO METHOD A OF USP XXIV FOR DISSOLUTION OF ENTERIC COATED
(DELAYED RELEASE) TABLETS (Sharma et al., 2005)
1.4.2 Mesoporous silicon particles
In the earlier studies, tablet production of mesoporous silicon particles has
mainly been focused on tableting of unloaded samples to see how the particles behave
during and after the compression. Tablets of 50 mg have been directly compressed with
silicified microcrystalline cellulose (as needed), PVP (4,5 w/w %) as a binder and as a
disintegration accelerator, a sodium salt of cross – linked carboxymethylcellulose (0,5
w/w %). Three kinds of PSi particles were used in this study. Tablets with variable
concentration of PSi particles were formulated and it seems that the highest amount in
the tablets could be obtained by the TOPSi particles (Table 1.1.)
During tableting procedure, segregation of the tablet blend was noticed and so
there is a possibility of forming inhomogeneous tablets. A few tablets also showed
capping after their removal from the tableting machine.
13
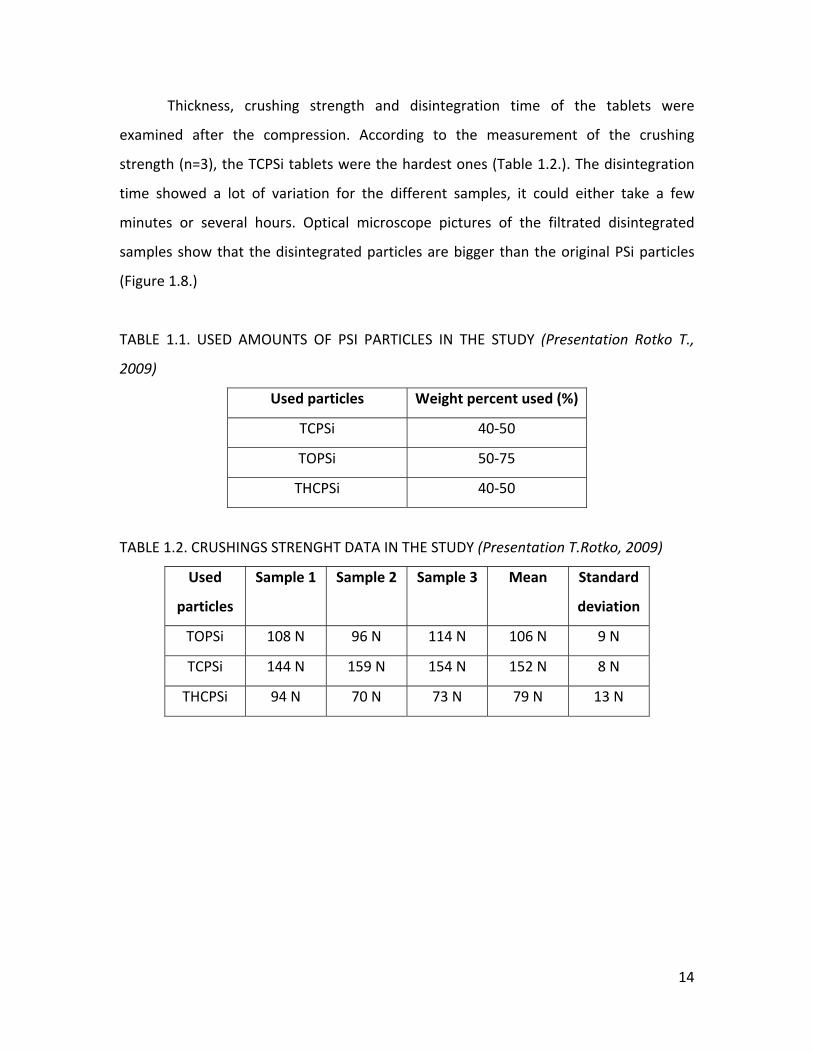
Thickness, crushing strength and disintegration time of the tablets were
examined after the compression. According to the measurement of the crushing
strength (n=3), the TCPSi tablets were the hardest ones (Table 1.2.). The disintegration
time showed a lot of variation for the different samples, it could either take a few
minutes or several hours. Optical microscope pictures of the filtrated disintegrated
samples show that the disintegrated particles are bigger than the original PSi particles
(Figure 1.8.)
TABLE 1.1. USED AMOUNTS OF PSI PARTICLES IN THE STUDY (Presentation Rotko T.,
2009)
Used particles Weight percent used (%)
TCPSi 40‐50
TOPSi 50‐75
THCPSi 40‐50
TABLE 1.2. CRUSHINGS STRENGHT DATA IN THE STUDY (Presentation T.Rotko, 2009)
Used
particles
Sample 1 Sample 2 Sample 3 Mean Standard
deviation
TOPSi 108 N 96 N 114 N 106 N 9 N
TCPSi 144 N 159 N 154 N 152 N 8 N
THCPSi 94 N 70 N 73 N 79 N 13 N
14
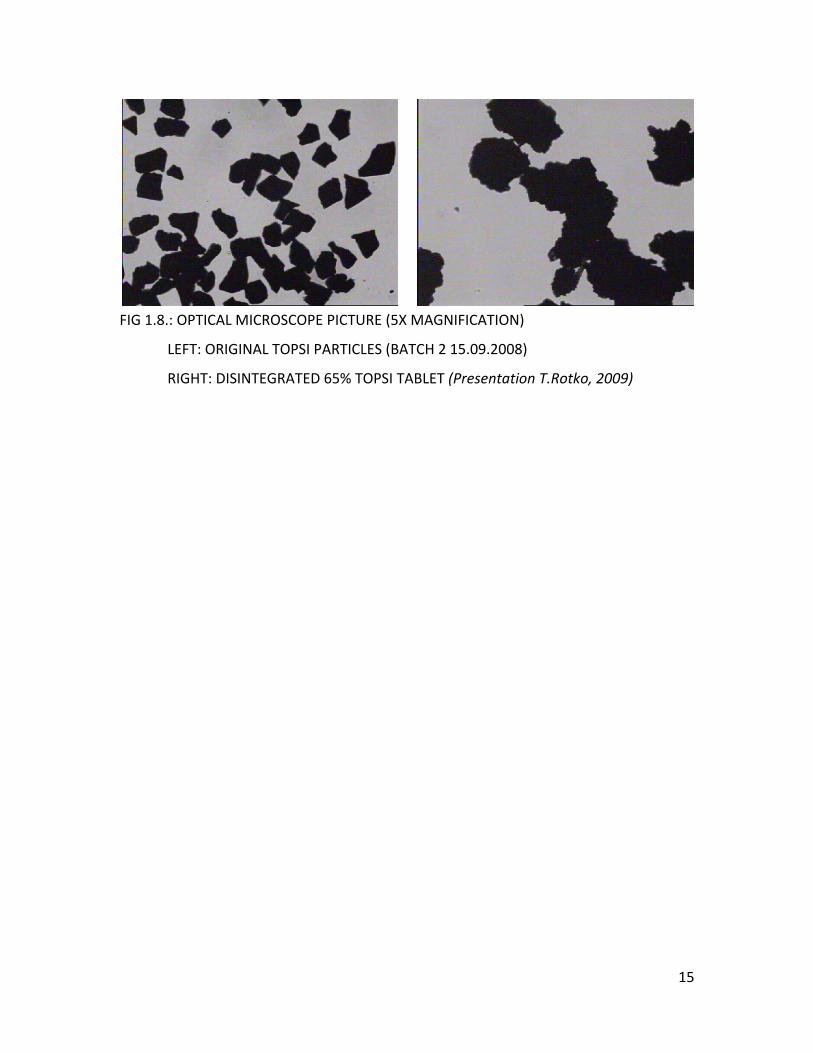
FIG 1.8.: OPTICAL MICROSCOPE PICTURE (5X MAGNIFICATION)
LEFT: ORIGINAL TOPSI PARTICLES (BATCH 2 15.09.2008)
RIGHT: DISINTEGRATED 65% TOPSI TABLET (Presentation T.Rotko, 2009)
15
2 THE AIMS OF THE STUDY
The main purpose of this Master’s thesis was to formulate drug loaded silica micro ‐
particles into a tablet form, as it is of great importance to create an oral applicable
dosage form for this drug delivery system.
Before my participation in the study, only the compression of unloaded particles
was studied. The actual compression was not the main focus in this study, but the
compression data were important to characterize the tablets, so at first the thickness
and crushing strength of the tablets were measured. During the compression the forces
upon the powder bed were monitored.
To examine if the surface of the tablets was damaged and/or if they showed
evidence of lamination or capping a friability test was performed, as well to investigate
if the tablets were mechanically strong enough.
The most important part of this study was to evaluate the drug release from the
mesoporous particle tablets. For this purpose, disintegration and dissolution tests were
performed. The dissolution tests were actually the most essential element of this study.
The drug release profile of the tablets should resemble the profile of the pure
mesoporous particles. The dissolution behaviour from the particles could eventually be
improved by the addition of certain excipients in the tablets. There were thought that
the particles could eventually break during the compression or that the excipients could
block the pores, which both could give a negative effect on the dissolution behaviour.
After dissolution and disintegration tests, the filtrated samples were investigated
with optical and electron microscopes. These images were compared to the pure
particles to discover eventual modifications formed during these experiments or during
the compression.
16
3 MATERIALS AND METHODS
3.1 MATERIALS
The mesoporous silicon particles were fabricated and loaded at the University of
Turku, Finland. The thermally oxidized type was always used based on the preliminary
studies with the empty PSi particles since the TOPSi tablets could have the highest
concentration of PSi particles. This is quite important for the further research as the
purpose is to increase the amount of TOPSi particles in the tablets.
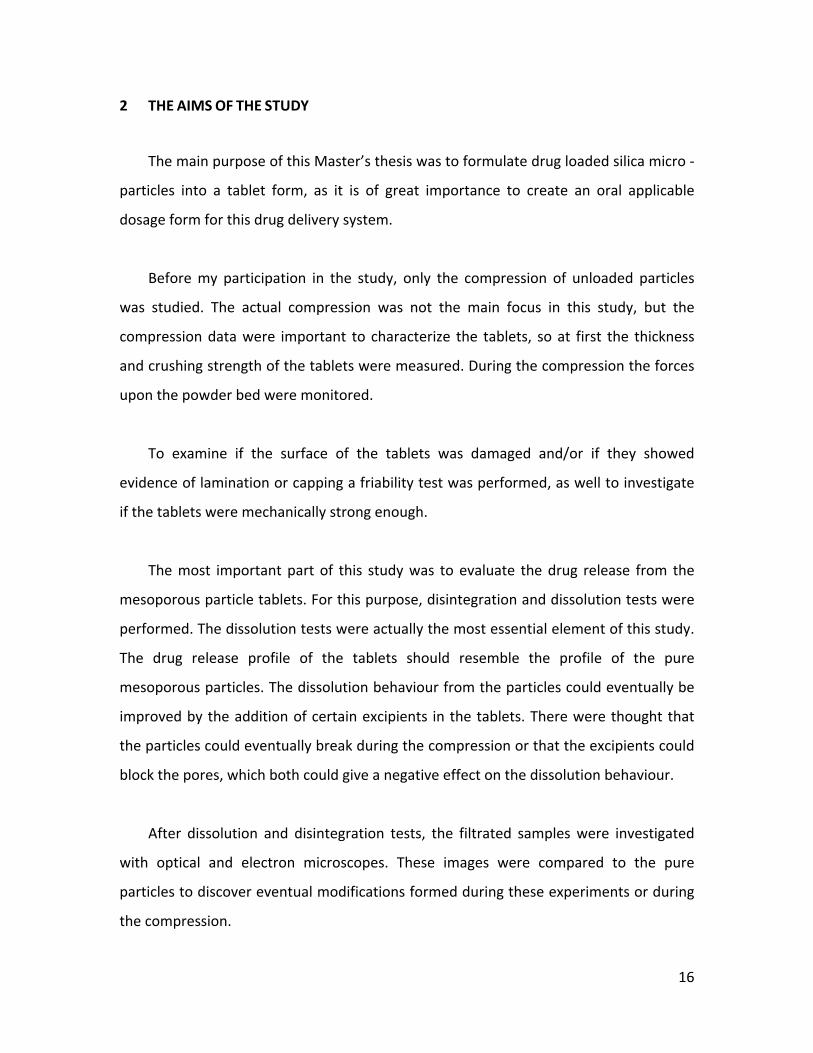
The particles were either loaded with Ibuprofen or Indomethacin. They were
kept in storage in desiccators and used as received. The particles loaded with
Indomethacin were protected from light since it is sensitive to breakdown under the
influence of light.
FIG 3.1.: OPTICAL MICROSCOPE PICTURE TOPSI PARTICLES (MAGNIFICATION 5X)
LEFT: TOPSi PARTICLES LOADED WITH IBUPROFEN BEFORE COMPRESSION
RIGHT: TOPSi PARTICLES LOADED WITH INDOMETHACIN BEFORE
COMPRESSION
Lactose monohydrate (Pharmatose DMV international, The Netherlands) and
microcrystalline cellulose (Avicel PH102, FMC Biopolymer, Ireland) were used as filling
agents. AcDiSol (FMC Biopolymer, Ireland), a sodium salt of carboxymethylcellulose, was
17
used as a disintegration accelerator. As a binder PVP was used (Kolidon 30, Bast
Corporation, Germany). All the excipients were used as received.
The tablet composition was the same for the Ibuprofen and the Indomethacin
series:
‐ 20% (w/w) of drug loaded TOPSi particles
‐ 1.5% (w/w) of disintegration accelerator
‐ 4.5% (w/w) of PVP
‐ 30% (w/w) of MCC
‐ 44% (w/w) of lactose monohydrate
3.2 METHODS
3.2.1 Tableting
The PSi particles were dry mixed together with the excipients, this was done
manually with a spoon and by shaking.
Tablets were directly compressed using a manual single ‐ punch eccentric tablet
machine (Korsch EKO, Berlin, Germany) with 5 mm diameter circular punches with flat
faces. The powder for the tablet (50 mg or 30 mg) was weighed before every
compression and poured manually into the die. The tablet mold was lubricated with a
5% (w/w) magnesium‐stearate (Yliopiston Apteekki, Helsinki, Finland) in acetone (Fluka
Aceton) solution before every compression. The upper and lower compression forces
were monitored during tableting (Single Station DAAS measure). The tableting
procedure was performed in a relative humidity controlled room.
After the compression the tablets were kept in a storage room, the TOPSi –
indomethacin tablets were protected from light.
18
3.2.2 HPLC analyses
HPLC (Agilent Technologies 1100 series) analyses were fulfilled on the TOPSi‐
Indomethacin particles to evaluate the drug release in different media. The used media
were pH 1.2 (0.2M HCl –KCl), pH 7.4(phosphate buffer) and ethanol. The buffer solutions
were prepared according to the USP. About 1 mg of particles were dissolved in ten
millilitres of pH 7.4 and ethanol. As the solubility (Table 3.1.) of Indomethacin is lower in
pH 1.2, only 150 µg – 250 µg particles were dissolved in 50 millilitres. The samples were
stirred overnight, protected from light.
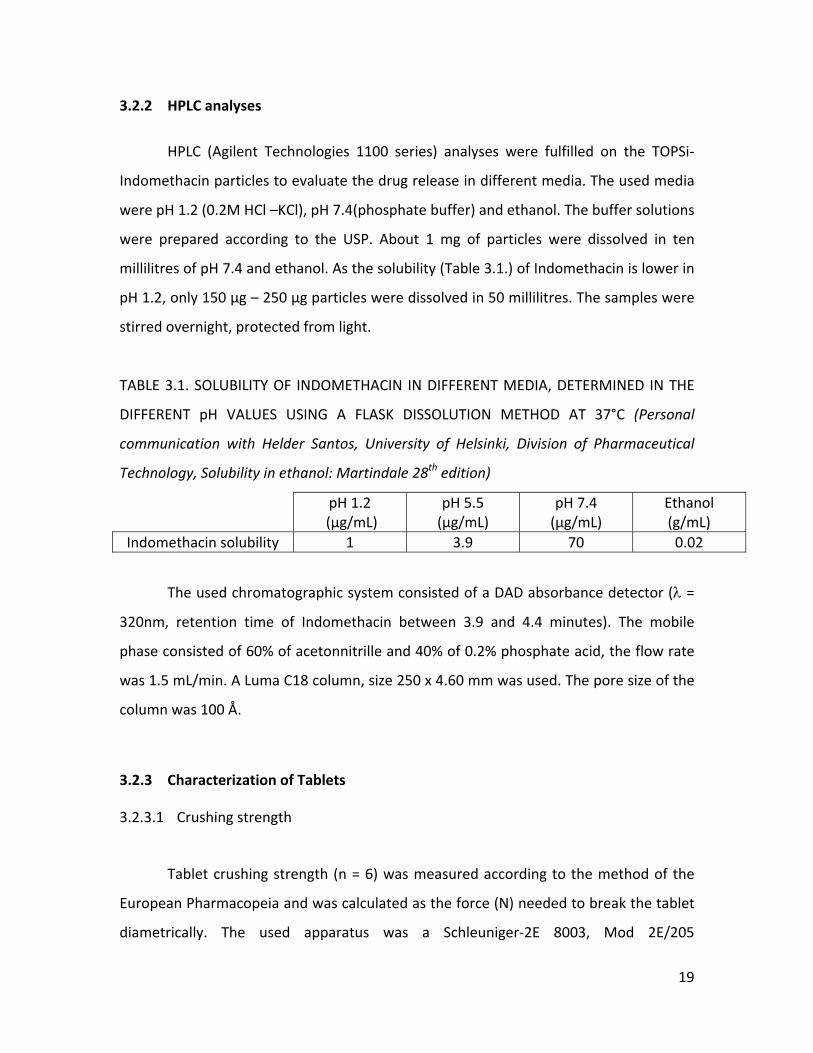
TABLE 3.1. SOLUBILITY OF INDOMETHACIN IN DIFFERENT MEDIA, DETERMINED IN THE
DIFFERENT pH VALUES USING A FLASK DISSOLUTION METHOD AT 37°C (Personal
communication with Helder Santos, University of Helsinki, Division of Pharmaceutical
Technology, Solubility in ethanol: Martindale 28th edition)
pH 1.2 (µg/mL)
pH 5.5 (µg/mL)
pH 7.4 (µg/mL)
Ethanol (g/mL)
Indomethacin solubility 1 3.9 70 0.02
The used chromatographic system consisted of a DAD absorbance detector (λ =
320nm, retention time of Indomethacin between 3.9 and 4.4 minutes). The mobile
phase consisted of 60% of acetonnitrille and 40% of 0.2% phosphate acid, the flow rate
was 1.5 mL/min. A Luma C18 column, size 250 x 4.60 mm was used. The pore size of the
column was 100 Å.
3.2.3 Characterization of Tablets
3.2.3.1 Crushing strength
Tablet crushing strength (n = 6) was measured according to the method of the
European Pharmacopeia and was calculated as the force (N) needed to break the tablet
diametrically. The used apparatus was a Schleuniger‐2E 8003, Mod 2E/205
19
(Switzerland). Samples were measured in a relative humidity controlled room, at least
one day after the fabrication. The crushing strength was also monitored during tableting
to obtain tablets with the acceptable crushing strengths.
3.2.3.2 Thickness
Tablet thickness (Sony Magnescale Inc, serial number 100774, Japan) was
measured directly after the compression in a relative humidity controlled room.
3.2.3.3 Friability
Tablet friability was measured according to the method of the European
Pharmacopeia for uncoated tablets (for tablets up to 0.65g rotate the drum 100 times
with 20 tablets). The test was performed in a Sotax Friabilator USP (Basel, Switzerland)
3.2.3.4 Disintegration test
The disintegration time (n=3) of the tablets was determined using the method
and apparatus (Sotax DT3, Basel, Switzerland) according to the European Pharmacopeia.
The used medium was purified water at a temperature of 37°C ± 0.5°C. Afterwards
samples were filtrated and kept in storage. Optical microscope (Leica DMLB,
Germany)/TEM analysis was performed on the residue.
3.2.3.5 Dissolution test
All dissolution tests were performed using a paddle type dissolution apparatus
(Erweka DT‐D6, Heusenstamm, Germany). 1000 mL of a buffer solution was used as a
dissolution medium, for Ibuprofen pH 1.2 (0.2M HCl‐KCl) was used, while the tests for
Indomethacin were performed in pH 5.5 (Neutralized Phthalate Buffer). All buffer
solutions were prepared according to the USP. The medium was heated at 37°C ± 0.5˚C
20
and kept at this temperature during the experiment. The paddle speed was 100 rpm.
Samples (5mL) were taken every 20 seconds during the first minute, afterwards every
minute until 15 minutes time. To follow the drug release after longer period, samples
were taken after 30 minutes and 1 hour time. After taking each sample, the volume was
replaced by the same volume of the equilibrated buffer solution at 37°C ± 0.5˚C. The
samples were always manually taken from the same place and height in the vessel.
Tests with Indomethacin powder and TOPSi – Indomethacin were performed by
weighing an amount into capsule number 0. A metal wire was girdled around the
capsule to ensure that the capsule settled down in the vessel.
The samples were analyzed with a UV spectrophotometer (Pharmacia LKB
Ultrospec III, Sweden). In case of experiments with tablets or TOPSi particles, the
samples were filtrated trough a filter with pore size 0.45µm (Sartorius biotech GmbH,
Goettingen, Germany) before the UV ‐ measurement. The wavelength for the Ibuprofen
samples was 221 nm (USP, monograph for Ibuprofen tablets), the wavelength for the
Indomethacin samples was 318 nm (USP, monograph of Indomethacin).
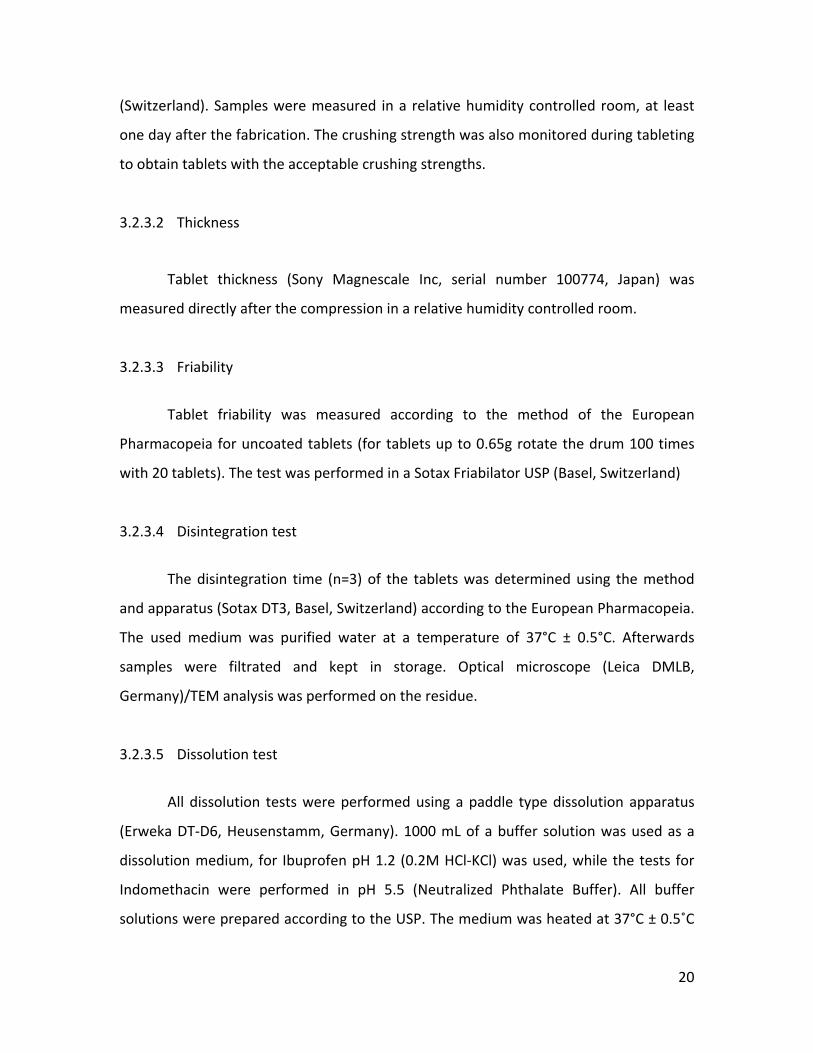
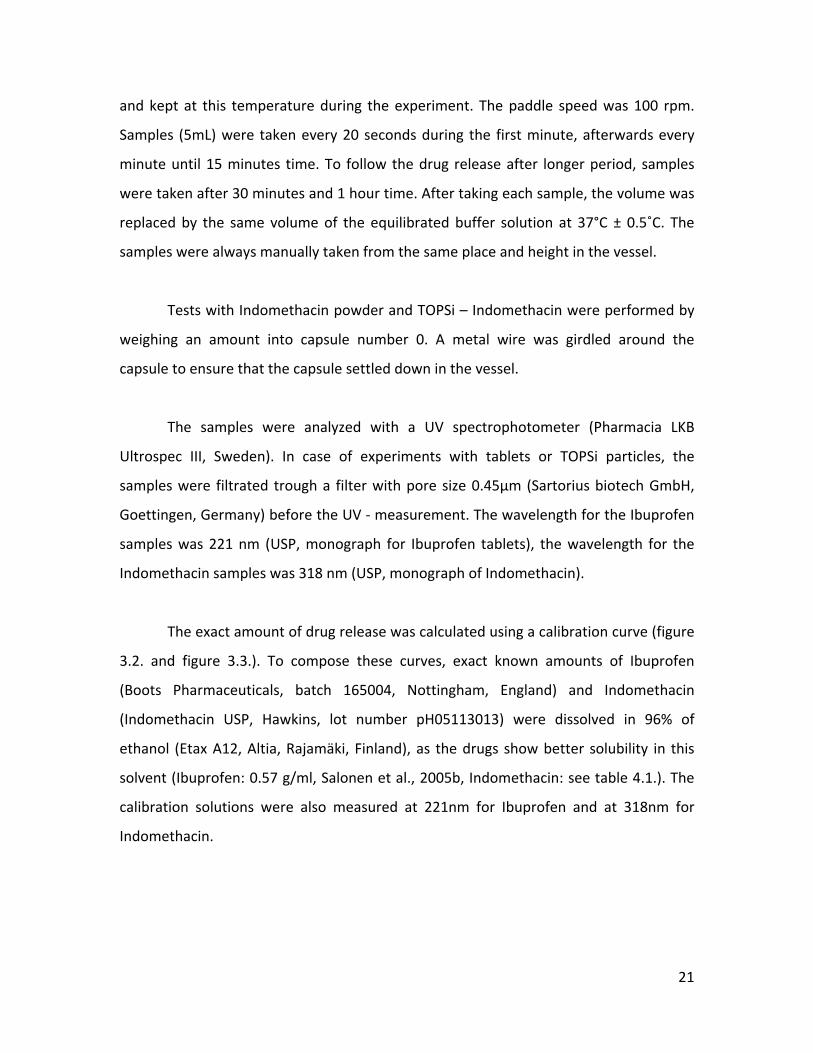
The exact amount of drug release was calculated using a calibration curve (figure
3.2. and figure 3.3.). To compose these curves, exact known amounts of Ibuprofen
(Boots Pharmaceuticals, batch 165004, Nottingham, England) and Indomethacin
(Indomethacin USP, Hawkins, lot number pH05113013) were dissolved in 96% of
ethanol (Etax A12, Altia, Rajamäki, Finland), as the drugs show better solubility in this
solvent (Ibuprofen: 0.57 g/ml, Salonen et al., 2005b, Indomethacin: see table 4.1.). The
calibration solutions were also measured at 221nm for Ibuprofen and at 318nm for
Indomethacin.
21
y = R²
0
0,1
0,2
0,3
0,4
0,5
0,6
0,7
0,8
0,9
0 0,005 0,01 0,015 0,02
Absorba
nce at 221nm
Concentration of Ibuprofen in EtOH (mg/mL)
Calibration curve of Ibuprofen in e
40,369x + 0,001 = 0,9998
0,025
thanol
FIG 3.2.: CALIBRATION CURVE OF PURE IBUPROFEN IN 96% OF ETHANOL
y =
0
0,1
0,2
0,3
0,4
0,5
0,6
0,7
0,8
0,9
0 0,01 0,02 0,03 0,04
Absorba
nce at 318nm
Concentration of Indomethacine in EtOH
Calibration curve of indomethacine ethanol
16,653x ‐ 0,0024R² = 0,9999
0,05 0,06
(mg/mL)
in
FIG 3.3.: CALIBRATION CURVE OF PURE INDOMETHACINE IN 96% OF ETHANOL
22
To calculate the recovery after the dissolution test, the medium was filtrated.
The filters (Whatman Schleicher & Schuell, number 5) were dried overnight and
afterward the powder residue was dissolved in 25mL of 96% ethanol (Etax A12, Altia,
Rajamäki, Finland). The samples were stirred, and afterwards measured with the
spectrophotometer at the same wavelengths as described above. Before the UV
measurement the samples were again filtrated.
3.2.4 Transmission electron microscope (TEM)
The samples were made by dispersing (4‐6 µL water) powder of pure TOPSi
particles and disintegrated tablets on a cupper, small plate, coated with a carbon layer.
Images (FEI Tecnia F12, Philips Electron Optics, The Netherlands) were taken the next
day, as the samples need to dry for at least one night. The used camera was a Gatan
Multiscan 794 1k x 1k CCD (Gatan Inc., USA).
(http://www.biocenter.helsinki.fi/bi/EM/f12.htm)
23
4 RESULTS AND DISCUSSION
The tablet blends were made a day before (kept in a storage room) or the same
date as when the compressions were performed. As they were mixed manually, it is
possible that the blends were not completely homogeneous. For all tablet blends, both
for the Indomethacin as the Ibuprofen tablets, segregation of the components was
noticed, which might lead to an inhomogeneous blend and inhomogeneous tablets. In
the preliminary studies, no lubricants were used, which in part might have increased the
segregation.
4.1 TOPSi –IBUPROFEN TABLETS
Four different series of TOPSi – Ibuprofen tablets were compressed. The first
series (Table 4.1.) was a test compression, as the used batch of loaded TOPSi – particles
was quite old (batch from year 2007). Nine tablets were made in total. The punch
settings were adjusted by changing the distance of the upper punch until acceptable
crushing strengths (Table 4.2.) were obtained. The lower punch was set upon 10.8 mm,
the upper one was set a bit lower than 8.2 mm.
Only a disintegration test was performed for this series of tablets, as we were
not sure if the quality of the particles was still good. Tablet 5, 6 and 8 were randomly
chosen and all three tablets had a disintegration time of about 2 minutes which falls
within the limits stated by the European pharmacopeia for immediate release tablets.
The average thickness of the tablets measured during compression was 2.012 ± 0.145
cm. It is hard to interpret the result of the crushing strengths as the compression forces
of tablet 3 could not be written down as the tableting machine got stuck due to the too
high adjustment of the upper punch (9mm). For tablet 4 the lower force is missing as
the program used for monitoring the forces doesn’t save the data and forces needed to
be written down very quickly after the compression. This also happened with the other
24
series but these tablets were not selected to study their crushing strengths. Tablet 2 was
mechanical so weak that it broke when the thickness was measured.
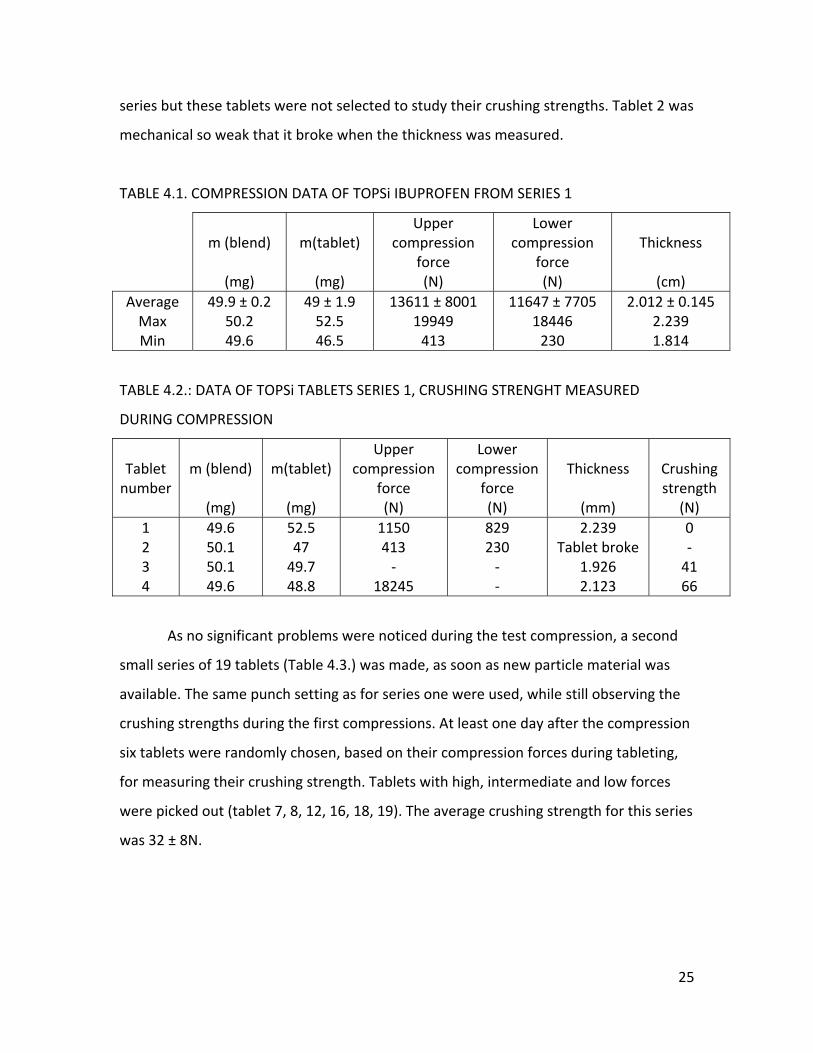
TABLE 4.1. COMPRESSION DATA OF TOPSi IBUPROFEN FROM SERIES 1
m (blend)
(mg)
m(tablet)
(mg)
Upper compression
force (N)
Lower compression
force (N)
Thickness
(cm)
AverageMax Min
49.9 ± 0.2 50.2 49.6
49 ± 1.9 52.5 46.5
13611 ± 8001 19949 413
11647 ± 7705 18446 230
2.012 ± 0.145 2.239 1.814
TABLE 4.2.: DATA OF TOPSi TABLETS SERIES 1, CRUSHING STRENGHT MEASURED
DURING COMPRESSION
Tablet number
m (blend)
(mg)
m(tablet)
(mg)
Upper compression
force (N)
Lower compression
force (N)
Thickness
(mm)
Crushing strength
(N) 1 2 3 4
49.6 50.1 50.1 49.6
52.5 47 49.7 48.8
1150 413 ‐
18245
829 230 ‐ ‐
2.239 Tablet broke
1.926 2.123
0 ‐ 41 66
As no significant problems were noticed during the test compression, a second
small series of 19 tablets (Table 4.3.) was made, as soon as new particle material was
available. The same punch setting as for series one were used, while still observing the
crushing strengths during the first compressions. At least one day after the compression
six tablets were randomly chosen, based on their compression forces during tableting,
for measuring their crushing strength. Tablets with high, intermediate and low forces
were picked out (tablet 7, 8, 12, 16, 18, 19). The average crushing strength for this series
was 32 ± 8N.
25
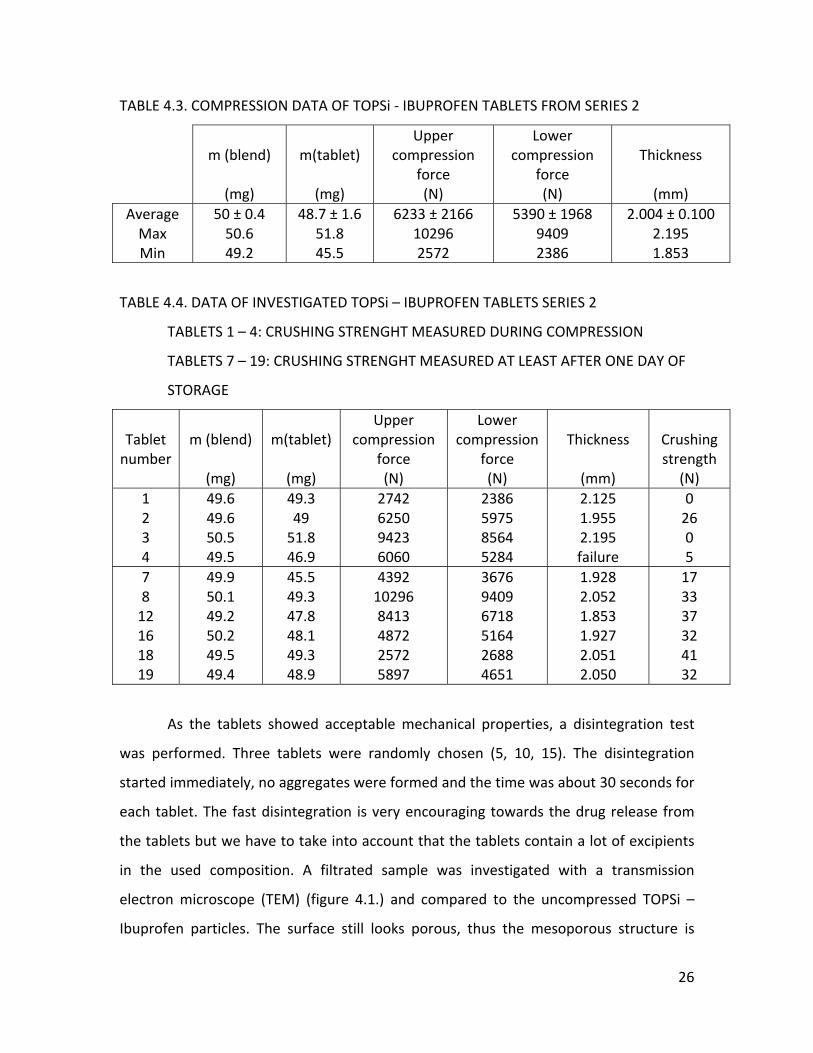
TABLE 4.3. COMPRESSION DATA OF TOPSi ‐ IBUPROFEN TABLETS FROM SERIES 2
m (blend)
(mg)
m(tablet)
(mg)
Upper compression
force (N)
Lower compression
force (N)
Thickness
(mm)
AverageMax Min
50 ± 0.4 50.6 49.2
48.7 ± 1.6 51.8 45.5
6233 ± 2166 10296 2572
5390 ± 1968 9409 2386
2.004 ± 0.100 2.195 1.853
TABLE 4.4. DATA OF INVESTIGATED TOPSi – IBUPROFEN TABLETS SERIES 2
TABLETS 1 – 4: CRUSHING STRENGHT MEASURED DURING COMPRESSION
TABLETS 7 – 19: CRUSHING STRENGHT MEASURED AT LEAST AFTER ONE DAY OF
STORAGE
Tablet number
m (blend)
(mg)
m(tablet)
(mg)
Upper compression
force (N)
Lower compression
force (N)
Thickness
(mm)
Crushing strength
(N) 1 2 3 4
49.6 49.6 50.5 49.5
49.3 49 51.8 46.9
2742 6250 9423 6060
2386 5975 8564 5284
2.125 1.955 2.195 failure
0 26 0 5
7 8 12 16 18 19
49.9 50.1 49.2 50.2 49.5 49.4
45.5 49.3 47.8 48.1 49.3 48.9
4392 10296 8413 4872 2572 5897
3676 9409 6718 5164 2688 4651
1.928 2.052 1.853 1.927 2.051 2.050
17 33 37 32 41 32
As the tablets showed acceptable mechanical properties, a disintegration test
was performed. Three tablets were randomly chosen (5, 10, 15). The disintegration
started immediately, no aggregates were formed and the time was about 30 seconds for
each tablet. The fast disintegration is very encouraging towards the drug release from
the tablets but we have to take into account that the tablets contain a lot of excipients
in the used composition. A filtrated sample was investigated with a transmission
electron microscope (TEM) (figure 4.1.) and compared to the uncompressed TOPSi –
Ibuprofen particles. The surface still looks porous, thus the mesoporous structure is
26
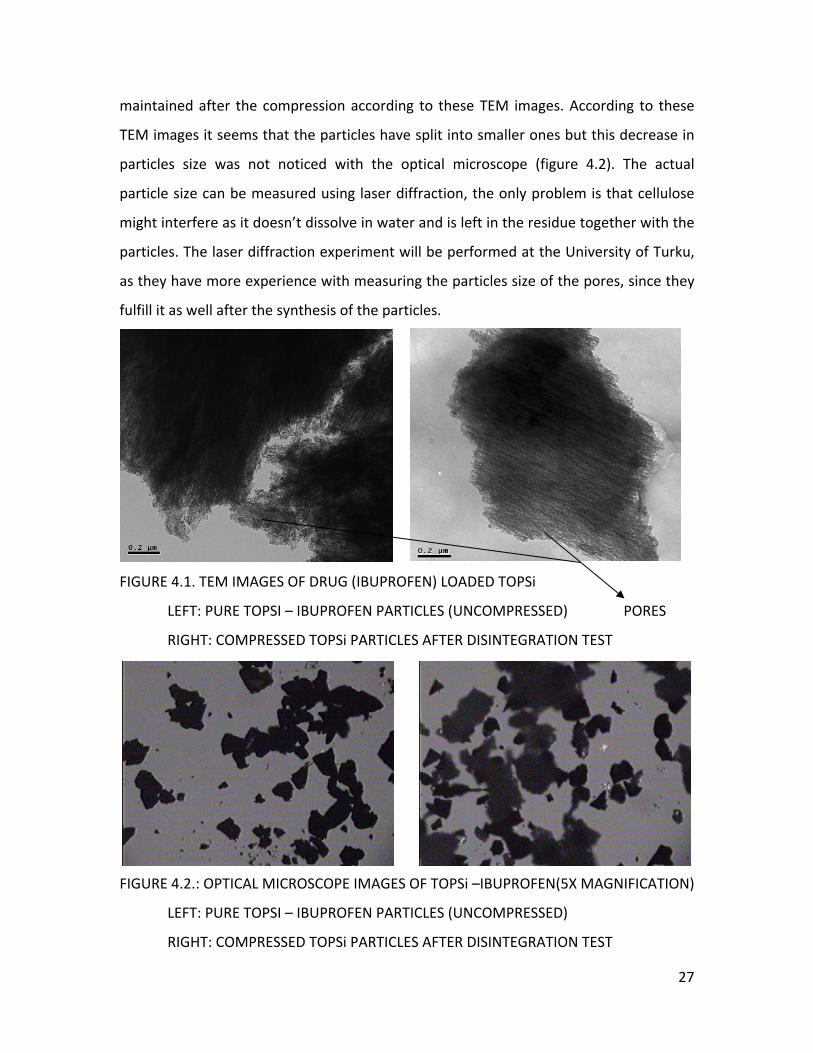
maintained after the compression according to these TEM images. According to these
TEM images it seems that the particles have split into smaller ones but this decrease in
particles size was not noticed with the optical microscope (figure 4.2). The actual
particle size can be measured using laser diffraction, the only problem is that cellulose
might interfere as it doesn’t dissolve in water and is left in the residue together with the
particles. The laser diffraction experiment will be performed at the University of Turku,
as they have more experience with measuring the particles size of the pores, since they
fulfill it as well after the synthesis of the particles.
FIGURE 4.1. TEM IMAGES OF DRUG (IBUPROFEN) LOADED TOPSi
LEFT: PURE TOPSI – IBUPROFEN PARTICLES (UNCOMPRESSED) PORES
RIGHT: COMPRESSED TOPSi PARTICLES AFTER DISINTEGRATION TEST
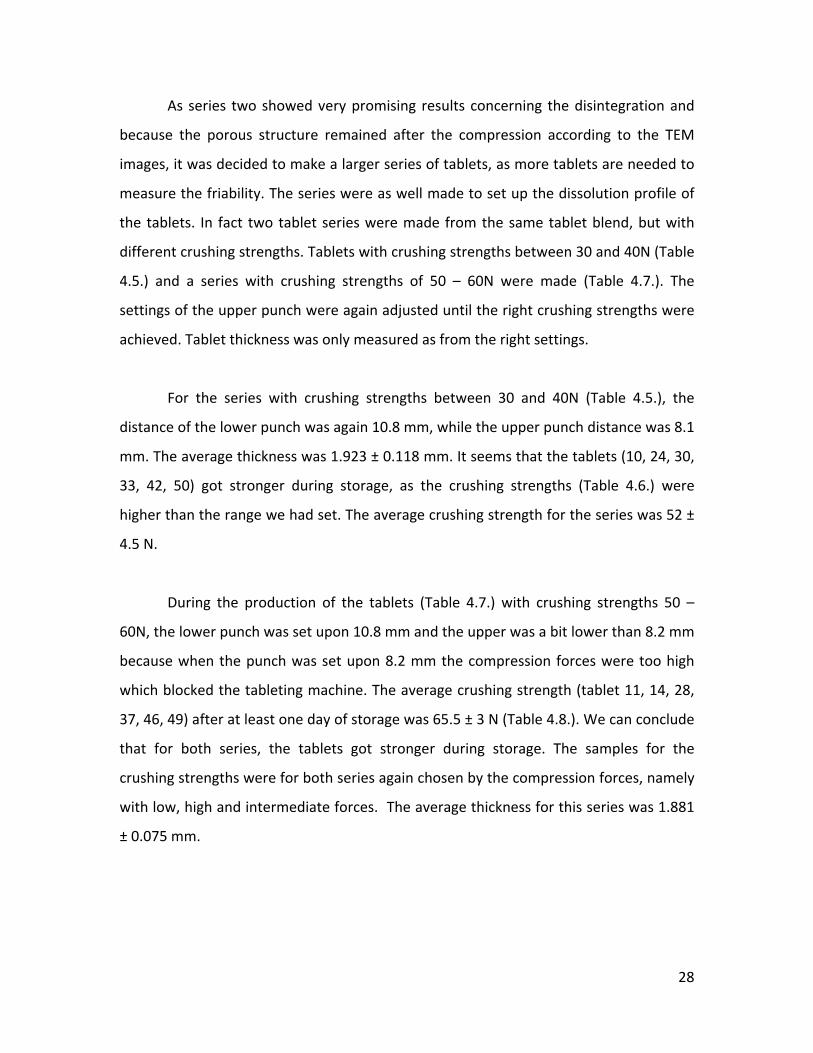
FIGURE 4.2.: OPTICAL MICROSCOPE IMAGES OF TOPSi –IBUPROFEN(5X MAGNIFICATION)
LEFT: PURE TOPSI – IBUPROFEN PARTICLES (UNCOMPRESSED)
RIGHT: COMPRESSED TOPSi PARTICLES AFTER DISINTEGRATION TEST
27
As series two showed very promising results concerning the disintegration and
because the porous structure remained after the compression according to the TEM
images, it was decided to make a larger series of tablets, as more tablets are needed to
measure the friability. The series were as well made to set up the dissolution profile of
the tablets. In fact two tablet series were made from the same tablet blend, but with
different crushing strengths. Tablets with crushing strengths between 30 and 40N (Table
4.5.) and a series with crushing strengths of 50 – 60N were made (Table 4.7.). The
settings of the upper punch were again adjusted until the right crushing strengths were
achieved. Tablet thickness was only measured as from the right settings.
For the series with crushing strengths between 30 and 40N (Table 4.5.), the
distance of the lower punch was again 10.8 mm, while the upper punch distance was 8.1
mm. The average thickness was 1.923 ± 0.118 mm. It seems that the tablets (10, 24, 30,
33, 42, 50) got stronger during storage, as the crushing strengths (Table 4.6.) were
higher than the range we had set. The average crushing strength for the series was 52 ±
4.5 N.
During the production of the tablets (Table 4.7.) with crushing strengths 50 –
60N, the lower punch was set upon 10.8 mm and the upper was a bit lower than 8.2 mm
because when the punch was set upon 8.2 mm the compression forces were too high
which blocked the tableting machine. The average crushing strength (tablet 11, 14, 28,
37, 46, 49) after at least one day of storage was 65.5 ± 3 N (Table 4.8.). We can conclude
that for both series, the tablets got stronger during storage. The samples for the
crushing strengths were for both series again chosen by the compression forces, namely
with low, high and intermediate forces. The average thickness for this series was 1.881
± 0.075 mm.
28
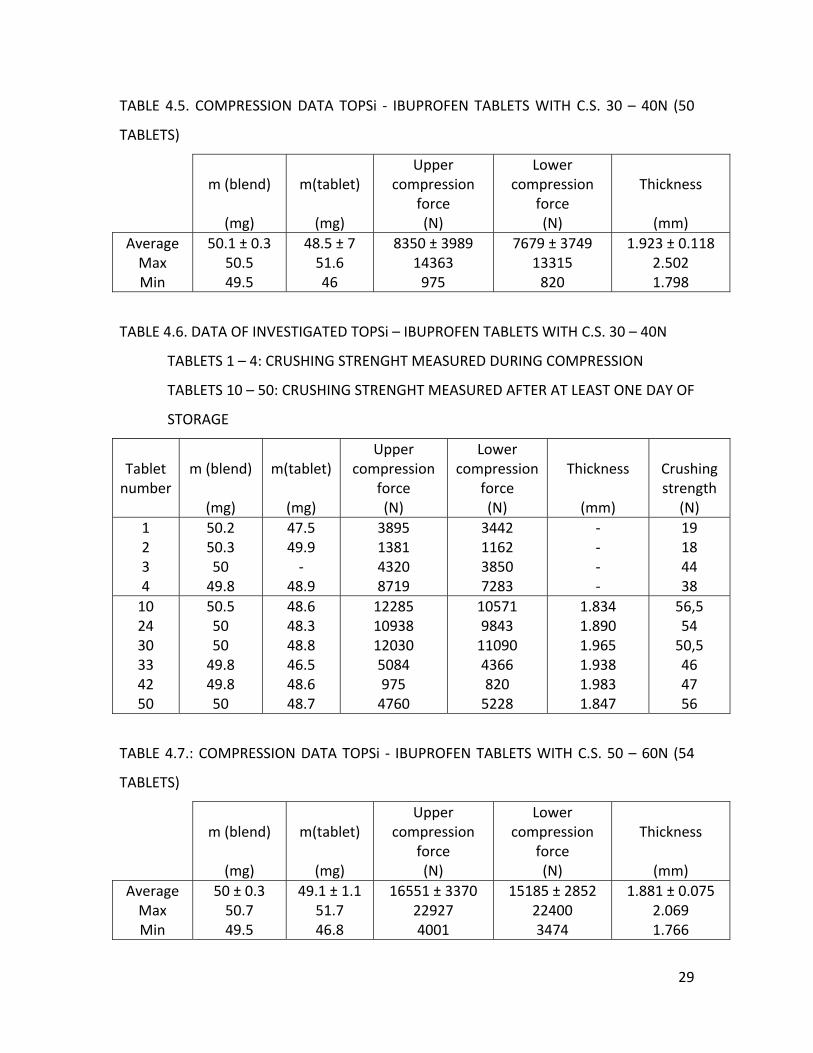
TABLE 4.5. COMPRESSION DATA TOPSi ‐ IBUPROFEN TABLETS WITH C.S. 30 – 40N (50
TABLETS)
m (blend)
(mg)
m(tablet)
(mg)
Upper compression
force (N)
Lower compression
force (N)
Thickness
(mm)
AverageMax Min
50.1 ± 0.3 50.5 49.5
48.5 ± 7 51.6 46
8350 ± 3989 14363 975
7679 ± 3749 13315 820
1.923 ± 0.118 2.502 1.798
TABLE 4.6. DATA OF INVESTIGATED TOPSi – IBUPROFEN TABLETS WITH C.S. 30 – 40N
TABLETS 1 – 4: CRUSHING STRENGHT MEASURED DURING COMPRESSION
TABLETS 10 – 50: CRUSHING STRENGHT MEASURED AFTER AT LEAST ONE DAY OF
STORAGE
Tablet number
m (blend)
(mg)
m(tablet)
(mg)
Upper compression
force (N)
Lower compression
force (N)
Thickness
(mm)
Crushing strength
(N) 1 2 3 4
50.2 50.3 50 49.8
47.5 49.9 ‐
48.9
3895 1381 4320 8719
3442 1162 3850 7283
‐ ‐ ‐ ‐
19 18 44 38
10 24 30 33 42 50
50.5 50 50 49.8 49.8 50
48.6 48.3 48.8 46.5 48.6 48.7
12285 10938 12030 5084 975 4760
10571 9843 11090 4366 820 5228
1.834 1.890 1.965 1.938 1.983 1.847
56,5 54 50,5 46 47 56
TABLE 4.7.: COMPRESSION DATA TOPSi ‐ IBUPROFEN TABLETS WITH C.S. 50 – 60N (54
TABLETS)
m (blend)
(mg)
m(tablet)
(mg)
Upper compression
force (N)
Lower compression
force (N)
Thickness
(mm)
AverageMax Min
50 ± 0.3 50.7 49.5
49.1 ± 1.1 51.7 46.8
16551 ± 3370 22927 4001
15185 ± 2852 22400 3474
1.881 ± 0.075 2.069 1.766
29
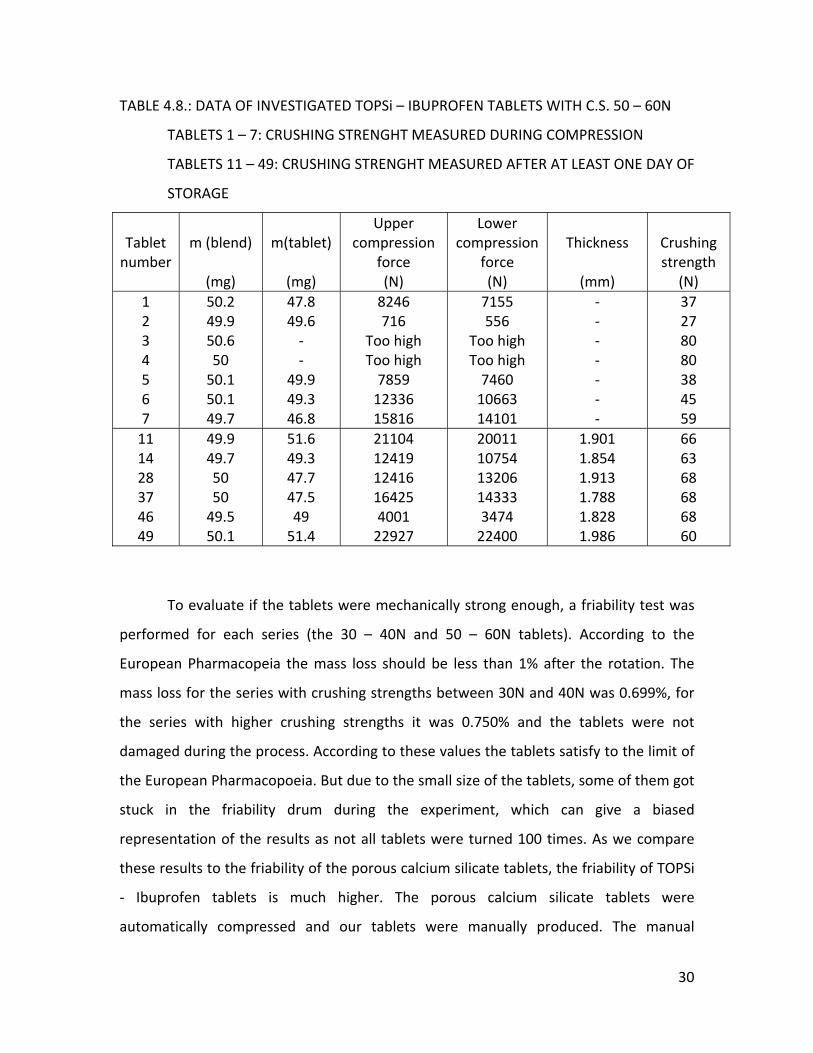
TABLE 4.8.: DATA OF INVESTIGATED TOPSi – IBUPROFEN TABLETS WITH C.S. 50 – 60N
TABLETS 1 – 7: CRUSHING STRENGHT MEASURED DURING COMPRESSION
TABLETS 11 – 49: CRUSHING STRENGHT MEASURED AFTER AT LEAST ONE DAY OF
STORAGE
Tablet number
m (blend)
(mg)
m(tablet)
(mg)
Upper compression
force (N)
Lower compression
force (N)
Thickness
(mm)
Crushing strength
(N) 1 2 3 4 5 6 7
50.2 49.9 50.6 50 50.1 50.1 49.7
47.8 49.6 ‐ ‐
49.9 49.3 46.8
8246 716
Too high Too high 7859 12336 15816
7155 556
Too high Too high 7460 10663 14101
‐ ‐ ‐ ‐ ‐ ‐ ‐
37 27 80 80 38 45 59
11 14 28 37 46 49
49.9 49.7 50 50 49.5 50.1
51.6 49.3 47.7 47.5 49 51.4
21104 12419 12416 16425 4001 22927
20011 10754 13206 14333 3474 22400
1.901 1.854 1.913 1.788 1.828 1.986
66 63 68 68 68 60
To evaluate if the tablets were mechanically strong enough, a friability test was
performed for each series (the 30 – 40N and 50 – 60N tablets). According to the
European Pharmacopeia the mass loss should be less than 1% after the rotation. The
mass loss for the series with crushing strengths between 30N and 40N was 0.699%, for
the series with higher crushing strengths it was 0.750% and the tablets were not
damaged during the process. According to these values the tablets satisfy to the limit of
the European Pharmacopoeia. But due to the small size of the tablets, some of them got
stuck in the friability drum during the experiment, which can give a biased
representation of the results as not all tablets were turned 100 times. As we compare
these results to the friability of the porous calcium silicate tablets, the friability of TOPSi
‐ Ibuprofen tablets is much higher. The porous calcium silicate tablets were
automatically compressed and our tablets were manually produced. The manual
30
production can give more variation in the mechanical properties of the tablets. The
other values cannot be compared, as the porous Calcium Silicate tablets weighed 175mg
so the height of the tablets was higher. The crushing strengths were measured in a
different unit.
As the tablets showed good mechanical properties (crushing strengths just a bit
higher than we wanted), disintegration and dissolution tests were performed.
Disintegration time for 30 – 40N tablet series (tablet 7, 21, 37) was around 1min for
each tablet, while for the mechanically stronger tablets (26, 36, 45) it was almost 3
minutes. Samples were again randomly chosen. The disintegration for both series
started immediately from the whole tablet and aggregation was not noticed. These
results are quite similar to the other tablet series and are logical, as stronger tablets
need more time to disintegrate.
Drug release from the tablets was determined in 1000mL of buffer solution, as
we wanted to work using sink conditions, which means that the buffer volume doesn’t
restrict the dissolution of the drug. To work in these conditions, the maximum amount
of drug that can dissolve from the tablet in the buffer volume is preferably lower than
30% of the maximum solubility. The solubility of Ibuprofen in pH 1.2 is 8.9 µg/mL
(Personal communication with Helder Santos, University of Helsinki, Division of
Pharmaceutical Technology)
For both crushing strength series, it seems that almost all Ibuprofen is released
from the tablet after 20 seconds. The recovery for the 30 ‐ 40N was 6 .3% (n=1, tablet
31) and for the other series the average recovery was 7.0 ± 1.8 % (n=2, tablet 38 and
41). Since the recovery is low, the results of the dissolution test can be trusted, which is
very promising as the solubility of Ibuprofen is very low in this pH. As the pKa of
Ibuprofen is 4.9 (Salonen et al., 2005), it adopts the anionic form in this acid medium.
31
The anionic form has a lower solubility than its ionic form, the latter being formed at
higher pH values.
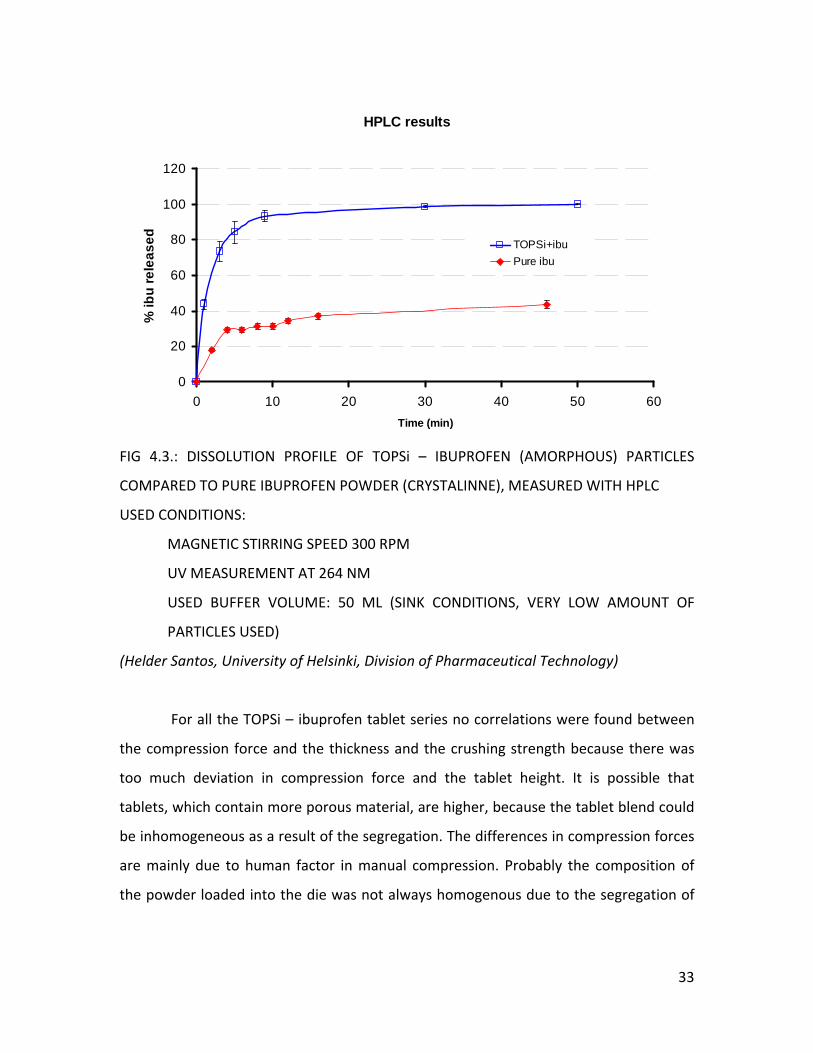
Compared to the TOPSi particles and the Ibuprofen powder the dissolution of
the TOPSi – Ibuprofen tablets is much faster. For the TOPSi particles and the Ibuprofen
powder there is a lag phase in the profile, as the time for the dissolution of the
gelatinous capsule needs to be taken into account (Figure 4.3.). But we must remind
that the results for the tablets can only give an estimation as the production is still on a
very low scale and done manually which gives a high inter – batch variation. This
variation influences all the stages of the process, as the compression, as the dissolution,
as the disintegration.
As the dissolution is enhanced by the tablet form, we can conclude that the
excipients do not block the pores of the TOPSi particles and that the particles are not
fully destroyed during the compression. It is possible that the TOPSi particles are
partially damaged but they do not loosen their capacity to improve dissolution of poorly
soluble drugs. They maintain their porous structure, no damaged particles were noticed
in the sample by TEM.
During the dissolution tests of both series, we noticed that some tablet did not
disintegrate completely and that aggregates were formed. This TOPSi – Ibuprofen blend
already had aggregated during tableting.
32
HPLC results
0
20
40
60
80
100
120
0 10 20 30 40 50 60Time (min)
% ib
u re
leas
ed TOPSi+ibuPure ibu
FIG 4.3.: DISSOLUTION PROFILE OF TOPSi – IBUPROFEN (AMORPHOUS) PARTICLES
SPEED 300 RPM
(SINK CONDITIONS, VERY LOW AMOUNT OF
(Helder of Helsinki, Division of Pharmaceutical Technology)
For all the TOPSi – ibuprofen tablet series no correlations were found between
compression
a
COMPARED TO PURE IBUPROFEN POWDER (CRYSTALINNE), MEASURED WITH HPLC
USED CONDITIONS:
MAGNETIC STIRRING
UV MEASUREMENT AT 264 NM
USED BUFFER VOLUME: 50 ML
PARTICLES USED)
Santos, University
the force and the thickness and the crushing strength because there was
too much deviation in compression force and the tablet height. It is possible that
tablets, which contain more porous material, are higher, bec use the tablet blend could
be inhomogeneous as a result of the segregation. The differences in compression forces
are mainly due to human factor in manual compression. Probably the composition of
the powder loaded into the die was not always homogenous due to the segregation of
33
the blend, which might also cause these fluctuations. To improve reproducibility, further
trials should add lubricants to reduce the amount of segregation and aggregation.
But for the crushing strength values for the series between 30 – 40N and 50 –
60N, we can conclude that the compression forces during tableting did not affect the
values of the crushing strengths as we get acceptable crushing strengths for high,
intermediate and low forces.
4.2 TOPSi – INDOMETHACIN TABLETS
Two seizes of TOPSi – Indomethacin tablets were made, tablets of 50 mg and of
30 mg. The series of 30 mg were especially made to determine the dissolution profile of
Indomethacin as it has a very low solubility and it was too expensive to work in sink
condition with the 50 mg 20% TOPSi tablets (too high volumes of buffer needed).
The setting of the punches for the 50 mg series were again adjusted until
acceptable crushing strengths were obtained. The settings were 10.3 mm for the lower
punch and between 8.1 and 8.2 mm for the upper one. Tablet thickness was measured
during tableting (as from the right settings) (Table 4.9.), the average was 1.910 ± 0.056
mm. Crushing strengths (Table 4.10.) and disintegration time were measured again at
least one day after the production. The mean value for the crushing strength was 53 ±
5N. Samples for the crushing strengths were chosen in the same way as for the other
tablet series and for this 50 mg tablet series we can as well conclude that the
compression forces during tableting do not affect the mechanical strengths of the
tablets, as acceptable crushing strengths are obtained for low, high and intermediate
tableting forces.
The disintegration time (tablets) was once more under the 15 minutes limit of
the European Pharmacopoeia and was about 1 min 30 seconds. The disintegration
34
started immediately and no aggregates were formed as the tablets disintegrated
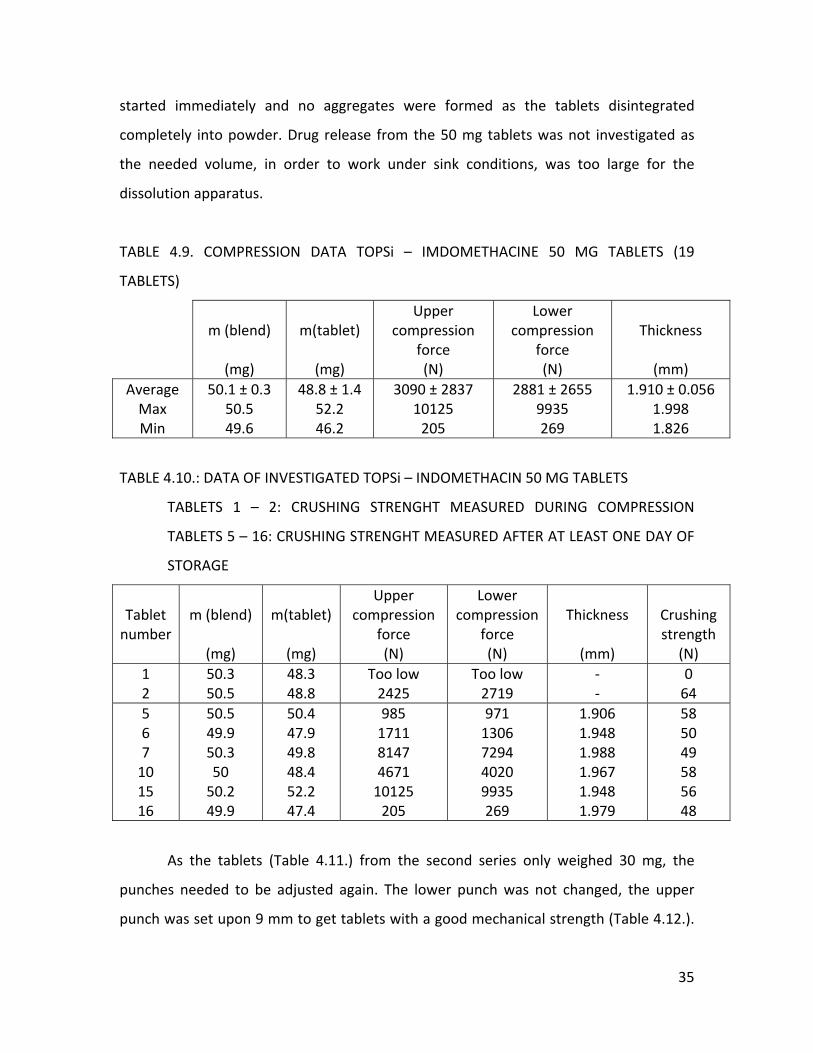
completely into powder. Drug release from the 50 mg tablets was not investigated as
the needed volume, in order to work under sink conditions, was too large for the
dissolution apparatus.
TABLE 4.9. COMPRESSION DATA TOPSi – IMDOMETHACINE 50 MG TABLETS (19
TABLETS)
m (blend)
(mg)
m(tablet)
(mg)
Upper compression
force (N)
Lower compression
force (N)
Thickness
(mm)
AverageMax Min
50.1 ± 0.3 50.5 49.6
48.8 ± 1.4 52.2 46.2
3090 ± 2837 10125 205
2881 ± 2655 9935 269
1.910 ± 0.056 1.998 1.826
TABLE 4.10.: DATA OF INVESTIGATED TOPSi – INDOMETHACIN 50 MG TABLETS
TABLETS 1 – 2: CRUSHING STRENGHT MEASURED DURING COMPRESSION
TABLETS 5 – 16: CRUSHING STRENGHT MEASURED AFTER AT LEAST ONE DAY OF
STORAGE
Tablet number
m (blend)
(mg)
m(tablet)
(mg)
Upper compression
force (N)
Lower compression
force (N)
Thickness
(mm)
Crushing strength
(N) 1 2
50.3 50.5
48.3 48.8
Too low 2425
Too low 2719
‐ ‐
0 64
5 6 7 10 15 16
50.5 49.9 50.3 50 50.2 49.9
50.4 47.9 49.8 48.4 52.2 47.4
985 1711 8147 4671 10125 205
971 1306 7294 4020 9935 269
1.906 1.948 1.988 1.967 1.948 1.979
58 50 49 58 56 48
As the tablets (Table 4.11.) from the second series only weighed 30 mg, the
punches needed to be adjusted again. The lower punch was not changed, the upper
punch was set upon 9 mm to get tablets with a good mechanical strength (Table 4.12.).
35
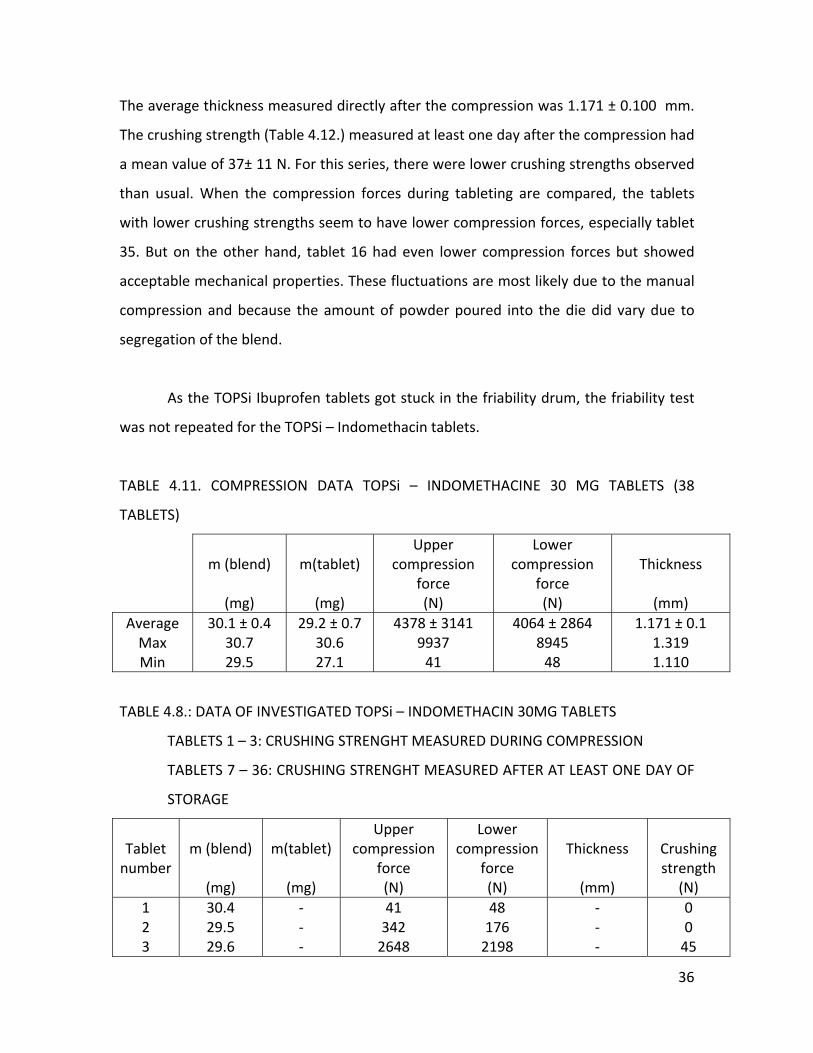
The average thickness measured directly after the compression was 1.171 ± 0.100 mm.
The crushing strength (Table 4.12.) measured at least one day after the compression had
a mean value of 37± 11 N. For this series, there were lower crushing strengths observed
than usual. When the compression forces during tableting are compared, the tablets
with lower crushing strengths seem to have lower compression forces, especially tablet
35. But on the other hand, tablet 16 had even lower compression forces but showed
acceptable mechanical properties. These fluctuations are most likely due to the manual
compression and because the amount of powder poured into the die did vary due to
segregation of the blend.
As the TOPSi Ibuprofen tablets got stuck in the friability drum, the friability test
was not repeated for the TOPSi – Indomethacin tablets.
TABLE 4.11. COMPRESSION DATA TOPSi – INDOMETHACINE 30 MG TABLETS (38
TABLETS)
m (blend)
(mg)
m(tablet)
(mg)
Upper compression
force (N)
Lower compression
force (N)
Thickness
(mm)
AverageMax Min
30.1 ± 0.4 30.7 29.5
29.2 ± 0.7 30.6 27.1
4378 ± 3141 9937 41
4064 ± 2864 8945 48
1.171 ± 0.1 1.319 1.110
TABLE 4.8.: DATA OF INVESTIGATED TOPSi – INDOMETHACIN 30MG TABLETS
TABLETS 1 – 3: CRUSHING STRENGHT MEASURED DURING COMPRESSION
TABLETS 7 – 36: CRUSHING STRENGHT MEASURED AFTER AT LEAST ONE DAY OF
STORAGE
Tablet number
m (blend)
(mg)
m(tablet)
(mg)
Upper compression
force (N)
Lower compression
force (N)
Thickness
(mm)
Crushing strength
(N) 1 2 3
30.4 29.5 29.6
‐ ‐ ‐
41 342 2648
48 176 2198
‐ ‐ ‐
0 0 45
36
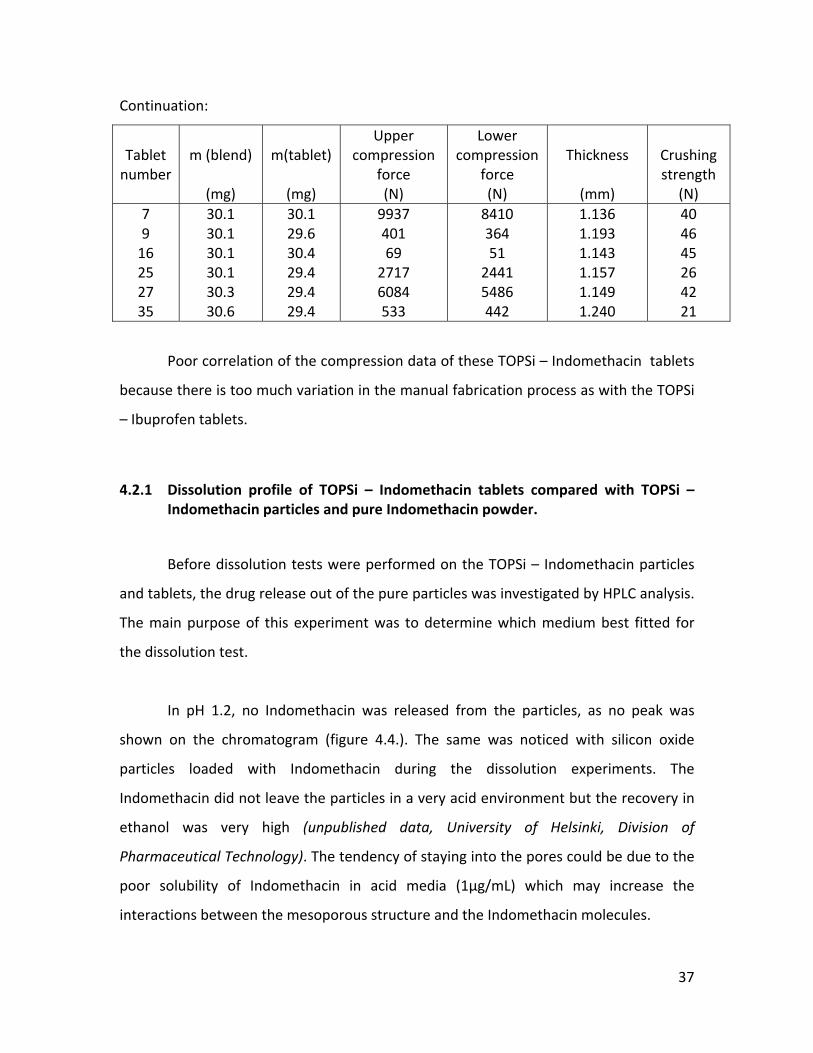
Continuation:
Tablet number
m (blend)
(mg)
m(tablet)
(mg)
Upper compression
force (N)
Lower compression
force (N)
Thickness
(mm)
Crushing strength
(N) 7 9 16 25 27 35
30.1 30.1 30.1 30.1 30.3 30.6
30.1 29.6 30.4 29.4 29.4 29.4
9937 401 69 2717 6084 533
8410 364 51 2441 5486 442
1.136 1.193 1.143 1.157 1.149 1.240
40 46 45 26 42 21
Poor correlation of the compression data of these TOPSi – Indomethacin tablets
because there is too much variation in the manual fabrication process as with the TOPSi
– Ibuprofen tablets.
4.2.1 Dissolution profile of TOPSi – Indomethacin tablets compared with TOPSi – Indomethacin particles and pure Indomethacin powder.
Before dissolution tests were performed on the TOPSi – Indomethacin particles
and tablets, the drug release out of the pure particles was investigated by HPLC analysis.
The main purpose of this experiment was to determine which medium best fitted for
the dissolution test.
In pH 1.2, no Indomethacin was released from the particles, as no peak was
shown on the chromatogram (figure 4.4.). The same was noticed with silicon oxide
particles loaded with Indomethacin during the dissolution experiments. The
Indomethacin did not leave the particles in a very acid environment but the recovery in
ethanol was very high (unpublished data, University of Helsinki, Division of
Pharmaceutical Technology). The tendency of staying into the pores could be due to the
poor solubility of Indomethacin in acid media (1µg/mL) which may increase the
interactions between the mesoporous structure and the Indomethacin molecules.
37
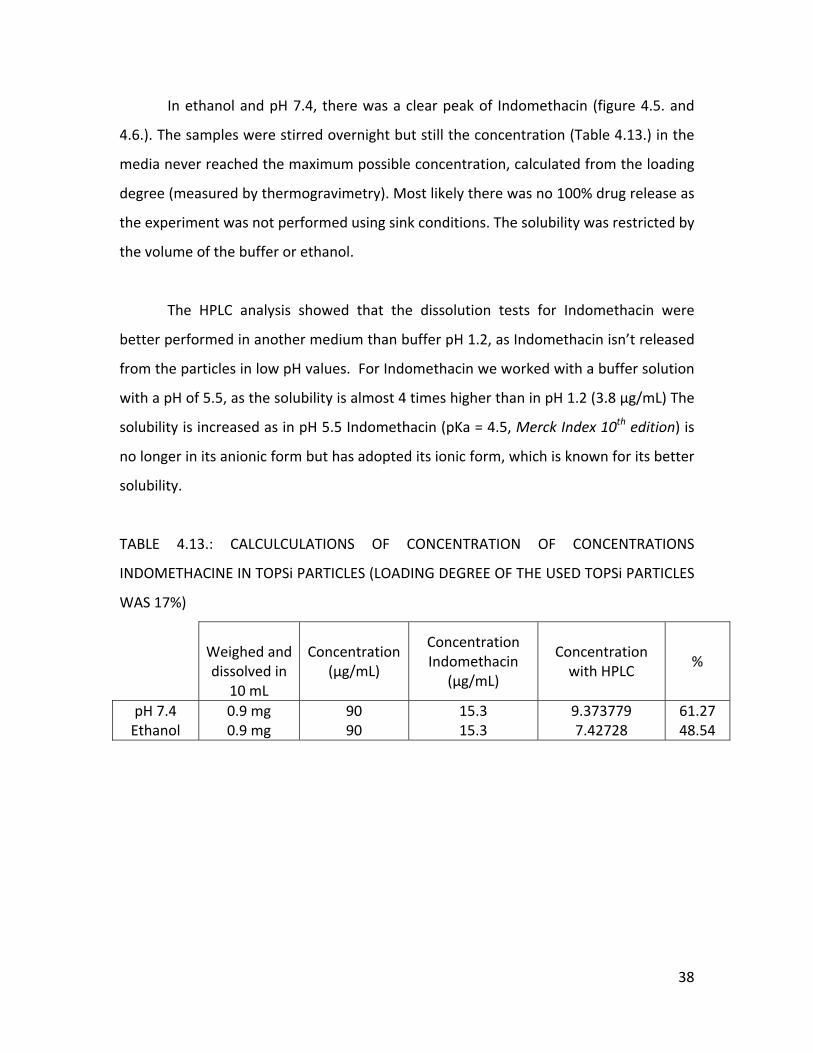
In ethanol and pH 7.4, there was a clear peak of Indomethacin (figure 4.5. and
4.6.). The samples were stirred overnight but still the concentration (Table 4.13.) in the
media never reached the maximum possible concentration, calculated from the loading
degree (measured by thermogravimetry). Most likely there was no 100% drug release as
the experiment was not performed using sink conditions. The solubility was restricted by
the volume of the buffer or ethanol.
The HPLC analysis showed that the dissolution tests for Indomethacin were
better performed in another medium than buffer pH 1.2, as Indomethacin isn’t released
from the particles in low pH values. For Indomethacin we worked with a buffer solution
with a pH of 5.5, as the solubility is almost 4 times higher than in pH 1.2 (3.8 µg/mL) The
solubility is increased as in pH 5.5 Indomethacin (pKa = 4.5, Merck Index 10th edition) is
no longer in its anionic form but has adopted its ionic form, which is known for its better
solubility.
TABLE 4.13.: CALCULCULATIONS OF CONCENTRATION OF CONCENTRATIONS
INDOMETHACINE IN TOPSi PARTICLES (LOADING DEGREE OF THE USED TOPSi PARTICLES
WAS 17%)
Weighed and dissolved in
10 mL
Concentration
(µg/mL)
Concentration Indomethacin
(µg/mL)
Concentration with HPLC
%
pH 7.4 Ethanol
0.9 mg 0.9 mg
90 90
15.3 15.3
9.373779 7.42728
61.27 48.54
38
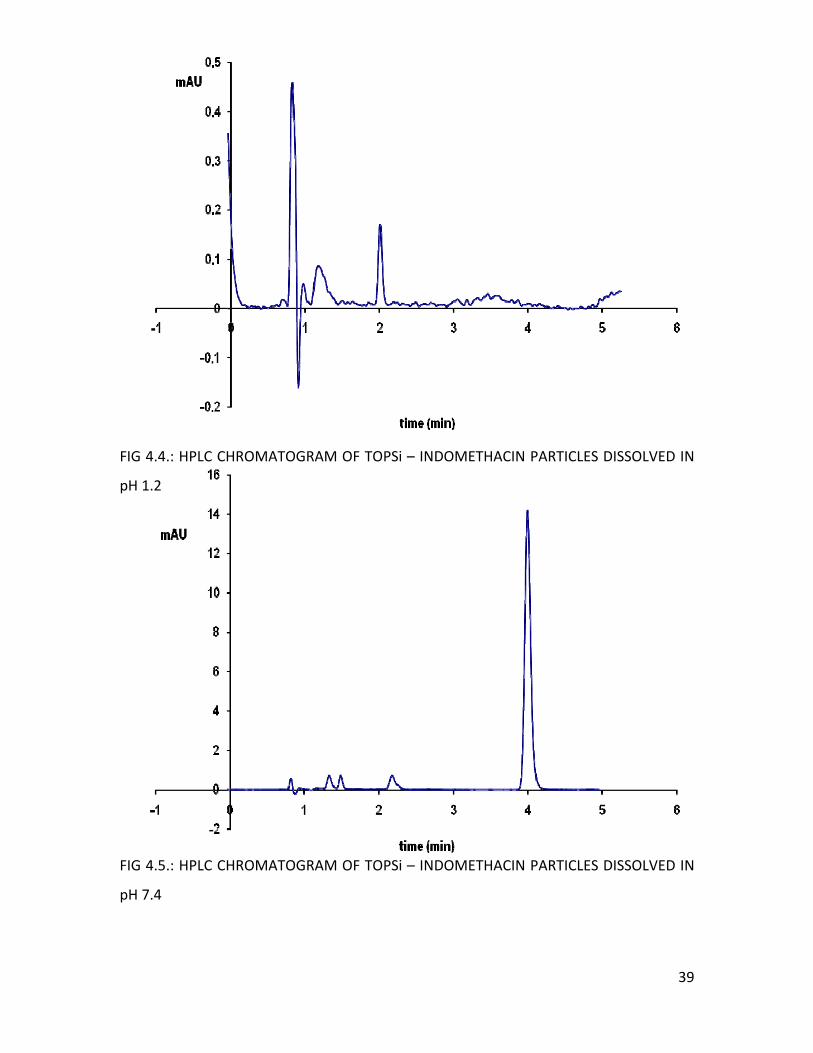
IG 4.4.: HPLC CHROMATOGRAM OF TOPSi – INDOMETHACIN PARTICLES DISSOLVED IN
H 1.2
FIG 4.5.: HPLC CHROMATOGRAM OF TOPSi – INDOMETHACIN PARTICLES DISSOLVED IN
pH 7.4
F
p
39
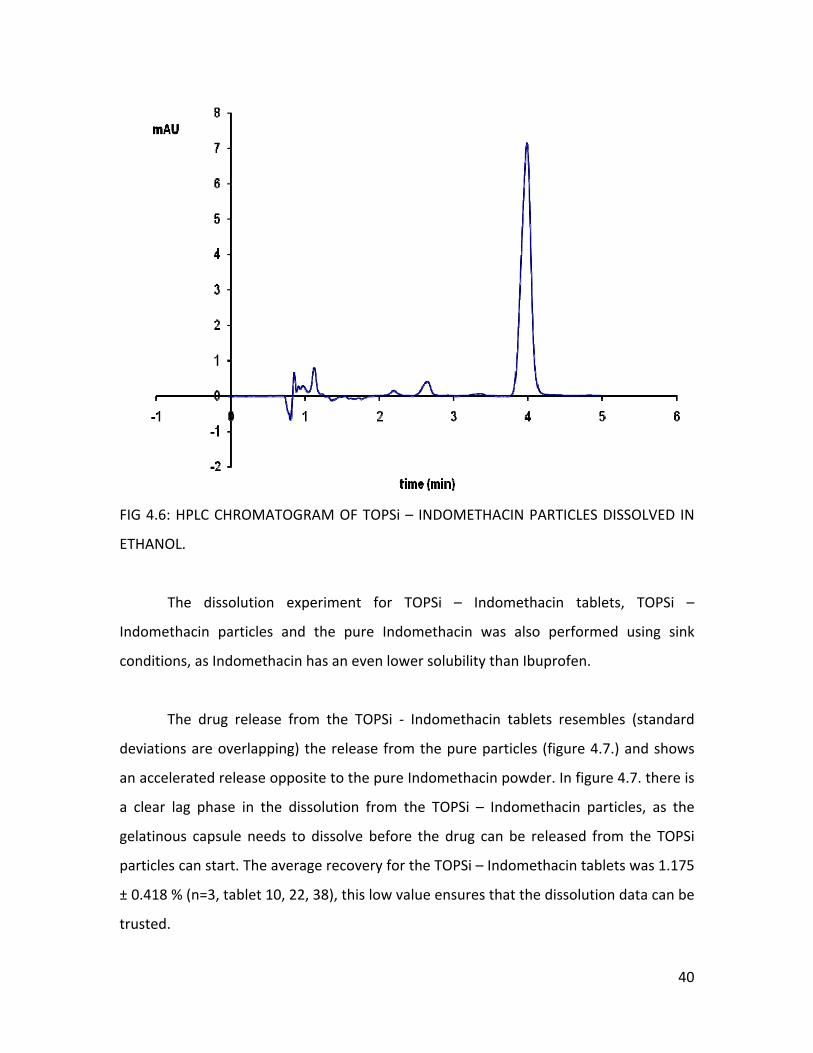
FIG 4.6: HPLC CHROMATOGRAM OF TOPSi – INDOMETHACIN PARTICLES DISSOLVED IN
The dissolution experiment for TOPSi – Indomethacin tablets, TOPSi –
particles and the pure Indomethacin was also performed using sink
as Indomethacin has an even lower solubility than Ibuprofen.
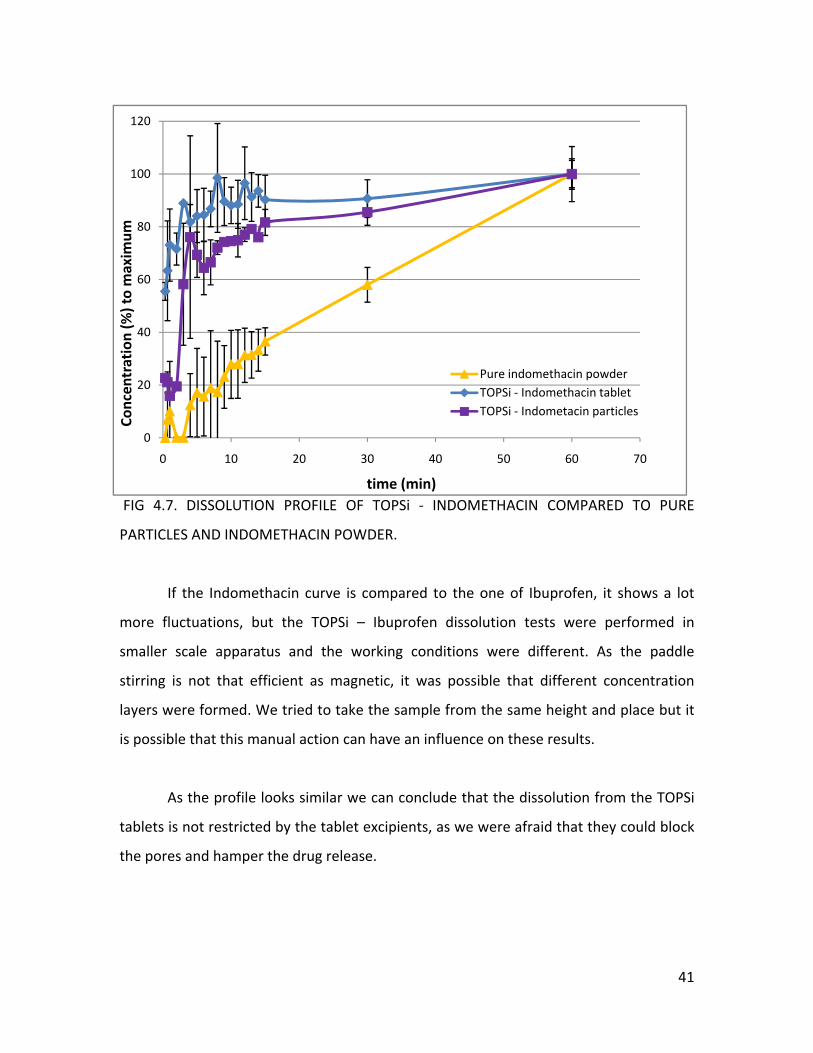
The drug release from the TOPSi ‐ Indomethacin tablets resembles (standard
are overlapping) the release from the pure particles (figure 4.7.) and shows
accelerated release opposite to the pure Indomethacin powder. In figure 4.7. there is
clear lag phase in the dissolution from the TOPSi – Indomethacin particles, as the
capsule needs to dissolve before the drug can be released from the TOPSi
can start. The average recovery for the TOPSi – Indomethacin tablets was 1.175
0.418 % (n=3, tablet 10, 22, 38), this low value ensures that the dissolution data can be
ETHANOL.
Indomethacin
conditions,
deviations
an
a
gelatinous
particles
±
trusted.
40
41
FIG 4.7. DISSOLUTION PROFILE OF TOPSi ‐ INDOMETHACIN COMPARED TO PURE
PARTICLES AND INDOMETHACIN POWDER.
If the Indomethacin curve is compared to the one of Ibuprofen, it shows a lot
ore fluctuations, but the TOPSi – Ibuprofen dissolution tests were performed in
maller scale apparatus and the working conditions were different. As the paddle
tirring is not that efficient as magnetic, it was possible that different concentration
yers were formed. We tried to take the sample from the same height and place but it
possible that this manual action can have an influence on these results.
As the profile looks similar we can conclude that the dissolution from the TOPSi
blets is not restricted by the tablet excipients, as we were afraid that they could block
e pores and hamper the drug release.
0
20
40
60
80
100
120
0 10 20 30 40 50 60 70
Concen
tration (%
) to maxim
um
time (min)
Pure indomethacin powderTOPSi ‐ Indomethacin tabletTOPSi ‐ Indometacin particles
m
s
s
la
is
ta
th
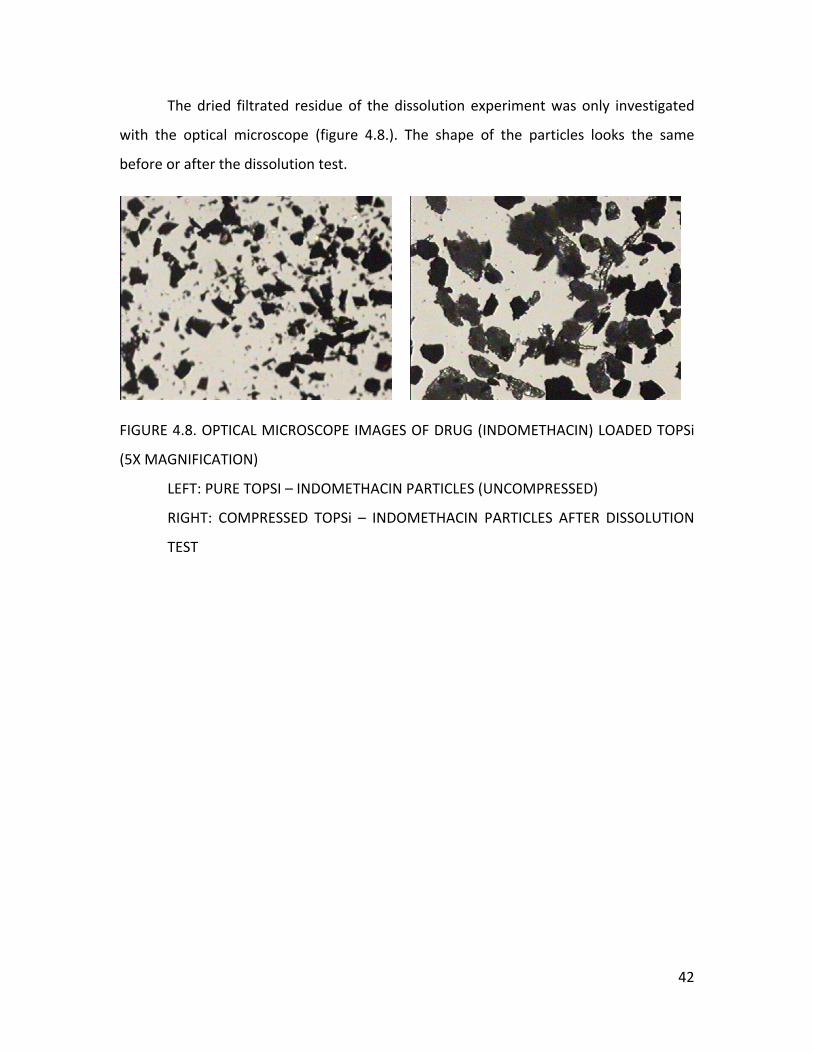
The dried filtrated residue of the dissolution experiment was only investigated
ter the dissolution test.
ST
with the optical microscope (figure 4.8.). The shape of the particles looks the same
before or af
FIGURE 4.8. OPTICAL MICROSCOPE IMAGES OF DRUG (INDOMETHACIN) LOADED TOPSi
(5X MAGNIFICATION)
LEFT: PURE TOPSI – INDOMETHACIN PARTICLES (UNCOMPRESSED)
RIGHT: COMPRESSED TOPSi – INDOMETHACIN PARTICLES AFTER DISSOLUTION
TE
42
5 CONCLUSIONS
According to this very preliminary study, it seems that drug release from the tablets
with Ibuprofen is improved comparing to the pure TOPSi particles. For the Indomethacin
it resembles the profile of the TOPSi ‐ particles, so the dissolution from the particles is
not restricted by the tablet excipients. Because there were thoughts that the excipients
could block the pores and leave a negative influence on the dissolution. Compression
does not fully destroy the particles or their porous structure. It is possible that the
structure is partially broken but no evidence was found with TEM or optical microscope.
We must consider that these results can only give an estimation as there was a lot
of variation in the tablet composition due to the manual preparation of the blend and
the tablets. Automatical compression was not possible as the tablet weight was too low
and there was not enough particle material.
m Stearate and/or Silicon dioxide should be
dded to the tablet blend, to reduce the segregation and aggregation of the tablet
blend.
In the future, lubricants as Magnesiu
a
43
6 RE
s, The Science Of Dosage form design. Churchill
Livingstone, Edinburgh, UK, Chapter 27.
Anglin, E. J.; Cheng, L.; Freeman, W. R.; Sailor, M. J. (2008). Porous silicon in drug
delivery devices and materials. Advanced Drug Delivery Reviews, 60
FERENCES
Alderborn, G (2002). Pharmaceutic
, 1266 – 1277
Asano, T.; Tsubuku, S.; Sugawara, S.; Miyajima, M.; Sato, H.; Yuasa, H.; Kanaya, Y. (1997).
Changes in Volume and Compression Energy upon Compression of Calcium Silicate
Tablets. Drug Development and Industrial Pharmacy, 23, 679 ‐685
ia (Ph. Eur), 4th edition (2002). <2.9.1.> Disintegration of tablets
nd ca rasbourg,
France.
European Pharmacopeia (Ph. Eur), 4th edition (2002). <2.9.7.> Friability of uncoated
tablets. of Elaboration of the European Pharmacopoeia, Strasbourg, France.
European Pharmacopeia (Ph. Eur), 4th edition (2002). <2.9.8> Resistance to crushing of
tablets. of Elaboration of the European Pharmacopoeia, Strasbourg, France.
Hirvonen, J.; Laaksonen, T.; Peltonen, L.; Santos, H.; Lehto, V. P.; Heikkilä, T.; Riikonen, J.;
Salonen, J. (2008). Feasibility of silicon‐based mesoporous materials for oral drug
deliver applications. Dosis, 24
European Pharmacope
a psules . Convention of Elaboration of the European Pharmacopoeia, St
Convention
Convention
y , 129‐149
Martindale The Extra Pharmacopoeia 28the edition (1982). The Society’s Department of
Pharmaceutical Sciences, London, UK.
44
Patel, S.; Kaushal, A. M.; Bansal, A. K. (2006). Compression Physics in the Formulation
evelopment of Tablets. Critical Reviews in Therapeutic Drug Carrier Systems, 23D , 1‐65
deliver Loading and
108
Rotko T. (2009), Presentation 23.02.2009, University of Helsinki, Finland.
Salonen, J.; Hirvonen J.; Kaukonen A. M.; Tuura, J.; Björkqvist, M.; Heikkilä, T.; Vähä‐
Heikkilä, K.; Hirvonen, J.; Lehto V.P. (2005). Mesoporous silicon microparticles for oral
drug y: release of five drug models. Journal of controlled release,
, 362‐374
Salonen, J.; Kaukonen A. M.; Hirvonen J.; Lehto V.P. (2008). Mesoporous Silicon in Drug
Delivery Applications. Journal of Pharmaceutical Sciences, 97, 632‐653
Salonen, J.; Paski, J.; Vähä‐Heikkilä, K.; Heikkilä, T.; Björkqvist, M.; Lehto, V.P. (2005b).
Determination of drug load in porous silicon microparticles by calorimetry. Phys. Stat.
Sol, 202, 1629–1633
Sharma, S.; Sher, P.; Badve, S.; Pawar, A. P. (2005). Adsorption of Meloxicam on Porous
Calcium Silicate: Characterization and Tablet Formulation. AAPS PharmSciTech, 6, Issue
4
akeuchi, H.; Nagari, S.; Tanimura, S.; Yamamoto, H.; Kawashima, Y. (2005). Tabletting of
olid Dispersion Particles Consisting of Indomethacin and Porous SIlica Particles. Chem.
harm. Bull, 53
T
S
P , 487‐491
he Merck Index 10th edition (1983). Rahway, New Jersey, USA.
hlir, A. (1956). Electrolytic shaping of geranium and silicon. Bell system technical
urnal, 35
T
U
jo , 333‐347.
45
46
rmacopeia XXIV (USP) Official Monographs (p 874 – 875; p856‐857).
ockville, MD: United States Pharmacopeial Convention; 2000.
tion of a thick anode film to semiconductor
evices. Review of the electrical communications laboratories, 19
United States Pha
R
Watanabe, Y.; Sakai, T. (1971). Applica
d , 899