gift 2015 - cima · 2015-04-16 · brand finance gift 2015 with cima april 2015 3. about brand...
TRANSCRIPT
GIFT 2015Global Intangible Financial Tracker 2015 An annual review of the world’s intangible valueApril 2015
In partnership with:
™
About Brand Finance 3
How We Can Help 3
Foreword 4
Executive Summary 6
Country Focus 13
CIMA Thought Piece 16
Methodology 18
Financial Reporting of Intangible Assets 22
Implications for M&A and Tax 24
Contents
Brand Finance GIFT 2015 with CIMA April 2015 2.
Bridging the gap between marketing and finance
Brand Finance GIFT 2015 with CIMA April 2015 3.
About Brand Finance
Brand Finance was set up in 1996 with the aim of ‘bridging the gap between marketing and finance’. For almost 20 years and across our network of over 15 offices, we have helped companies to connect their intangible assets to the bottom line, building robust business cases for brand strategy and investments. In doing so, we have helped finance professionals to evaluate marketing programmes and marketers to present their case in the board room, providing a mutually intelligible language for groups that frequently find it difficult to communicate effectively.
As well as producing the GIFT report Brand Finance puts thousands of the world’s biggest brands to the test every year, evaluating which are the most powerful and most valuable. These are grouped by industry sectors and national markets and released as league tables which can be found at www.brandirectory.com. For more information about Brand Finance visit www.brandfinance.com or get in touch at [email protected] or by phone on +44 (0)20 7389 9400.
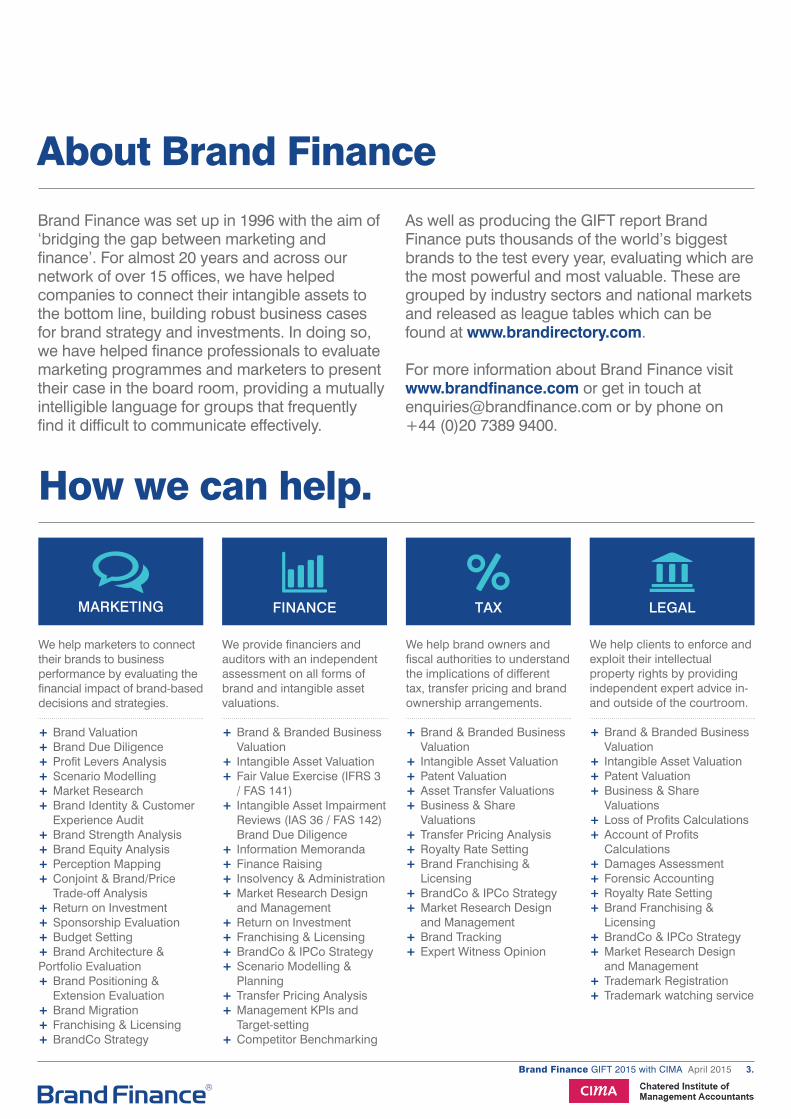
How we can help.
MARKETING FINANCE TAX LEGAL
We help marketers to connect their brands to business performance by evaluating the financial impact of brand-based decisions and strategies.
+ Brand Valuation+ Brand Due Diligence+ Profit Levers Analysis+ Scenario Modelling+ Market Research+ Brand Identity & Customer
Experience Audit+ Brand Strength Analysis+ Brand Equity Analysis+ Perception Mapping+ Conjoint & Brand/Price
Trade-off Analysis+ Return on Investment+ Sponsorship Evaluation+ Budget Setting+ Brand Architecture &Portfolio Evaluation+ Brand Positioning &
Extension Evaluation+ Brand Migration+ Franchising & Licensing+ BrandCo Strategy
We provide financiers and auditors with an independent assessment on all forms of brand and intangible asset valuations.
+ Brand & Branded Business Valuation
+ Intangible Asset Valuation+ Fair Value Exercise (IFRS 3
/ FAS 141)+ Intangible Asset Impairment
Reviews (IAS 36 / FAS 142) Brand Due Diligence
+ Information Memoranda+ Finance Raising+ Insolvency & Administration+ Market Research Design
and Management+ Return on Investment+ Franchising & Licensing+ BrandCo & IPCo Strategy+ Scenario Modelling &
Planning+ Transfer Pricing Analysis+ Management KPIs and
Target-setting+ Competitor Benchmarking
We help brand owners and fiscal authorities to understand the implications of different tax, transfer pricing and brand ownership arrangements.
+ Brand & Branded Business Valuation+ Intangible Asset Valuation+ Patent Valuation+ Asset Transfer Valuations+ Business & Share Valuations + Transfer Pricing Analysis + Royalty Rate Setting+ Brand Franchising & Licensing+ BrandCo & IPCo Strategy+ Market Research Design and Management+ Brand Tracking+ Expert Witness Opinion
We help clients to enforce and exploit their intellectual property rights by providing independent expert advice in- and outside of the courtroom.
+ Brand & Branded Business Valuation+ Intangible Asset Valuation+ Patent Valuation+ Business & Share Valuations + Loss of Profits Calculations+ Account of Profits Calculations + Damages Assessment+ Forensic Accounting+ Royalty Rate Setting+ Brand Franchising & Licensing+ BrandCo & IPCo Strategy+ Market Research Design and Management+ Trademark Registration+ Trademark watching service
Brand Finance GIFT 2015 with CIMA April 2015 4. Brand Finance GIFT 2015 with CIMA April 2015 4.
Foreword.
Brand Finance plc has been monitoring the extent of intangible asset values in world stock markets for over 10 years. We began production of the Global Intangible Finance Tracker (GIFT™) in 2004 to highlight several facts:
1) The absolute scale of global intangible assets and the high percentage of global Enterprise Value represented by intangibles
2) The volatility of intangible asset values caused by changes in investor sentiment from time to time
3) The conundrum that certain intangible assets appear in balance sheets while others don’t
The phenomenon of ‘undisclosed intangibles’ has arisen for perfectly logical reasons. Accountants do not like to recognise assets unless there has been a transaction to support the value that appears in the balance sheet. To many accountants the Historical Cost Convention is a prudent measure to prevent creative accounting and the distortion of reported asset values.
Unfortunately, the ban on assets appearing in balance sheets unless there has been a separate purchase for the asset in question, or a fair value allocation of an acquisition purchase price, means that many highly valuable intangible assets never appear on balance sheets. This seems bizarre to most ordinary, non-accounting managers. They point to the fact that while Smirnoff appears in Diageo’s balance sheet, Baileys does not. They point to the fact that the Cadbury’s brand was not apparent in the balance sheet or reflected in the share price prior to Kraft’s unsolicited and
ultimately successful contested takeover of that once great British company.
There are many other examples of the same phenomenon, which has led some to call for a new approach to financial reporting, with fair values of all assets determined and reported by management each year. If it were possible to overcome the practical and legal problems, Fair Value reporting would be a huge help to managers, investors and other interested parties. Unfortunately, the practical problems are legion and change has been dropped in the ‘too hard’ basket.
We hope that this report, published with CIMA, will rekindle the debate and hopefully lead to a more imaginative approach to the regular revaluation and reporting of intangible assets. If we could achieve a more meaningful approach to reporting such asset values we believe that it would lead to better informed management, higher investment in innovation and intangible asset value creation, stronger balance sheets, better defence against asset strippers and generally serve the needs of UK plc. Too many great UK brands have been bought and transferred offshore as a result of this ongoing reporting problem.
I hope the data and opinions contained in this report are of interest and act as a stimulant to a debate which has ground to a halt in a morass of technical objections. The need to change is active and urgent. It’s time for CEOs, CFOs and CMOs to join the debate.
David Haigh, CEO, Brand Finance
Taking well-informed decisions requires fit for purpose management information. This is as true for the country as it is for a company.
In recent years there has been considerable focus by UK government on tackling the budget deficit. While critical, it will not drive future prosperity. And cannot be the sole focus if the UK is to thrive in the long term.
And if the UK is to thrive, policy makers must understand and appreciate the building blocks needed to drive true and full value. And start assessing the credibility of policy proposals by whether they have anything to say about these drivers of future value.
Underpinning this is the fact that the right management information must be available to policy makers in order that they can make the best possible decisions to enable the country’s future growth. And I would personally urge government to look to best practice management accounting – in the form of our CGMA Global Management Accounting Principles – to help plug this gap (see www.cgma.org/principles).
This major analysis by Brand Finance and CIMA reinforces the importance of intangibles – reputation, brands, intellectual property – and challenges those leading the debate on our national economic policy.
CIMA believes it is essential to recognise the growing importance of intangible assets as a precondition of reaching good judgement on value generation and as such strongly supports
Charles Tilley, CEO, CIMA
Integrated Reporting as a member of the IIRC (International Integrated Reporting Council). We hope this report with Brand Finance contributes to a better informed policy conversation at this vital time.
About CIMA
Taking the best possible decisions to create and preserve value for the short, medium and long-term has never been more challenging, more important or richer in opportunity. CIMA enables boards and management teams around the world to ‘join the dots’, bringing together the information they need in the way that they need it to inform strategy formation and execution.
The Chartered Institute of Management Accountants (CIMA) is the world’s largest and leading professional body of management accountants. Through our partnership with the American Institute of CPAs (AICPA) we support and give voice to over 150,000 Chartered Global Management Accountants across the globe.
Our members’ expertise is rooted in the intensive and rigorous training and practical education provided by the CIMA syllabus which informs critical business decisions and judgments reached every day drawing on our Global Management Accounting Principles and competency framework.CIMA helps people and business succeed by harnessing the full power of management accounting. We provide CPD services, fund academic research, develop thought leadership, maintain a code of ethics for members and monitor professional standards. We also work with external tuition providers and assessment services to provide the best study and examination experience to our customers.
For more information about CIMA and our Global Management Accounting Principles please visit www.cimaglobal.com and www.cgma.org/principles.
Brand Finance GIFT 2015 with CIMA April 2015 5.
Brand Finance GIFT 2015 with CIMA April 2015 6.
Executive SummaryBehind the strongest and most valuable global economies are strong nation brands. Like corporate brands, a nation brand is built on its identity, promise to the marketplace, its values, its culture and its people. Nations that are able to communicate their brand effectively in each of these areas with a clear strategy are often able to create distinct competitive advantage in the global marketplace.
A clearly defined and implemented nation brand strategy can create a country of origin effect (‘COO’) – the ability to add appeal for a particular good or service by reference to its origin. This effect drives demand and often a price premium for goods and services, thus driving economic value for a nation’s companies.
Equally, behind ‘high value’ nation brands are strong corporate brands. Corporate brands can work harmoniously with a clearly defined nation brand strategy in order to create additional shareholder and economic value.
As the global economy becomes increasingly driven by intangible, service-led industries, a strong ‘nation brand’ has never been more critical to economic growth.
In fact, more than half of the 20 most intangible nations are also brand strength rated AA (very strong) according to the Brand Finance Nation Brands 2015 report (including USA, UK, France, and Switzerland).
For rich nations, the value and importance placed on intangible assets, such as brands, people, know-how, relationships and other intellectual property, is now a greater proportion of the total value of most businesses than is the value of tangible assets, such as plants and machinery.
The creation and management of intangible assets is essential to long-term success.
Corporations therefore need to understand their intangible assets in order to leverage them for greater economic and shareholder value.
Take ‘brand’ for instance. Brand is often one of the most valuable undisclosed intangible assets in any business, yet it can quite easily be influenced, managed and invested in by brand stakeholders.
Strong brands create high ‘brand equity’ with the customer base, thus allowing a business to charge a premium for its product or services, sell greater volumes than its competitors and promote brand loyalty. This creates shareholder and business value.
However, as important as these intangible assets are, many CEOs, CFOs and CMOs do not have an adequate understanding of how their brand and customer intangibles impact the value of their businesses.
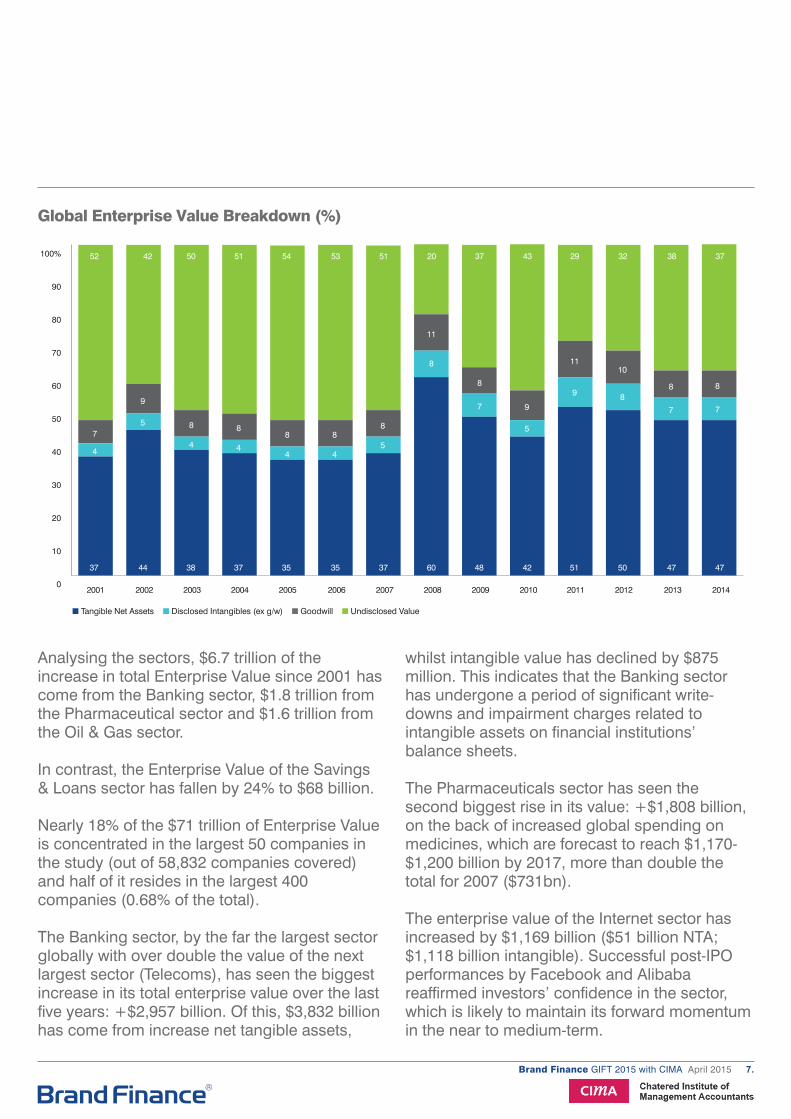
This year’s GIFT™ study covers more than 58,000 companies quoted in 120+ countries and 120 stock exchanges. The total Enterprise Value of corporates under the scope of the study was $71 trillion as at the end of 2014. Of this value, $33.5 trillion represented Net Tangible Assets (NTA), $11 trillion disclosed intangible assets and $26.5 trillion ‘undisclosed value’.
The Enterprise Value of the companies covered has increased by $40.3 trillion since the end of 2001: of that increase, $22.2 trillion has been an increase in Net Tangible Assets, $7.7 trillion an increase in disclosed intangible assets (including goodwill) and $10.5 trillion an increase in ‘undisclosed value’.
Brand Finance GIFT 2015 with CIMA April 2015 7.
Analysing the sectors, $6.7 trillion of the increase in total Enterprise Value since 2001 has come from the Banking sector, $1.8 trillion from the Pharmaceutical sector and $1.6 trillion from the Oil & Gas sector.
In contrast, the Enterprise Value of the Savings & Loans sector has fallen by 24% to $68 billion.
Nearly 18% of the $71 trillion of Enterprise Value is concentrated in the largest 50 companies in the study (out of 58,832 companies covered) and half of it resides in the largest 400 companies (0.68% of the total).
The Banking sector, by the far the largest sector globally with over double the value of the next largest sector (Telecoms), has seen the biggest increase in its total enterprise value over the last five years: +$2,957 billion. Of this, $3,832 billion has come from increase net tangible assets,
whilst intangible value has declined by $875 million. This indicates that the Banking sector has undergone a period of significant write- downs and impairment charges related to intangible assets on financial institutions’ balance sheets.
The Pharmaceuticals sector has seen the second biggest rise in its value: +$1,808 billion, on the back of increased global spending on medicines, which are forecast to reach $1,170- $1,200 billion by 2017, more than double the total for 2007 ($731bn).
The enterprise value of the Internet sector has increased by $1,169 billion ($51 billion NTA; $1,118 billion intangible). Successful post-IPO performances by Facebook and Alibaba reaffirmed investors’ confidence in the sector, which is likely to maintain its forward momentum in the near to medium-term.
2001 2002 2003 2004 2005 2006 2007 2008 2009 2010 2011 2012 2013 2014
■ Tangible Net Assets ■ Disclosed Intangibles (ex g/w) ■ Goodwill ■ Undisclosed Value
0
10
20
30
40
50
60
70
80
90
100%
37 44 38 37 35 35 37 60 48 42 51 50 47 47
52 42 50 51 54 53 51 20 37 43 29 32 38 37
7
4
9
5 8
4
8
4
8
4
8
4
8
5
11
8
8
7 9
5
11
9
10
88
7
8
7
Global Enterprise Value Breakdown (%)
Brand Finance GIFT 2015 with CIMA April 2015 8.
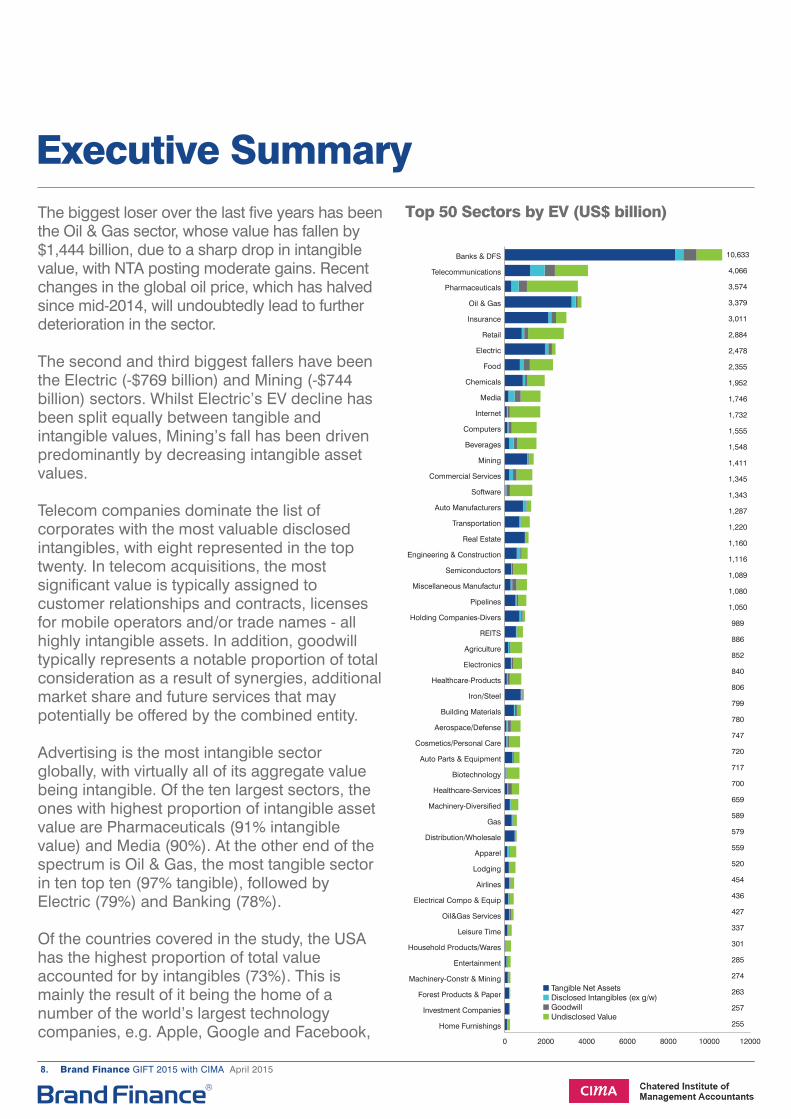
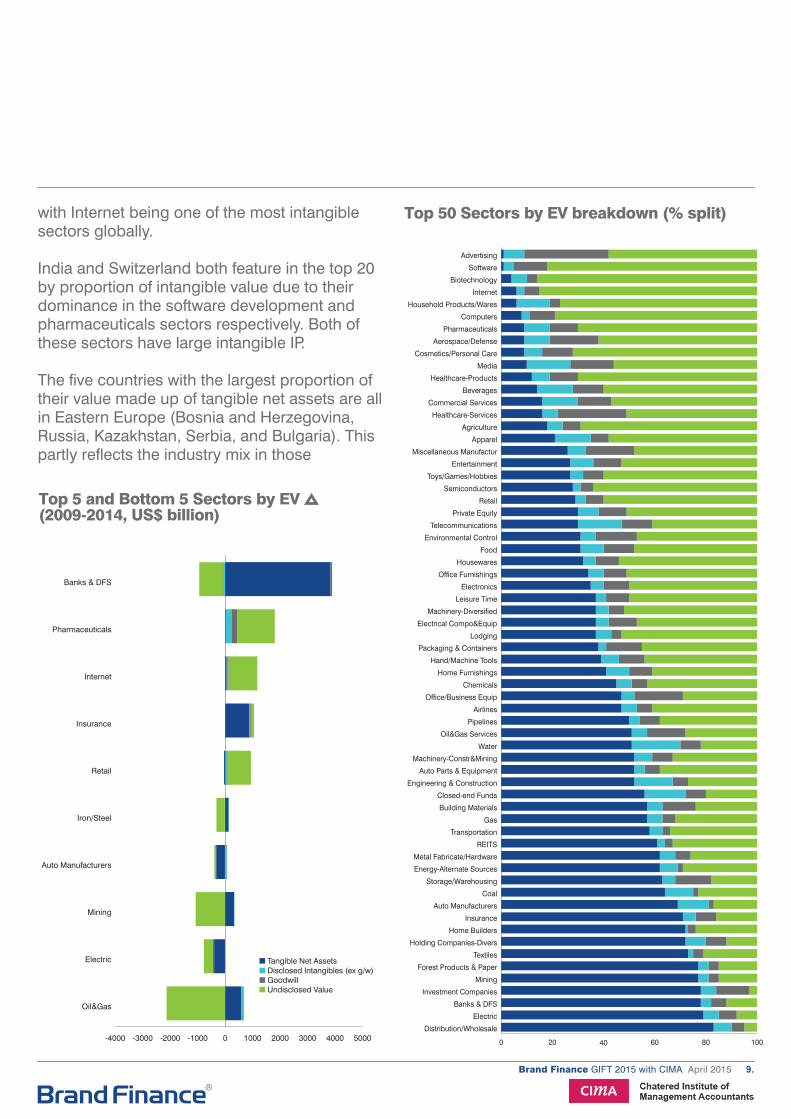
The biggest loser over the last five years has been the Oil & Gas sector, whose value has fallen by $1,444 billion, due to a sharp drop in intangible value, with NTA posting moderate gains. Recent changes in the global oil price, which has halved since mid-2014, will undoubtedly lead to further deterioration in the sector.
The second and third biggest fallers have been the Electric (-$769 billion) and Mining (-$744 billion) sectors. Whilst Electric’s EV decline has been split equally between tangible and intangible values, Mining’s fall has been driven predominantly by decreasing intangible asset values.
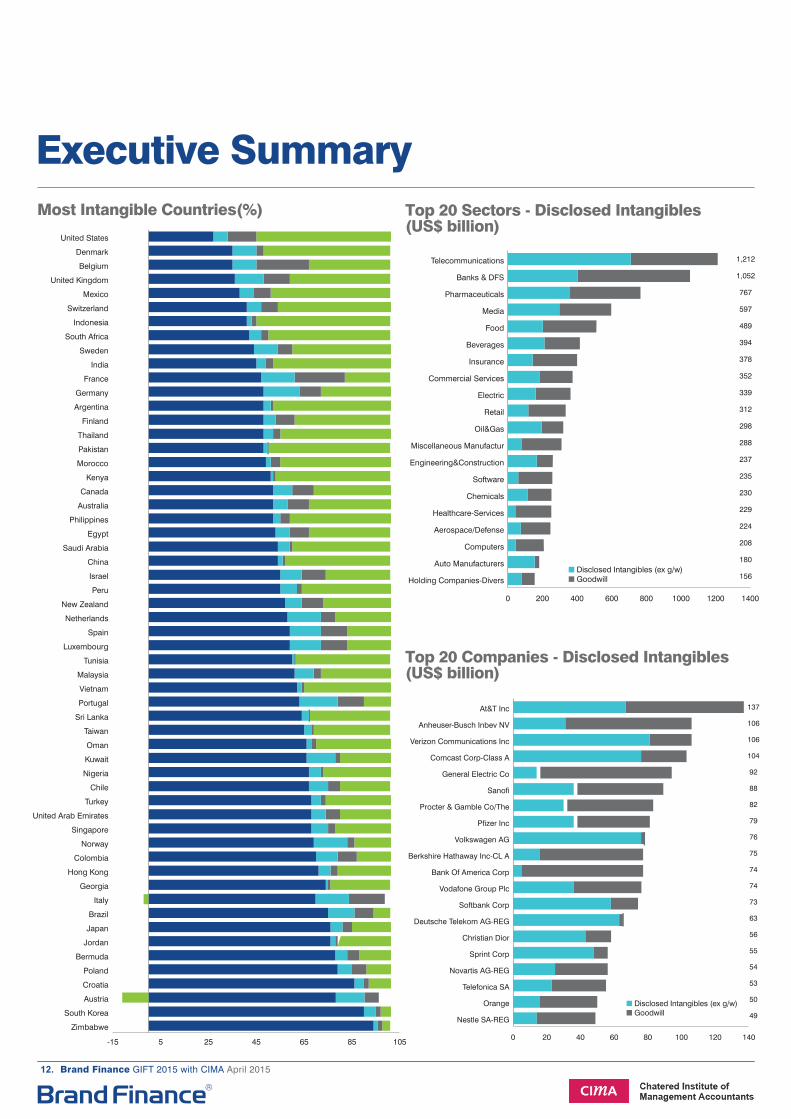
Telecom companies dominate the list of corporates with the most valuable disclosed intangibles, with eight represented in the top twenty. In telecom acquisitions, the most significant value is typically assigned to customer relationships and contracts, licenses for mobile operators and/or trade names - all highly intangible assets. In addition, goodwill typically represents a notable proportion of total consideration as a result of synergies, additional market share and future services that may potentially be offered by the combined entity.
Advertising is the most intangible sector globally, with virtually all of its aggregate value being intangible. Of the ten largest sectors, the ones with highest proportion of intangible asset value are Pharmaceuticals (91% intangible value) and Media (90%). At the other end of the spectrum is Oil & Gas, the most tangible sector in ten top ten (97% tangible), followed by Electric (79%) and Banking (78%).
Of the countries covered in the study, the USA has the highest proportion of total value accounted for by intangibles (73%). This is mainly the result of it being the home of a number of the world’s largest technology companies, e.g. Apple, Google and Facebook,
Executive Summary
Top 50 Sectors by EV (US$ billion)
0 2000 4000 6000 8000 10000 12000
Home Furnishings
Investment Companies
Forest Products & Paper
Machinery-Constr & Mining
Entertainment
Household Products/Wares
Leisure Time
Oil&Gas Services
Electrical Compo & Equip
Airlines
Lodging
Apparel
Distribution/Wholesale
Gas
Machinery-Diversified
Healthcare-Services
Biotechnology
Auto Parts & Equipment
Cosmetics/Personal Care
Aerospace/Defense
Building Materials
Iron/Steel
Healthcare-Products
Electronics
Agriculture
REITS
Holding Companies-Divers
Pipelines
Miscellaneous Manufactur
Semiconductors
Engineering & Construction
Real Estate
Transportation
Auto Manufacturers
Software
Commercial Services
Mining
Beverages
Computers
Internet
Media
Chemicals
Food
Electric
Retail
Insurance
Oil & Gas
Pharmaceuticals
Telecommunications
Banks & DFS 10,633
4,066
3,574
3,379
3,011
2,884
2,478
2,355
1,952
1,746
1,732
1,555
1,548
1,411
1,345
1,343
1,287
1,220
1,160
1,116
1,089
1,080
1,050
989
886
852
840
806
799
780
747
720
717
700
659
589
579
559
520
454
436
427
337
301
285
274
263
257
255
■ Tangible Net Assets ■ Disclosed Intangibles (ex g/w) ■ Goodwill■ Undisclosed Value
Brand Finance GIFT 2015 with CIMA April 2015 9.
with Internet being one of the most intangible sectors globally.
India and Switzerland both feature in the top 20 by proportion of intangible value due to their dominance in the software development and pharmaceuticals sectors respectively. Both of these sectors have large intangible IP.
The five countries with the largest proportion of their value made up of tangible net assets are all in Eastern Europe (Bosnia and Herzegovina, Russia, Kazakhstan, Serbia, and Bulgaria). This partly reflects the industry mix in those
Top 50 Sectors by EV breakdown (% split)
0 20 40 60 80 100
Distribution/Wholesale
Electric
Banks & DFS
Investment Companies
Mining
Forest Products & Paper
Textiles
Holding Companies-Divers
Home Builders
Insurance
Auto Manufacturers
Coal
Storage/Warehousing
Energy-Alternate Sources
Metal Fabricate/Hardware
REITS
Transportation
Gas
Building Materials
Closed-end Funds
Engineering & Construction
Auto Parts & Equipment
Machinery-Constr&Mining
Water
Oil&Gas Services
Pipelines
Airlines
Office/Business Equip
Chemicals
Home Furnishings
Hand/Machine Tools
Packaging & Containers
Lodging
Electrical Compo&Equip
Machinery-Diversified
Leisure Time
Electronics
Office Furnishings
Housewares
Food
Environmental Control
Telecommunications
Private Equity
Retail
Semiconductors
Toys/Games/Hobbies
Entertainment
Miscellaneous Manufactur
Apparel
Agriculture
Healthcare-Services
Commercial Services
Beverages
Healthcare-Products
Media
Cosmetics/Personal Care
Aerospace/Defense
Pharmaceuticals
Computers
Household Products/Wares
Internet
Biotechnology
Software
Advertising
Top 5 and Bottom 5 Sectors by EV (2009-2014, US$ billion)
-4000 -3000 -2000 -1000 0 1000 2000 3000 4000 5000
Oil&Gas
Electric
Mining
Auto Manufacturers
Iron/Steel
Retail
Insurance
Internet
Pharmaceuticals
Banks & DFS
■ Tangible Net Assets ■ Disclosed Intangibles (ex g/w) ■ Goodwill■ Undisclosed Value
-4000 -3000 -2000 -1000 0 1000 2000 3000 4000 5000
Oil&Gas
Electric
Mining
Auto Manufacturers
Iron/Steel
Retail
Insurance
Internet
Pharmaceuticals
■ Tangible Net Assets ■ Disclosed Intangibles (ex g/w) ■ Goodwill■ Undisclosed Value
-4000 -3000 -2000 -1000 0 1000 2000 3000 4000 5000
Oil&Gas
Electric
Mining
Auto Manufacturers
Iron/Steel
Retail
Insurance
Internet
Pharmaceuticals
Banks & DFS
Brand Finance GIFT 2015 with CIMA April 2015 10.
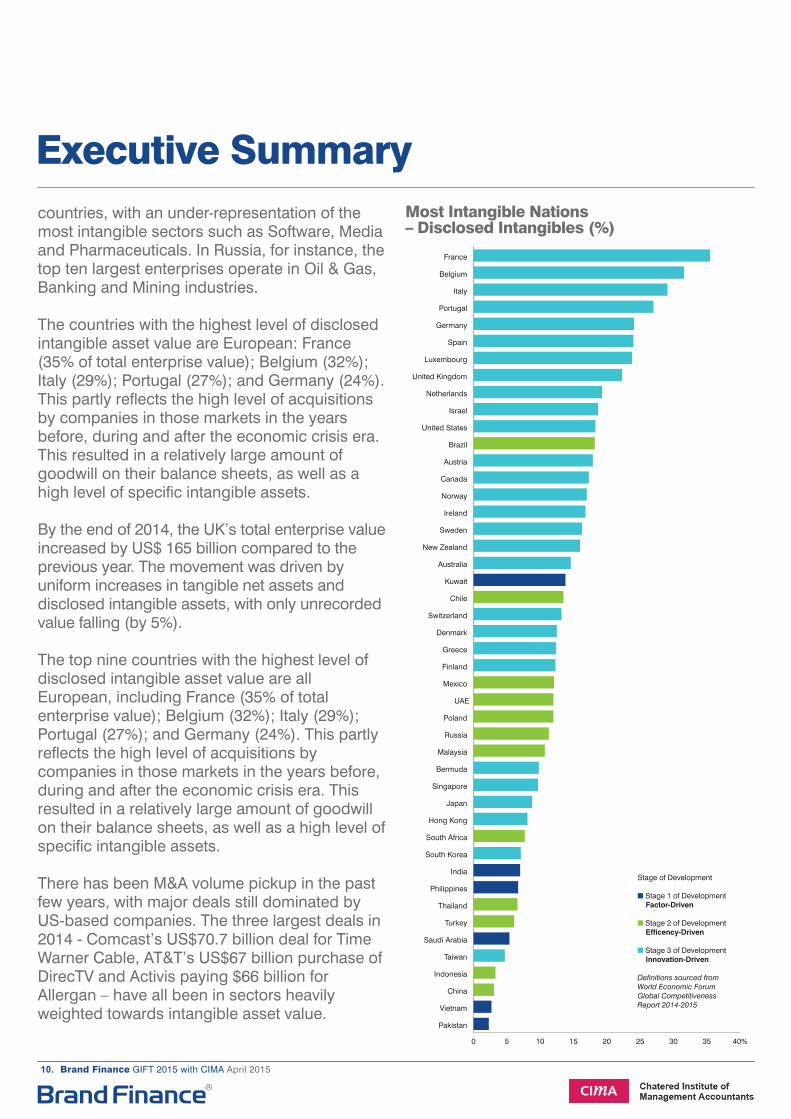
Most Intangible Nations – Disclosed Intangibles (%)
Stage of Development
■ Stage 1 of Development Factor-Driven
■ Stage 2 of Development Efficency-Driven ■ Stage 3 of Development Innovation-Driven
Definitions sourced from World Economic Forum Global Competitiveness Report 2014-2015
0 5 10 15 20 25 30 35 40%
Pakistan
Vietnam
China
Indonesia
Taiwan
Saudi Arabia
Turkey
Thailand
Philippines
India
South Korea
South Africa
Hong Kong
Japan
Singapore
Bermuda
Malaysia
Russia
Poland
UAE
Mexico
Finland
Greece
Denmark
Switzerland
Chile
Kuwait
Australia
New Zealand
Sweden
Ireland
Norway
Canada
Austria
Brazil
United States
Israel
Netherlands
United Kingdom
Luxembourg
Spain
Germany
Portugal
Italy
Belgium
France
Executive Summarycountries, with an under-representation of the most intangible sectors such as Software, Media and Pharmaceuticals. In Russia, for instance, the top ten largest enterprises operate in Oil & Gas, Banking and Mining industries.
The countries with the highest level of disclosed intangible asset value are European: France (35% of total enterprise value); Belgium (32%); Italy (29%); Portugal (27%); and Germany (24%). This partly reflects the high level of acquisitions by companies in those markets in the years before, during and after the economic crisis era. This resulted in a relatively large amount of goodwill on their balance sheets, as well as a high level of specific intangible assets.
By the end of 2014, the UK’s total enterprise value increased by US$ 165 billion compared to the previous year. The movement was driven by uniform increases in tangible net assets and disclosed intangible assets, with only unrecorded value falling (by 5%).
The top nine countries with the highest level of disclosed intangible asset value are all European, including France (35% of total enterprise value); Belgium (32%); Italy (29%); Portugal (27%); and Germany (24%). This partly reflects the high level of acquisitions by companies in those markets in the years before, during and after the economic crisis era. This resulted in a relatively large amount of goodwill on their balance sheets, as well as a high level of specific intangible assets.
There has been M&A volume pickup in the past few years, with major deals still dominated by US-based companies. The three largest deals in 2014 - Comcast’s US$70.7 billion deal for Time Warner Cable, AT&T’s US$67 billion purchase of DirecTV and Activis paying $66 billion for Allergan – have all been in sectors heavily weighted towards intangible asset value.
Brand Finance GIFT 2015 with CIMA April 2015 11.
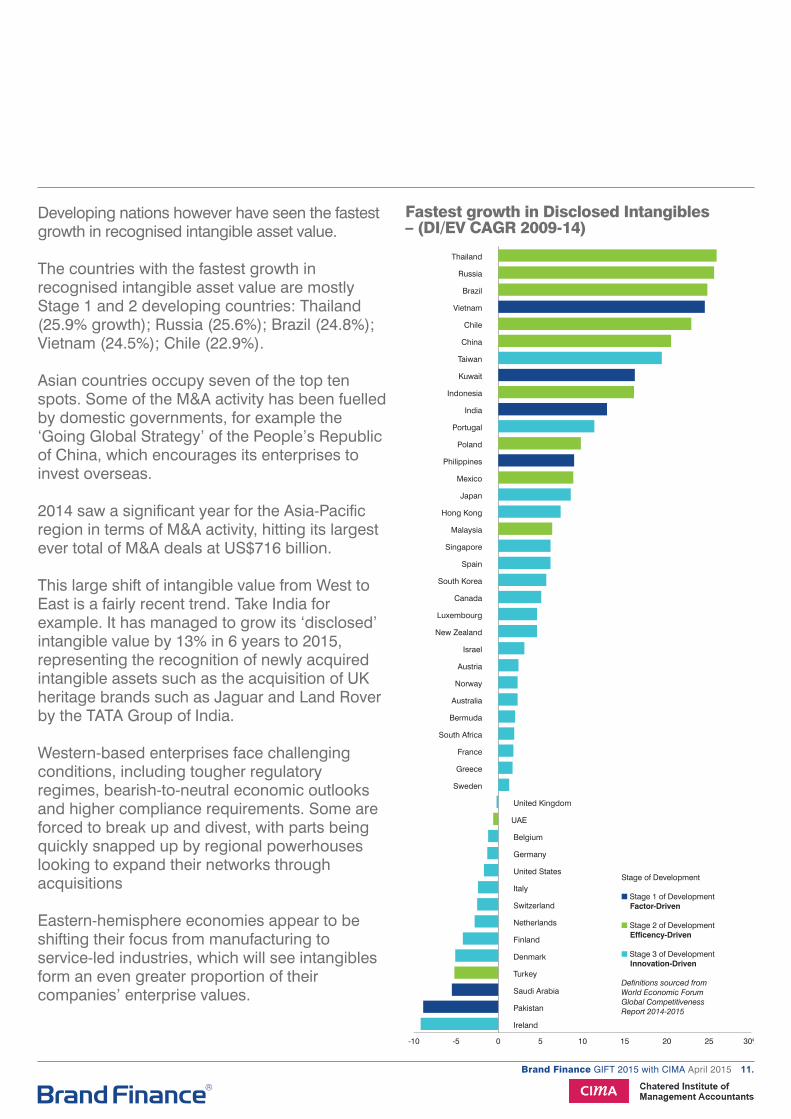
Fastest growth in Disclosed Intangibles – (DI/EV CAGR 2009-14)
Stage of Development
■ Stage 1 of Development Factor-Driven
■ Stage 2 of Development Efficency-Driven ■ Stage 3 of Development Innovation-Driven
Definitions sourced from World Economic Forum Global Competitiveness Report 2014-2015
-10 -5 0 5 10 15 20 25 30%
Ireland
Pakistan
Saudi Arabia
Turkey
Denmark
Finland
Netherlands
Switzerland
Italy
United States
Germany
Belgium
UAE
United Kingdom
Sweden
Greece
France
South Africa
Bermuda
Australia
Norway
Austria
Israel
New Zealand
Luxembourg
Canada
South Korea
Spain
Singapore
Malaysia
Hong Kong
Japan
Mexico
Philippines
Poland
Portugal
India
Indonesia
Kuwait
Taiwan
China
Chile
Vietnam
Brazil
Russia
Thailand
Developing nations however have seen the fastest growth in recognised intangible asset value.
The countries with the fastest growth in recognised intangible asset value are mostly Stage 1 and 2 developing countries: Thailand (25.9% growth); Russia (25.6%); Brazil (24.8%); Vietnam (24.5%); Chile (22.9%).
Asian countries occupy seven of the top ten spots. Some of the M&A activity has been fuelled by domestic governments, for example the ‘Going Global Strategy’ of the People’s Republic of China, which encourages its enterprises to invest overseas.
2014 saw a significant year for the Asia-Pacific region in terms of M&A activity, hitting its largest ever total of M&A deals at US$716 billion.
This large shift of intangible value from West to East is a fairly recent trend. Take India for example. It has managed to grow its ‘disclosed’ intangible value by 13% in 6 years to 2015, representing the recognition of newly acquired intangible assets such as the acquisition of UK heritage brands such as Jaguar and Land Rover by the TATA Group of India.
Western-based enterprises face challenging conditions, including tougher regulatory regimes, bearish-to-neutral economic outlooks and higher compliance requirements. Some are forced to break up and divest, with parts being quickly snapped up by regional powerhouses looking to expand their networks through acquisitions
Eastern-hemisphere economies appear to be shifting their focus from manufacturing to service-led industries, which will see intangibles form an even greater proportion of their companies’ enterprise values.
Brand Finance GIFT 2015 with CIMA April 2015 12.
Executive Summary
Top 20 Sectors - Disclosed Intangibles (US$ billion)
Top 20 Companies - Disclosed Intangibles (US$ billion)
■ Disclosed Intangibles (ex g/w) ■ Goodwill
0 200 400 600 800 1000 1200 1400
Holding Companies-Divers
Auto Manufacturers
Computers
Aerospace/Defense
Healthcare-Services
Chemicals
Software
Engineering&Construction
Miscellaneous Manufactur
Oil&Gas
Retail
Electric
Commercial Services
Insurance
Beverages
Food
Media
Pharmaceuticals
Banks & DFS
Telecommunications 1,212
1,052
767
597
489
394
378
352
339
312
298
288
237
235
230
229
224
208
180
156
0 20 40 60 80 100 120 140
Nestle SA-REG
Orange
Telefonica SA
Novartis AG-REG
Sprint Corp
Christian Dior
Deutsche Telekom AG-REG
Softbank Corp
Vodafone Group Plc
Bank Of America Corp
Berkshire Hathaway Inc-CL A
Volkswagen AG
Pfizer Inc
Procter & Gamble Co/The
Sanofi
General Electric Co
Comcast Corp-Class A
Verizon Communications Inc
Anheuser-Busch Inbev NV
At&T Inc 137
106
106
104
92
88
82
79
76
75
74
74
73
63
56
55
54
53
50
49
■ Disclosed Intangibles (ex g/w) ■ Goodwill
Most Intangible Countries(%)
-15 5 25 45 65 85 105
Zimbabwe
South Korea
Austria
Croatia
Poland
Bermuda
Jordan
Japan
Brazil
Italy
Georgia
Hong Kong
Colombia
Norway
Singapore
United Arab Emirates
Turkey
Chile
Nigeria
Kuwait
Oman
Taiwan
Sri Lanka
Portugal
Vietnam
Malaysia
Tunisia
Luxembourg
Spain
Netherlands
New Zealand
Peru
Israel
China
Saudi Arabia
Egypt
Philippines
Australia
Canada
Kenya
Morocco
Pakistan
Thailand
Finland
Argentina
Germany
France
India
Sweden
South Africa
Indonesia
Switzerland
Mexico
United Kingdom
Belgium
Denmark
United States
Brand Finance GIFT 2015 with CIMA April 2015 13.
0
500
1000
1500
2000
2500
3000
3500
4000
4500
1200
845
1286
1533 1627
2018 1905
289
1345 1458
834
13191706
1586
387
83
922 976 1083 1179 1108 1245 1211 1200 1202 1163 1455 1478 1232 1376
439
413
325
387
396
336348
386441
210
346
395
366
427
518
223
444
198
442
145108
455444
8687
384
2001 2002 2003 2004 2005 2006 2007 2008 2009 2010 2011 2012 2013 2014
■ Tangible Net Assets ■ Disclosed Intangibles (ex g/w) ■ Goodwill■ Undisclosed Value
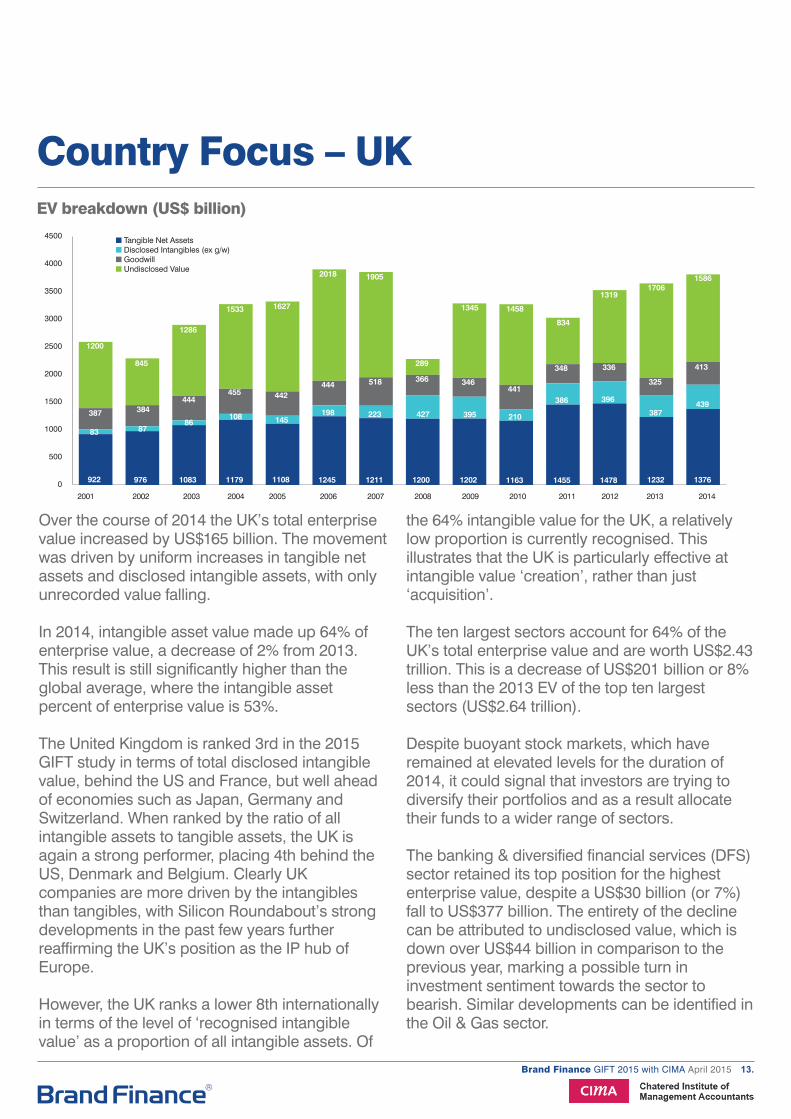
EV breakdown (US$ billion)
Over the course of 2014 the UK’s total enterprise value increased by US$165 billion. The movement was driven by uniform increases in tangible net assets and disclosed intangible assets, with only unrecorded value falling.
In 2014, intangible asset value made up 64% of enterprise value, a decrease of 2% from 2013. This result is still significantly higher than the global average, where the intangible asset percent of enterprise value is 53%.
The United Kingdom is ranked 3rd in the 2015 GIFT study in terms of total disclosed intangible value, behind the US and France, but well ahead of economies such as Japan, Germany and Switzerland. When ranked by the ratio of all intangible assets to tangible assets, the UK is again a strong performer, placing 4th behind the US, Denmark and Belgium. Clearly UK companies are more driven by the intangibles than tangibles, with Silicon Roundabout’s strong developments in the past few years further reaffirming the UK’s position as the IP hub of Europe.
However, the UK ranks a lower 8th internationally in terms of the level of ‘recognised intangible value’ as a proportion of all intangible assets. Of
the 64% intangible value for the UK, a relatively low proportion is currently recognised. This illustrates that the UK is particularly effective at intangible value ‘creation’, rather than just ‘acquisition’. The ten largest sectors account for 64% of the UK’s total enterprise value and are worth US$2.43 trillion. This is a decrease of US$201 billion or 8% less than the 2013 EV of the top ten largest sectors (US$2.64 trillion).
Despite buoyant stock markets, which have remained at elevated levels for the duration of 2014, it could signal that investors are trying to diversify their portfolios and as a result allocate their funds to a wider range of sectors.
The banking & diversified financial services (DFS) sector retained its top position for the highest enterprise value, despite a US$30 billion (or 7%) fall to US$377 billion. The entirety of the decline can be attributed to undisclosed value, which is down over US$44 billion in comparison to the previous year, marking a possible turn in investment sentiment towards the sector to bearish. Similar developments can be identified in the Oil & Gas sector.
Country Focus – UK
Brand Finance GIFT 2015 with CIMA April 2015 14.
0 50 100 150 200 250 300 350 400
■ Tangible Net Assets ■ Disclosed Intangibles (ex g/w) ■ Goodwill■ Undisclosed Value
Agriculture
Beverages
Telecommunications
Oil&Gas
Insurance
Media
Pharmaceuticals
Food
Mining
Banks & DFS
-50
Top 10 sectors by EV (US$ billion)
0 10 20 30 40 50 60 70 80 90 100%
Pharmaceuticals
Agriculture
Media
Beverages
Food
Insurance
Telecommunications
Oil&Gas
Mining
Banks & DFS
-20
Top 10 sectors by EV (% split)
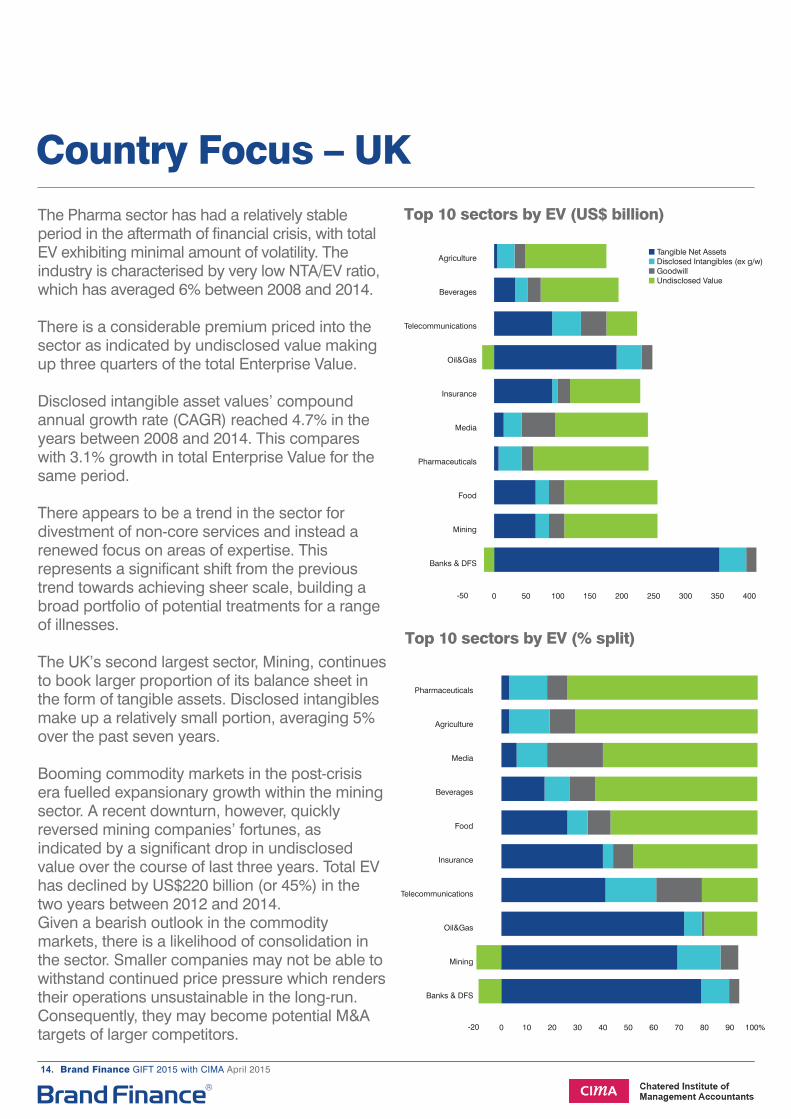
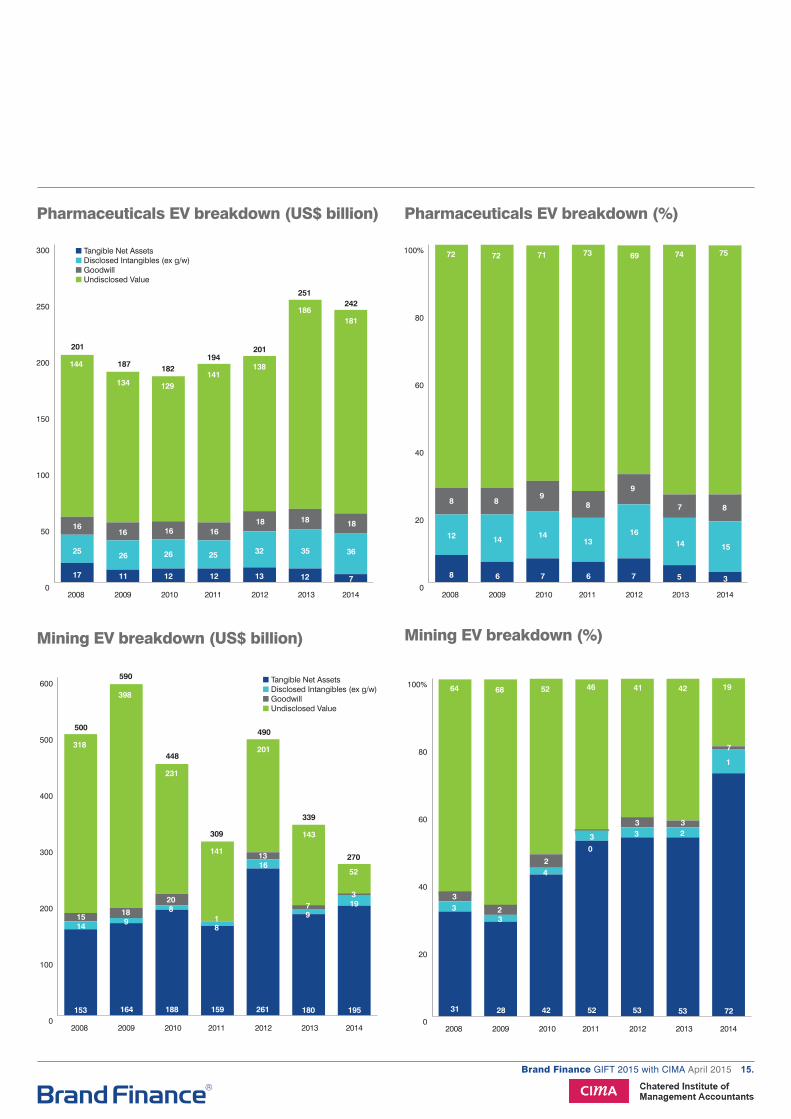
The Pharma sector has had a relatively stable period in the aftermath of financial crisis, with total EV exhibiting minimal amount of volatility. The industry is characterised by very low NTA/EV ratio, which has averaged 6% between 2008 and 2014.
There is a considerable premium priced into the sector as indicated by undisclosed value making up three quarters of the total Enterprise Value.
Disclosed intangible asset values’ compound annual growth rate (CAGR) reached 4.7% in the years between 2008 and 2014. This compares with 3.1% growth in total Enterprise Value for the same period.
There appears to be a trend in the sector for divestment of non-core services and instead a renewed focus on areas of expertise. This represents a significant shift from the previous trend towards achieving sheer scale, building a broad portfolio of potential treatments for a range of illnesses.
The UK’s second largest sector, Mining, continues to book larger proportion of its balance sheet in the form of tangible assets. Disclosed intangibles make up a relatively small portion, averaging 5% over the past seven years.
Booming commodity markets in the post-crisis era fuelled expansionary growth within the mining sector. A recent downturn, however, quickly reversed mining companies’ fortunes, as indicated by a significant drop in undisclosed value over the course of last three years. Total EV has declined by US$220 billion (or 45%) in the two years between 2012 and 2014.Given a bearish outlook in the commodity markets, there is a likelihood of consolidation in the sector. Smaller companies may not be able to withstand continued price pressure which renders their operations unsustainable in the long-run. Consequently, they may become potential M&A targets of larger competitors.
Country Focus – UK
Brand Finance GIFT 2015 with CIMA April 2015 15.
Mining EV breakdown (US$ billion) Mining EV breakdown (%)
0
100
200
300
400
500
600
153
2008 2009 2010 2011 2012 2013 2014
■ Tangible Net Assets ■ Disclosed Intangibles (ex g/w) ■ Goodwill■ Undisclosed Value
164 188 159 261 180 195
14 9
8
8
16
9193
7
13
1
20
1815
318
398
231
141
201
143
52
500
590
448
309
490
339
270
0
20
40
60
80
100%
31
2008 2009 2010 2011 2012 2013 2014
28 42 52 53 53 72
33
4
0
3 2
1
7
33
3
2
2
3
64 68 52 46 41 42 19
0
50
100
150
200
250
300
17
2008 2009 2010 2011 2012 2013 2014
■ Tangible Net Assets ■ Disclosed Intangibles (ex g/w) ■ Goodwill■ Undisclosed Value
11 12 12 13 12 7
25 26 26 25 32 35 36
181818161616
16
144
134 129141
138
186181
201
187 182194
201
251242
Pharmaceuticals EV breakdown (US$ billion)
0
20
40
60
80
100%
8
2008 2009 2010 2011 2012 2013 2014
6 7 6 7 5 3
12 14 1413
1614 15
87
9
89
88
72 72 71 73 69 74 75
Pharmaceuticals EV breakdown (%)

Brand Finance GIFT 2015 with CIMA April 2015 16.
CIMA Thought Piece
The research reported by Brand Finance shows how important intangible assets are to organisations. They constitute at least 50% of global enterprise value. Stakeholders who are interested in how organisations generate value cannot ignore the drivers of intangible value. For example policy makers will be interested in effective policies to accelerate investment in intangibles, how competition policy influence the formation and use of intangible assets, ways in which intangible assets facilitate entrepreneurship and new business models, and how efficiently markets work for key intangibles. Managers need to understand and influence these drivers if they are to be successful.
The report splits intangibles into three classes: disclosed intangibles (e.g. trademarks and licences); goodwill (calculated after acquisitions); and undisclosed value (difference between the market and book value of shareholders’ equity). Undisclosed value and goodwill make up more than 80% of the value of intangibles. They are both calculated after the fact and contain little or no information about the drivers of intangible value. They are therefore of limited value to stakeholders who wish to influence how intangible and enterprise value is generated. What is needed – to build on and fully drive value from the important analysis provided by this report - is a forward looking and integrated approach to understanding the value drivers of intangible assets and the dynamics between the drivers.
In May 2001 the then Department of Trade and
Industry (DTI) published the report Creating value from your intangible assets: unlocking your true potential. The report identified seven sources of intangible value: (i) relationships; (ii) knowledge; (iii) leadership and communications; (iv) culture and values; (v) reputation and trust; (vi) skills and competencies; and (vii) processes and systems. Drawing attention to these areas was a step forward however they were not integrated and the impact of one on the other was not articulated in the report.
More recently, the International Integrated Reporting Council (IIRC) published a report on how business models can provide the means by which value creation can take place in an integrated manner. In its simplest form this was primarily a model about how inputs are converted through business activities into outputs and outcomes. The major contribution of this work is its use of capitals to describe the inputs and the outcomes. The six capitals are (i) financial; (ii) manufactured; (iii) natural; (iv) human; (v) intellectual; and (vi) social and relational. The last three are “intangible capitals” under which the DTI drivers of intangible value can be grouped. However the IIRC report does not offer deep insights into how these capitals integrate with each other and with the business activities that convert them from inputs into outputs and outcomes.
In late 2014 the chartered institute of management accountants (CIMA) and the american institute of certified public accountants (AICPA) published a set of global management accounting principles (GMAPs) which addresses
Noel Tagoe, Executive Director, CIMA
An Integrated Approach to Driving the Value of Intangibles
Brand Finance GIFT 2015 with CIMA April 2015 17.
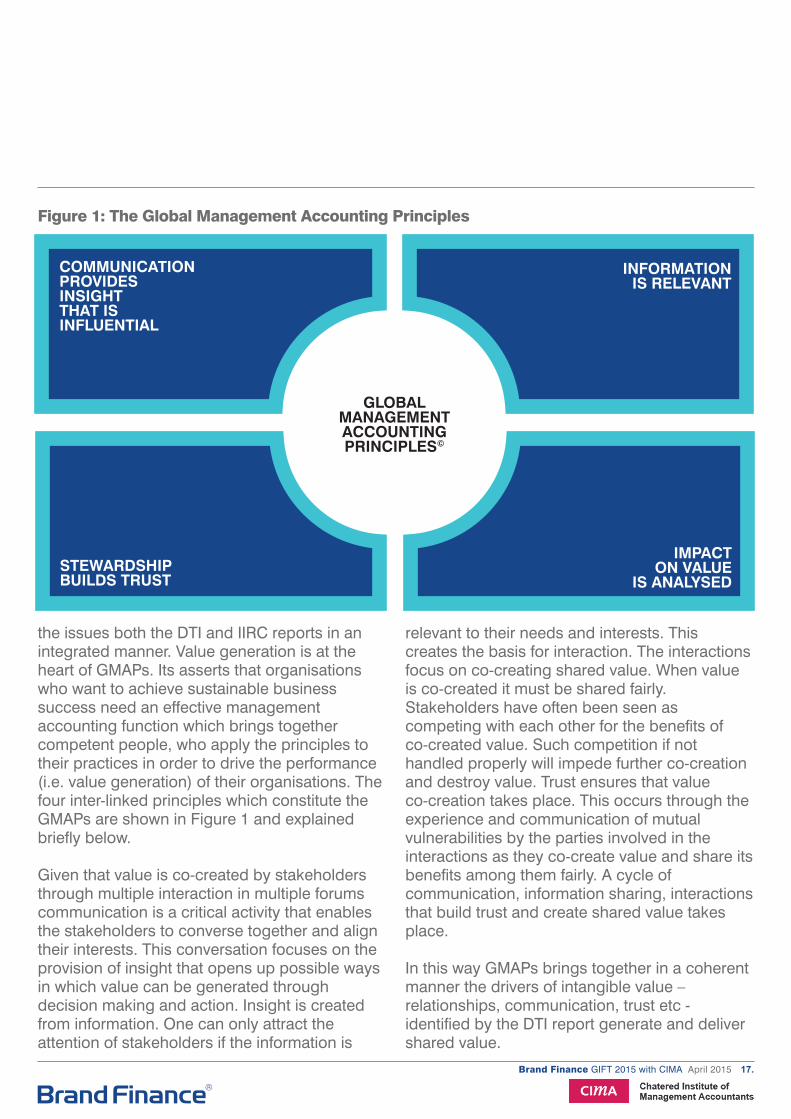
the issues both the DTI and IIRC reports in an integrated manner. Value generation is at the heart of GMAPs. Its asserts that organisations who want to achieve sustainable business success need an effective management accounting function which brings together competent people, who apply the principles to their practices in order to drive the performance (i.e. value generation) of their organisations. The four inter-linked principles which constitute the GMAPs are shown in Figure 1 and explained briefly below.
Given that value is co-created by stakeholders through multiple interaction in multiple forums communication is a critical activity that enables the stakeholders to converse together and align their interests. This conversation focuses on the provision of insight that opens up possible ways in which value can be generated through decision making and action. Insight is created from information. One can only attract the attention of stakeholders if the information is
relevant to their needs and interests. This creates the basis for interaction. The interactions focus on co-creating shared value. When value is co-created it must be shared fairly. Stakeholders have often been seen as competing with each other for the benefits of co-created value. Such competition if not handled properly will impede further co-creation and destroy value. Trust ensures that value co-creation takes place. This occurs through the experience and communication of mutual vulnerabilities by the parties involved in the interactions as they co-create value and share its benefits among them fairly. A cycle of communication, information sharing, interactions that build trust and create shared value takes place.
In this way GMAPs brings together in a coherent manner the drivers of intangible value – relationships, communication, trust etc - identified by the DTI report generate and deliver shared value.
Figure 1: The Global Management Accounting Principles
COMMUNICATIONPROVIDES INSIGHT THAT IS INFLUENTIAL
INFORMATIONIS RELEVANT
STEWARDSHIPBUILDS TRUST
IMPACTON VALUE
IS ANALYSED
GLOBALMANAGEMENTACCOUNTINGPRINCIPLES©
Brand Finance GIFT 2015 with CIMA April 2015 18.
MethodologyIntangible Assets
Intangible assets can be grouped into three broad categories — rights, relationships and intellectual property:
1/ Rights. Leases, distribution agreements, employment contracts, covenants, financing arrangements, supply contracts, licences, certifications, franchises.
2/ Relationships. Trained and assembled workforce, customer and distribution relationships.
3/ Intellectual property. Patents; copyrights; trademarks; proprietary technology (for example, formulas, recipes, specifications, formulations, training programmes, marketing strategies, artistic techniques, customer lists, demographic studies, product test results); business knowledge — such as suppliers’ lead times, cost and pricing data, trade secrets and know-how.
Internally generated intangibles cannot be disclosed on the balance sheet, but are often significant in value, and should be understood and managed appropriately. Under IFRS 3, only intangible assets that have been acquired can be separately disclosed on the acquiring company’s consolidated balance sheet (disclosed intangible assets).
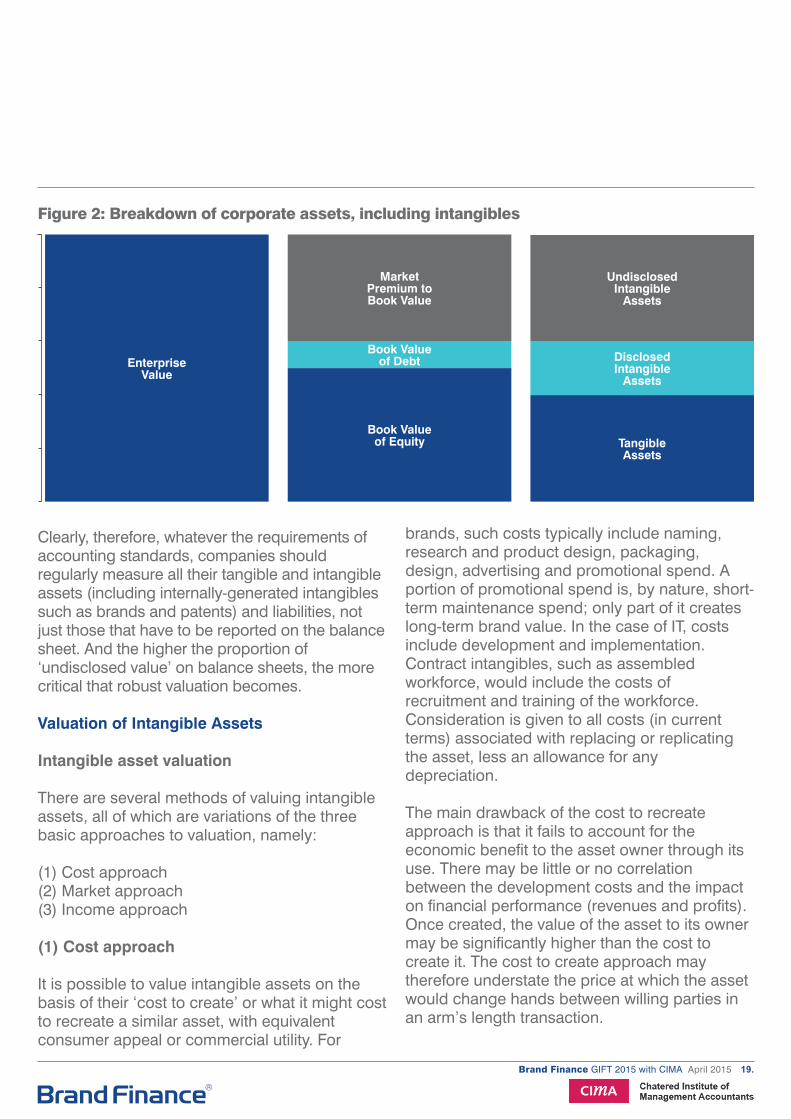
Figure 2 illustrates how intangible value is made up of both disclosed and undisclosed value.
‘Undisclosed intangible assets’, are often more valuable than the disclosed intangibles. The category includes ‘internally generated goodwill’, and it accounts for the difference between the fair market value of a business and the value of its identifiable tangible and intangible assets.
Although not an intangible asset in a strict sense — that is, a controlled ‘resource’ expected to
provide future economic benefits (see below) — this residual goodwill value is treated as an intangible asset in a business combination on the acquiring company’s balance sheet. Current accounting practice does not allow for internally generated intangible assets to be disclosed on a balance sheet. Under current IFRS only the value of acquired intangible assets can be recognised. In accounting terms, an asset is defined as a resource that is controlled by the entity in question and which is expected to provide future economic benefits to it. The International Accounting Standards Board’s definition of an intangible asset requires it to be non-monetary, without physical substance and ‘identifiable’.
In order to be ‘identifiable’ it must either be separable (capable of being separated from the entity and sold, transferred or licensed) or it must arise from contractual or legal rights (irrespective of whether those rights are themselves ‘separable’). Therefore, intangible assets that may be recognised on a balance sheet under IFRS are only a fraction of what are often considered to be ‘intangible assets’ in a broader sense.
However, the picture has improved since 2001, when IFRS3 in Europe, and FAS141 in the US, started to require companies to break down the value of the intangibles they acquire as a result of a takeover into five different categories — including customer and market related intangibles — rather than lumping them together under the catch-all term ‘goodwill’ as they had in the past. But because only acquired intangibles, and not those internally generated, can be recorded on the balance sheet, this results in a lopsided view of a company’s value. What’s more, the value of those assets can only stay the same or be revised downwards in each subsequent year, thus failing to reflect the additional value that the new stewardship ought to be creating.
Brand Finance GIFT 2015 with CIMA April 2015 19.
Clearly, therefore, whatever the requirements of accounting standards, companies should regularly measure all their tangible and intangible assets (including internally-generated intangibles such as brands and patents) and liabilities, not just those that have to be reported on the balance sheet. And the higher the proportion of ‘undisclosed value’ on balance sheets, the more critical that robust valuation becomes.
Valuation of Intangible Assets Intangible asset valuation
There are several methods of valuing intangible assets, all of which are variations of the three basic approaches to valuation, namely:
(1) Cost approach(2) Market approach(3) Income approach
(1) Cost approach
It is possible to value intangible assets on the basis of their ‘cost to create’ or what it might cost to recreate a similar asset, with equivalent consumer appeal or commercial utility. For
Figure 2: Breakdown of corporate assets, including intangibles
EnterpriseValue
MarketPremium toBook Value
UndisclosedIntangible
Assets
Book Valueof Debt
Book Valueof Equity
DisclosedIntangible
Assets
TangibleAssets
brands, such costs typically include naming, research and product design, packaging, design, advertising and promotional spend. A portion of promotional spend is, by nature, short-term maintenance spend; only part of it creates long-term brand value. In the case of IT, costs include development and implementation. Contract intangibles, such as assembled workforce, would include the costs of recruitment and training of the workforce. Consideration is given to all costs (in current terms) associated with replacing or replicating the asset, less an allowance for any depreciation.
The main drawback of the cost to recreate approach is that it fails to account for the economic benefit to the asset owner through its use. There may be little or no correlation between the development costs and the impact on financial performance (revenues and profits). Once created, the value of the asset to its owner may be significantly higher than the cost to create it. The cost to create approach may therefore understate the price at which the asset would change hands between willing parties in an arm’s length transaction.
Brand Finance GIFT 2015 with CIMA April 2015 20.
Methodology(2) Market approach
Also known as the ‘sales comparison’ approach, this is where fair value is determined by making comparisons with actual sales of comparable assets. However for numerous types of intangible assets, including brands, it is uncommon for the asset to be sold separately from the other assets of a business. It is therefore often difficult to find examples of prices paid in outright sales for comparable assets. Many valuable intangibles are unique and unless there is a transaction in the specific asset under consideration, any comparison of prices may be unhelpful or require significant adjustments.
(3) Income approach
The income approach is often used to estimate the value of intangible assets by considering the net present value (‘NPV’) of the stream of future benefits accruing to the owner of the assets.
This approach considers income and expense data relating to the asset being valued and estimates value through a capitalisation process. Capitalisation relates income (usually a net income figure) and value by converting an income amount into a value estimate. This process may consider direct relationships (capitalisation rates or multiples), yield or discount rates (reflecting measures of return on investment), or a combination of these. In general, the principle of substitution holds that the income stream which produces the highest NPV commensurate with a given level of risk leads to the most probable value figure.
There are a number of methodologies falling under the income approach.
- Royalty relief methodology
This approach hypothesises two separate businesses, one involved in manufacturing and/
or marketing and one in intellectual property (‘IP’) ownership. The asset owner is assumed to license its IP to the manufacturer/ marketing company and receive a royalty in return based on the value/ volume of sales of the products using the IP. Thus, if a company actually owns rather than licenses the IP it is relieved from paying such royalties.
Hence, the value of an IP asset owned by a company can be determined by estimating the royalties it would have to pay if it were the licensee rather than the owner.
The current capital value of the asset is calculated using either a multiple or Discounted Cash Flow (see diagram) to arrive at the current value of the expected future royalties saved by the owner.
- Multi-period excess earnings
This method measures the present value of future earnings to be generated during the remaining lives of the assets. Using enterprise value as the starting point, pre-tax earnings or cash flows attributable to the asset are calculated.
Deductions are made for operating costs and overheads. Adjustments may be made for costs that it is considered should not be borne by the asset in question. This results in an estimate of earnings attributable to the asset.
It is then necessary to make a charge for contributory assets. These represent charges for the use of contributory assets employed to support the asset being valued and help generate revenue. The cash flows from the asset under review must support charges for the replacement of assets employed and provide a fair return to the owners of capital. The rates of return for each contributory asset are reflective of the risk inherent in each asset. Contributory
Brand Finance GIFT 2015 with CIMA April 2015 21.
charges are taken on the fair value of the assets at the acquisition date. Required returns are then deducted from earnings or cash flows. If more than one asset is being valued using this approach then the charges are allocated between these assets using some form of allocation basis (e.g. relative revenues).
The expected useful economic life of the asset is estimated. Some form of declining revenue curve may be used to reflect declining productivity of the asset if applicable. The surviving cash flows after contributory charges are projected out over the expected life of the asset and discounted back to a NPV. The value is determined after deducting a charge for income tax and adding a tax amortisation benefit if applicable. GIFT approach and methodology The main body of this report analyses the stock market values of companies, global sectors and countries, breaking them down into the tangible and intangible assets disclosed on company balance sheets and the additional value attributed by the stock market.
The additional value attributed by the market over and above the stated shareholders’ equity value – the premium to net asset value, which we refer to as ‘undisclosed value’ (i.e. not disclosed on company balance sheets) – includes intangible assets that are not on the balance sheet either because they were internally generated (the most significant – other than ‘internally generated goodwill’ – being brands) or because they fall outside the definition of an intangible asset that may be identified and capitalised following an acquisition.
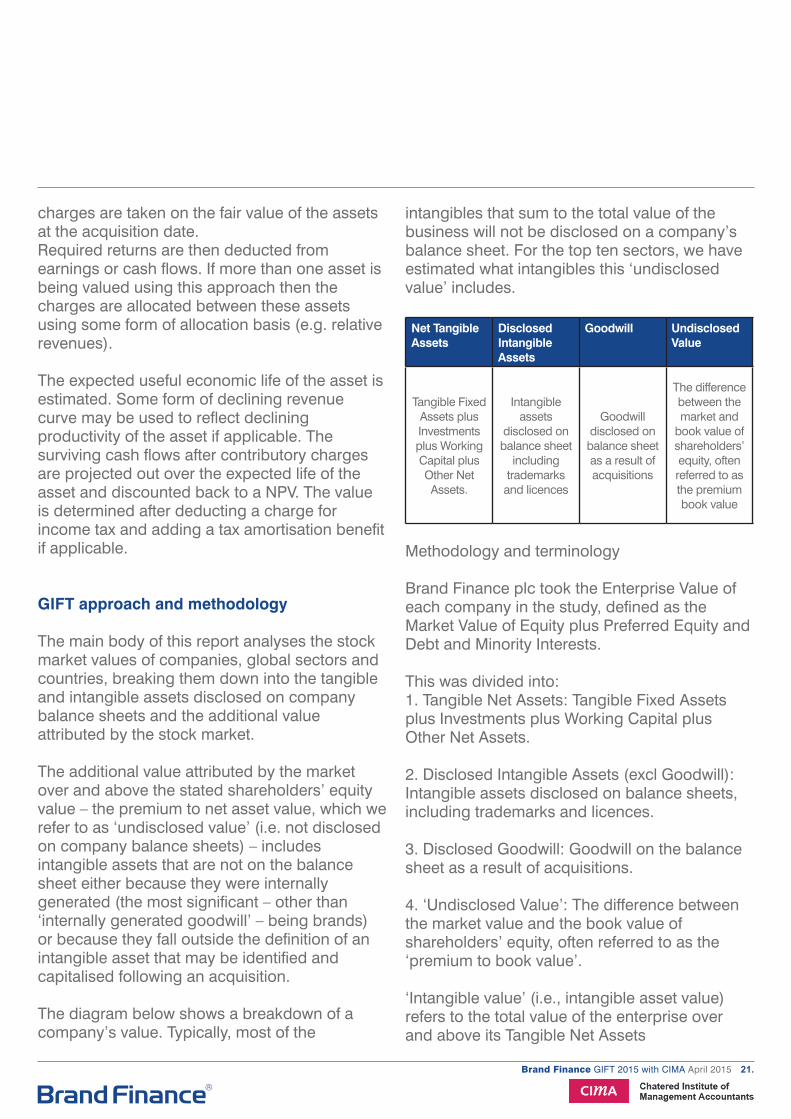
The diagram below shows a breakdown of a company’s value. Typically, most of the
intangibles that sum to the total value of the business will not be disclosed on a company’s balance sheet. For the top ten sectors, we have estimated what intangibles this ‘undisclosed value’ includes.
Net Tangible Assets
Disclosed Intangible Assets
Goodwill Undisclosed Value
Tangible FixedAssets plus Investments plus WorkingCapital plus Other Net Assets.
Intangible assets
disclosed on balance sheet
including trademarks
and licences
Goodwill disclosed on balance sheet as a result of acquisitions
The difference between the market and
book value of shareholders’ equity, often referred to as the premium book value
Methodology and terminology
Brand Finance plc took the Enterprise Value of each company in the study, defined as the Market Value of Equity plus Preferred Equity and Debt and Minority Interests.
This was divided into:1. Tangible Net Assets: Tangible Fixed Assets plus Investments plus Working Capital plus Other Net Assets.
2. Disclosed Intangible Assets (excl Goodwill): Intangible assets disclosed on balance sheets, including trademarks and licences.
3. Disclosed Goodwill: Goodwill on the balance sheet as a result of acquisitions.
4. ‘Undisclosed Value’: The difference between the market value and the book value of shareholders’ equity, often referred to as the ‘premium to book value’.
‘Intangible value’ (i.e., intangible asset value) refers to the total value of the enterprise over and above its Tangible Net Assets
Brand Finance GIFT 2015 with CIMA April 2015 22.
Financial Reporting of Intangible AssetsFinancial Reporting of Intangible Assets
Until 2001, no countries required recognition of acquired intangible assets separately from goodwill. IFRS 3 now requires that, on acquisition, intangible assets should be separately disclosed on the acquiring company’s consolidated balance sheet. FAS 141 introduced the same requirement for US companies four years earlier, in 2001.
In 2005, all listed companies in EU member countries adopted IFRS.
At present, approximately 90 nations have fullyconformed with IFRS, with a further 30 countriesand reporting jurisdictions either permitting orrequiring IFRS compliance for domestically listedcompanies.
The adoption of IFRS accounting standards means that the value of disclosed intangible assets is likely to increase in the future. Strong advocates of ‘fair value reporting’ believe that all of a company’s tangible and intangible assets and liabilities should regularly be measured at fair value and reported on the balance sheet, including internally generated intangibles such as brands and patents, so long as valuation methods and corporate governance are sufficiently rigorous.
Some go as far as to suggest that ‘internally generated goodwill’ should be reported on the balance sheet at fair value, meaning that management would effectively be required to report its own estimate of the value of the business at each year end together with supporting assumptions.
However, the current international consensus is that internally generated intangible assets generally should not be recognised on the balance sheet. Under IFRS, certain intangible assets should be recognised, but only if they are
in the “development” (as opposed to “research”) phase, with conditions on, for example, technical feasibility and the intention and ability to complete and use the asset. “Internally generated goodwill”, as well as internally generated “brands, mastheads, publishing titles, customer lists and items similar in substance”, may not be recognised.
IFRS: Allocating the cost of a business combination
At the date of acquisition, an acquirer must measure the cost of the business combination by recognising the target’s identifiable assets (tangible and intangible), liabilities and contingent liabilities at their fair value. Any difference between the total of the net assets acquired and the cost of acquisition is treated as goodwill (or gain on a bargain purchase).
Goodwill: After initial recognition of goodwill, IFRS 3 requires that goodwill be recorded at cost less accumulated impairment charges. Whereas previously (under IAS 22) goodwill was amortised over its useful economic life (presumed not to exceed 20 years), it is now subject to impairment testing at least once a year. Amortisation is no longer permitted.
Gain on a bargain purchase: Gain on a bargain purchase arises where the purchase price is determined to be less than the fair value of the net assets acquired. It must be recognised immediately as a profit in the profit and loss account. However, before concluding that “negative goodwill” has arisen, IFRS 3 says that an acquirer should “reassess” the identification and measurement of the acquired identifiable assets and liabilities.
Impairment of Assets
A revised IAS 36 ‘Impairment of Assets’ was issued at the same time as IFRS 3, on 31 March
Brand Finance GIFT 2015 with CIMA April 2015 23.
Financial Reporting of Intangible Assets
2004. Previously an impairment test was only required if a ‘triggering event’ indicated that impairment might have occurred. Under the revised rules, an annual impairment test is still required for certain assets, namely:
• Goodwill
• Intangible assets with an indefinite useful economic life and intangible assets not yet available for use.
Brands are one major class of intangible asset that are often considered to have indefinite useful economic lives. Where acquired brands are recognised on the balance sheet post-acquisition it is important to establish a robust and supportable valuation model using best practice valuation techniques that can be consistently applied at each annual impairment review.
The revised IAS 36 also introduces new disclosure requirements, the principal one being the disclosure of the key assumptions used in the calculation. Increased disclosure is required where a reasonably possible change in a key assumption would result in actual impairment.
Impact on managers and investors
a) Management
Perhaps the most important impact of new reporting standards has been on management accountability. Greater transparency, rigorous impairment testing and additional disclosure should mean more scrutiny both internally and externally. The requirement for the acquiring company to attempt to explain at least a part of what was previously lumped into “goodwill” should help analysts to analyse deals more closely and gauge whether management have paid a sensible price.
The new standards are also having a significant impact on the way companies plan their acquisitions. When considering an acquisition, a detailed analysis of all the target company’s potential assets and liabilities is recommended to assess the impact on the consolidated group balance sheet and P&L post-acquisition. Companies need to pay close attention to the likely classification and useful economic lives of the identifiable intangible assets in the target company’s business. This will have a direct impact on the future earnings of the acquiring group. In addition to amortisation charges for intangible assets with definite useful economic lives, impairment tests on assets with indefinite useful economic lives may lead to one-off impairment charges, particularly if the acquired business falls short of expectations post-acquisition.
The requirement for separate balance sheet recognition of intangible assets, together with impairment testing of those assets and also goodwill, is expected to result in an increase in the involvement of independent specialist valuers to assist with valuations and on appropriate disclosure.
b) Investors
The requirement for companies to attempt to identify what intangible assets they are acquiring as part of a corporate transaction may provide evidence as to whether a group has paid too much in a deal. Subsequent impairment tests may also shed light on whether the price paid was a good one for the acquiring company’s shareholders.
Regular impairment testing is likely to result in a greater volatility in financial results. Significant one-off impairment charges may indicate that a company has overpaid for an acquisition and have the potential to damage the credibility of management in the eyes of the investor community.
Brand Finance GIFT 2015 with CIMA April 2015 24.
Implications for M&A and TaxGlobal Acquisitions
Global Acquisitions (US$ billion)
2009 2010 2011 2012 2013 2014
Deal Value (US$b) 1,355 1,674 1,957 1,778 1,843 2,061
Growth 23% 17% -9% 4% 12%
Deal Volume 4,603 5,945 6,513 6,096 6,183 5,631
Growth 29% 10% -6% 1% -9%
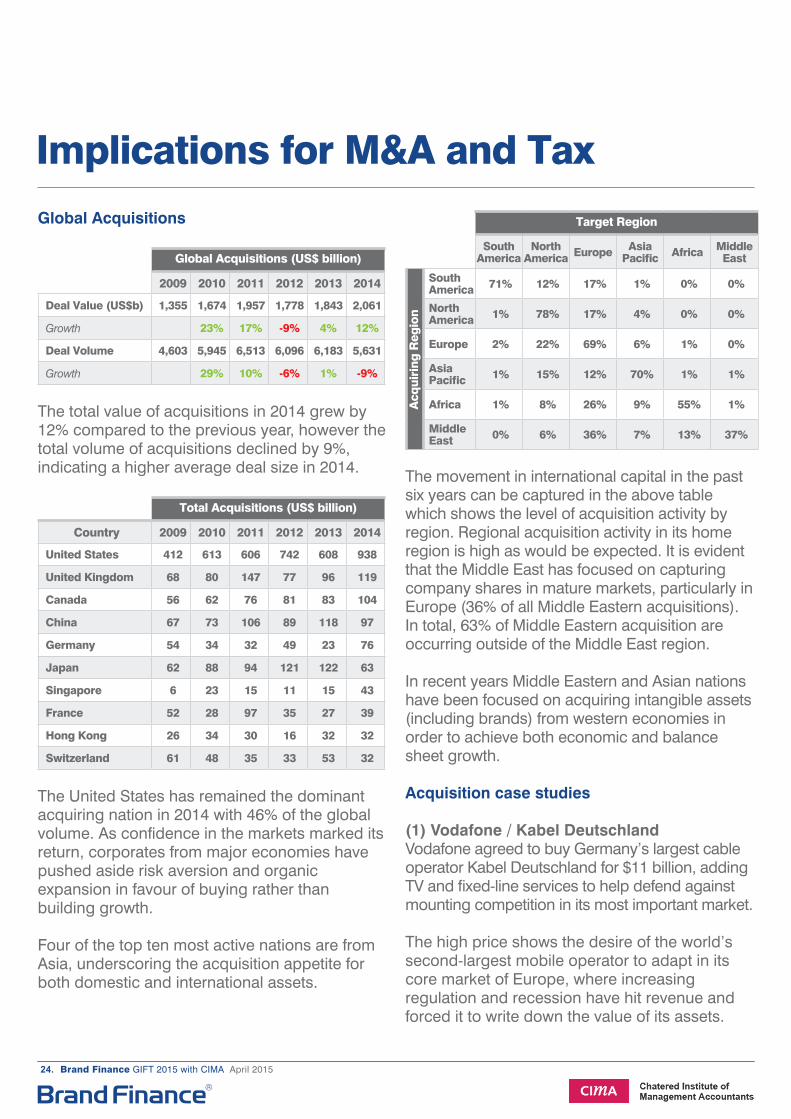
The total value of acquisitions in 2014 grew by 12% compared to the previous year, however the total volume of acquisitions declined by 9%, indicating a higher average deal size in 2014.
Total Acquisitions (US$ billion)
Country 2009 2010 2011 2012 2013 2014
United States 412 613 606 742 608 938
United Kingdom 68 80 147 77 96 119
Canada 56 62 76 81 83 104
China 67 73 106 89 118 97
Germany 54 34 32 49 23 76
Japan 62 88 94 121 122 63
Singapore 6 23 15 11 15 43
France 52 28 97 35 27 39
Hong Kong 26 34 30 16 32 32
Switzerland 61 48 35 33 53 32
The United States has remained the dominant acquiring nation in 2014 with 46% of the global volume. As confidence in the markets marked its return, corporates from major economies have pushed aside risk aversion and organic expansion in favour of buying rather than building growth.
Four of the top ten most active nations are from Asia, underscoring the acquisition appetite for both domestic and international assets.
Target Region
South America
North America Europe Asia
Pacific Africa Middle East
South America 71% 12% 17% 1% 0% 0%
North America 1% 78% 17% 4% 0% 0%
Europe 2% 22% 69% 6% 1% 0%
Asia Pacific 1% 15% 12% 70% 1% 1%
Africa 1% 8% 26% 9% 55% 1%
Middle East 0% 6% 36% 7% 13% 37%
The movement in international capital in the past six years can be captured in the above table which shows the level of acquisition activity by region. Regional acquisition activity in its home region is high as would be expected. It is evident that the Middle East has focused on capturing company shares in mature markets, particularly in Europe (36% of all Middle Eastern acquisitions). In total, 63% of Middle Eastern acquisition are occurring outside of the Middle East region.
In recent years Middle Eastern and Asian nations have been focused on acquiring intangible assets (including brands) from western economies in order to achieve both economic and balance sheet growth.
Acquisition case studies
(1) Vodafone / Kabel DeutschlandVodafone agreed to buy Germany’s largest cable operator Kabel Deutschland for $11 billion, adding TV and fixed-line services to help defend against mounting competition in its most important market.
The high price shows the desire of the world’s second-largest mobile operator to adapt in its core market of Europe, where increasing regulation and recession have hit revenue and forced it to write down the value of its assets.
Acq
uir
ing
Reg
ion
Brand Finance GIFT 2015 with CIMA April 2015 25.
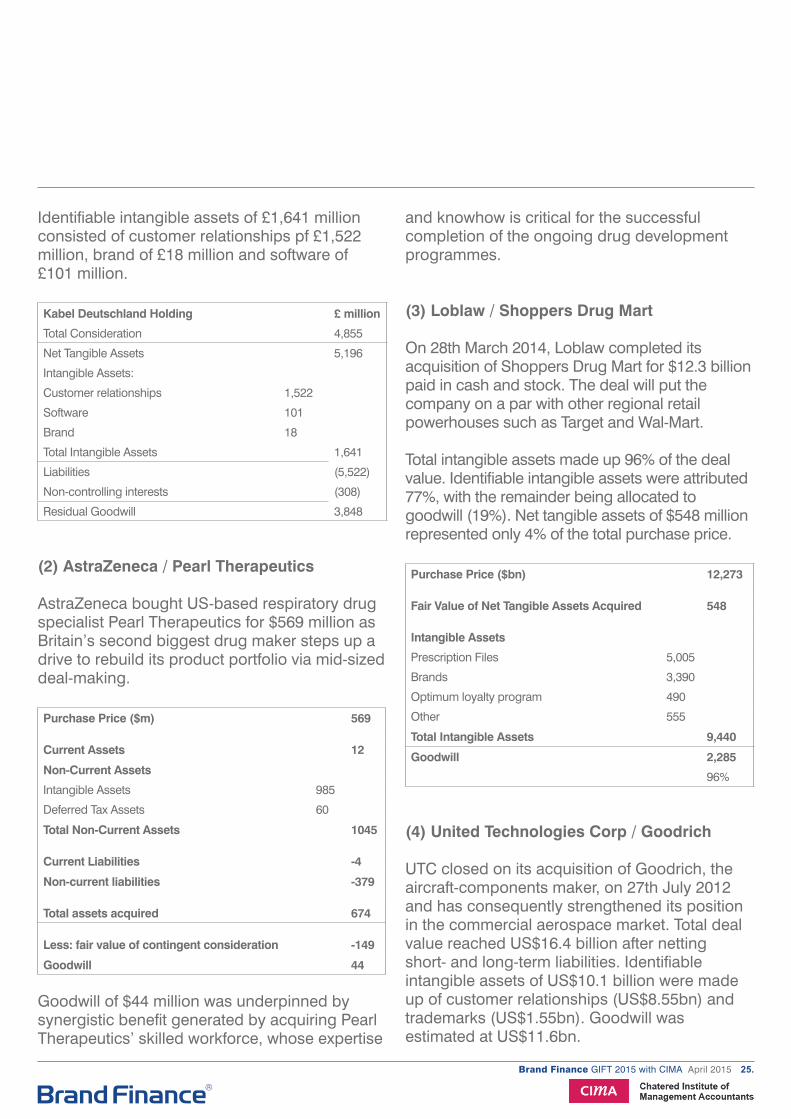
Identifiable intangible assets of £1,641 million consisted of customer relationships pf £1,522 million, brand of £18 million and software of £101 million.
Kabel Deutschland Holding £ million
Total Consideration 4,855
Net Tangible Assets 5,196
Intangible Assets:
Customer relationships 1,522
Software 101
Brand 18
Total Intangible Assets 1,641
Liabilities (5,522)
Non-controlling interests (308)
Residual Goodwill 3,848
(2) AstraZeneca / Pearl Therapeutics
AstraZeneca bought US-based respiratory drug specialist Pearl Therapeutics for $569 million as Britain’s second biggest drug maker steps up a drive to rebuild its product portfolio via mid-sized deal-making.
Purchase Price ($m) 569
Current Assets 12
Non-Current Assets
Intangible Assets 985
Deferred Tax Assets 60
Total Non-Current Assets 1045
Current Liabilities -4
Non-current liabilities -379
Total assets acquired 674
Less: fair value of contingent consideration -149
Goodwill 44
Goodwill of $44 million was underpinned by synergistic benefit generated by acquiring Pearl Therapeutics’ skilled workforce, whose expertise
and knowhow is critical for the successful completion of the ongoing drug development programmes.
(3) Loblaw / Shoppers Drug Mart
On 28th March 2014, Loblaw completed its acquisition of Shoppers Drug Mart for $12.3 billion paid in cash and stock. The deal will put the company on a par with other regional retail powerhouses such as Target and Wal-Mart.
Total intangible assets made up 96% of the deal value. Identifiable intangible assets were attributed 77%, with the remainder being allocated to goodwill (19%). Net tangible assets of $548 million represented only 4% of the total purchase price.
Purchase Price ($bn) 12,273
Fair Value of Net Tangible Assets Acquired 548
Intangible Assets
Prescription Files 5,005
Brands 3,390
Optimum loyalty program 490
Other 555
Total Intangible Assets 9,440
Goodwill 2,285
96%
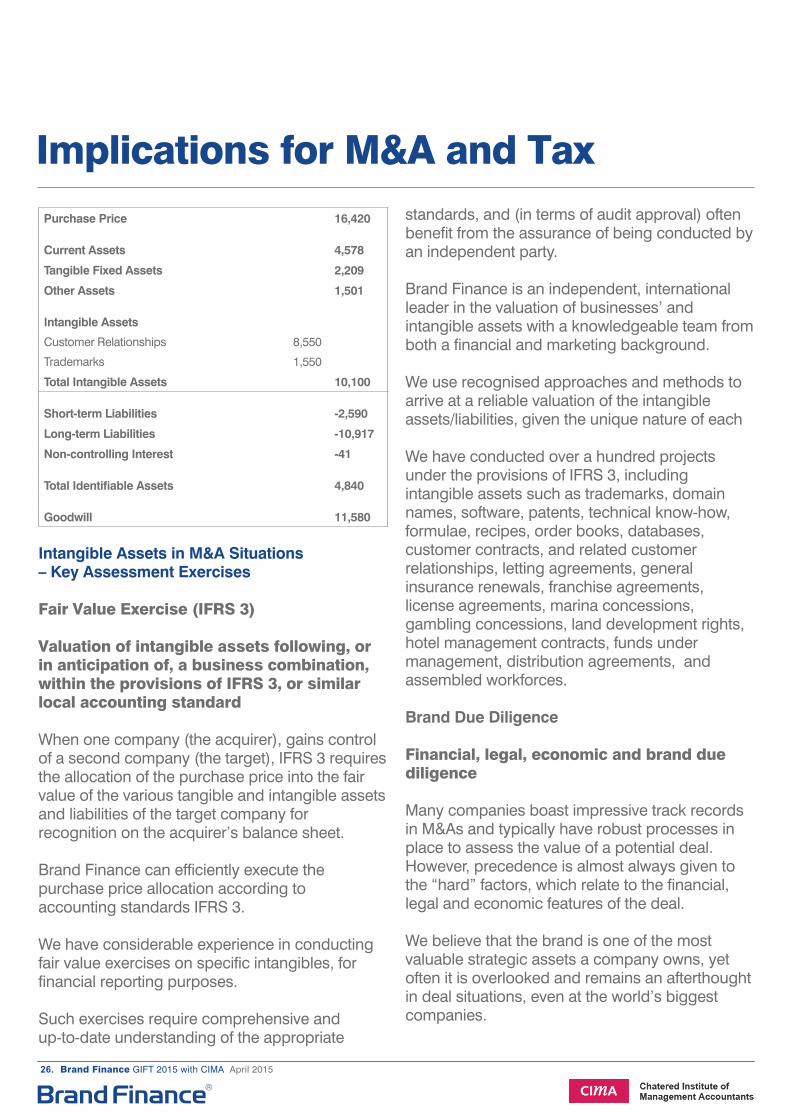
(4) United Technologies Corp / Goodrich
UTC closed on its acquisition of Goodrich, the aircraft-components maker, on 27th July 2012 and has consequently strengthened its position in the commercial aerospace market. Total deal value reached US$16.4 billion after netting short- and long-term liabilities. Identifiable intangible assets of US$10.1 billion were made up of customer relationships (US$8.55bn) and trademarks (US$1.55bn). Goodwill was estimated at US$11.6bn.
Brand Finance GIFT 2015 with CIMA April 2015 26.
Implications for M&A and Tax
Purchase Price 16,420
Current Assets 4,578
Tangible Fixed Assets 2,209
Other Assets 1,501
Intangible Assets
Customer Relationships 8,550
Trademarks 1,550
Total Intangible Assets 10,100
Short-term Liabilities -2,590
Long-term Liabilities -10,917
Non-controlling Interest -41
Total Identifiable Assets 4,840
Goodwill 11,580
Intangible Assets in M&A Situations– Key Assessment Exercises
Fair Value Exercise (IFRS 3)
Valuation of intangible assets following, or in anticipation of, a business combination, within the provisions of IFRS 3, or similar local accounting standard
When one company (the acquirer), gains control of a second company (the target), IFRS 3 requires the allocation of the purchase price into the fair value of the various tangible and intangible assets and liabilities of the target company for recognition on the acquirer’s balance sheet.
Brand Finance can efficiently execute the purchase price allocation according to accounting standards IFRS 3.
We have considerable experience in conducting fair value exercises on specific intangibles, for financial reporting purposes.
Such exercises require comprehensive and up-to-date understanding of the appropriate
standards, and (in terms of audit approval) often benefit from the assurance of being conducted by an independent party.
Brand Finance is an independent, international leader in the valuation of businesses’ and intangible assets with a knowledgeable team from both a financial and marketing background.
We use recognised approaches and methods to arrive at a reliable valuation of the intangible assets/liabilities, given the unique nature of each
We have conducted over a hundred projects under the provisions of IFRS 3, including intangible assets such as trademarks, domain names, software, patents, technical know-how, formulae, recipes, order books, databases, customer contracts, and related customer relationships, letting agreements, general insurance renewals, franchise agreements, license agreements, marina concessions, gambling concessions, land development rights, hotel management contracts, funds under management, distribution agreements, and assembled workforces.
Brand Due Diligence
Financial, legal, economic and brand due diligence
Many companies boast impressive track records in M&As and typically have robust processes in place to assess the value of a potential deal. However, precedence is almost always given to the “hard” factors, which relate to the financial, legal and economic features of the deal.
We believe that the brand is one of the most valuable strategic assets a company owns, yet often it is overlooked and remains an afterthought in deal situations, even at the world’s biggest companies.
Brand Finance GIFT 2015 with CIMA April 2015 27.
We help clients to ensure that the ‘brand’ stays at the forefront of M&A discussions and negotiations. Whilst conducting financial, legal and economic due diligence, we also seek to quantity the economic strength and value of the brand being acquired and assess both the positive and negative implications on integrating, merging or rebranding a target brand. We also work with clients to determine what the optimal migration pathway should be to ensure that as little as possible of the target brand’s positive brand equity is lost in the process.
Through a brand due diligence exercise, Brand Finance is able to aid strategic decision making before, during, and (potentially) following, M&A deals, building on existing M&A evaluation processes and KPI systems. We take a flexible approach to accommodate different M&A situations (e.g. deal size, strategic importance and timeline) and use a broad range of brand, business and external KPIs to facilitate the decision making process.
Intangibles and Tax
Tax planning: IP-holding companies As well as impacting on M&A, strategic planning and ROI analysis, the rise in the importance of marketing intangibles can often mean there is a strong business case for setting up a central IP-holding company (IPCo). Locating and managing an IPCo from one central location, potentially in a low tax jurisdiction, makes a compelling commercial case, particularly where a group is active in a number of different territories. The size and authority of the IPCo are variable and dependent on the requirements of the group in question. The benefits include greater IP protection and consistency and improved resource allocation. It is important that genuine commercial drivers for the establishment of IPCo can be demonstrated.
Examples of established IPCo’s include:
• BATMark (in UK, US, Switzerland & Netherlands)• Shell Brand International AG (Switzerland)• Société des Produits Nestlé (Switzerland)• Philip Morris Products SA (Switzerland)
Commercial benefits of central IPCo’s include:
• Governance and controls – more effective, efficient IP protection. This reduces the risk of infringement or loss of a trademark in key categories and jurisdictions
• Higher return on brand investment• Internal licenses should be used to clarify the
rights and responsibilities of the IPCo and operating units. The adoption of consistent and coherent brand strategy, marketing investment and brand control improves brand performance
• Better resource allocation• Internal royalties result in greater visibility of the
true economic performance of operating companies
• Improved earnings streams from external licenses
• Clarity of the strength, value and ownership of the IP ensures that full value is gained from third party agreements
• Tax savings can be achieved in certain circumstances
This can also have the following results:• Accumulation of profits in a low tax jurisdiction.• Tax deductions in high tax jurisdictions.• Tax deductions for the amortisation of intangible
in IPCo.• Depending on double tax treaties, the elimination
or reduction of withholding taxes on income flows resulting from the exploitation of the IP.
Contact us.
The World’s Leading Independent Brand Valuation and Strategy ConsultancyT: +44 (0)20 7389 9400E: [email protected] www.brandfinance.com
Bridging the gap between marketing and finance