gifted child quarterly - geri files/gentry/2010._peters,_gentry... · 300 gifted child quarterly...
TRANSCRIPT
http://gcq.sagepub.com/Gifted Child Quarterly
http://gcq.sagepub.com/content/54/4/298The online version of this article can be found at:
DOI: 10.1177/0016986210378332
2010 54: 298Gifted Child QuarterlyScott J. Peters and Marcia Gentry
Elementary Students for Gifted ProgramsMultigroup Construct Validity Evidence of the HOPE Scale: Instrumentation to Identify Low-Income
Published by:
http://www.sagepublications.com
On behalf of:
National Association for Gifted Children
can be found at:Gifted Child QuarterlyAdditional services and information for
http://gcq.sagepub.com/cgi/alertsEmail Alerts:
http://gcq.sagepub.com/subscriptionsSubscriptions:
http://www.sagepub.com/journalsReprints.navReprints:
http://www.sagepub.com/journalsPermissions.navPermissions:
http://gcq.sagepub.com/content/54/4/298.refs.htmlCitations:
at PURDUE UNIV LIBRARY TSS on April 15, 2011gcq.sagepub.comDownloaded from
Gifted Child Quarterly54(4) 298 –313© 2010 National Association for Gifted ChildrenReprints and permission: sagepub.com/journalsPermissions.navDOI: 10.1177/0016986210378332http://gcq.sagepub.com
Multigroup Construct Validity Evidence of the HOPE Scale: Instrumentation to Identify Low-Income Elementary Students for Gifted Programs
Scott J. Peters1 and Marcia Gentry2
Abstract
Students with exceptional academic potential who come from low-income families are frequently not identified for and consequently are underrepresented in gifted and talented programs. Because of this, new means of identifying such children must be developed. This article presents the findings of exploratory and confirmatory factor analyses conducted on the HOPE Scale, a 13-item teacher-rating instrument designed to identify academic and social components of giftedness in elementary-aged students. Participants included 349 teachers who completed HOPE Scales on 5,995 ethnically and economically diverse students from three rural and two metropolitan school districts in the Midwest. Multigroup confirmatory factor analysis was also used to evaluate measurement invariance between income groups. Findings suggest a two-factor model represents good fit for the data while remaining loyal to the latent constructs of academic and social giftedness. Although showing some legitimate mean differences, invariance test results suggested equivalence of model form, factor loading, and factor variances across income groups.
Putting the Research to Use
This research has important implications for practice. Frequently, traditional measures of achievement or aptitude under-identify children from low-income families. Concerns exist about the usefulness of teacher-ratings forms or scales in gifted and talented student identification. However, when given specific items or descriptors, teachers can provide useful information concerning student performance. The HOPE Scale provides items that teachers can use to rate specific social and academic behaviors of their students. Findings from this study revealed that teaches can effectively nominate low-income students for gifted programs. Further, items on the HOPE Scale were not biased against low-income students as rated by their teachers, meaning that the social and academic scales provided similar information concerning students in either income group. However, mean scores for student from low-income families on both scales were lower than their non-low income peers, providing evidence that instruments need to be normed on the specific groups for which their use is intended. Practitioners, should not shy away from using teacher nomination instruments, but they should consider the psychometric information available concerning the use of these instruments or rating forms as used with students in demographic groups of intended use. The HOPE Scale, as developed with indicated revisions, will provide educators and researchers with a simple, psychometrically sound instrument to help with identification of underrepresented student for gifted education services.
Keywords
factor analysis, quantitative methodologies, identification, assessment, low income, special populations/undeserved gifted, teacher nominations
Purpose
In this study, we sought to develop and evaluate a new instru-ment, the HOPE Scale, designed to help teachers more equi-tably identify K-5 children from low-income families for gifted and talented programs. This project had as its primary goal developing and evaluating an instrument that performed equally well regarding the internal statistical characteristics and factor-item structure for students from low-income and
non-low-income families. Including sufficient numbers of children from low income and culturally diverse families in
1University of Wisconsin–Whitewater, Whitewater, WI, USA2Purdue University, West Lafayette, IN, USA
Corresponding Author:Scott J. Peters, Department of Educational Foundations, University of Wisconsin–Whitewater, 800 W. Main Street, Whitewater, WI 53190, USAEmail: [email protected]
at PURDUE UNIV LIBRARY TSS on April 15, 2011gcq.sagepub.comDownloaded from
Peters and Gentry 299
the sample facilitated the investigation of factor structure sim-ilarities across income groups. The first step in creating this instrument was to examine the initial factor structure using a sample of teachers and children from schools with a third or more of their children coming from low-income families.
The HOPE Scale was not designed to be a stand-alone instrument, but rather to provide additional information beyond that generally provided by standardized achievement or aptitude tests. By combining HOPE Scale information with other measures of student achievement and ability, edu-cators can develop a more comprehensive picture of a child’s potential. The HOPE Scale uses directions developed by considering the federal definition of gifted and talented stu-dents and asks teachers to rate their students “ . . . compared with others similar in age, experience, or environment” (U.S. Department of Education, Office of Educational Research and Improvement, 1993, p. 3). Considering environment and experience are important as students from low-income fami-lies may appear less academically advanced if compared with age-peers from non-low-income families. For example, chil-dren from low-income families may have less access to res-ources and enrichment experiences and therefore have less background knowledge, resulting in differences in their test and school performance.
Theoretical RationaleIncome Group Representation
Despite advances in psychological assessment, family income remains one of the highest correlates with academic achieve-ment (Rogers, 1996; Valencia & Suzuki, 2001). Even though factors other than income are involved in this association (e.g., better access to high-quality schools), coming from a low-income family remains a disadvantage with regard to school success (Valencia & Suzuki, 2001; Wyner, Bridgeland, & Diiulio, 2009). Low-income students also tend to be underrepresented in programs for the gifted and talented (Stambaugh, 2007; Swanson, 2006). In the 2003-2004 school year, more than 40% of all students in American schools were eligible for the federal free and reduced lunch program (National Center for Educational Statistics, n.d.). This pro-gram has consistently been used as a gauge for economic standing and has even been criticized as being too exclusive thereby leaving a number of low-income students without assistance even though they are affected by many of the same problems as students who qualify (Viadero, 2006). Despite this percentage, only 28% of students achieving in the top quartile in first grade were from low-income families (Wyner et al., 2009). Wyner et al. also noted that even more problematic was that of those low-income students in the top quartile in first grade, only 56% maintained this high perfor-mance by fifth grade.
The Achievement Trap (Wyner et al., 2009) report out-lined many problems related to educating students from
low-income families. However, it also included several sug-gestions for how to address their underachievement and underperformance. One of the most important suggestions dealt with finding or identifying such students:
We must adopt a broader vision that recognizes the immense potential of many lower income students to perform at the highest levels of achievement and con-sider how to educate them in ways that close the exist-ing high-achievement gap. (p. 29)
Because students from low-income families are likely to underperform, they are also less likely to be noticed or nominated for gifted and talented programs (Stambaugh, 2007; Swanson, 2006). This creates a cyclical effect, as high-potential students from low-income families remain unnoticed when they may indeed benefit from services in gifted programs.
Stambaugh (2007), summarizing findings from a National Leadership Conference on Low-income, Promising Learn-ers, outlined several practices that could aid in identifying students from low-income families for gifted and talented programs. These practices included beginning identification as early as kindergarten and continuing with ongoing identi-fication to locate low-income students who may not demon-strate gifted and talented behaviors until later grades in school. She also suggested using teacher behavior checklists that have been shown to yield reliable and valid data on gift-edness and talent specifically for students from low-income families. Stambaugh emphasized the importance of using more specific normative groups in assessment than have tra-ditionally been used. Teacher-rating scales, as with any other measure, should be used in conjunction with multiple assess-ments to provide a comprehensive view of a student. Finally, participants in the conference identified professional devel-opment and teacher training as important to ensure that edu-cators know what behaviors to look for in low-income students who might benefit from gifted and talented pro-grams. One of the clearest conclusions from both the National Leadership Conference (Stambaugh, 2007) and the Achieve-ment Trap (Wyner et al., 2009) report was that solving the problem of underachievement and underrecognition of high-potential students from low-income families will require a concerted effort at the local and national levels to better rec-ognize these students in the early elementary years.
Controversy exists in the research literature about the covariance of race/ethnicity and income and their respective effects on school success (Valencia & Suzuki, 2001). In review-ing this issue, Valencia and Suzuki argued that too often the variables of race/ethnicity and socioeconomic status (SES) are not examined separately; and because of this, effects can-not be attributed to one particular variable. Accordingly, they recommend that any researchers interested in SES and race/ethnicity as variables should measure each separately to ana-lyze their respective influences. Similarly, Callahan (2007) called for any future study of instrument validation to include
at PURDUE UNIV LIBRARY TSS on April 15, 2011gcq.sagepub.comDownloaded from
300 Gifted Child Quarterly 54(4)
SES as a variable in addition to race, ethnicity, and gender. If researchers do not to measure SES and race/ethnicity sepa-rately in future studies, then the effects of these variables cannot be clearly interpreted.
Racial RepresentationYoon and Gentry (2009) analyzed data from three different sources to determine the extent of under- and overrepresen-tation of different racial and ethnic groups: the National Edu-cation Longitudinal Study of 1988 (NELS:88), the School and Staff Survey (SASS), and the Office for Civil Rights (OCR) data collection. What made this study unique is that the authors included the most-recent national data available and also disaggregated representation trends by state. Although African American, American Indian, and Hispanic students continue to be underrepresented on the national level and Caucasians and Asians continue to be overrepresented, con-siderable variation exists among states. For example, American Indian/Alaskan Native representation increased in Arkansas, Georgia, Maryland, Minnesota, New Mexico, Nevada, and Utah. Over the same period of time this group’s representa-tion decreased in Delaware, Iowa, and Pennsylvania. Similar analyses were presented for every racial or ethnic group. Across all the ethnic and racial groupings, only one or two states per group had close to proportional representation among ethnic/racial groups. Because of the wide range of individuals who might identify themselves under the same ethnic/racial category for the purpose of data collection, the authors argued that national trends are not the ideal means to measure representation. Instead, disaggregation by state and by racial and ethnic subgroup may provide better indicators. Just as with identification procedures, local context and spe-cific population considerations are important.
Teacher Nomination and Rating ScalesAccording to the 2006-2007 State of the States Report (National Association for Gifted Children [NAGC], 2007) the most common types of identification procedures for gifted and tal-ented programs include multiple criteria, achievement tests, IQ scores, and nominations, in order of prevalence. Despite multiple criteria being the most reported means of identifica-tion, the report also found that the most common time for implementing an identification procedure was after a teacher or parent referral (reported by 30 of 43 responding states). This means that despite any advances in standardized assess-ment, the initial identification catalyst remains an adult’s nomination. Thus, a single teacher can be the gatekeeper to the gifted and talented program. To better focus nominations, an entire genre of teacher rating and nomination forms as well as checklists has emerged over the past 40 years.
Teacher ratings, referrals, and nominations have often been criticized for their lack of validity (e.g., Pegnato & Birch, 1959; Peterson & Margolin, 1997). Pegnato and Birch’s
article is one of the most widely cited as having an empirical basis for this conclusion. In this study, the authors used teacher nominations for giftedness in several content and nonacademic areas (e.g., art, music, social/political). The 154 students who were nominated as “mentally” gifted were then assessed using the Stanford–Binet Intelligence Test. Only 91 of the 154 students who were nominated obtained an IQ score of 136 or higher. This cut-point was used because it yielded the top 1% of the population. Based on this finding, the authors proposed that teacher nominations were neither efficacious nor efficient. However, when Gagné (1994) reana-lyzed the same data, he found that with regard to student iden-tification, “teachers do not come out worse than most other sources of information” (p. 126), including mental ability tests, school grades, and achievement test scores. Gagné argued that Pegnato and Birch used invalid methods for evalu-ating teacher-rating instruments. He explained that an identifi-cation procedure’s efficacy and efficiency are not independent of each other and are therefore not appropriate for compari-sons of different measures. Effectiveness, or the percentage of students nominated, is actually negatively correlated with effi-ciency, or the percentage of students later identified as gifted. Instead, Gagné used a 2 × 2 correlation between the predictor (nomination) and the criterion of interest (IQ score) to make his determination that teacher nominations had phi coefficient of .29, comparable with the other measures used by Pegnato and Birch in their study. Gagné also noted that using the top 1% of a full-scale intelligence test as the criteria for “gifted” was unrealistic and would omit many high-ability students.
The call for teachers to be included in the identification process (Gagné, 1994; High & Udall, 1983; Hunsaker, Finley, & Frank, 1997) has led to the creation of a variety of teacher-rating forms and behavior checklists. The majority of these instruments can be grouped into two classes. The first group involves instruments that have been subjected to little or no empirical research and were developed using little or inadequate statistical techniques. Examples of such instru-ments include the Kingore Observation Inventory (KOI; Kingore, 2001), the Traits, Attributes, and Behaviors Scale (TABS; Frasier & Passow, 1994; Frasier et al., 1995), and the Kranz Talent Identification Instrument (KTII; Kranz, 1981). A search of the ERIC and PsychInfo databases revealed no empirical studies supporting any of these three instruments. Although these scales may be able to help identify students and to make instructional decisions, they have not been sub-jected to the types of rigorous evaluation necessary to yield valid data for diverse populations.
A second group of teacher-as-rater instruments is more promising. Instruments, such as the Gifted Rating Scales (GRS; Pfeiffer & Jarosewich, 2003) were developed using rigorous statistical techniques. Similarly, the Scales for Rating the Behavioral Characteristics of Superior Students (SRBCSS; Renzulli et al., 2002), the Gifted Evaluation Scales, Second Edition (GES-2; McCarney & Anderson, 1989) and the Gifted and Talented Evaluation Scales (GATES; Gilliam,
at PURDUE UNIV LIBRARY TSS on April 15, 2011gcq.sagepub.comDownloaded from
Peters and Gentry 301
Carpenter, & Christensen, 1996) offer psychometric devel-opment information in their respective test manuals and/or have been used in empirical research. However, several prob-lems exist. Some of the instrument developers in this group used exploratory factor analysis (EFA) or principal compo-nents analysis (PCA) without following up these procedures with a more rigorous confirmatory factor analysis (CFA). There exists a large body of research literature on the prob-lems associated with PCA or with attempting to create an instrument using only exploratory methods (e.g., Thompson, 2004; Widaman, 1993). In addition, some of the instruments have relatively dated or nonrepresentative standardization samples. In what appears to be the most rigorously developed instrument in the class of teacher nomination scales, the GRS (Pfeiffer & Jarosewich, 2003) has not been subjected to measurement invariance testing, making its validity for use with underrepresented groups unclear.
Progress toward quality teacher-rating scales has been made. However, at this point, none of the available instruments described above provide all the information recommended in the Joint Committee on Testing Practices’ (2005) Code of Fair Testing Practices in Education, which suggests authors,
obtain and provide evidence on the performance of test takers of diverse subgroups, making sufficient efforts to obtain sample sizes that are adequate for subgroup anal-yses. Evaluate the evidence to ensure that differences in performance are related to skills being assessed. (p. 4)
Interestingly, this is similar to the call made by Callahan (2007) regarding the need for research into the validity of assessment tools used for gifted and talented identification. Specifically, she noted the need for the separate evaluation of race, ethnicity, and income factors when examining outcomes. Although this information may exist for these teacher-rating forms, it was not presented in the respective test manuals or scholarly articles. The Code was designed to guide the development of instruments and to ensure that results from their development are readily available to consumers. Thus, researchers developing teacher-rating instruments or scales should closely adhere to these guidelines.
Measurement InvarianceIt is important to note that providing descriptive statistics such as mean scores and standard deviations, although important, does not fully address the above-described Code requirements. Measurement invariance examines “the extent to which items or subtests have equal meaning across groups of examinees” (French & Finch, 2006, p. 379). This issue is important in establishing that equally valid information can be gained across multiple groups. As explained by Osterlind and Everson (2009), “If the test scores or the test items create or maintain an advantage for one group over another, then the validity of their test-based inferences is threatened” (p. 7).
Traditionally, analysis of variance (ANOVA) procedures have been used to test for equivalences of mean scores among dif-ferent groups (Thompson & Green, 2006). However, such equivalences are only one component that may vary as a function of income. Therefore, it is important to conduct more in-depth analyses concerning measurement invariance to determine if parameters such as residuals or errors vary due to group membership. In addition, Thompson and Green (2006) argued that ANOVA procedures are appropriate for emergent systems that involve no latent variables. In the case of instrument development with multiple latent factors, structural equation modeling (SEM) approaches to testing for group differences, such as multigroup confirmatory fac-tor analysis (MCFA), need to be applied.
Lohman (2006) and Lohman, Korb, and Lakin (2008) have argued that a simple comparison of mean scores is not sufficient for evaluating potential group differences. Even though to do so might show average differences among groups, these differences are not informative enough to allow for instrument evaluation and modification. Instead, more in-depth analyses, such as MCFA, are needed. MCFA allows for the analysis of equality of factor loadings, intercepts, and residuals (Brown, 2006). These analyses are important because instruments used in identification are often applied to a wide number of subgroups without consideration for possible invariance issues. With the current issue of under-representation (Wyner et al., 2009; Yoon & Gentry, 2009), this problem cannot be assumed to be due to item or test noninvariance. However, measurements of test invariance should be conducted to rule out such issues.
MCFA procedures are conceptually little more than the comparison of an individual CFA for each group, followed by chi-square tests of equivalence and evaluation of fit sta-tistics (Thompson & Green, 2006). The drawback with this procedure is the necessity of a sufficiently large sample to conduct a full CFA on each separate group. Partly for this reason, MCFA is normally used on no more than two or three groups to prevent the model from becoming too com-plicated. MCFA is often used to analyze invariance between gender or income groups (male/female; free or reduced lunch/paid lunch) because of the two-group comparison. Multiple categories can prove problematic. Common MCFA proce-dures (as explained in Brown, 2006) suggest moving through and testing increasingly restrictive models. Each model is then evaluated in the same fashion as traditional CFA meth-ods using chi-square values, chi-square difference tests, and fit indices. This process includes the following steps:
1. Test the model on each group separately2. Test equal model form3. Test equal factor loadings4. Test equal indicator intercepts5. Test equal indicator error variances6. Test equal factor variances7. Test equal latent factor means.
at PURDUE UNIV LIBRARY TSS on April 15, 2011gcq.sagepub.comDownloaded from
302 Gifted Child Quarterly 54(4)
Steps 2 through 5 evaluate measurement parameters (related to items) and Steps 6 and 7 evaluate the latent, structural parameters (related to subscales). The chi-square values and fit statistics, of Steps 3 through 7, are compared with each previous step to evaluate whether or not the increasingly restrictive constraints yield a significantly poorer fit between groups. A statistically significant increase in chi-square, decrease in comparative fit index (CFI) or Tucker–Lewis index (TLI), or increase in standardized root mean squared residual (SRMR) or root mean square error of approximation (RMSEA) is used to indicate the presence of noninvariance for the parameters under investigation (Brown, 2006). However, it is important to note that the presence of noninvariance does not automatically mean that item should be removed because some could more easily be revised and that differential functioning due to group membership is a complex issue that should not be solved by simply removing every problematic item (Osterlind & Everson, 2009).
Several authors have called for more research into teacher-rating scales to make them a more scientific component of a larger identification system (Gagné, 1994; Hodge & Cudmore, 1986; Jarosewich, Pfeiffer, & Morris, 2002; McBee, 2006). VanTassel-Baska (2008) argued that teacher-rating scales should be considered in the initial screening process to help locate all potential students for further evaluation. With regard to minority students, Plata and Masten (1998) empha-sized that teachers need to possess an understanding of their students’ cultural backgrounds if nominations of these stu-dents are to be successful. In addition, to ensure successful nominations, several authors have emphasized the importance of teacher training (e.g., Siegle & Powell, 2004) and includ-ing clearly defined behaviors and characteristics on teacher-rating scales (e.g., Hodge & Cudmore, 1986; Jarosewich et al., 2002).
Method and Data AnalysesParticipants
A total of 349 teachers from five school districts (three rural, two metropolitan) in one Midwestern state completed the
HOPE Scale on students in their classrooms. These class-room teachers had a range of possible experiences and no specific training on rating students because in practice, teachers are routinely asked to nominate or rate students without specific training. The State of the States Report indi-cated that teacher nominations are often used as the initial catalyst in an identification process (NAGC, 2007). Because general education teachers are unlikely to have special train-ing when asked to nominate a student for a gifted and talented program, and because we believed that schools will be unlikely to implement such specialized training, we did not provide any overt guidance to the teachers in this sample. Teachers were provided with a classroom set of HOPE Scales and a cover letter thanking them for their participation and also indicating what to do when they were finished. The only other specific directions were included on the HOPE Scale itself and asked that raters evaluate each student as compared with other similar students (see the appendix).
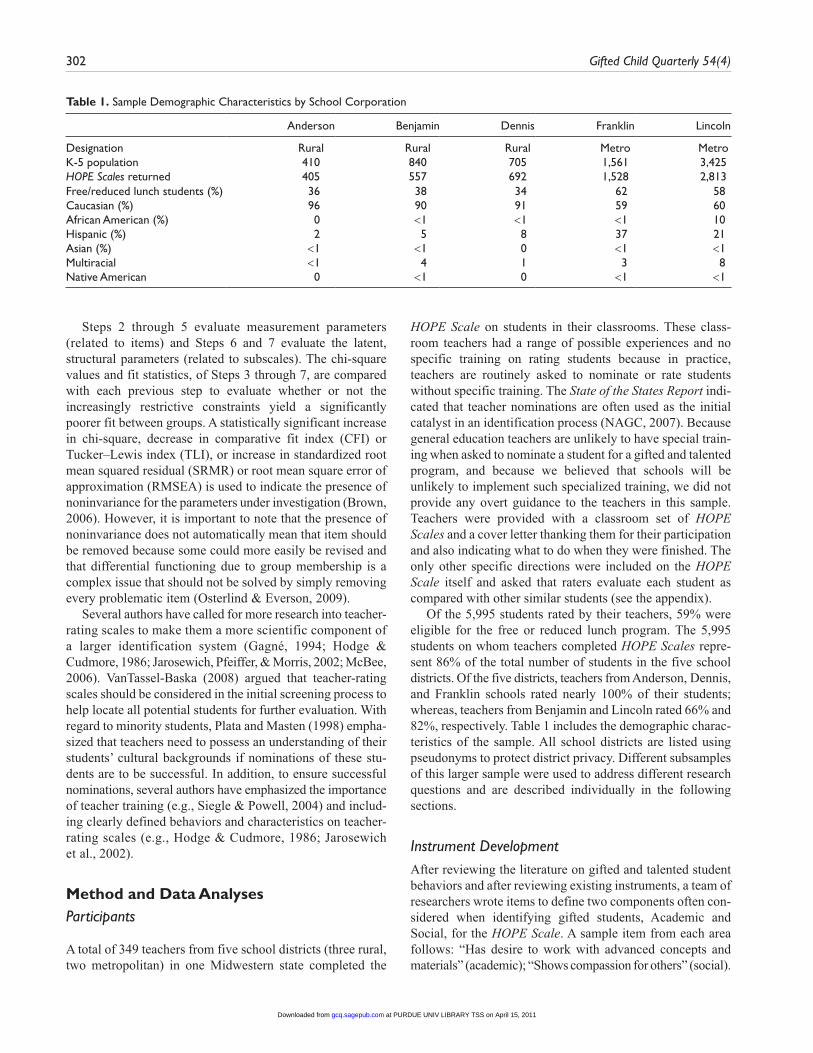
Of the 5,995 students rated by their teachers, 59% were eligible for the free or reduced lunch program. The 5,995 students on whom teachers completed HOPE Scales repre-sent 86% of the total number of students in the five school districts. Of the five districts, teachers from Anderson, Dennis, and Franklin schools rated nearly 100% of their students; whereas, teachers from Benjamin and Lincoln rated 66% and 82%, respectively. Table 1 includes the demographic charac-teristics of the sample. All school districts are listed using pseudonyms to protect district privacy. Different subsamples of this larger sample were used to address different research questions and are described individually in the following sections.
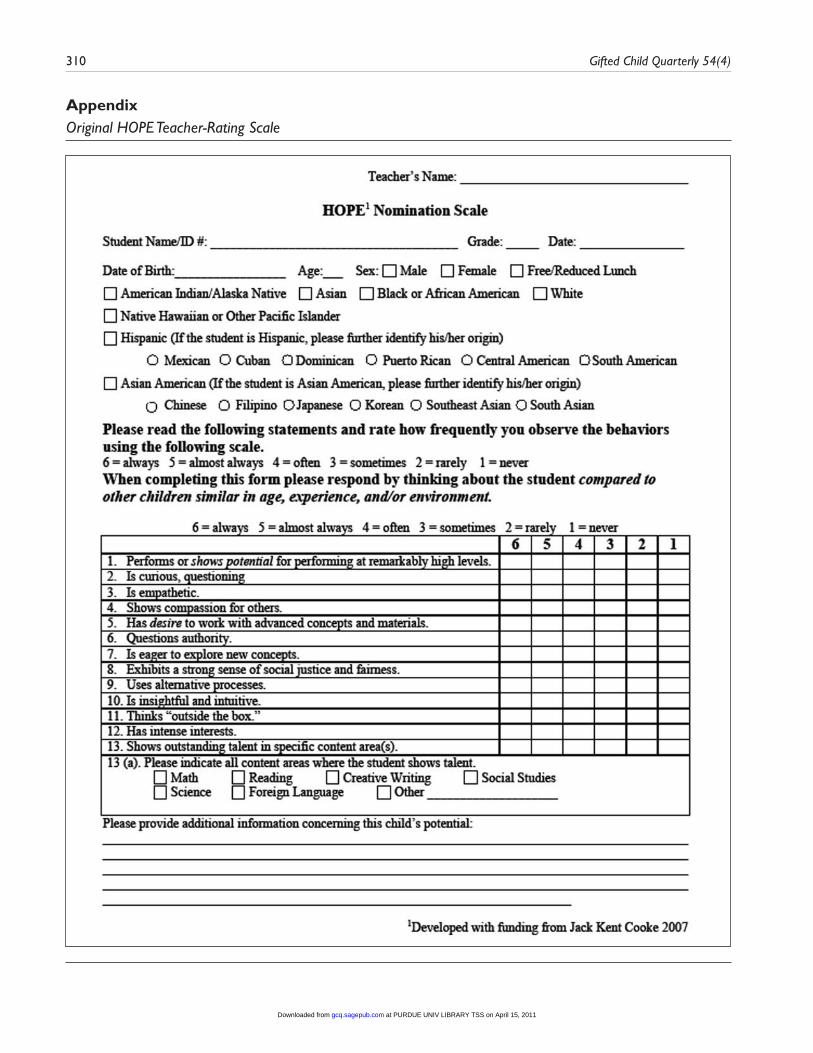
Instrument DevelopmentAfter reviewing the literature on gifted and talented student behaviors and after reviewing existing instruments, a team of researchers wrote items to define two components often con-sidered when identifying gifted students, Academic and Social, for the HOPE Scale. A sample item from each area follows: “Has desire to work with advanced concepts and materials” (academic); “Shows compassion for others” (social).
Table 1. Sample Demographic Characteristics by School Corporation
Anderson Benjamin Dennis Franklin Lincoln
Designation Rural Rural Rural Metro MetroK-5 population 410 840 705 1,561 3,425HOPE Scales returned 405 557 692 1,528 2,813Free/reduced lunch students (%) 36 38 34 62 58Caucasian (%) 96 90 91 59 60African American (%) 0 <1 <1 <1 10Hispanic (%) 2 5 8 37 21Asian (%) <1 <1 0 <1 <1Multiracial <1 4 1 3 8Native American 0 <1 0 <1 <1
at PURDUE UNIV LIBRARY TSS on April 15, 2011gcq.sagepub.comDownloaded from
Peters and Gentry 303
These two scales were chosen because the researchers believed that teachers would have firsthand knowledge of their students’ academic and social behaviors and therefore, would likely be able to provide accurate ratings based on their observations and experiences with their students. Fur-thermore, gifted programs are frequently focused on aca-demics and teachers have knowledge of how their students perform academically (NAGC, 2007). The social scale addresses behaviors that may function independently of aca-demics and that might allow teachers to provide a different perspective of potential talent (Peterson, 1999). In creating these items, the team members took care to write items that would not be biased against children from low-income homes (Joint Committee on Testing Practices, 2005; Popham, 2001). In contrast, several of the existing instruments referenced above include five (GATES) to as many as 14 (SRBCSS) separate subscales. However, many of these instruments are plagued by high correlations among these subscales. For example, the GATES (Gilliam et al., 1996) includes five separate subscales that are correlated between .68 and .94. These high correlations call into question whether raters can actually distinguish between such detailed subscales or whether they even exist as measurable factors. For this rea-son, the HOPE Scale was designed with two general sub-scales. After multiple revisions for wording, clarity, and content, based on judgment by content experts, 13 items were retained for data collection from the above-described sample. A 6-point rating scale was used based on Comrey’s (1988) recommendation that scales have at least four points and on recommendations made by Brown (2006) that scales with more rating points more closely approximate normally distributed data that are necessary for certain statistical tech-niques. This initial 13-item version of the HOPE Scale is included in the appendix.
Data Collection and AnalysisData were collected in the fall of 2007 during a 6-week time period using a one-time administration of the HOPE Scale in each corporation.
Exploratory factor analysis. From the sample of 5,995 stu-dents, 500 were randomly selected for EFA. Although sample size recommendations for EFA procedures vary, conservative recommendations place ideal sample sizes at between 400 (Comrey, 1988) and as many as 800 (Fabrigar, Wegener, MacCallum, & Strahan, 1999) when dealing with extremely poor communality estimates and underdefined factors. Because additional cross-validation studies involving CFA were planned at this point in the study, a random sample of 500 students was taken to preserve data for follow-up research to confirm any potential findings. Because of the correlation among items on the HOPE Scale, a promax oblique rotation was used. Individual items were retained only if they loaded on a single factor at .4 or greater. Scree plots were used as was a parallel analysis (Montanelli & Humphreys, 1976; Thompson,
2004) to determine the number of factors to retain. Parallel analysis is the most accurate method of determining the number of factors when the sample size is between 500 and 1,000 (Zwick & Velicer, 1986).
Confirmatory factor analysis. CFAs followed the EFA, thus continuing the investigation of the construct validity of the HOPE Scale. Because having an adequately sized sample was not an issue with the current study and based on the EFA results, 1,500 additional students were randomly selected from the remaining students not used in the EFA sample. As with EFA, in CFA there is no fixed formula for the sample size requirements. However, Muthén and Muthén (2002) argued that even for nonnormal data in which some missing responses exist, 315 is a sufficient sample size to detect factor correlation. Additionally, Kief-fer (1999) proposed 500 to 1,000 participants as an ideal number to achieve stability. In addition, a sample size of at least 1,000 was desired as this size was found to be most successful regarding the use of traditional chi-square val-ues and fit statistics (Hu & Bentler, 1999). Because addi-tional analyses may have been needed, this subsample was used to preserve data for any follow-up analyses. The CFA model was specified using the model extracted from the EFA. Once the model was fit, three different types of indi-cators were used for evaluation: chi-square indicators, fit statistics, and standardized residuals (Crowley & Fan, 1997). Because a large sample size almost always guaran-tees a significant chi-square result (Kline, 2005), several alternative fit indices were also considered. Modification indices were considered if they aligned with gifted educa-tion and intelligence theory with respect to the latent fac-tors. Postmodification models were compared with the initial model based on the three above-described criteria.
Once the final model was established from the general CFA, measurement invariance testing was conducted to eval-uate the equivalence of different parameters for students from low-income families and those who were not from low-income families. Because the HOPE Scale was originally designed to better identify students from low-income fami-lies for gifted and talented programs, an MCFA was con-ducted to evaluate model invariance or bias (for or against) when used with students from low-income families. Based on this process, an MCFA comparing students who qualify for the free and reduced lunch program with those students who do not would include the following tests: general model for paid students, general model for free or reduced lunch students, equal form, equal factor loadings, equal indicator intercepts, equal error variances, equal factor variances, and equal latent means.
ResultsExploratory Factor AnalysisThe scree plot from the EFA indicated a strong elbow after two factors (see Table 2 for eigenvalues). Although the Kaiser
at PURDUE UNIV LIBRARY TSS on April 15, 2011gcq.sagepub.comDownloaded from
304 Gifted Child Quarterly 54(4)
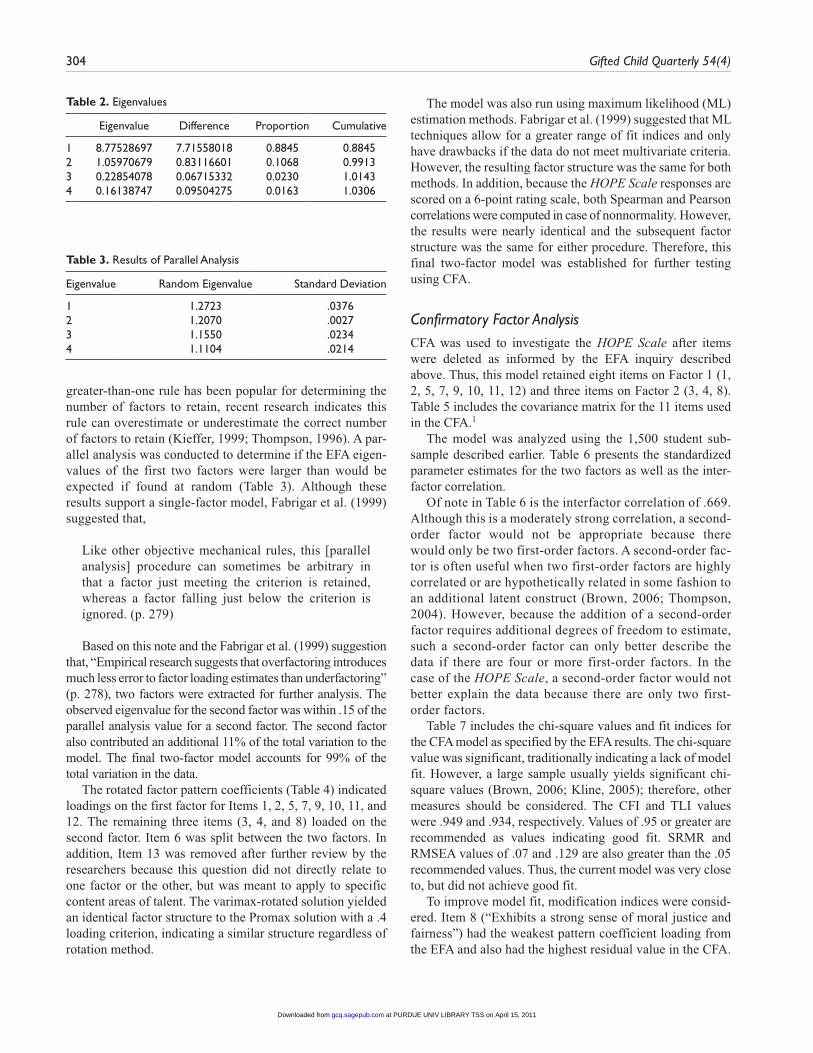
greater-than-one rule has been popular for determining the number of factors to retain, recent research indicates this rule can overestimate or underestimate the correct number of factors to retain (Kieffer, 1999; Thompson, 1996). A par-allel analysis was conducted to determine if the EFA eigen-values of the first two factors were larger than would be expected if found at random (Table 3). Although these results support a single-factor model, Fabrigar et al. (1999) suggested that,
Like other objective mechanical rules, this [parallel analysis] procedure can sometimes be arbitrary in that a factor just meeting the criterion is retained, whereas a factor falling just below the criterion is ignored. (p. 279)
Based on this note and the Fabrigar et al. (1999) sugges tion that, “Empirical research suggests that overfactoring introduces much less error to factor loading estimates than under factoring” (p. 278), two factors were extracted for further analysis. The observed eigenvalue for the second factor was within .15 of the parallel analysis value for a second factor. The second factor also contributed an addi tional 11% of the total variation to the model. The final two-factor model accounts for 99% of the total variation in the data.
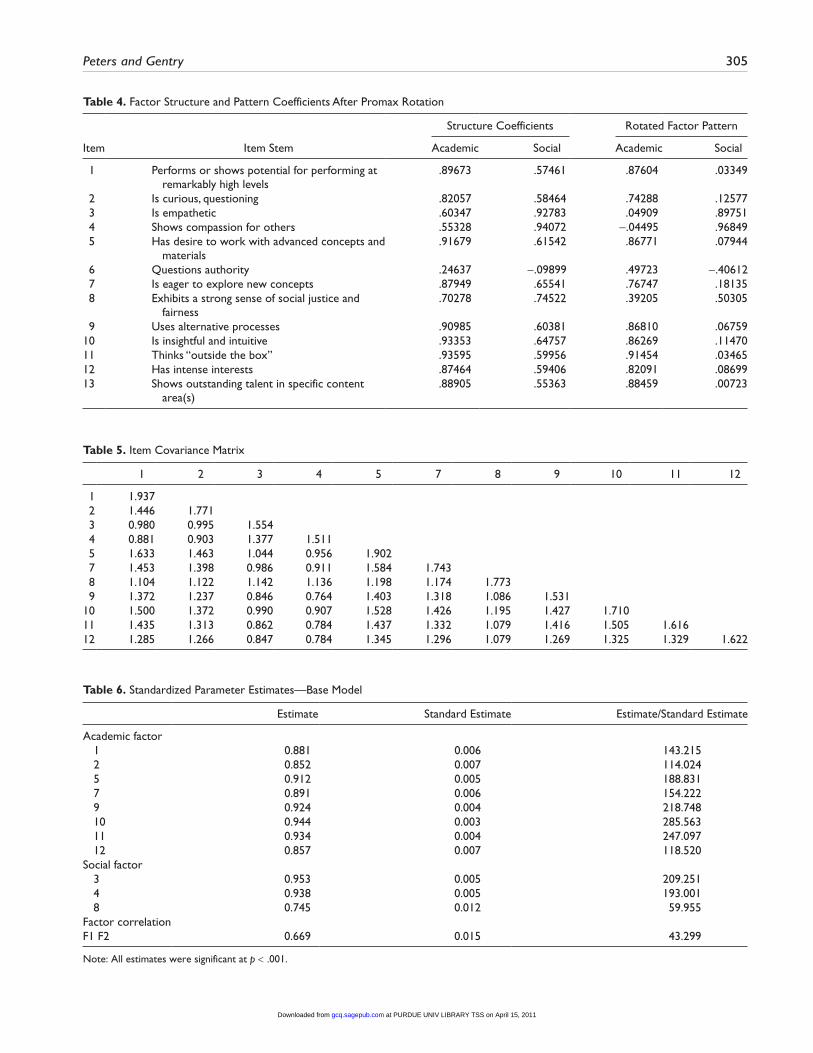
The rotated factor pattern coefficients (Table 4) indicated loadings on the first factor for Items 1, 2, 5, 7, 9, 10, 11, and 12. The remaining three items (3, 4, and 8) loaded on the second factor. Item 6 was split between the two factors. In addition, Item 13 was removed after further review by the researchers because this question did not directly relate to one factor or the other, but was meant to apply to specific content areas of talent. The varimax-rotated solution yielded an identical factor structure to the Promax solution with a .4 loading criterion, indicating a similar structure regardless of rotation method.
The model was also run using maximum likelihood (ML) estimation methods. Fabrigar et al. (1999) suggested that ML techniques allow for a greater range of fit indices and only have drawbacks if the data do not meet multivariate criteria. However, the resulting factor structure was the same for both methods. In addition, because the HOPE Scale responses are scored on a 6-point rating scale, both Spearman and Pearson correlations were computed in case of nonnormality. However, the results were nearly identical and the subsequent factor structure was the same for either procedure. Therefore, this final two-factor model was established for further testing using CFA.
Confirmatory Factor AnalysisCFA was used to investigate the HOPE Scale after items were deleted as informed by the EFA inquiry described above. Thus, this model retained eight items on Factor 1 (1, 2, 5, 7, 9, 10, 11, 12) and three items on Factor 2 (3, 4, 8). Table 5 includes the covariance matrix for the 11 items used in the CFA.1
The model was analyzed using the 1,500 student sub-sample described earlier. Table 6 presents the standardized parameter estimates for the two factors as well as the inter-factor correlation.
Of note in Table 6 is the interfactor correlation of .669. Although this is a moderately strong correlation, a second-order factor would not be appropriate because there would only be two first-order factors. A second-order fac-tor is often useful when two first-order factors are highly correlated or are hypothetically related in some fashion to an additional latent construct (Brown, 2006; Thompson, 2004). However, because the addition of a second-order factor requires additional degrees of freedom to estimate, such a second-order factor can only better describe the data if there are four or more first-order factors. In the case of the HOPE Scale, a second-order factor would not better explain the data because there are only two first-order factors.
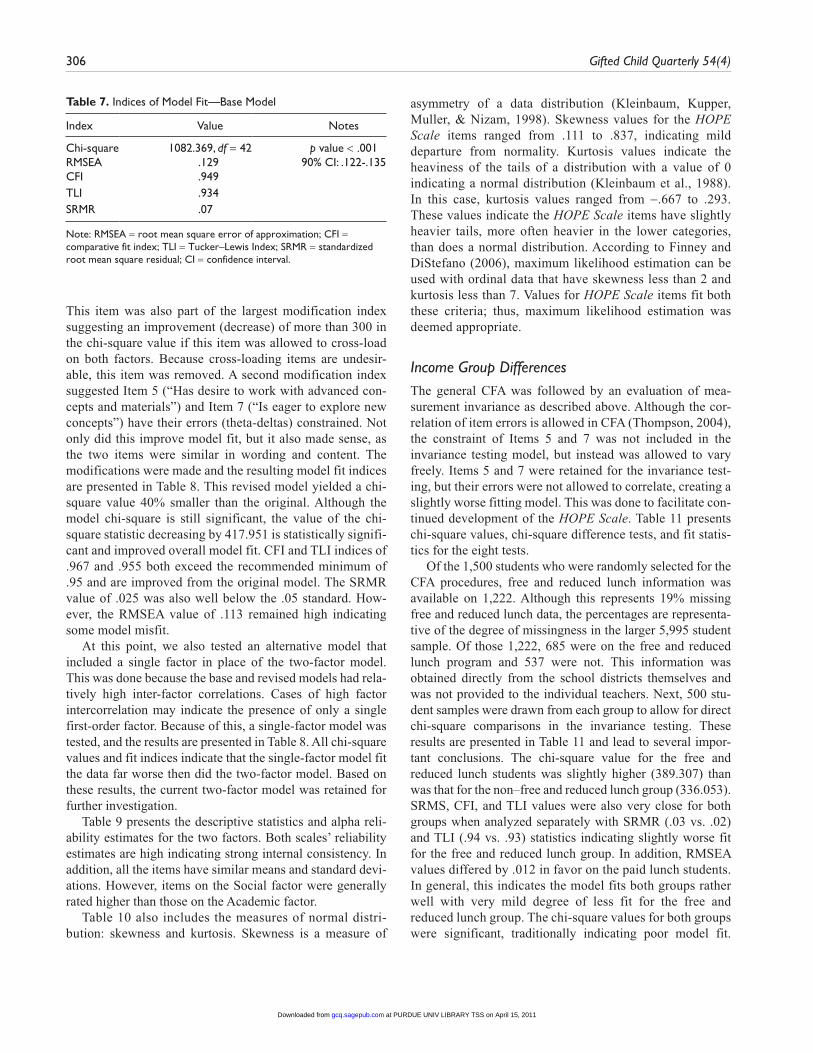
Table 7 includes the chi-square values and fit indices for the CFA model as specified by the EFA results. The chi-square value was significant, traditionally indicating a lack of model fit. However, a large sample usually yields significant chi-square values (Brown, 2006; Kline, 2005); therefore, other measures should be considered. The CFI and TLI values were .949 and .934, respectively. Values of .95 or greater are recommended as values indicating good fit. SRMR and RMSEA values of .07 and .129 are also greater than the .05 recommended values. Thus, the current model was very close to, but did not achieve good fit.
To improve model fit, modification indices were consid-ered. Item 8 (“Exhibits a strong sense of moral justice and fairness”) had the weakest pattern coefficient loading from the EFA and also had the highest residual value in the CFA.
Table 2. Eigenvalues
Eigenvalue Difference Proportion Cumulative
1 8.77528697 7.71558018 0.8845 0.88452 1.05970679 0.83116601 0.1068 0.99133 0.22854078 0.06715332 0.0230 1.01434 0.16138747 0.09504275 0.0163 1.0306
Table 3. Results of Parallel Analysis
Eigenvalue Random Eigenvalue Standard Deviation
1 1.2723 .03762 1.2070 .00273 1.1550 .02344 1.1104 .0214
at PURDUE UNIV LIBRARY TSS on April 15, 2011gcq.sagepub.comDownloaded from
Peters and Gentry 305
Table 4. Factor Structure and Pattern Coefficients After Promax Rotation
Item Item Stem
Structure Coefficients Rotated Factor Pattern
Academic Social Academic Social
1 Performs or shows potential for performing at remarkably high levels
.89673 .57461 .87604 .03349
2 Is curious, questioning .82057 .58464 .74288 .12577 3 Is empathetic .60347 .92783 .04909 .89751 4 Shows compassion for others .55328 .94072 -.04495 .96849 5 Has desire to work with advanced concepts and
materials.91679 .61542 .86771 .07944
6 Questions authority .24637 -.09899 .49723 -.40612 7 Is eager to explore new concepts .87949 .65541 .76747 .18135 8 Exhibits a strong sense of social justice and
fairness.70278 .74522 .39205 .50305
9 Uses alternative processes .90985 .60381 .86810 .0675910 Is insightful and intuitive .93353 .64757 .86269 .1147011 Thinks “outside the box” .93595 .59956 .91454 .0346512 Has intense interests .87464 .59406 .82091 .0869913 Shows outstanding talent in specific content
area(s).88905 .55363 .88459 .00723
Table 5. Item Covariance Matrix
1 2 3 4 5 7 8 9 10 11 12
1 1.937 2 1.446 1.771 3 0.980 0.995 1.554 4 0.881 0.903 1.377 1.511 5 1.633 1.463 1.044 0.956 1.902 7 1.453 1.398 0.986 0.911 1.584 1.743 8 1.104 1.122 1.142 1.136 1.198 1.174 1.773 9 1.372 1.237 0.846 0.764 1.403 1.318 1.086 1.53110 1.500 1.372 0.990 0.907 1.528 1.426 1.195 1.427 1.71011 1.435 1.313 0.862 0.784 1.437 1.332 1.079 1.416 1.505 1.61612 1.285 1.266 0.847 0.784 1.345 1.296 1.079 1.269 1.325 1.329 1.622
Table 6. Standardized Parameter Estimates—Base Model
Estimate Standard Estimate Estimate/Standard Estimate
Academic factor 1 0.881 0.006 143.215 2 0.852 0.007 114.024 5 0.912 0.005 188.831 7 0.891 0.006 154.222 9 0.924 0.004 218.748 10 0.944 0.003 285.563 11 0.934 0.004 247.097 12 0.857 0.007 118.520Social factor 3 0.953 0.005 209.251 4 0.938 0.005 193.001 8 0.745 0.012 59.955Factor correlationF1 F2 0.669 0.015 43.299
Note: All estimates were significant at p < .001.
at PURDUE UNIV LIBRARY TSS on April 15, 2011gcq.sagepub.comDownloaded from
306 Gifted Child Quarterly 54(4)
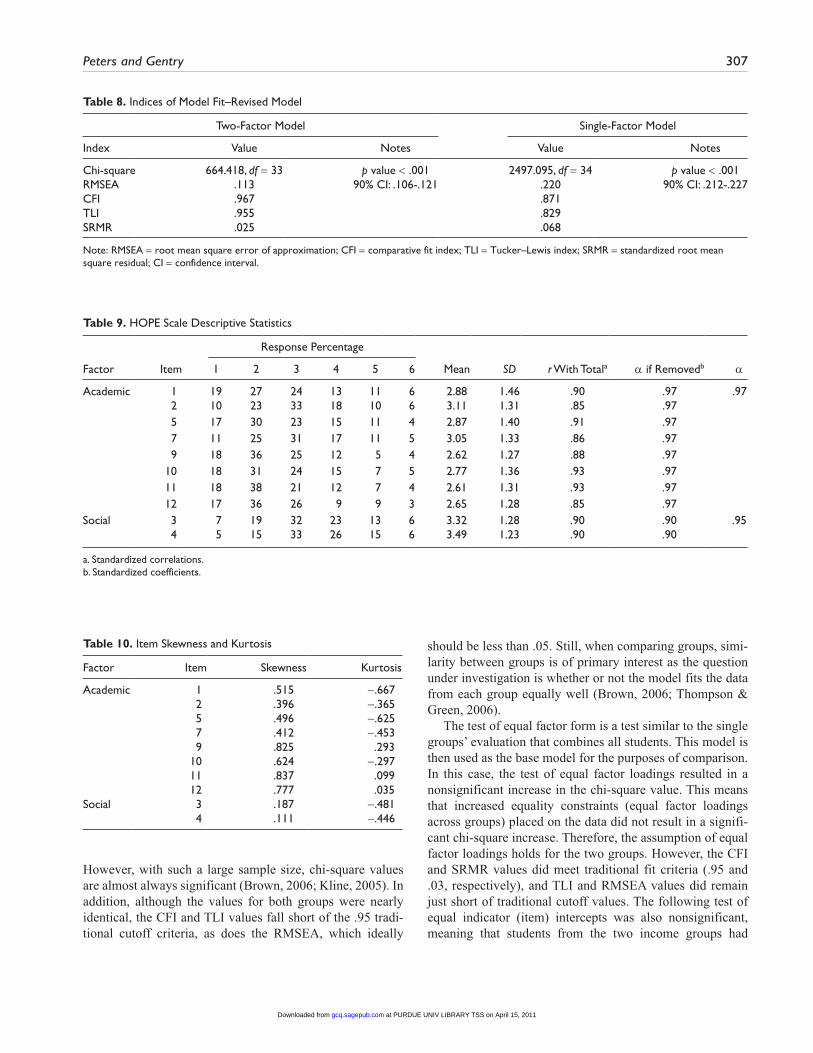
This item was also part of the largest modification index suggesting an improvement (decrease) of more than 300 in the chi-square value if this item was allowed to cross-load on both factors. Because cross-loading items are undesir-able, this item was removed. A second modification index suggested Item 5 (“Has desire to work with advanced con-cepts and materials”) and Item 7 (“Is eager to explore new concepts”) have their errors (theta-deltas) constrained. Not only did this improve model fit, but it also made sense, as the two items were similar in wording and content. The modifications were made and the resulting model fit indices are presented in Table 8. This revised model yielded a chi-square value 40% smaller than the original. Although the model chi-square is still significant, the value of the chi-square statistic decreasing by 417.951 is statistically signifi-cant and improved overall model fit. CFI and TLI indices of .967 and .955 both exceed the recommended minimum of .95 and are improved from the original model. The SRMR value of .025 was also well below the .05 standard. How-ever, the RMSEA value of .113 remained high indicating some model misfit.
At this point, we also tested an alternative model that included a single factor in place of the two-factor model. This was done because the base and revised models had rela-tively high inter-factor correlations. Cases of high factor intercorrelation may indicate the presence of only a single first-order factor. Because of this, a single-factor model was tested, and the results are presented in Table 8. All chi-square values and fit indices indicate that the single-factor model fit the data far worse then did the two-factor model. Based on these results, the current two-factor model was retained for further investigation.
Table 9 presents the descriptive statistics and alpha reli-ability estimates for the two factors. Both scales’ reliability estimates are high indicating strong internal consistency. In addition, all the items have similar means and standard devi-ations. However, items on the Social factor were generally rated higher than those on the Academic factor.
Table 10 also includes the measures of normal distri-bution: skewness and kurtosis. Skewness is a measure of
asymmetry of a data distribution (Kleinbaum, Kupper, Muller, & Nizam, 1998). Skewness values for the HOPE Scale items ranged from .111 to .837, indicating mild departure from normality. Kurtosis values indicate the heaviness of the tails of a distribution with a value of 0 indicating a normal distribution (Kleinbaum et al., 1988). In this case, kurtosis values ranged from -.667 to .293. These values indicate the HOPE Scale items have slightly heavier tails, more often heavier in the lower categories, than does a normal distribution. According to Finney and DiStefano (2006), maximum likelihood estimation can be used with ordinal data that have skewness less than 2 and kurtosis less than 7. Values for HOPE Scale items fit both these criteria; thus, maximum likelihood estimation was deemed appropriate.
Income Group DifferencesThe general CFA was followed by an evaluation of mea-surement invariance as described above. Although the cor-relation of item errors is allowed in CFA (Thompson, 2004), the constraint of Items 5 and 7 was not included in the invariance testing model, but instead was allowed to vary freely. Items 5 and 7 were retained for the invariance test-ing, but their errors were not allowed to correlate, creating a slightly worse fitting model. This was done to facilitate con-tinued development of the HOPE Scale. Table 11 presents chi-square values, chi-square difference tests, and fit statis-tics for the eight tests.
Of the 1,500 students who were randomly selected for the CFA procedures, free and reduced lunch information was available on 1,222. Although this represents 19% missing free and reduced lunch data, the percentages are representa-tive of the degree of missingness in the larger 5,995 student sample. Of those 1,222, 685 were on the free and reduced lunch program and 537 were not. This information was obtained directly from the school districts themselves and was not provided to the individual teachers. Next, 500 stu-dent samples were drawn from each group to allow for direct chi-square comparisons in the invariance testing. These results are presented in Table 11 and lead to several impor-tant conclusions. The chi-square value for the free and reduced lunch students was slightly higher (389.307) than was that for the non–free and reduced lunch group (336.053). SRMS, CFI, and TLI values were also very close for both groups when analyzed separately with SRMR (.03 vs. .02) and TLI (.94 vs. .93) statistics indicating slightly worse fit for the free and reduced lunch group. In addition, RMSEA values differed by .012 in favor on the paid lunch students. In general, this indicates the model fits both groups rather well with very mild degree of less fit for the free and reduced lunch group. The chi-square values for both groups were significant, traditionally indicating poor model fit.
Table 7. Indices of Model Fit—Base Model
Index Value Notes
Chi-square 1082.369, df = 42 p value < .001RMSEA .129 90% CI: .122-.135CFI .949TLI .934SRMR .07
Note: RMSEA = root mean square error of approximation; CFI = comparative fit index; TLI = Tucker–Lewis Index; SRMR = standardized root mean square residual; CI = confidence interval.
at PURDUE UNIV LIBRARY TSS on April 15, 2011gcq.sagepub.comDownloaded from
Peters and Gentry 307
Table 8. Indices of Model Fit–Revised Model
Two-Factor Model Single-Factor Model
Index Value Notes Value Notes
Chi-square 664.418, df = 33 p value < .001 2497.095, df = 34 p value < .001RMSEA .113 90% CI: .106-.121 .220 90% CI: .212-.227CFI .967 .871TLI .955 .829SRMR .025 .068
Note: RMSEA = root mean square error of approximation; CFI = comparative fit index; TLI = Tucker–Lewis index; SRMR = standardized root mean square residual; CI = confidence interval.
Table 9. HOPE Scale Descriptive Statistics
Factor Item
Response Percentage
Mean SD r With Totala a if Removedb a1 2 3 4 5 6
Academic 1 19 27 24 13 11 6 2.88 1.46 .90 .97 .97 2 10 23 33 18 10 6 3.11 1.31 .85 .97 5 17 30 23 15 11 4 2.87 1.40 .91 .97 7 11 25 31 17 11 5 3.05 1.33 .86 .97 9 18 36 25 12 5 4 2.62 1.27 .88 .9710 18 31 24 15 7 5 2.77 1.36 .93 .9711 18 38 21 12 7 4 2.61 1.31 .93 .9712 17 36 26 9 9 3 2.65 1.28 .85 .97
Social 3 7 19 32 23 13 6 3.32 1.28 .90 .90 .95 4 5 15 33 26 15 6 3.49 1.23 .90 .90
a. Standardized correlations.b. Standardized coefficients.
Table 10. Item Skewness and Kurtosis
Factor Item Skewness Kurtosis
Academic 1 .515 -.667 2 .396 -.365 5 .496 -.625 7 .412 -.453 9 .825 .29310 .624 -.29711 .837 .09912 .777 .035
Social 3 .187 -.481 4 .111 -.446
However, with such a large sample size, chi-square values are almost always significant (Brown, 2006; Kline, 2005). In addition, although the values for both groups were nearly identical, the CFI and TLI values fall short of the .95 tradi-tional cutoff criteria, as does the RMSEA, which ideally
should be less than .05. Still, when comparing groups, simi-larity between groups is of primary interest as the question under investigation is whether or not the model fits the data from each group equally well (Brown, 2006; Thompson & Green, 2006).
The test of equal factor form is a test similar to the single groups’ evaluation that combines all students. This model is then used as the base model for the purposes of comparison. In this case, the test of equal factor loadings resulted in a nonsignificant increase in the chi-square value. This means that increased equality constraints (equal factor loadings across groups) placed on the data did not result in a signifi-cant chi-square increase. Therefore, the assumption of equal factor loadings holds for the two groups. However, the CFI and SRMR values did meet traditional fit criteria (.95 and .03, respectively), and TLI and RMSEA values did remain just short of traditional cutoff values. The following test of equal indicator (item) intercepts was also nonsignificant, meaning that students from the two income groups had
at PURDUE UNIV LIBRARY TSS on April 15, 2011gcq.sagepub.comDownloaded from

308 Gifted Child Quarterly 54(4)
similar item intercepts. Both these tests provided evidence that the HOPE Scale yielded equally valid scores for both groups of students in assessing Academic and Social compo-nents of giftedness. The test of equal indicator error vari-ances is often not done because of its especially stringent nature (Brown, 2006). Assuming that the errors related to item scores are equal between two groups is unlikely to hold true. However, the test was conducted because Brown (2006) recommended it as a necessary step before evaluation of struc-tural parameters of equal factor variances and means. The test of equal indicator error variances resulted in a signifi-cant chi-square increase indicating nonequivalence of indi-cator error variance across the two groups. However, no two groups are likely to have perfectly equal error variances (Brown, 2006; Byrne, 1998).
The final two invariance tests related to population structural parameters. The first step of equal factor variance determines if the amount of within-group variability on the specific construct differs significantly across the two groups. In this case, the test found that the variation between the two groups does not differ significantly. This means that the ranges of scores within both groups were similar, and that teachers used the same range of scores when rating students from either income group. The final test of equal latent means determines if the groups differ significantly on the underlying constructs (factors). The significant chi-square increase indicates that they do differ. However, because the measurement parameters of factor loadings and indicator intercepts were found to be invariant, these results can be directly attributed to actual differences in the under-lying constructs. Put simply, this significant difference is not due to differential item bias, but instead is due to stu-dents from low-income families receiving statistically lower average scores than those students not from low-income families.
Discussion
The results from this study suggest that a two-factor model best describes the HOPE Scale data. This finding was further supported by a CFA conducted on an additional sample and allowed for refinement of the model. The revised CFA model demonstrated strong fit through TLI, CFI, and SRMR fir statistics of .96, .97, and .03, respectively. Although these results are encouraging, there remains room for improvement with regard to overall model fit statistics and especially RMSEA values, which currently indicate lack of good model fit (.113 in the revised CFA model). However, part of this large RMSEA value may be because of the relatively small size of the model being evaluated. Fan and Silvo (2007) and Kenny and McCoach (2003) all found that RMSEA values were likely to be smaller, regardless of model misspecification, in models evaluating a larger num-ber of observed variables. Conversely, they found that mod-els with small numbers of observed variables were likely to exhibit overly large RMSEA values regardless of model misfit. Therefore, it is possible that the present model of the HOPE Scale fits the data relatively well (as indicated by CFI, TLI, and SRMR values) and still resulted in a large RMSEA value.
With regard to the invariance tests, the results suggest that teachers rated students from low-income families dif-ferently than they rated students not from low-income fami-lies. Although a difference existed in overall latent mean scores, the HOPE Scale did not demonstrate significant dif-ferences on tests of equal factor loadings, equal indicator intercepts, or equal factor variances. Overall, the invariance test results were positive in that no differential item func-tioning was found suggesting the HOPE Scale items were not biased for or against either income group. Although mean differences were found, the data indicate these differences
Table 11. Measurement Invariance Tests for Paid Lunch Versus Free or Reduced Lunch Students
c2 df c2 Difference Ddf RMSEA (90% CI) SRMR CFI TLI
Single group solutions Paid (n = 500) 336.053* 34 — — .133 (.121-.146) .03 .95 .94 Free/Reduced (n = 500) 389.307* 34 — — .145 (.132-.158) .02 .95 .93Measurement invariance Equal form 725.360* 68 — — .139 (.130-.148) .03 .95 .93 Equal factor loading 732.382* 76 7.022 8 .131 (.123-.140) .03 .95 .94 Equal indicator intercepts 734.375* 84 21.993 8 .124 (.116-.133) .03 .95 .95 Equal indicator error variances 786.528* 94 52.153* 10 .121 (.114-.129) .03 .95 .95Population heterogeneity Equal factor variance 797.298* 96 10.77 2 .121 (.113-.129) .10 .95 .95 Equal latent mean 851.471* 98 54.173* 2 .124 (.116-.132) .14 .94 .95
Note: RMSEA = root mean square error of approximation; CFI = comparative fit index; TLI = Tucker–Lewis index; SRMR = standardized root mean square residual; CI = confidence interval.*p < .001.
at PURDUE UNIV LIBRARY TSS on April 15, 2011gcq.sagepub.comDownloaded from
Peters and Gentry 309
are actual differences in the underlying constructs and not because of item bias.
Despite the mixed results from the fit statistics of the revised model of the HOPE Scale, only two items loaded on the Social factor. Because Brown (2006) indicated that a latent factor with only two indicators will likely yield higher standard errors and biased parameter estimates, additional items will need to be added to the Social scale before it is used for student identification. In addition to the issues dis-cussed above regarding research conducted by Fan and Silvo (2007), it is also possible that the small number of items on the Social factor may have contributed to the high RMSEA values across the board. In addition, as this instru-ment is revised, additional evaluation of group differences (e.g., race, ethnicity, income status) will be necessary. Thus, the next step in the instrument development process involves adding items for the Social factor and readministering a Revised HOPE Scale to a new sample of students. This Revised HOPE Scale would then need to be evaluated for bias and group characteristics as a necessary step in instru-ment development.
Importance of the StudyThis study responds to past calls for instruments that are developed and normed using representative populations of low-income and diverse students (Borland, 2008; Ford, 1998; Worrell, 2007). This study also follows recommenda-tions made in the Code of Fair Testing Practices (Joint Com-mittee on Testing Practices, 2005) that all instruments are evaluated for their usefulness in yielding valid results for multiple groups of test takers. Previous teacher nomination or rating scales have not been subjected to such analyses. Ideally, these analyses will become more commonplace with regard to instruments developed and used in gifted and tal-ented education.
Worrell (2007) called for culturally sensitive identifica-tion methods and the application of invariance testing is one possible statistical step toward the establishment of such sen-sitivity. The HOPE Scale was developed using a sample of students composed of 59% who are eligible for the federal free and reduced lunch program. We intend to develop norms for this instrument and to conduct comparative analyses of the factor structure for both students who do qualify for free or reduced lunch and those who do not. In summary, this work has important implications in helping educators recog-nize potential among underserved elementary students.
Limitations
One of the primary limitations of this study involves the sample. Because the data used in this study came from a spe-cific grant project administered in a small regional area, the results cannot be assumed to be widely generalizable. In the future, a larger, more geographically diverse sample should be used for continued Scale evaluation. A second limitation deals with the method of evaluating SES. Although the guidelines for the free and reduced lunch program are very specific, there are likely students not included in this group who have similar characteristics. However, free and reduced lunch status was the only SES information available directly from the Project HOPE school corporations. In the future, collecting parent incomes would allow for more detailed analysis of SES effects on HOPE Scale scores.
An additional limitation comes from the source of the data. Because we specifically wanted to use general educa-tion teachers, we did not provide any training in gifted and talented education or identification. Although we believe a strong rationale existed for not providing teachers with training, different results may have been obtained if we had a standardized training program in which each rater participated.
Finally, as mentioned in the Results section, RMSEA values were consistently greater than recommended for gen-eral CFA testing and invariance testing. At this point, it is not clear what is causing this specific type of model misfit. However, it is clear that additional items are needed on the Social scale. Once this is done, additional research may indicate a better fitting model. However, part of the lack of fit as indicated by the high RMSEA values across the board, may have been due to the data being correlated at the teacher level. When the ICCs of the two subscales were analyzed, the Academic scale and Social scale values were .15 and .13, respectively. Although these values are less than typical for classroom-level effects for achievement tests (Muthén, 1994), they still contribute to error in the model when not taken into account. When the actual source of the variation (teacher-level effect) is not included in the model, the varia-tion is attributed to error. Because the present study did not involve hierarchical factor analysis methods, the variation measured via the multilevel model methods was attributed to error that may have contributed to high RMSEA values. Even if this was not the case, the rater effect should be included in future models and not including it in the present study is a limitation.
at PURDUE UNIV LIBRARY TSS on April 15, 2011gcq.sagepub.comDownloaded from
310 Gifted Child Quarterly 54(4)
AppendixOriginal HOPE Teacher-Rating Scale
at PURDUE UNIV LIBRARY TSS on April 15, 2011gcq.sagepub.comDownloaded from
Peters and Gentry 311
Declaration of Conflicting InterestsThe author(s) declared no conflicts of interest with respect to the authorship and/or publication of this article.
FundingThe authors gratefully acknowledge generous support from the Jack Kent Cooke Foundation, which supported this work as part of Project HOPE, a grant designed to identify and serve K-5 students in gifted education programs.
Note
1. Separate covariance matrices for the free or reduced lunch data or correlation matrices are available by contacting the first author.
References
Borland, J. H. (2008). Identification. In J. A. Plucker & C. M. Callahan (Eds.), Critical issues and practices in gifted education: What the research says (pp. 261-280). Waco, TX: Prufrock Press.
Brown, T. A. (2006). Confirmatory factor analysis for applied research. New York, NY: Guilford Press.
Byrne, B. M. (1998). Structural equation modeling with LISREL, PRELIS, and SIMPLIS: Basic concepts, applications, and pro-gramming. Mahwah, NJ: Lawrence Erlbaum.
Callahan, C. M. (2007). What can we learn from research about promising practices in developing the gifts and talents of low-income students? In. J. VanTassel-Baska & T. Stambaugh (Eds.), Overlooked gems: A national perspective on low-income prom-ising learners (pp. 53-56). Washington, DC: National Associa-tion for Gifted Children.
Comrey, A. L. (1988). Factor-analytic methods for scale develop-ment in personality and clinical psychology. Journal of Coun-seling and Clinical Psychology, 56, 754-761.
Crowley, S. L. & Fan, X. (1997). Structural equation modeling: Basic concepts and applications in personality assessment research. Journal of Personality Assessment, 68, 508-531.
Fabrigar, L. R., Wegener, D. T., MacCallum, R. C., & Strahan, E. J. (1999). Evaluating the use of exploratory factor analysis in psy-chological research. Psychological Methods, 4, 272-299.
Fan, X., & Silvo, S. A. (2007). Sensitivity of fit indices to model mis-specification and model types. Multivariate Behavioral Research, 42, 509-529.
Finney, S. J., & DiStefano, C. (2006). Non-normal and categor-ical data in structural equation modeling. In G. R. Hancock & R. O. Mueller (Eds.), Structural equation modeling: A sec-ond course (pp. 269-314). Greenwich, CT: Information Age.
Ford, D. Y. (1998). The underrepresentation of minority students in gifted education: Problems and promises in recruitment and retention. Journal of Special Education, 32, 4-14.
Frasier, M. M., Martin, D., Garcia, J., Finley, V. S., Frank, E., Krisel, S., & King, L. L. (1995). A new window for looking at gifted children (Research Monograph RM955222). Storrs: National Research Center on the Gifted and Talented, University of Connecticut.
Frasier, M. M., & Passow, A. H. (1994). Toward a new paradigm for identifying talent potential (Research Monograph RM94112). Storrs: National Research Center on the Gifted and Talented, University of Connecticut.
French, B. F., & Finch, W. H. (2006). Confirmatory factor analytic procedures for the determination of measurement invariance. Structural Equation Modeling, 13, 378-402.
Gagné, F. (1994). Are teachers really poor talent detectors? Com-ments on Pegnato and Birch’s (1959) study of the effectiveness and efficacy of various identification techniques. Gifted Child Quarterly, 38, 124-126.
Gilliam, J. E., Carpenter, B. O., & Christensen, J. R. (1996). Gifted and Talented Evaluation Scales. Waco, TX: Prufrock Press.
High, M. H., & Udall, A. J. (1983). Teacher ratings of students in relation to ethnicity of student and school ethnic balance. Jour-nal for the Education of the Gifted, 6, 154-166.
Hodge, R. D., & Cudmore, L. (1986). The use of teacher-judgment measures in the identification of gifted pupils. Teaching and Teacher Education, 2, 181-196.
Hu, L., & Bentler, P. M. (1999). Cutoff criteria for fit indices in covariance structure analysis: Conventional criteria versus new alternatives. Structural Equation Modeling, 6, 1-55.
Hunsaker, S. L., Finley, V. S., & Frank, E. L. (1997). An analysis of teacher nominations and student performance in gifted pro-grams. Gifted Child Quarterly, 41, 19-24.
Jarosewich, T., Pfeiffer, S. I., & Morris, J. (2002). Identifying gifted students using teacher rating scales: A review of exist-ing instruments. Journal of Psychoeducational Assessment, 20, 322-336.
Joint Committee on Testing Practices. (2005). Code of fair testing practices in education. Washington, DC: American Psychologi-cal Association.
Kenny, D. A., & McCoach, D. B. (2003). Effect of the number of variables on measures of fit in structural equation modeling. Structural Equation Modeling, 10, 333-351.
Kieffer, K. M. (1999). An introductory primer on the appropriate use of exploratory and confirmatory factor analysis. Research in the Schools, 6, 75-92.
Kingore, B. (2001). The Kingore Observation Inventory (2nd ed.). Austin, TX: Professional Associates.
Kleinbaum, D. G., Kupper, L. L., Muller, K. E., & Nizam, A. (1998). Applied regression analysis and other multivariate meth-ods (3rd ed.). Pacific Grove, CA: Duxbury Press.
Kline, R. B. (2005). Principles and practice of structural equation modeling (2nd ed.). New York, NY: Guilford Press.
Kranz, B. (1981). Kranz talent identification instrument. Moorhead, MN: Moorhead State College.
Lohman, D. F. (2006). Identifying academically talented minority students (Research Monograph RM05216). Storrs: National Research Center on the Gifted and Talented, University of Connecticut.
Lohman, D. F., Korb, K. A., & Lakin, J. M. (2008). Identifying academically gifted English-language learners using nonverbal
at PURDUE UNIV LIBRARY TSS on April 15, 2011gcq.sagepub.comDownloaded from
312 Gifted Child Quarterly 54(4)
tests: A comparison of the Raven, NNAT, and CogAT. Gifted Child Quarterly, 52, 275-296.
McBee, M. T. (2006). A descriptive analysis of referral sources for gifted identification screening by race and socioeconomic sta-tus. Journal of Secondary Gifted Education, 2, 103-111.
McCarney, S. B., & Anderson, P. D. (1989). Gifted Evaluation Scale, second edition, technical manual. Columbia, MO: Hawthorne Educational Services.
Montanelli, R. G., & Humphreys, L. G. (1976). Latent roots of random data correlation matrices with squared multiple correla-tions on the diagonal: A Monte Carlo study. Psychometrika, 41, 341-347.
Muthén, B. (1994, August). Latent variable modeling of longitudi-nal and multilevel modeling. Paper presented at the annual meet-ing of the American Sociological Association, Los Angeles, CA.
Muthén, L. K., & Muthén, B. O. (2002). How to use a Monte Carlo study to decide on sample size and determine power. Structural Equation Modeling, 9, 599-620.
National Association for Gifted Children. (2007). State of the states 2006-2007. Washington DC: Author.
National Center for Educational Statistics. (n.d.). Number and per-centage distribution of public elementary and secondary students, by percentage of students in school eligible for free or reduced-price lunch and locale: 2003-04. Retrieved from http://nces .ed.gov/pubs2007/ruraled/tables/table1_8.asp?referrer=report
Osterlind, S. J., & Everson, H. T. (2009). Differential item function-ing. Thousand Oaks, CA: Sage.
Pegnato, C. W., & Birch, J. W. (1959). Locating gifted children in junior high schools: Comparison of methods. Exceptional Chil-dren, 25, 300-304.
Peterson, J. S. (1999). Gifted—through whose cultural lens? An application of the Postpositivistic mode of inquire. Journal for the Education of the Gifted, 22, 354-383.
Peterson, J. S., & Margolin, L. (1997). Naming gifted children: An examination of unintended reproduction. Journal for the Educa-tion of the Gifted, 21, 82-100.
Pfeiffer, S. I., & Jarosewich, T. (2003). Gifted Rating Scales. San Antonio, TX: Psychological Corporation.
Plata, M., & Masten, W. (1998). Teacher ratings of Hispanic and Anglo students on a behavior rating scale. Roeper Review, 21, 139-144.
Popham, W. J. (2001). The truth about testing: An educator’s call to action. Alexandria, VA: Association for Supervision and Cur-riculum Development.
Renzulli, J. S., Smith, L. S., White, A. J., Callahan, C. M., Hartman, R. K., & Westberg, K. L. (2002). Scales for rating the behavioral characteristics of superior students (Rev. ed.). Mansfield Center, CT: Creative Learning Press.
Rogers, K. B. (1996). What the bell curve says and doesn’t say: Is a balanced view possible? Roeper Review, 18, 252-255.
Siegle, D., & Powell, T. (2004). Exploring teacher biases when nominating students for gifted programs. Gifted Child Quarterly, 48, 21-29.
Stambaugh, T. (2007). Next steps: An impetus for future direc-tions in research, policy, and practice for low-income promising learners. In J. VanTassel-Baska & T. Stambaugh (Eds.), Over-looked gems: A national perspective on low-income promising learners (pp. 83-88). Washington, DC: National Association for Gifted Children.
Swanson, J. D. (2006). Breaking through assumptions about low-income, minority gifted students. Gifted Child Quarterly, 50, 11-25.
Thompson, B. (2004). Exploratory and confirmatory factor analy-sis. Washington, DC: American Psychological Association.
Thompson, M. S., & Green, S. B. (2006). Evaluating between-group differences in latent variable means. Structural equa-tion modeling: A second course (pp. 119-169). Greenwich, CT: Information Age.
United States Department of Education, Office of Educational Research and Improvement. (1993). National excellence: A case for developing America’s talent. Washington, DC: Government Printing Office.
Valencia, R. R., & Suzuki, L. A. (2001). Intelligence testing and minority students. Thousand Oaks, CA: Sage.
VanTassel-Baska, J. L. (2008). Epilogue: What do we know about identifying and assessing the learning of gifted stu-dents? In J. L. VanTassel-Baska (Ed.), Alternative assessment with gifted and talented students (pp. 309-319). Waco, TX: Prufrock Press.
Viadero, D. (2006, November 8). Scholars test out new yardstick of school poverty. Education Week, 26, 1, 15. Retrieved from http://www.edweek.org/ew/articles/2006/11/08/11poverty.h26 .html
Widaman, K. (1993). Common factor analysis versus principal components analysis: Differential bias in representing model parameters? Multivariate Behavioral Research, 28, 263-311.
Worrell, F. C. (2007). Identifying and including low-income learn-ers in programs for the gifted and talented: Multiple complexi-ties. In J. VanTassel-Baska & T. Stambaugh (Eds.), Overlooked gems: A national perspective on low-income promising learners (pp. 47-51). Washington, DC: National Association of Gifted Children.
Wyner, J. S., Bridgeland, J. M., & Diiulio, J. J. (2009). The achieve-ment trap (Revised ed.). Washington, DC: Jack Kent Cooke Foundation.
Yoon, S., & Gentry, M. (2009). Racial and ethnic representation in gifted programs: Current status of and implications for gifted Asian American students. Gifted Child Quarterly, 53, 121-136.
Zwick, W. R., & Velicer, W. F. (1986). Comparison of five rules for determining the number of components to retain. Psychological Bulletin, 99, 432-442.
Bios
Scott J. Peters is an assistant professor of educational founda-tions at the University of Wisconsin–Whitewater, where
at PURDUE UNIV LIBRARY TSS on April 15, 2011gcq.sagepub.comDownloaded from
Peters and Gentry 313
he teaches courses related to measurement and assessment, research methodology, and gifted education. He received his PhD from Purdue University in 2009, specializing in gifted and talented education with secondary areas in applied research methodology and English education. His research interests include educational research methodology with particular focus on assessment and identification as well as nontraditional giftedness and secondary student programming outcomes. He has published in Teaching for High Potential, Gifted Child Quarterly, the Journal of Advanced Academics, the Journal of
Career and Technical Education Research, Ed Leadership, and Pedagogies.
Marcia Gentry, professor of gifted, creative, and talented studies, directs the Gifted Education Resource Institute at Purdue Univer-sity, where she enjoys working with doctoral students and engaging in research and gifted education professional development. She remains active in the field through service to NAGC and AERA and by writing, reviewing, and presenting research aimed to improve education for children, youth, and teachers.
at PURDUE UNIV LIBRARY TSS on April 15, 2011gcq.sagepub.comDownloaded from