gig economy jpmc-institute-online-platform-econ-brief
TRANSCRIPT

Pending Appointments
Request PaymentContact Customer
LAST TRIP
EARNINGS$16.59
November 2016
The Online Platform Economy
Has Growth Peaked?

B
About the InstituteThe global economy has never been more complex, more interconnected, or faster moving. Yet economists, businesses, nonprofit leaders, and policymakers have lacked access to real-time data and the analytic tools to provide a comprehensive perspective. The results—made painfully clear by the Global Financial Crisis and its aftermath—have been unrealized potential, inequitable growth, and preventable market failures.
The JPMorgan Chase Institute is harnessing the scale and scope of one of the world’s leading firms to explain the global economy as it truly exists. Its mission is to help decision-makers—policymakers, businesses, and nonprofit leaders—appreciate the scale, granularity, diversity, and interconnectedness of the global economic system and use better facts, timely data, and thoughtful analysis to make smarter decisions to advance global prosperity. Drawing on JPMorgan Chase’s unique proprietary data, expertise, and market access, the Institute develops analyses and insights on the inner workings of the global economy, frames critical problems, and convenes stakeholders and leading thinkers.
The JPMorgan Chase Institute is a global think tank dedicated to delivering data-rich analyses and expert insights for the public good.
Acknowledgments We thank David Wasser for superb research assistance, including contributions at every stage of the research process.
We also thank Derek Bekebrede, Chenna Cotla, Natalie Holmes, Marvin Ward Jr, Chris Wheat, Jessica Wu, and Kerry Zhang for providing excellent comments. We would also like to acknowledge the contributions and support of the entire JPMorgan Chase Institute team and the JPMorgan Chase Intelligent Solutions team of data experts, without whom this research would not have been possible.
We would like to acknowledge Jamie Dimon, CEO of JPMorgan Chase & Co., for his vision and leadership in establishing the Institute and enabling the ongoing research agenda. Along with support across the Firm—notably from Peter Scher, Len Laufer, Max Neukirchen, Joyce Chang, Matt Zames, Judy Miller, and Alexis Bataillon—the Institute has had the resources and support to pioneer a new approach to contribute to global economic analysis and insight.

1
The Online Platform EconomyHas Growth Peaked?
Diana FarrellFiona Greig
Contents
2 Executive Summary
3 Introduction
4 Findings
17 Implications
18 References
19 Appendix
23 Endnotes

2
Executive Summary
The growth of the Online Platform Economy (OPE) has been contributing to the changing nature of work. Is this marketplace building momentum towards systemic change in the labor force, or will it remain a small market for supplementary income? In previous work we highlighted that growth in participation on labor and capital platforms has peaked. As of June 2016, participation on labor platforms has doubled year-over-year, but participation on capital platforms has leveled off. In this report, we explore the dynamics of participation and earnings in order to better understand how growth has slowed. We draw from one of the largest samples of platform participants to date: over 240,000 anonymized individuals who have received platform income between October 2012 and June 2016 from one or more of 42 different platforms. Our findings point to several dimensions of how the growth in online platform participation has slowed.
• Monthly earnings from labor platforms have fallen by 6 percent since June 2014, a trend that coincides with wage cuts by some platforms.
• Turnover in the Online Platform Economy is high. One in six participants in any given month is new, and more than half of participants exit within 12 months. Participants with higher incomes, more stable employment, and younger cohorts are more likely to exit the Online Platform Economy within a year.
• The traditional labor market has strengthened, narrowing the pool of likely platform participants. Non-employed individuals are more likely than the employed to participate in labor platforms and they are more likely to continue participating after 12 months.
In sum, growth in online platform participation is highly dependent on attracting new participants or increasing engagement of existing participants. As outside options improve, recruiting and retaining platform workers might become increasingly difficult and could constrain future growth.
Source: JPMorgan Chase Institute
0.7%
0.4%
Participation rateon labor platforms
(June 2016)
37%
56%
Percent of labor platformparticipants who dropout within 12 months
One in six is newin any given month
Three in six leavewithin 12 months
Non-employed Employed
Non-employed are key participants for labor platformsTurnover in the Online Platform Economy is high

3
The growth of the Online Platform Economy (OPE) has been contributing to the changing nature of work. With more than four percent of adults earning income by selling goods or services through platforms that connect them directly to customers, and many more participating in other forms of contingent work, the labor market now offers more easily accessible opportunities to earn income. Others have documented the recent growth, and continued growth potential, of independent work more broadly as well as by platforms specifically.1 Is this marketplace in fact building momentum towards systemic change in the labor force, or will it remain a fringe market for supplementary income?
In previous work we highlighted that although participation in labor and capital platforms continues to grow quickly, the growth rates have peaked (JPMorgan Chase Institute, 2016a). Here we explore the dynamics of participation and earnings in order to better understand how growth has slowed. Building on our initial OPE data asset released in our February 2016 report Paychecks, Paydays, and the Online Platform Economy, we report on one of the largest samples of platform participants to date: over 240,000 anonymized individuals who have received income at least once between October 2012 and June 2016 from at least one of 42 different platforms (Farrell and Greig, 2016).2 We distinguish between labor platforms and capital platforms (Figure 1). Labor platforms, such as Uber or TaskRabbit, and which are sometimes referred to as the “gig economy,” connect customers with freelance or contingent workers who perform discrete tasks or projects. Capital platforms, such as Airbnb or eBay, connect customers with individuals who lease assets or sell goods peer-to-peer.3
Our findings point to several dimensions of how the growth in participation on online platforms has slowed. First, we document that the rate of growth in participation in the Online Platform Economy peaked in 2014 and has slowed since then. Second, monthly earnings from labor platforms have fallen since June 2014, a trend that coincides with wage cuts by some platforms. Third, turnover among the online platform workforce is high: one in six participants in any given month is new and more than half of participants exit within 12 months. Fourth, turnover is particularly high among employed, higher-income, and younger participants. Finally, as the labor market has strengthened, the share of participants with outside employment, a segment that exhibits lower attachment to platform work, has increased on both labor and capital platforms. In sum, growth in online platform participation is highly dependent on attracting new participants or increasing attachment of existing participants. As outside options improve, recruiting and retaining platform workers might become increasingly difficult.
Figure 1: In defining the Online Platform Economy we distinguish between labor and capital platforms
Source: JPMorgan Chase Institute
Online Platform Economy Attributes
• Sellers are paid for a single task or good at a time
• Payment passes through the platform
• Connects workers or sellers directly to customers
• Allows people to work when they want
PaymentReceived
Labor Platforms
FOR RENT
Participants performdiscrete tasks
Participants sellgoods or rent assets
Capital Platforms
Introduction

4
Participation in the Online Platform Economy continued to grow through 2015 and the first half of 2016, but that growth slowed compared to earlier periods. In June 2016, 0.9 percent of adults actively earned income from the Online Platform Economy, including 0.5 percent from labor platforms and 0.4 percent from capital platforms (Figure 2). Cumulatively, 4.3 percent of adults earned income from the platform economy over this timeframe—1.5 percent from labor platforms and 2.8 percent from capital platforms.
Figure 2: Monthly participation in the Online Platform Economy slowed in 2016 while cumulative participation continued to grow
Percent of adults participating in theOnline Platform Economy in each month
Labor platforms Capital platforms Total
Oct
'12
Dec
'12
Feb
'13
Apr
'13
Jun
'13
Aug
'13
Oct
'13
Dec
'13
Feb
'14Ap
r '14
Jun
'14Au
g '14
Oct
'14
Dec
'14
Feb
'15
Apr
'15
Jun
'15
Aug
'15
Oct
'15
Dec
'15
Feb
'16
Apr
'16
Jun
'16
Oct
'12
Dec
'12
Feb
'13
Apr
'13
Jun
'13
Aug
'13
Oct
'13
Dec
'13
Feb
'14Ap
r '14
Jun
'14Au
g '14
Oct
'14
Dec
'14
Feb
'15
Apr
'15
Jun
'15
Aug
'15
Oct
'15
Dec
'15
Feb
'16
Apr
'16
Jun
'16
0.0%
0.1%
0.2%
0.3%
0.4%
0.5%
0.6%
0.7%
0.8%
0.9%
1.0%
Cumulative percent of adults who have ever participated in the Online Platform Economy
0.0%
0.5%
1.0%
1.5%
2.0%
2.5%
3.0%
3.5%
4.0%
4.5%
5.0%
Source: JPMorgan Chase Institute
0.5%
0.4%
0.9%
1.5%
2.8%
4.3%
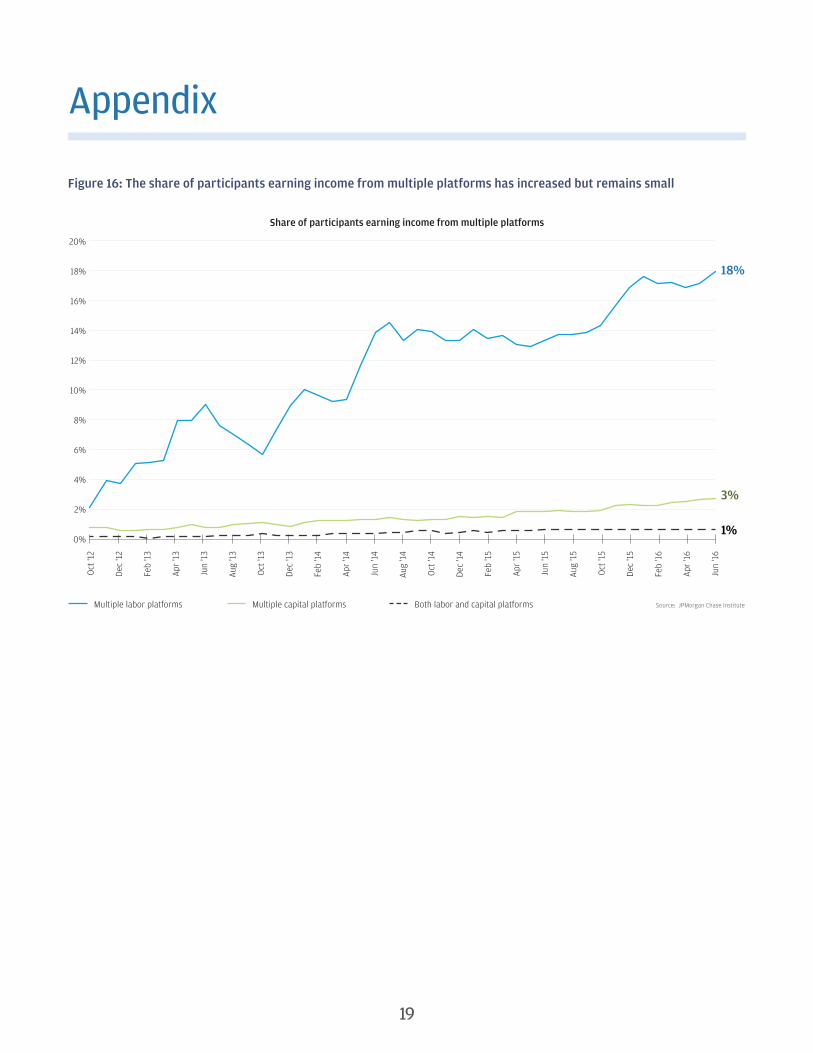
Starting in late 2015 and continuing into the first half of 2016, monthly participation on capital platforms leveled off (Figure 2). Monthly participation on labor platforms continued to grow, albeit at a much lower rate in 2016 compared to prior years. As of June 2016, participation in capital platforms exhibited no year-over-year growth, but participation in labor platforms doubled year-over-year (Figure 3).4 While growth in participation has slowed, the share of participants earning income from multiple platforms has increased but remains small. As of June 2016, 18 percent of participants earned income from multiple labor platforms, 3 percent of participants earned income from multiple capital platforms, and 1 percent of participants earned income from both types of platforms (see Figure 16 in the Appendix for the full time series of these shares). Year-over-year growth in platform earnings also slowed from over 200 percent for both labor and capital platforms in 2014 to 171 percent on labor platforms and 34 percent on capital platforms as of June 2016 (Figure 3).
Findings
Finding One
Growth in participation in the Online Platform Economy peaked in 2014 and has slowed since then.

Findings
5
THE ONLINE PLATFORM ECONOMY: HAS GROWTH PEAKED?
Figure 3: Growth in the monthly participation in and total earnings from online platforms slowed considerably
Year-over-year growth in the percent of adultsparticipating in the Online Platform Economy each month
Labor platforms Capital platforms
Oct
'13
Dec
'13
Feb
'14
Apr
'14
Jun
'14
Aug
'14
Oct
'14
Dec
'14
Feb
'15
Apr
'15
Jun
'15
Aug
'15
Oct
'15
Dec
'15
Feb
'16
Apr
'16
Jun
'16
Oct
'13
Dec
'13
Feb
'14
Apr
'14
Jun
'14
Aug
'14
Oct
'14
Dec
'14
Feb
'15
Apr
'15
Jun
'15
Aug
'15
Oct
'15
Dec
'15
Feb
'16
Apr
'16
Jun
'16
-100%
0%
100%
200%
300%
400%
500%
600%
700%
800%
-100%
0%
100%
200%
300%
400%
500%
600%
700%
800%
Year-over-year growth in total earnings inthe Online Platform Economy each month
102%
-3%
171%
34%
Source: JPMorgan Chase Institute
Thus, while growth rates in participation and platform earnings have slowed, they remain relatively flat for capital platforms. This is consistent with speculation by others that the near-term growth potential for independent work might be higher for online labor platforms compared to online capital platforms. For example, Manyika et al. (2016) estimated that the number of independent workers providing labor services is more than five times larger than the number of independent workers selling goods or renting assets: around 150 million and 8 million across the US and Europe, respectively.5 However, the share of independent worker income earned through online platforms is much lower for labor services (6 percent) compared to selling goods (63 percent) or leasing assets (36 percent). As we show below, high turnover and an improving traditional labor market are a few factors that might hinder that growth in the Online Platform Economy going forward.
At the city level, there is substantial variation across cities in both the level and growth of labor platform participation. In June 2016, participation on labor platforms ranged from 1.2 percent
of adults in San Francisco to 0.2 percent in Detroit (Figure 4). New York experienced the fastest growth in participation—a 236 percent increase year-over-year—while San Francisco experienced the slowest rate of growth at 26 percent year-over-year. In general, cities with lower participation rates grew faster than cities with higher participation rates: there is a cross-city correlation of -0.6 between labor platform participation levels in June 2016 and year-over-year growth between June 2015 and 2016. This implies that labor platform participation is converging across cities, as cities with lower levels of participation “catch
up” to cities that already have higher participation rates. A number of city-specific factors, however, likely influence this relationship and the future trajectory of participation, including
differences in regulations and demand for platform services.
Participation in labor platforms doubled year-over-
year, but capital platform participation
leveled off.

Findings
6
THE ONLINE PLATFORM ECONOMY: HAS GROWTH PEAKED?
Figure 4: There is substantial variation across cities in both the level and growth of participation on labor platforms
Source: JPMorgan Chase Institute
Percent of adults participating on labor platforms in June 2016
1.2%1.0%
1.0%1.0%
0.9%0.8%
0.7%0.7%
0.5%0.5%
0.5%0.4%
0.4%0.3%
0.2%
San Francisco
Atlanta
San Jose
Los Angeles
Miami
Chicago
Denver
San Diego
Dallas
Phoenix
New York
Seattle
Columbus
Houston
Detroit
Year-over-year growth
26%121%53%76%68%83%81%49%97%
109%236%77%128%134%114%
Correlation
-0.6
Across the 15 cities there was considerably less variation in participation on capital platforms, and participation growth was relatively flat. Participation rates range from 0.6 percent of adults in Seattle to 0.3 percent in Dallas (Figure 5). Growth in participation was virtually flat in most cities, with Denver experiencing the most year-over-year growth (11 percent) and Columbus experiencing the least (-15 percent). The cross-city correlation between participation levels and growth was 0.7 in June 2016, in contrast to labor platforms, where participation levels and growth were negatively correlated. In other words, cities with the highest capital platform participation were cities that had continued to experience positive growth in participation. As a result, participation levels are not necessarily converging across cities on capital platforms, as they are on labor platforms.
Figure 5: Growth in capital platform participation has mostly stalled
Source: JPMorgan Chase Institute
0.6%0.6%
0.5%0.5%
0.5%
0.4%0.4%
0.4%0.4%
0.3%0.3%
0.3%0.3%
0.3%0.3%
Year-over-year growth
8%0%6%11%-5%-1%0%0%-1%-2%-5%-8%-15%-1%-7%
Seattle
San Francisco
San Diego
Denver
Los Angeles
San Jose
New York
Chicago
Atlanta
Miami
Detroit
Phoenix
Columbus
Houston
Dallas
Percent of adults participating on capital platforms in June 2016
Correlation
0.7

Findings
7
THE ONLINE PLATFORM ECONOMY: HAS GROWTH PEAKED?
One dimension of the slowing growth in participation is that monthly earnings from labor platforms fell between June 2014 and June 2016. While earnings on both types of platforms grew over the full time period, this overall trend masks a more recent decline in labor platform earnings. The three-month rolling average of nominal monthly earnings on labor platforms grew by 51 percent from December 2012 to June 2014 but fell by 6 percent between June 2014 and June 2016 (Figure 6).6 On capital platforms, average earnings grew by 11 percent prior to June 2014 and 35 percent between June 2014 and June 2016.
Figure 6: Average monthly earnings on labor platforms peaked in June 2014, while earnings from capital platforms have grown continuously
Labor platforms Capital platforms Source: JPMorgan Chase Institute
Three-month rolling average of monthly platform earnings
Dec
'12
Feb
'13
Apr
'13
Jun
'13
Aug
'13
Oct
'13
Dec
'13
Feb
'14
Apr
'14
Jun
'14
Aug
'14
Oct
'14
Dec
'14
Feb
'15
Apr
'15
Jun
'15
Aug
'15
Oct
'15
Dec
'15
Feb
'16
Apr
'16
Jun
'16
$0
$200
$400
$600
$800
$1,000
$1,200
$1,400
$1,024
$1,247
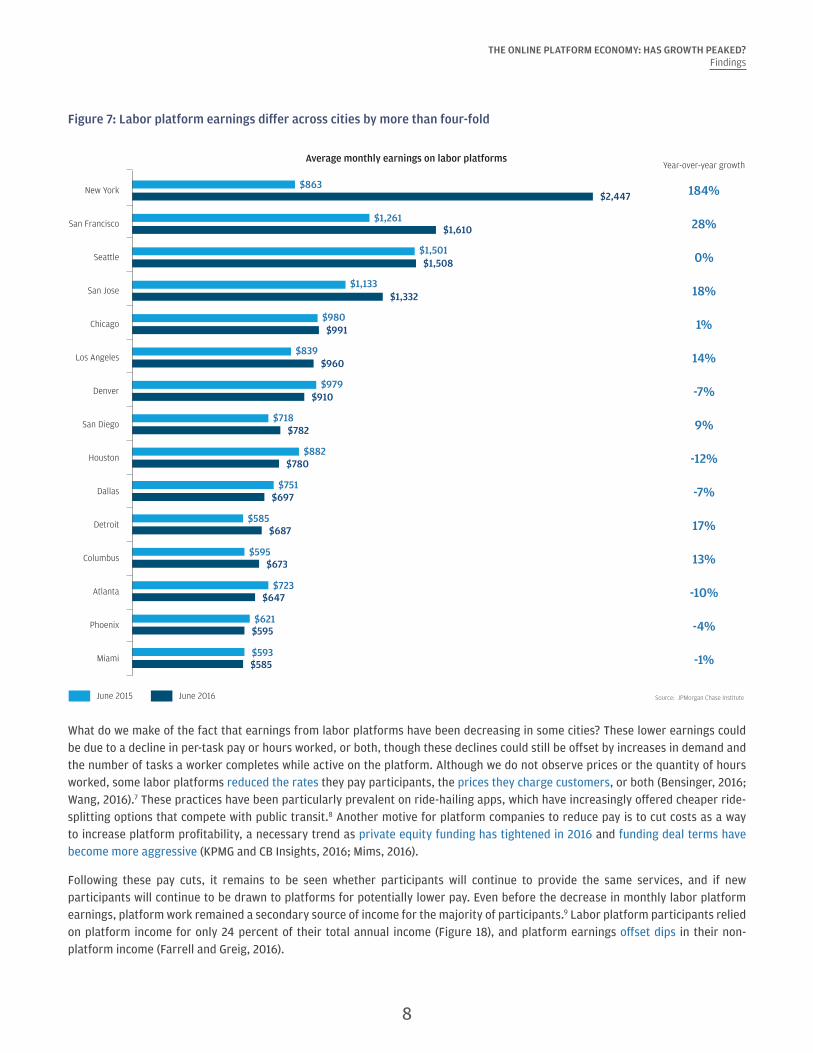
Examining monthly platform earnings within 15 metro areas, we observe that labor platform earnings differ by more than a factor of four across cities (Figure 7). In June 2016, average monthly labor platform earnings ranged from $2,447 in New York to $585 in Miami. Six out of the 15 cities experienced a year-over-year decline in earnings. Nine cities experienced an increase in monthly earnings, ranging from 1 percent growth in Chicago to 184 percent in New York.
Finding Two
While monthly earnings on capital platforms increased by 34 percent between June 2014 and June 2016, they decreased on labor platforms by 6 percent.
There is more than a four-fold difference in monthly platform
earnings across cities.
Findings
8
THE ONLINE PLATFORM ECONOMY: HAS GROWTH PEAKED?
Figure 7: Labor platform earnings differ across cities by more than four-fold
$863
$1,261
$1,501
$1,133
$980
$839
$979
$718
$882
$751
$585
$595
$723
$621
$593
$2,447
$1,610
$1,508
$1,332
$991
$960
$910
$782
$780
$697
$687
$673
$647
$595
$585
Average monthly earnings on labor platforms
New York
San Francisco
Seattle
San Jose
Chicago
Los Angeles
Denver
San Diego
Houston
Dallas
Detroit
Columbus
Atlanta
Phoenix
Miami
Source: JPMorgan Chase InstituteJune 2015 June 2016
Year-over-year growth
184%
28%
0%
18%
1%
14%
-7%
9%
-12%
-7%
17%
13%
-10%
-4%
-1%
What do we make of the fact that earnings from labor platforms have been decreasing in some cities? These lower earnings could be due to a decline in per-task pay or hours worked, or both, though these declines could still be offset by increases in demand and the number of tasks a worker completes while active on the platform. Although we do not observe prices or the quantity of hours worked, some labor platforms reduced the rates they pay participants, the prices they charge customers, or both (Bensinger, 2016; Wang, 2016).7 These practices have been particularly prevalent on ride-hailing apps, which have increasingly offered cheaper ride-splitting options that compete with public transit.8 Another motive for platform companies to reduce pay is to cut costs as a way to increase platform profitability, a necessary trend as private equity funding has tightened in 2016 and funding deal terms have become more aggressive (KPMG and CB Insights, 2016; Mims, 2016).
Following these pay cuts, it remains to be seen whether participants will continue to provide the same services, and if new participants will continue to be drawn to platforms for potentially lower pay. Even before the decrease in monthly labor platform earnings, platform work remained a secondary source of income for the majority of participants.9 Labor platform participants relied on platform income for only 24 percent of their total annual income (Figure 18), and platform earnings offset dips in their non-platform income (Farrell and Greig, 2016).

Findings
9
THE ONLINE PLATFORM ECONOMY: HAS GROWTH PEAKED?
On capital platforms, there was again a four-fold difference in the level of earnings across cities—ranging from $2,245 in Miami to $507 in Columbus (Figure 8). Capital platform earnings increased year-over-year in almost all 15 cities. Participants in Miami experienced more than a doubling in monthly earnings, while earnings growth in Atlanta fell one percent year-over-year.
Figure 8: There has been significant earnings growth in capital platforms across cities
$1,069
$1,518
$1,319
$1,205
$1,060
$1,180
$1,080
$792
$807
$861
$944
$779
$801
$885
$445
$2,245
$1,928
$1,566
$1,565
$1,433
$1,418
$1,407
$1,317
$1,225
$1,159
$1,048
$1,033
$995
$876
$507
Source: JPMorgan Chase Institute
Average monthly earnings on capital platforms
Miami
San Diego
New York
Denver
Detroit
Los Angeles
San Francisco
Dallas
Seattle
Houston
San Jose
Chicago
Phoenix
Atlanta
Columbus
June 2015 June 2016
Year-over-year growth
110%
27%
19%
30%
35%
20%
30%
66%
52%
35%
11%
33%
24%
-1%
14%
Capital platform income increased in 2016 across all cities, while participation growth remained flat in most places. This could reflect an increase in online retail spending but not necessarily a commensurate growth in the percent of online retailers who are independent workers. Given that capital platform participants relied on platform income for just 10 percent of their total annual income (see Figure 18) and used it to supplement their non-platform income, platform earnings are more secondary for capital platform participants than labor platform participants (Farrell and Greig, 2016). As a result, their willingness to participate may not be as sensitive to earnings levels as it is for labor platform participants.

Findings
10
THE ONLINE PLATFORM ECONOMY: HAS GROWTH PEAKED?
About one in six participants is a new entrant to the Online Platform Economy in any given month across both labor and capital platforms (Figure 9). The share of participants who are newcomers fell from 29 percent for labor platforms in July 2014 and 59 percent for capital platforms in June 2014 to 17 percent on labor platforms and 16 percent on capital platforms in June 2016.10 Starting in late 2015 and continuing into the first half of 2016, the fraction of active participants who are new entrants decreased slightly, contributing to slower participation growth during the same time period. After the first month of platform participation, though, further participation is quite sporadic. Labor platform participants earned income in only 41 percent of subsequent months, while capital platform participants earned income in just 16 percent of subsequent months.11
Figure 9: About one in six active participants is a new entrant to the Online Platform Economy in any given month
Source: JPMorgan Chase Institute
* Data are shown starting in January 2014 because the percentage of participants that are new is mechanically equal to 100% in the first month. Time series are otherwise consistent prior to January 2014. The changing mix of platforms with active participants in any one month resulted in the large spike in new entrants on capital platforms in mid-2014.
Percent of active participants that are new entrants to the Online Platform Economy*
17%16%
Labor platforms Capital platforms
Jan
'14
Mar
'14
May
'14
Jul '
14
Sept
'14
Nov
'14
Jan
'15
Mar
'15
May
'15
Jul '
15
Sept
'15
Nov
'15
Jan
'16
Mar
'16
May
'16
Jun
'16
Feb
'14
Apr
'14
Jun
'14
Aug
'14
Oct
'14
Dec
'14
Feb
'15
Apr
'15
Jun
'15
Aug
'15
Oct
'15
Dec
'15
Feb
'16
Apr
'16
0%
10%
20%
30%
40%
50%
60%
Platform careers are also very short-lived.12 Slightly more than half of Online Platform Economy participants—52 percent of labor platform participants and 56 percent of capital platform participants—exit the platform economy within 12 months (Figure 10).13 More than one-third of capital platform participants, meanwhile, earned platform income for just one month compared to 17 percent of labor platform participants.
Finding Three
Turnover in the Online Platform Economy is high: one in six participants in any given month is new, and more than half of participants exit within 12 months.

Findings
11
THE ONLINE PLATFORM ECONOMY: HAS GROWTH PEAKED?
Figure 10: More than half of Online Platform Economy participants end their careers within 12 months
Source: JPMorgan Chase Institute
* Data reflect all participants who first earned platform income in July 2014 or earlier. Platform careers are defined as the number of months between the first month with observed platform income and the last month with observed platform income, without requiring receipt of platform income in the intervening months.
Labor platforms Capital platforms
Percent of participants by length of observed platform career*
17%
23%
12%
9%
12%
26%
36%
12%
8%9%
13%
22%
1 month 2-6 months 7-12 months 13-18 months 19-24 months More than 24 months
Labor platforms:
52%
Capital platforms:
56%
This high degree of turnover suggests that participants might not treat platforms like traditional jobs, where, according to the Bureau of Labor Statistics, the median length of time a wage and salary worker has been with his or her current employer is over four years (Bureau of Labor Statistics, 2016). This might be because platforms as of yet do not typically offer the full package of income security, benefits, training, and income and career progression that many traditional jobs offer. By offering the flexibility to work when and wherever participants want, platforms might have difficulty creating organizational commitment, work-group cohesion, and promotion opportunities—some of the typical predictors of employee retention in traditional jobs.14
High turnover also implies that growth in online platform participation is highly dependent on attracting new participants or increasing the attachment of existing participants (either by lengthening their careers or increasing the percent of time they are active during their careers). As mentioned above, participants are active less than half of the time during their platform careers (42 percent of months for labor platform participants and 16 percent of months for capital platform participants). If the fraction of active participants who are new entrants continues to decline, then growth in participation could continue to slow.
Given high participant turnover, growth in online
platform participation is highly dependent on attracting new
participants or increasing the attachment of existing
participants.

Findings
12
THE ONLINE PLATFORM ECONOMY: HAS GROWTH PEAKED?
While half of all participants exit the Online Platform Economy within 12 months, some cohorts are more likely to drop out than others. On labor platforms, participants with more stable non-platform employment and higher incomes as well as younger participants (34 and under) are more likely to exit within a year (Figure 11). Younger participants and those with more stable employment are more likely to drop out on capital platforms. For the groups that remain attached to online platforms for more than a year, in particular those with lower incomes and who experienced at least one month of nonemployment over this time frame, platforms provide a vital source of additional income, which we document below.
Figure 11: The employed, higher-income, and the youngest participants are more likely to drop out of the Online Platform Economy
58%56%
Source: JPMorgan Chase Institute* Quintile 1: <$30,600, Quintile 2: $30,600-$44,800, Quintile 3: $44,800-$59,000, Quintile 4: $59,000-$84,900, Quintile 5: >$84,900
Percent of participants who drop out within 12 months
69%
59%
55%
52%
50%
49%
56%
58%
58%
56%
53%
56%
56%
Mean: 56%Mean: 52%
Age
Income*
Gender
Age
Income*
Gender
61%
55%
49%
47%
50%
50%
44%
49%
53%
56%
60%
62%
54%
48%
18-24
25-34
35-44
45-54
55-64
65+
Quintile 1
Quintile 2
Quintile 3
Quintile 4
Quintile 5
Women
Men
Ever Nonemployed
Employed
Labor market status Labor market status
37%
18-24
25-34
35-44
45-54
55-64
65+
Quintile 1
Quintile 2
Quintile 3
Quintile 4
Quintile 5
Women
Men
Ever Nonemployed
Employed
Labor platforms Capital platforms
Finding Four
Employed, higher-income, and younger participants are more likely to exit the Online Platform Economy within a year.

Findings
13
THE ONLINE PLATFORM ECONOMY: HAS GROWTH PEAKED?
There was wide dispersion in dropout rates across cities on labor platforms but little variation in dropout rates on capital platforms (Figure 12). On labor platforms, the percent of people who drop out of labor platforms within 12 months ranged from 69 percent in Detroit to 45 percent in San Francisco. Recalling Figure 4, cities with lower exit rates also typically have higher levels of participation and lower levels of participation growth. For example, in San Francisco and San Jose, where many platform companies are headquartered and their services were first offered, participation rates are relatively high while both turnover rates and participation growth are relatively low. Part of this relationship is likely mechanical—it is not surprising that participation levels are higher where exit levels are lower. However, it might also suggest that exit rates could decline in cities as labor platform markets mature.
Figure 12: There is wide dispersion in quit rates on labor platforms across cities, with turnover lowest in San Francisco
Source: JPMorgan Chase Institute
69%
66%
61%
57%
56%
55%
55%
55%
53%
51%
50%
49%
48%
48%
45%
Detroit
Houston
Columbus
Miami
Phoenix
Seattle
Dallas
Atlanta
New York
Denver
Los Angeles
San Diego
San Jose
Chicago
San Francisco
Detroit
Houston
Columbus
Miami
Phoenix
Seattle
Dallas
Atlanta
New York
Denver
Los Angeles
San Diego
San Jose
Chicago
San Francisco
Mean: 52%
58%
62%
59%
57%
56%
56%
61%
57%
54%
55%
54%
53%
55%
57%
55%
Mean: 56%
Percent of participants who drop out within 12 months
Labor platforms Capital platforms

Findings
14
THE ONLINE PLATFORM ECONOMY: HAS GROWTH PEAKED?
Previously we documented that lower-income individuals were more likely to participate in labor platforms than higher-income individuals, and that they were also more reliant on their labor platform income (JPMorgan Chase Institute, 2016b). As of June 2016, this continues to be the case—0.6 percent of individuals in the lowest income quintile earned income from labor platforms compared to 0.5 percent for the sample as a whole (see Appendix Figures 17-19 for rates of participation and reliance for all demographic groups). We also find that their platform careers are more persistent: 44 percent of participants in the lowest income quintile stopped accessing platform income within 12 months compared to 53 percent of middle income participants and 60 percent in the highest income quintile. The same relationship holds for the nonemployed, among whom participation is more prevalent (Figure 17), reliance is higher (Figure 18), and turnover is lower (Figure 11), than among those with stable jobs or who were employed as of June 2016.
A different pattern exists, however, among the youngest labor platform participants (those ages 18 to 24). Although they have the highest participation rates—1.0 percent on labor platforms and 0.4 percent on capital platforms as of June 2016—they are among the least reliant on platform income, and their careers are particularly short-lived: 61 percent drop out of labor platforms and 69 percent drop out of capital platforms within one year. The only other participants with a higher exit rate on labor platforms are women (62 percent).
We also examine the relationship between initial reliance on platform income and continued attachment (Figure 13). In the first 12 months of their platform career, we observe that participants who persist on platforms beyond the first year are also more reliant on it in active months than those who drop out within one year: platform income represents 47 percent of income in active months for those who remain in the Online Platform Economy compared to 30 percent for those who drop out.
This difference is also present on capital platforms, though to a lesser extent. For capital platform participants platform income represents 25 percent of income in active months for those who remain in the Online Platform Economy compared to 21 percent for those who drop out.
The degree to which these persistent participants rely on platform income is also consistent throughout their career. For these participants—many of whom are potentially the most economically vulnerable (those with the lowest incomes and who experienced at least one month of nonemployment)—the Online Platform Economy has provided a substantial fraction of their income for an extended period of time.
Figure 13: Participants who continue to earn platform income beyond 12 months are more reliant on it than those who drop out
Source: JPMorgan Chase Institute
Percent of total income coming from online platforms in active months
21%25% 25%
Exit withinfirst year
Do not exit withinfirst year - Year 1
Do not exit withinfirst year - Year 2+
30%
47%44%
Exit within first year
Do not exit withinfirst year - Year 1
Do not exit withinfirst year - Year 2+
Labor platforms Capital platforms

Findings
15
THE ONLINE PLATFORM ECONOMY: HAS GROWTH PEAKED?
Adults without a non-platform job participate at higher rates on labor platforms than those with earnings from another job (Figure 14). In June 2016, 0.7 percent of nonemployed adults earned income from labor platforms, compared to 0.4 percent of employed adults. Participation rates among different groups with different employment statuses were the same (0.4 percent) on capital platforms.
As of June 2016, 49 percent of labor platform participants and 39 percent of capital platform participants were not employed (Figure 15).15 As was noted in Finding Four, in addition to participating at higher rates, participants who are not employed have longer platform careers than those who are employed. These data points are consistent with the observation that labor platform participants tend to use platform income to smooth over dips in non-platform income. The Online Platform Economy, therefore, represents a relatively accessible and flexible source of additional income for those who might need it most.
Figure 14: The non-employed are more likely to participate in the Online Platform Economy
Source: JPMorgan Chase Institute
Labor platforms
Percent of adults participating on platforms by employment status
0.4%
0.7%Employed
Nonemployed
Capital platforms
Employed
Nonemployed
Oct
'12
Dec
'12
Feb
'13
Apr
'13
Jun
'13
Aug
'13
Oct
'13
Dec
'13
Feb
'14Ap
r '14
Jun
'14Au
g '14
Oct
'14
Dec
'14
Feb
'15
Apr
'15
Jun
'15
Aug
'15
Oct
'15
Dec
'15
Feb
'16
Apr
'16
Jun
'16
Oct
'12
Dec
'12
Feb
'13
Apr
'13
Jun
'13
Aug
'13
Oct
'13
Dec
'13
Feb
'14Ap
r '14
Jun
'14Au
g '14
Oct
'14
Dec
'14
Feb
'15
Apr
'15
Jun
'15
Aug
'15
Oct
'15
Dec
'15
Feb
'16
Apr
'16
Jun
'16
0.0%
0.2%
0.4%
0.6%
0.8%
0.0%
0.2%
0.4%
0.6%
0.8%
0.4%0.4%
Finding Five
Non-employed individuals are more likely than the employed to participate in labor platforms but represent a decreasing share of participants as the unemployment rate drops.

Findings
16
THE ONLINE PLATFORM ECONOMY: HAS GROWTH PEAKED?
The gap in participation rates on labor platforms between the nonemployed and the employed widened in the fourth quarter of 2015 and the first half of 2016. In fact, the growth in
participation among the employed was slower over this nine month period than in previous months, while participation among the nonemployed more closely tracked its previous trajectory. This implies that much of the growth in labor platform participation during these months came from the nonemployed. Moreover, as the traditional labor force strengthens, as a result of both falling unemployment and increases in real wages, labor
supply in the Online Platform Economy might weaken (Furman, 2016).
The fraction of participants holding a non-platform job increased on both labor and capital platforms since October 2012 as the unemployment rate dropped (Figure 15). The fraction of
labor platform participants with a non-platform job increased from a low of 24 percent in January 2013 to 51 percent in June 2016 while the official unemployment rate fell from 8.0 percent to 4.9 percent
over the same period.16 The fraction of capital platform participants with a non-platform job increased more modestly from a low of 54 percent in October 2012 to 61 percent in June 2016. This suggests that labor platform participation might be more sensitive to conditions in the traditional labor market than capital platform participation.17
Figure 15: The fraction of platform participants with a traditional job increased as the unemployment rate dropped
Source: JPMorgan Chase Institute
Share of active participants employed in a non-platform job and the ocial unemployment rate
Labor platforms (left axis) Capital platforms (left axis) Unemployment Rate (BLS; right axis)
Oct
'12
Dec
'12
Feb
'13
Apr
'13
Jun
'13
Aug
'13
Oct
'13
Dec
'13
Feb
'14
Apr
'14
Jun
'14
Aug
'14
Oct
'14
Dec
'14
Feb
'15
Apr
'15
Jun
'15
Aug
'15
Oct
'15
Dec
'15
Feb
'16
Apr
'16
Jun
'16
0%
20%
40%
60%
80%
100%
0%
2%
4%
6%
8%
10%
51%4.9%
61%
As outside employment options improve, recruiting
and retaining platform workers could become increasingly difficult.
17
In June 2016, 0.9 percent of adults earned income from the Online Platform Economy, including 0.5 percent on labor platforms and 0.4 percent on capital platforms. With labor platforms participation still doubling year-over-year, some have called this platform work the “future of work.” However, participation growth on both labor and capital platforms has peaked. Our findings presented here suggest several important dimensions of how growth has slowed:
• Monthly earnings from labor platforms have fallen by 6 percent since June 2014. Labor platform work appeals particularly to more economically vulnerable populations, such as those with low income and less stable employment. This might continue to be the case if platform earnings fall, and platform work becomes less competitive relative to other options, especially as the labor market continues to improve.
• Turnover is high within the online platform workforce. One in six participants is new each month and more than half of participants drop out within 12 months. This high turnover rate makes it harder to sustain growth in the supply of goods and services in the Online Platform Economy.
• The traditional labor market has strengthened, narrowing the pool of likely participants. People holding non-platform jobs participate at lower rates and drop out of platform work more frequently than those without outside employment. As the overall labor market has strengthened, the share of participants with non-platform jobs has increased, particularly on labor platforms. This means that platforms are becoming increasingly reliant on employed participants, who have exhibited lower interest in and attachment to platform work. As outside employment options improve, recruiting and retaining platform workers could become increasingly difficult.
These trends underscore that growth in online platform participation is highly dependent on attracting new participants or increasing the attachment of existing participants. The flexibility afforded by platform work alone might not be sufficient to continue to attract and engage participants on existing terms. In addition to these factors, autonomous vehicles, and automation more generally, could eliminate some labor platform opportunities for independent workers. Efforts to make independent work more sustainable and supportive for workers across all types of platforms might be necessary to realize continued growth.
High participant turnover is an important consideration in designing those support systems. For example, many policy makers are exploring whether workers’ benefits could become more portable. In a world in which benefits are accrued on a pro-rated basis by workers from an array of employers, as some have suggested, the administrative burden associated with high turnover could be substantial if enrollment and re-enrollment are manual processes (Rolf, et al., 2016). Automating these processes might be an important priority if portable benefits aim to be truly universal and cover all workers. Otherwise minimum eligibility requirements might be necessary to limit the administrative burden of managing short-lived participants.
While growth in the Online Platform Economy might be slowing, it is a small part of the broader phenomenon of an increased prevalence of alternative work arrangements. Katz and Kruger (2016) show that the share of workers in alternative arrangements, including independent contractors or freelancers, has increased from 10.7 percent in 2005 to 15.8 percent in 2015. The Online Platform Economy provides an important window into the participation and growth dynamics of independent work more generally.
Implications

18
Bensinger, Greg. 2016. “Grocery-Delivery Startup Instacart Cuts Pay for Couriers.” Wall Street Journal. http://www.wsj.com/articles/grocery-delivery-startup-instacartcuts-pay-for-couriers-1457715105
Bureau of Labor Statistics. 2016. “Employee Tenure in 2016.” http://www.bls.gov/news.release/pdf/tenure.pdf
Census Bureau. 2016. “Quarterly Retail E-Commerce Sales: 2nd Quarter 2016.” https://www.census.gov/retail/mrts/www/data/pdf/ec_current.pdf
Farrell, Diana and Greig, Fiona. 2016. “Paychecks, Paydays, and the Online Platform Economy.” JPMorgan Chase Institute. https://www.jpmorganchase.com/corporate/institute/document/jpmc-institute-volatility-2-report.pdf
Furman, Jason. 2016. “The Employment Situation in September.” Council of Economic Advisers. https://www.whitehouse.gov/blog/2016/10/07/employment-situation-september
Griffeth, Rodger W., Hom, Peter W., and Gaertner, Stefan. 2000. “A Meta-analysis of Antecedents and Correlates of Employee Turnover: Update, Moderator Tests, and Research Implications for the Next Millennium.” Journal of Management 26(3): 463-488. http://www.sciencedirect.com/science/article/pii/S014920630000043X
Hall, Jonathan and Krueger, Alan. 2015. “An Analysis of the Labor Market for Uber’s Driver-Partners in the United States.” Princeton University, Industrial Relations Section Working Papers 587. http://arks.princeton.edu/ark:/88435/dsp010z708z67d
JPMorgan Chase Institute. 2016a. “The Online Platform Economy: What is the Growth Trajectory?” https://www.jpmorganchase.com/corporate/institute/insight-online-platform-econ-growth-trajectory.htm
JPMorgan Chase Institute. 2016b. “The Online Platform Economy: Who earns the most?” https://www.jpmorganchase.com/corporate/institute/insight-online-platform-econ-earnings.htm
Katz, Lawrence and Krueger, Alan. 2016. “The Rise and Nature of Alternative Work Arrangements in the United States, 1995-2015.” National Bureau of Economic Research Working Papers 22667. http://www.nber.org/papers/w22667
KPMG and CB Insights. 2016. “Venture Pulse Q3 2016: Global Analysis of Venture Funding.” https://assets.kpmg.com/content/dam/kpmg/xx/pdf/2016/10/venture-pulse-q3-2016-report.pdf
Manyika, James, Lund, Susan, Bughin, Jacques, Robinson, Kelsey, Mischke, Jan, and Mahajan, Deepa. 2016. “Independent Work: Choice, Necessity, and the Gig Economy.” McKinsey & Company. http://www.mckinsey.com/global-themes/employment-and-growth/independent-work-choice-necessity-and-the-gig-economy
Mims, Christopher. 2016. “This Tech Bubble Is Bursting.” Wall Street Journal. http://www.wsj.com/articles/this-tech-bubble-is-bursting-1462161662
Rolf, David, Clark, Shelby, and Bryan, Corrie Watterson. 2016. “Portable Benefits in the 21st Century: Shaping a New System of Benefits for Independent Workers.” The Aspen Institute Future of Work Initiative. https://dorutodpt4twd.cloudfront.net/content/uploads/2016/07/Portable_Benefits_final2.pdf
SherpaShare. 2015. “The top demographic trends of the on-demand workforce.” https://www.sherpashare.com/share/the-top-demographic-trends-of-the-on-demand-workforce/
Siddiqui, Faiz. 2016a. “Metro’s Loss is Rideshares’ Gain.” Washington Post. https://www.washingtonpost.com/news/dr-gridlock/wp/2016/09/07/metros-loss-is-rideshares-gain/?tid=a_inl
Siddiqui, Faiz. 2016b. “D.C.-based Split will discontinue rideshare service, citing market ‘saturation’.” Washington Post. https://www.washingtonpost.com/news/dr-gridlock/wp/2016/09/27/d-c-based-split-will-discontinue-rideshare-service-citing-market-saturation/
Wang, Selina. 2016. “Uber Drivers Strike to Protest Fare Cuts in New York City.” Bloomberg. https://www.bloomberg.com/news/articles/2016-02-01/uber-drivers-plan-strike-to-protest-fare-cuts-in-new-york-city
Suggested CitationFarrell, Diana and Greig, Fiona. 2016. "The Online Platform Economy: Has Growth Peaked?" JPMorgan Chase Institute.
References
19
Figure 16: The share of participants earning income from multiple platforms has increased but remains small
Source: JPMorgan Chase Institute
Share of participants earning income from multiple platforms
Multiple labor platforms Multiple capital platforms Both labor and capital platforms
Oct
'12
Dec
'12
Feb
'13
Apr
'13
Jun
'13
Aug
'13
Oct
'13
Dec
'13
Feb
'14
Apr
'14
Jun
'14
Aug
'14
Oct
'14
Dec
'14
Feb
'15
Apr
'15
Jun
'15
Aug
'15
Oct
'15
Dec
'15
Feb
'16
Apr
'16
Jun
'16
0%
4%
10%
14%
20%
2%
6%
12%
16%
8%
18% 18%
1%
3%
Appendix

Appendix
20
THE ONLINE PLATFORM ECONOMY: HAS GROWTH PEAKED?
Figure 17: Percent of adults participating in the Online Platform Economy in June 2016, by demographic group
Source: JPMorgan Chase Institute
Participation in labor platforms Participation in capital platforms
0.4%
0.6%
0.4%
0.4%
0.3%
0.1%
0.3%
0.3%
0.4%
0.4%
0.6%
0.4%
0.4%
0.4%
0.4%
1.0%
0.8%
0.6%
0.5%
0.3%
0.1%
0.6%
0.6%
0.5%
0.5%
0.3%
0.3%
0.6%
0.7%
0.4%
Mean: 0.4%Mean: 0.5%
Age
Income*
Gender
18-24
25-34
35-44
45-54
55-64
65+
Quintile 1
Quintile 2
Quintile 3
Quintile 4
Quintile 5
Women
Men
Nonemployed
Employed
18-24
25-34
35-44
45-54
55-64
65+
Quintile 1
Quintile 2
Quintile 3
Quintile 4
Quintile 5
Women
Men
Nonemployed
Employed
Labor market status
Age
Income*
Gender
Labor market status
Labor platforms Capital platforms
* Quintile 1: <$30,600, Quintile 2: $30,600-$44,800, Quintile 3: $44,800-$59,000, Quintile 4: $59,000-$84,900, Quintile 5: >$84,900

Appendix
21
THE ONLINE PLATFORM ECONOMY: HAS GROWTH PEAKED?
Figure 18: Percent of total annual income earned on platforms among established platform participants in the 12 months ending in June 2016, by demographic group*
Reliance on labor platforms Reliance on capital platforms
22%
21%
25%
26%
26%
23%
25%
25%
25%
23%
17%
16%
23%
39%
10%
8%
10%
11%
11%
11%
10%
10%
10%
10%
10%
11%
10%
10%
21%
4%
Source: JPMorgan Chase Institute
Mean: 10%Mean: 24%
Age
Income†
Gender
18-24
25-34
35-44
45-54
55-64
65+
Quintile 1
Quintile 2
Quintile 3
Quintile 4
Quintile 5
Women
Men
Nonemployed
Employed
18-24
25-34
35-44
45-54
55-64
65+
Quintile 1
Quintile 2
Quintile 3
Quintile 4
Quintile 5
Women
Men
Nonemployed
Employed
Labor market status
Age
Income†
Gender
Labor market status
Labor platforms Capital platforms
* We define "established participants" as those who received platform income at any point between October 2012 and June 2015. We study the reliance of this group of participants in order to observe a full 12-month period in which platform income could contribute to a participant's income.
† Quintile 1: <$30,600, Quintile 2: $30,600-$44,800, Quintile 3: $44,800-$59,000, Quintile 4: $59,000-$84,900, Quintile 5: >$84,900

Appendix
22
THE ONLINE PLATFORM ECONOMY: HAS GROWTH PEAKED?
Figure 19: Percent of total annual income earned on platforms among established platform participants in the 12 months ending in June 2016, by city*
San Diego
Denver
San Francisco
Phoenix
Los Angeles
New York
Miami
Houston
Atlanta
Seattle
San Jose
Dallas
Detroit
Chicago
Columbus
Seattle
New York
San Francisco
Houston
San Jose
Los Angeles
Chicago
Denver
San Diego
Miami
Phoenix
Dallas
Detroit
Atlanta
Columbus
36%
33%
30%
27%
25%
23%
23%
21%
21%
20%
20%
20%
19%
19%
16%
Reliance on labor platform income by city Reliance on capital platform income by city
Source: JPMorgan Chase Institute
Mean: 24% Mean: 10%
14%
12%
12%
11%
11%
11%
11%
10%
10%
9%
9%
9%
7%
7%
6%
* We define "established participants" as those who received platform income at any point between October 2012 and June 2015. We study the reliance of this group of participants in order to observe a full 12-month period in which platform income could contribute to a participant's income.
Labor platforms Capital platforms

23
1 Katz and Krueger (2016) document growth in contingent workforce in the US and Manyika et al. (2016) discuss the growth potential of independent work.
2 We examine inflows into checking accounts among core Chase customers who have at least five outflows every month between October 2012 and June 2016. Since the release of Farrell and Greig, 2016, we have adjusted our sample to more accurately estimate OPE participation. These adjustments included, first, increasing the number of platforms from 30 to 42; second, more comprehensively identifying income from these platforms; and, third, more carefully distinguishing refunds from income. The net effect of adjustments to our sample and strategy for identifying platform income, which primarily affected capital platforms, yielded slightly lower participation rates in September 2015 compared to what was reported in Farrell and Greig, 2016: in this report we estimate that 0.4% of adults participated on capital platforms in September 2015 compared to 0.6% of adults previously reported. The sample used here contains 88,339 labor platform participants and 160,392 capital platform participants.
3 Examples are listed to illustrate the definition of labor versus capital platforms and do not imply that we have identified income from these specific platforms.
4 The year-over-year decline in participation on capital platforms might seem counterintuitive given the double-digit year-over-year growth in online retail more broadly. The Census Bureau estimated that e-commerce increased 15.8 percent year-over-year in the second quarter of 2016 while total retail sales increased 2.3 percent over the same period (Census Bureau, 2016). While online retail is growing rapidly, a large fraction of supply might be offered by corporations rather than independent sellers. As such growth in online retail may not necessarily translate into growth in participation in capital platforms. Indeed, as we present in Finding Two, we observe growth in average monthly earnings among capital platform participants.
5 Manyika et al.'s definition of independent work would include labor platform participants in labor services and capital platform participants in independent workers selling goods or renting assets.
6 Rolling averages are displayed here in order to smooth the volatility in average monthly earnings, which is due to a number of factors including seasonality, and more clearly depict the underlying trends. Average monthly earnings grew 60 percent (from $699 to $1,115) on labor platforms and 44% (from $926 to $1,329) on capital platforms from October 2012 to June 2016. After adjusting for inflation using the Consumer Price Index (CPI-U), the three-month average of platform earnings grew 28 percent and 41 percent on labor and capital platforms, respectively.
7 This translates directly into lower pay because participants typically receive a portion of the revenue from each completed task.
8 For example, during public transportation service disruptions in Washington, DC, ridesharing platforms offered such steep discounts that the ride-splitting market was said to have become saturated (Siddiqui, 2016a; Siddiqui, 2016b).
9 We estimated that, as of September 2015, for just 33 percent of labor platform participants and 19 percent of capital platform participants platform income represented more than 50 percent of their total monthly income during months in which they were actively participating on platforms (Farrell and Greig, 2016).
10 While we identify income from 42 different platforms, the mix of platforms with active participants in any one month can change. This changing mix of platforms resulted in the large spike in new entrants on capital platforms in mid-2014.
Endnotes

24
11 In previous research, we have shown that after their initial month of participation, labor platform participants are active in 56 percent of months subsequently and capital platform participants are active just 32 percent of months subsequently (Farrell and Greig, 2016). Differences in sample as well as a decline in engagement count account for lower attachment estimates in this report.
12 In order to measure the typical length of a career in the Online Platform Economy, we followed the careers of participants who first earned platform income in or before July 2014 and for whom we are thus able to observe platform careers that could have lasted two or more years (until July 2016). We define a platform career as the number of months between the first month with observed platform income and the last month with observed platform income, without requiring that we observe platform income in the intervening months. For example, if a participant received platform income in only one month of our sample then their career lasted one month and we claim that they exited the platform economy after one month. If a participant received platform income in all 45 months of our sample then their career lasted 45 months.
13 Our estimates of continuation rates are consistent with a Hall and Krueger (2015) estimate that among Uber drivers just over half of participants were still active after a year. Additionally, a 2015 survey of participants on ride-hailing platforms found that 18 percent of active drivers had been driving for less than two months and 65 percent had been driving for six months or less (SherpaShare, 2015). The platforms mentioned in the results of these studies are examples of labor platforms but are not necessarily included in our sample.
14 See, for example, Griffeth, et al. (2000) for a meta-analysis of the antecedents of job turnover.
15 We only observe labor income received by direct deposit into the individual’s checking account. According to the 2013 Survey of Consumer Finance, roughly 86 percent of payroll dollars are paid via direct deposit.
16 It is also possible that the fraction of labor platform participants is relatively constant over time after controlling for the level of the official unemployment rate: as the unemployment rate falls, any given adult is more likely to be employed and therefore any given platform participant is more likely to be employed. Other characteristics of participants that we do not observe, including education and complete employment histories, would also likely affect their likelihood of employment.
17 We examined whether a strengthening labor market appears to be drawing participants away from labor platform gigs by comparing platform participation growth and unemployment across cities. The dynamics of platform growth are likely to be driven by an array of factors within each metro area, including the timing of when platforms entered the city, the level of demand for platform goods and services, the level and trajectory of platform pay, and the strength of the local labor market. We did not find a significant correlation between participation growth on either labor or capital platforms and the unemployment rate or the change in unemployment rate across cities. This could imply that the dynamics of participation and growth are still driven principally by differences in regulatory environment and consumer demand rather than the strength of the traditional labor market.

25
This material is a product of JPMorgan Chase Institute and is provided to you solely for general information purposes. Unless otherwise specifically stated, any views or opinions expressed herein are solely those of the authors listed, and may differ from the views and opinions expressed by J.P. Morgan Securities LLC (JPMS) Research Department or other departments or divisions of JPMorgan Chase & Co. or its affiliates. This material is not a product of the Research Department of JPMS. Information has been obtained from sources believed to be reliable, but JPMorgan Chase & Co. or its affiliates and/or subsidiaries (collectively J.P. Morgan) do not warrant its completeness or accuracy. Opinions and estimates constitute our judgment as of the date of this material and are subject to change without notice. The data relied on for this report are based on past transactions and may not be indicative of future results. The opinion herein should not be construed as an individual recommendation for any particular client and is not intended as recommendations of particular securities, financial instruments, or strategies for a particular client. This material does not constitute a solicitation or offer in any jurisdiction where such a solicitation is unlawful.
©2016 JPMorgan Chase & Co. All rights reserved. This publication or any portion hereof may not be reprinted, sold, or redistributed without the written consent of J.P. Morgan.

26
This material is a product of JPMorgan Chase Institute and is provided to you solely for general information purposes. Unless otherwise specifically stated, any views or opinions expressed herein are solely those of the authors listed, and may differ from the views and opinions expressed by J.P. Morgan Securities LLC (JPMS) Research Department or other departments or divisions of JPMorgan Chase & Co. or its affiliates. This material is not a product of the Research Department of JPMS. Information has been obtained from sources believed to be reliable, but JPMorgan Chase & Co. or its affiliates and/or subsidiaries (collectively J.P. Morgan) do not warrant its completeness or accuracy. Opinions and estimates constitute our judgment as of the date of this material and are subject to change without notice. The data relied on for this report are based on past transactions and may not be indicative of future results. The opinion herein should not be construed as an individual recommendation for any particular client and is not intended as recommendations of particular securities, financial instruments, or strategies for a particular client. This material does not constitute a solicitation or offer in any jurisdiction where such a solicitation is unlawful.
©2016 JPMorgan Chase & Co. All rights reserved. This publication or any portion hereof may not be reprinted, sold, or redistributed without the written consent of J.P. Morgan.