ginnie mae investor value proposition...commercial bank holdings of agency mbs source: federal...
TRANSCRIPT

Ginnie Mae Investor Value
Proposition
IMPORTANT DISCLOSURE State Street Global Advisors (“SSGA”) has been retained as a consultant/non-discretionary advisor to Ginnie Mae (SSGA does not serve as an asset manager to Ginnie Mae in this capacity). SSGA provides advisory services to Ginnie Mae related to its Global Investor Program, which includes providing insight into the global investor community. SSGA is participating in the 2016 Ginnie Mae Summit ("Summit") solely as Ginnie Mae's consultant/non-discretionary advisor in order to help facilitate discussions and to provide expertise regarding mortgage backed securities, investor decisions in the marketplace, and the U.S. housing finance industry. SSGA's participation in this Summit may not be construed as an endorsement for or recommendation of Ginnie Mae products. Statements made by SSGA in the course of these discussions are in furtherance of SSGA's work on the Global Investor Program, may not be construed as investment advice or recommendations, and are not intended to address any specific Ginnie Mae products or SSGA client, account, or strategy. The views expressed in this material are the views of Jay Ladieu through the period ended September 15, 2016 and are subject to change based on market and other conditions. This document contains certain statements that may be deemed forward-looking statements. Please note that any such statements are not guarantees of any future performance and actual results or developments may differ materially from those projected. This presentation is intended for use at the 2016 Ginnie Mae Summit and is not for use with the general public. Fixed income investments entail interest rate risk , the risk of issuer default, issuer credit risk and inflation risk. Leverage can increase market exposure and magnify investment risk. Investments in asset backed and mortgage backed securities are subject to prepayment risk which can limit the potential for gain during a declining interest rate environment and increases the potential for loss in a rising interest rate environment. All information is from SSGA unless otherwise noted and has been obtained from sources believed to be reliable, but its accuracy is not guaranteed. There is no representation or warranty as to the current accuracy, reliability or completeness of, nor liability for, decisions based on such information and it should not be relied on as such. Adreview: CLADM-0917 Exp date: 9/30/2017 © State Street Corporation- All Rights Reserved SSGA One Lincoln St, Boston, MA 02111-2900
2

Agency MBS Market Structure
• Notional size of Barclays US MBS fixed-rate index is $4.95 trillion
• GNMA represents 27% of the Barclays US MBS fixed-rate index
Source: Barclays Live, Barclays MBS Index Monthly – April 2016
27%
35%
21%
14%
4%
GNMA 30y
FNMA 30y
FHLMC 30y
15yr
20yr
3

GNMA In US and Global Bond Market Context
Barclay’s Global Aggregate Index, % market value Barclay’s US Aggregate Index, % market value
• US MBS Index is 11% of Barclays Global Aggregate Index and 28% of US Aggregate Index
• GNMA makes up 3% of the Global Aggregate Index and 7.5% of the US Aggregate Index
Source: Barclays Live, Barclays MBS Index Monthly – April 2016
55%
6%
24%
11%
1%
3% Global Treasury
Global Agency
Global Credit
US MBS
ABS & CMBS
Collateralised(Pfandbrief)
36%
3%
31%
28%
2%
Treasury
Agency
Credit
US MBS
ABS & CMBS
4
0%
10%
20%
30%
40%
50%
60%
70%
80%
90%
100%
2006Q1 2007Q1 2008Q1 2009Q1 2010Q1 2011Q1 2012Q1 2013Q1 2014Q1 2015Q1 2016Q1
GSEs
Commercial Banks
Federal Reserve
Broker/Dealers
REITs
Other
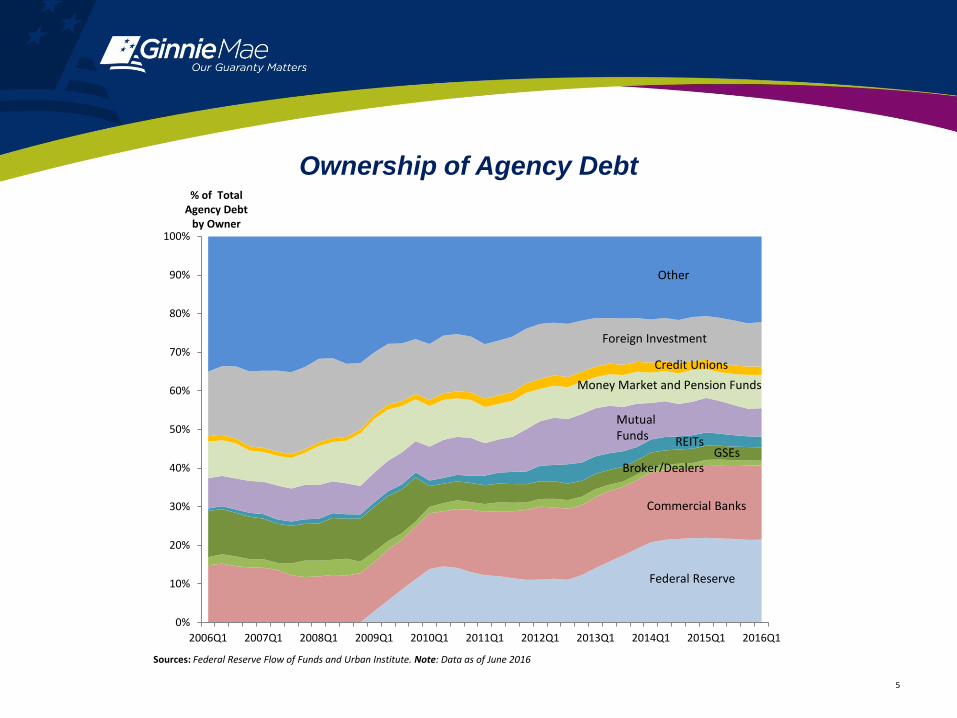
% of Total Agency Debt
by Owner
Mutual Funds
Money Market and Pension Funds
Sources: Federal Reserve Flow of Funds and Urban Institute. Note: Data as of June 2016
Ownership of Agency Debt
Foreign Investment
Credit Unions
5

Source: eMBS, Federal Reserve Bank of New York , Urban Institute and JP Morgan
Data as of June 2016, Total Fed purchases as of Aug 2016
0
50
100
150
200
250
$ B
illio
ns
Fed Absorption of GSE MBS
Gross Issuance Total Fed Purchases
0
5
10
15
20
25
30
35
40
45
50
$ B
illio
ns
Fed Absorption of Ginnie Mae MBS
Gross Issuance Total Fed Purchases
Fed purchases relative to Gross Issuance
• Fed purchases continue to support MBS sector
• Fed balance sheet currently contains $2.3t agency MBS
6
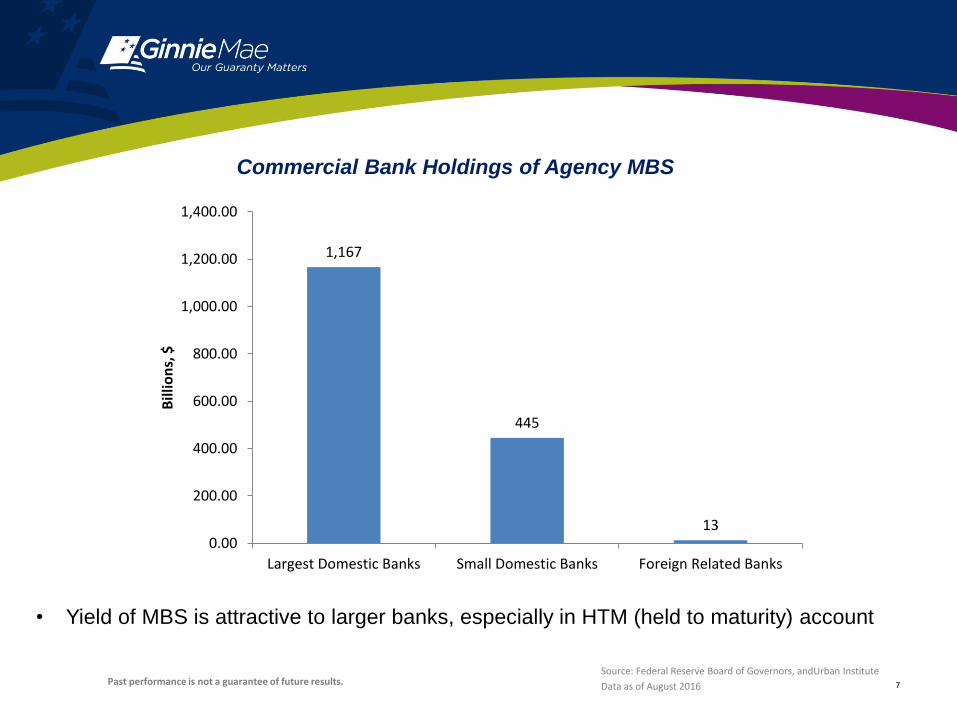
Commercial Bank Holdings of Agency MBS
Source: Federal Reserve Board of Governors, andUrban Institute
Data as of August 2016
1,167
445
13 0.00
200.00
400.00
600.00
800.00
1,000.00
1,200.00
1,400.00
Largest Domestic Banks Small Domestic Banks Foreign Related Banks
Bill
ion
s, $
• Yield of MBS is attractive to larger banks, especially in HTM (held to maturity) account
Past performance is not a guarantee of future results. 7

• Foreign ownership of agency MBS has increased over last 2 years
Source: SIFMA and Federal Reserve Flow of Funds
Data as of April 2016
13.6%
10.5%
11.0%
11.5%
12.0%
12.5%
13.0%
13.5%
14.0%
14.5%Q
4 2
01
1
Q1
20
12
Q2
20
12
Q3
20
12
Q4
20
12
Q1
20
13
Q2
20
13
Q3
20
13
Q4
20
13
Q1
20
14
Q2
20
14
Q3
20
14
Q4
20
14
Q1
20
15
Q2
20
15
Q3
20
15
Q4
20
15
Q1
20
16
Ap
r-1
6
Per
cen
t o
f A
gen
cy M
BS
Ow
ned
by
Fore
ign
ers
Foreign Share of Agency MBS
8
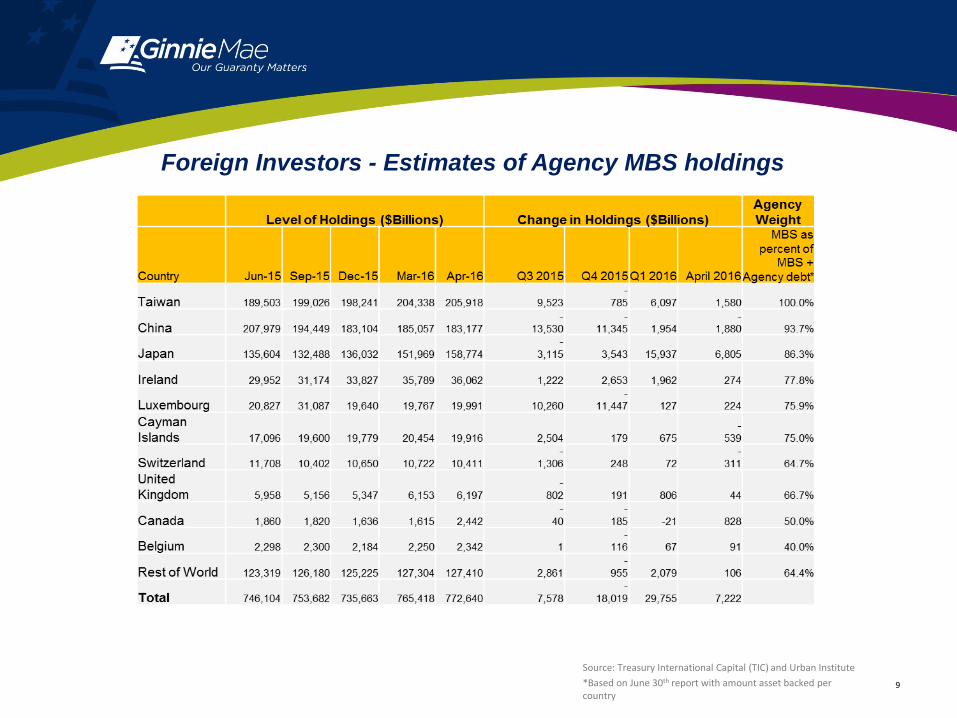
Foreign Investors - Estimates of Agency MBS holdings
Source: Treasury International Capital (TIC) and Urban Institute
*Based on June 30th report with amount asset backed per country
9

The Case for GNMA Securities in Today’s Environment
• Search for yield - Unconventional monetary policy has pushed global government bond yields to historically low levels causing investors to rethink asset allocation decisions
• US Treasuries, Higher Yielding Alternative – Uncharacteristically, the US Treasury market offers more yield than other lower rated developed sovereign bond markets
• Increased USD hedging costs - have eroded yield advantage provided by US Treasury market for foreign investors unwilling to take FX risk
• GNMA MBS Offer Yield Premium to Treasuries – in USD or hedged GNMA MBS afford a yield advantage versus many lower rated sovereign issues for the same credit risk as US Treasuries
• Increased issuance, increased liquidity – GNMA issuance and % market share has grown post-crisis, which has improved investor sponsorship and liquidity
• Risk Adjusted Global Relative Value - GNMA MBS offer more attractive risk adjusted yields than many lower rated liquid government bond markets, offer comparable yields to high quality corporate issuance in U.S and Europe and provide additional portfolio diversification
Past performance is not a guarantee of future results. 10

Search for Yield - US Treasury Market and Global Relative Value
• Unconventional monetary policy has distorted the normal relationship between credit
quality and yield
• US Treasuries are currently offering higher interest rates than other lower rated
government bond markets Source: Bloomberg, as of September 13, 2016
-1.00
0.00
1.00
2.00
3.00
4.00
5.00
6.00
7.00
8.00
Feb-11 Feb-12 Feb-13 Feb-14 Feb-15 Feb-16
US 10y GER 10y ITA 10y JPY 10y
US 10yr
11
Past performance is not a guarantee of future results.

Yield advantage of US 10y requires FX risk for foreign investors
• The hedged yield advantage of 10yr US Treasuries to 10y JGBs declined to -6bp as of
August 31, 2016
• Increased hedging costs reduced the hedged yield advantage by 35-40bp from mid-
July
-1.00
-0.50
0.00
0.50
1.00
1.50
2.00
2.50
-0.50
0.00
0.50
1.00
1.50
2.00
2.50
3.00
3.50
4.00
Feb-11 Feb-12 Feb-13 Feb-14 Feb-15 Feb-16
10y US hedged yield, JPY (left) US 10y hedged yield advantage vs 10y JGB (right)
10y hedged yield advantage (right)
10y hedged yield (left)
Source: Bloomberg, as of September 13, 2016
JGB = Japan Government Bond Past performance is not a guarantee of future results. 12

Same is true for EUR investors…no advantage to buying 10y UST
and hedging FX risk
• 10y UST yields hedged back to EUR are comparable to yields on 10y bunds
Source: Bloomberg, as of September 13, 2016
Bunds = German government bonds
-1.50
-1.00
-0.50
0.00
0.50
1.00
1.50
2.00
-1.00
0.00
1.00
2.00
3.00
4.00
5.00
Feb-11 Feb-12 Feb-13 Feb-14 Feb-15 Feb-16
10y US hedged yield, EUR (left) 10y US hedge yield advantage vs 10y bund (right)
10y hedged yield advantage (right)
10y hedged yield (left)
13Past performance is not a guarantee of future results.
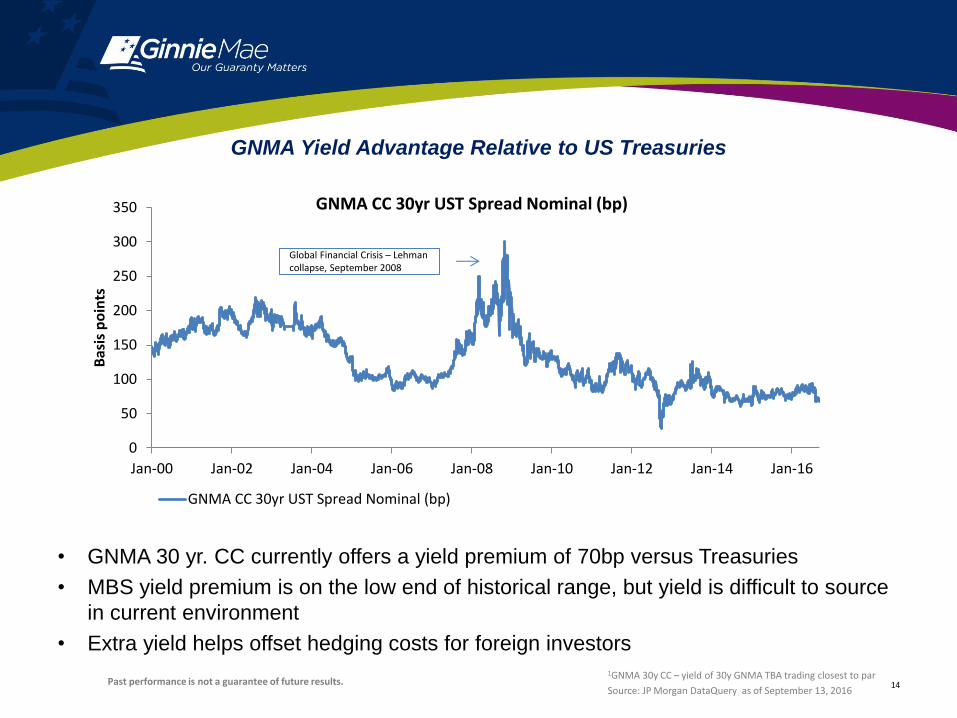
GNMA Yield Advantage Relative to US Treasuries
• GNMA 30 yr. CC currently offers a yield premium of 70bp versus Treasuries
• MBS yield premium is on the low end of historical range, but yield is difficult to source
in current environment
• Extra yield helps offset hedging costs for foreign investors
1GNMA 30y CC – yield of 30y GNMA TBA trading closest to par
Source: JP Morgan DataQuery as of September 13, 2016
0
50
100
150
200
250
300
350
Jan-00 Jan-02 Jan-04 Jan-06 Jan-08 Jan-10 Jan-12 Jan-14 Jan-16
Bas
is p
oin
ts
GNMA CC 30yr UST Spread Nominal (bp)
GNMA CC 30yr UST Spread Nominal (bp)
Global Financial Crisis – Lehman collapse, September 2008
Past performance is not a guarantee of future results. 14
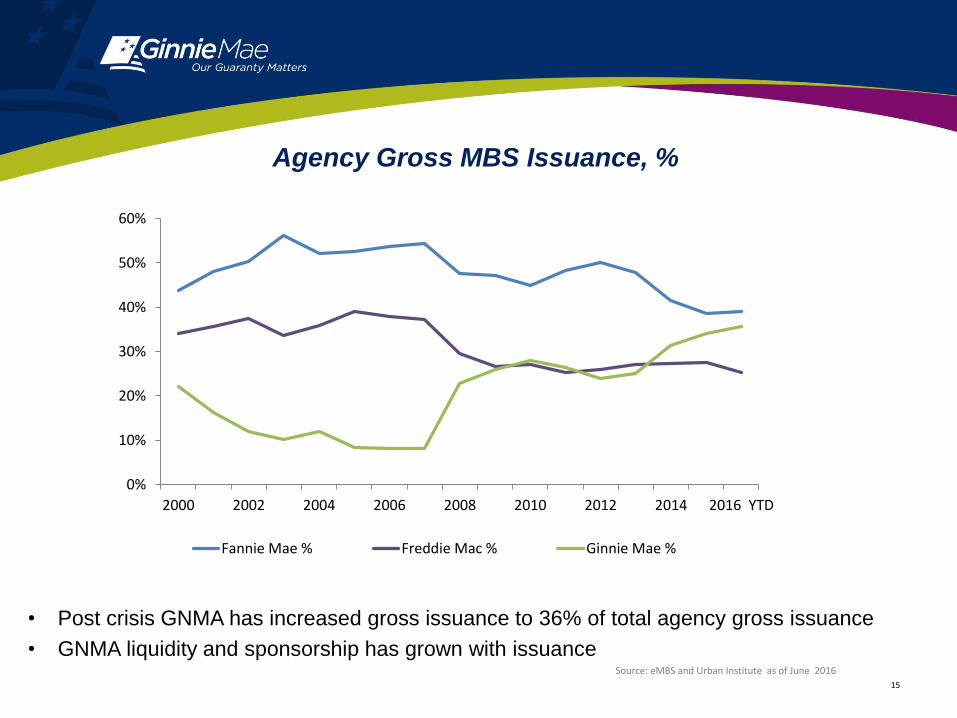
• Post crisis GNMA has increased gross issuance to 36% of total agency gross issuance
• GNMA liquidity and sponsorship has grown with issuance Source: eMBS and Urban Institute as of June 2016
0%
10%
20%
30%
40%
50%
60%
2000 2002 2004 2006 2008 2010 2012 2014 2016 YTD
Fannie Mae % Freddie Mac % Ginnie Mae %
Agency Gross MBS Issuance, %
15

GNMA vs 30y US Treasury – Similar Yield Less Duration Risk
• GNMA II 3.0% MBS offers comparable yield to a 30y US Treasury with 1/3 of the
interest rate risk (duration)Source: JP Morgan DataQuery, as of September 13, 2016, SSGA
0
0.5
1
1.5
2
2.5
3
3.5
4
4.5
0
5
10
15
20
25
Jan-12 Jan-13 Jan-14 Jan-15 Jan-16
yie
ld, %
du
rati
on
, yrs
GNMAII 30yr 3.0% Modified Duration 30 year UST Modified Duration
GNMAII 30yr 3.0% Yield 30 year UST Yield
Past performance is not a guarantee of future results. 16

Risk Adjusted Global Relative Value
• Attractive duration adjusted yield relative to alternatives in the investment grade fixed income
markets
• Similar yields to US corporates with 2-3yrs less duration risk
• Only US and Pan-Euro high yield offer better yield per unit of duration, but with significantly higher
credit risk
Barc US High Yield
Yield Per Unit of Duration (risk)
Past performance is not a guarantee of future results.
Source: Bloomberg, Barclays, JP Morgan DataQuery, SSGA as of August 31, 2016
Index descriptions are detailed in Appendix 17

GNMA MBS Provide Attractive Risk Adjusted Returns
• GNMA MBS consistently provide attractive risk adjusted returns
Duration
Sharpe Ratio
US MBS Ginnie Mae
US Treasury US Credit CorpPan Euro Credit
CorpUS High Yield
Pan Euro High Yield*
1 year 0.88 0.55 0.59 0.19 0.06 0.04
3 year 0.47 0.32 0.40 0.47 0.20 0.38
5 year 0.36 0.30 0.35 0.41 0.25 0.30
10 year 0.44 0.28 0.26 0.21 0.19 0.18
*Assumes 2% capitalization max per issuer on high yield indices Sources: Barclays Indices, Bloomberg and State Street Global Advisors, as of August 2016
Past performance is not a guarantee of future results. 18

GNMA Provides Hedged Yield Premium
• GNMA MBS provides 55-70bp hedged yield advantage versus JGBs for JPY investors
• GNMA MBS more attractive asset than US Treasuries for hedged JPY investors
Source: SSGA, Bloomberg, as of September 13, 2016
JGB – Japan Government Bond
0.00
0.50
1.00
1.50
2.00
2.50
3.00
0.00
0.50
1.00
1.50
2.00
2.50
3.00
Jun-14 Sep-14 Dec-14 Mar-15 Jun-15 Sep-15 Dec-15 Mar-16 Jun-16
G2SF CC yield & nominal spread, JPY
G2SF CC yield, JPY (left) G2SF CC yield nominal spread vs JGB 5/10 blend (50%/50%) (right)
19Past performance is not a guarantee of future results.

GNMA Provides Hedged Yield Premium
Source: Bloomberg, as of September 13, 1016
Bunds – German government bonds
0.00
0.50
1.00
1.50
2.00
2.50
0.00
0.50
1.00
1.50
2.00
2.50
3.00
3.50
Jun-14 Sep-14 Dec-14 Mar-15 Jun-15 Sep-15 Dec-15 Mar-16 Jun-16
G2SF CC yield & nominal spread, EUR
G2SF CC yield, EUR (left) G2SF CC yield nominal spread vs GER 5/10 blend (50%/50%) (right)
• GNMA MBS provides 70-80bp hedged yield advantage versus Bunds for EUR
investors
• Negative rates in the Eurozone and better hedged yield differentials versus bunds
than US Treasuries could lead to increased sponsorship of GNMA MBS from
European investors20
Past performance is not a guarantee of future results.

GNMA Euro-Hedged Yield Comparable to Italy (Baa2)*
• European Credit vs US MBS : For EUR investors - 20bp yield give up for full faith and credit
backing of the US government compared to Italian government bonds rated Baa2
Source: Bloomberg, as of September 13, 2016, SSGA *Moody’s Rating
-6.00
-5.00
-4.00
-3.00
-2.00
-1.00
0.00
1.00
2.00
May-11 May-12 May-13 May-14 May-15 May-16
GNSF 30y CC hedged yield advantage vs ITA 5y/10y blend
21Past performance is not a guarantee of future results.
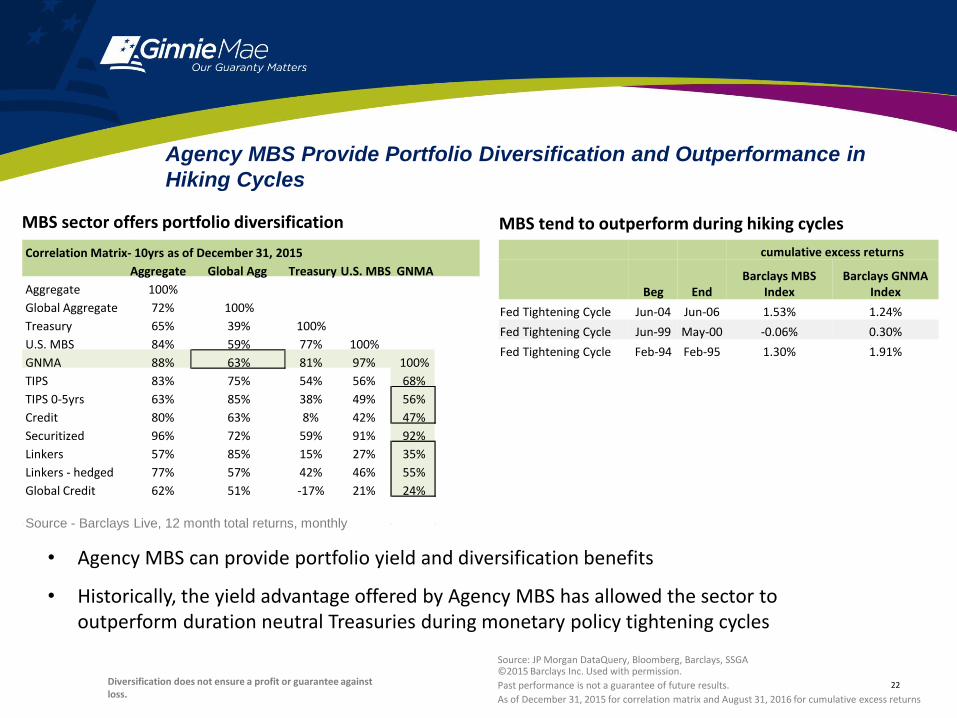
Agency MBS Provide Portfolio Diversification and Outperformance in
Hiking Cycles
MBS sector offers portfolio diversification MBS tend to outperform during hiking cycles
• Agency MBS can provide portfolio yield and diversification benefits
• Historically, the yield advantage offered by Agency MBS has allowed the sector to outperform duration neutral Treasuries during monetary policy tightening cycles
Source: JP Morgan DataQuery, Bloomberg, Barclays, SSGA ©2015 Barclays Inc. Used with permission.
Past performance is not a guarantee of future results.
As of December 31, 2015 for correlation matrix and August 31, 2016 for cumulative excess returns
Correlation Matrix- 10yrs as of December 31, 2015
Treasury U.S. MBS GNMA
100%
77% 100%
Aggregate Global Agg
Aggregate 100%
Global Aggregate 72% 100%
Treasury 65% 39%
U.S. MBS 84% 59%
GNMA 88% 63%
TIPS 83% 75%
TIPS 0-5yrs 63% 85%
Credit 80% 63%
Securitized 96% 72%
Linkers 57% 85%
Linkers - hedged 77% 57%
Global Credit 62% 51%
81% 97% 100%
54% 56% 68%
38% 49%
8% 42%
59% 91%
15% 27%
42% 46%
-17% 21%
Source - Barclays Live, 12 month total returns, monthly
56%
47%
92%
35%
55%
24%
cumulative excess returns
Beg End Barclays MBS Barclays GNMA
Index Index
Fed Tightening Cycle Jun-04 Jun-06 1.53% 1.24%
Fed Tightening Cycle Jun-99 May-00 -0.06% 0.30%
Fed Tightening Cycle Feb-94 Feb-95 1.30% 1.91%
Diversification does not ensure a profit or guarantee againstloss.
22
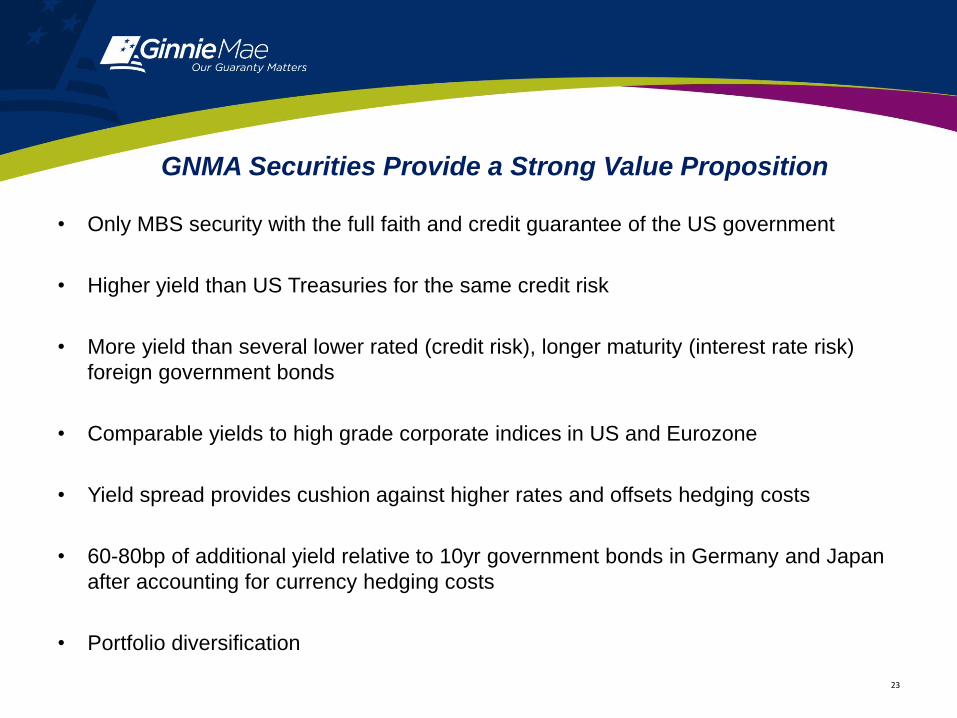
GNMA Securities Provide a Strong Value Proposition
• Only MBS security with the full faith and credit guarantee of the US government
• Higher yield than US Treasuries for the same credit risk
• More yield than several lower rated (credit risk), longer maturity (interest rate risk)
foreign government bonds
• Comparable yields to high grade corporate indices in US and Eurozone
• Yield spread provides cushion against higher rates and offsets hedging costs
• 60-80bp of additional yield relative to 10yr government bonds in Germany and Japan
after accounting for currency hedging costs
• Portfolio diversification
23

Appendix: Notes & Disclosures

Index Descriptions
Barclays US MBS Fixed-Rate Index: The Barclays US MBS Fixed-Rate Index is a sub-set of The Barclays US Mortgage Backed Securities (MBS) Index, filtered to exclude hybrids. Hybrids are 0.65% of the MBS Index; Fixed Rate MBS are 99.35% of the MBS Index. The Barclays US Mortgage Backed Securities (MBS) Index tracks agency mortgage backed pass-through securities (both fixed-rate and hybrid ARM) guaranteed by Ginnie Mae (GNMA), Fannie Mae (FNMA), and Freddie Mac (FHLMC). The index is constructed by grouping individual TBA-deliverable MBS pools into aggregates or generics based on program, coupon and vintage. Introduced in 1985, the GNMA, FHLMC and FNMA fixed-rate indices for 30- and 15-year securities were backdated to January 1976, May 1977, and November 1982, respectively. In April 2007, agency hybrid adjustable-rate mortgage (ARM) pass-through securities were added to the index.
Barclays Global Aggregate Index: The Barclays Global Aggregate Index is a flagship measure of global investment grade debt from twenty-four local currency markets. This multi-currency benchmark includes treasury, government-related, corporate and securitized fixed-rate bonds from both developed and emerging markets issuers. A component of the Multiverse Index, the Global Aggregate Index was created in 2000, with index history backfilled to January 1, 1990.
Barclays US Aggregate Index: The Barclays US Aggregate Bond Index is a broad-based flagship benchmark that measures the investment grade, US dollar-denominated, fixed-rate taxable bond market. The index includes Treasuries, government-related and corporate securities, MBS (agency fixed-rate and hybrid ARM pass-throughs), ABS and CMBS (agency and non-agency). Provided the necessary inclusion rules are met, US Aggregate-eligible securities also contribute to the multi-currency Global Aggregate Index and the US Universal Index, which includes high yield and emerging markets debt. The US Aggregate Index was created in 1986 with history backfilled to January 1, 1976.
Barclays Pan-Euro High Yield Index: The Barclays Pan-European High Yield Index measures the market of non-investment grade, fixed-rate corporate bonds denominated in the following currencies: euro, pounds sterling, Danish krone, Norwegian krone, Swedish krona, and Swiss franc. Inclusion is based on the currency of issue, and not the domicile of the issuer. The index excludes emerging market debt. It was created in 1999 and is part of the Global High Yield Index.
Barclays US High Yield Index: The Barclays US Corporate High Yield Bond Index measures the USD-denominated, high yield, fixed-rate corporate bond market. Securities are classified as high yield if the middle rating of Moody’s, Fitch and S&P is Ba1/BB+/BB+ or below. Bonds from issuers with an emerging markets country of risk, based on Barclays EM country definition, are excluded. The US Corporate High Yield Index is a component of the US Universal and Global High Yield Indices. The index was created in 1986, with history backfilled to July 1, 1983.
Barclays Euro Corp Index: The Barclays Euro Corporate Bond Index is a broad-based benchmark that measures the investment grade, euro-denominated, fixed-rate corporate bond market. Inclusion is based on the currency denomination of a bond and not the country of risk of the issuer. The Euro Corporate Index is a subset of Barclays broader-based flagship indices, such as the Euro Aggregate and the multi-currency Global Aggregate Index. The Euro Corporate Index was launched on 1 June 1998.
Barclays US Corp Index: The Barclays US Corporate Bond Index measures the investment grade, fixed-rate, taxable corporate bond market. It includes USD-denominated securities publicly issued by US and non-US industrial, utility and financial issuers. The US Corporate Index is a component of the US Credit and US Aggregate Indices, and provided the necessary inclusion rules are met, US Corporate Index securities also contribute to the multi-currency Global Aggregate Index. The index was launched in July 1973, with index history backfilled to January 1, 1973.
Barclays US Corp A or Better Index: The Barclays US Corp A or Better index is a sub-set of The Barclays US Corporate Bond Index, filtered to include only A or better ratings. 25

Ginnie Mae Contacts and Links
EMAIL CONNECTIONS Ted Tozer, President [email protected]
OFFICE OF CAPITAL John Getchis, Senior Vice President [email protected]
MARKETS Alven Lam, Director of International Markets [email protected]
Shalei Choi, Director of Transactions Management [email protected]
Dan Kahn, Director of Investor Inquires [email protected]
WEBSITE http://www.ginniemae.gov/
LINKS Monthly MBS Issuance Reports
http://ginniemae.gov/media_center/Pages/monthly_issuance_reports.aspx
Monthly Unpaid Principal Balance Reports
http://ginniemae.gov/media_center/Pages/monthly_rpb_reports.aspx
Monthly Remic Summary
http://ginniemae.gov/media_center/Pages/monthly_rpb_reports.aspx
26

CONTACT INFORMATION
Physical Address
550 12th Street, SW, Third Floor
Washington, DC 20024
Mailing Address
451 7th Street, SW, Room B-133
Washington, DC 20410
Phone: 202-708-1535
Hotline: 888-446-6434
@GinnieMaeGov
/ginniemae.gov 27

Capital Markets Panel Discussion
Scott E. BuchtaHead of Fixed Income Strategy – Brean Capital, LLC
September 19, 2016

This report was compiled by sales and/or trading personnel and does not constitute investment research. Please reference full disclaimer on the final page. 2
Mortgage and Housing Market Fundamentals
The GNMA Marketplace
Housing Finance Authorities
Investor Wish List
Table of Contents
This report was compiled by sales and/or trading personnel and does not constitute investment research. Please reference full disclaimer on the final page. 3
Market Fundamentals

This report was compiled by sales and/or trading personnel and does not constitute investment research. Please reference full disclaimer on the final page. 4
Home Prices – Steady Growth

This report was compiled by sales and/or trading personnel and does not constitute investment research. Please reference full disclaimer on the final page. 5
Housing – New vs. Existing Home Sales
New Home Sales Existing Home Sales

This report was compiled by sales and/or trading personnel and does not constitute investment research. Please reference full disclaimer on the final page. 6
10yr Treasury
This report was compiled by sales and/or trading personnel and does not constitute investment research. Please reference full disclaimer on the final page. 7
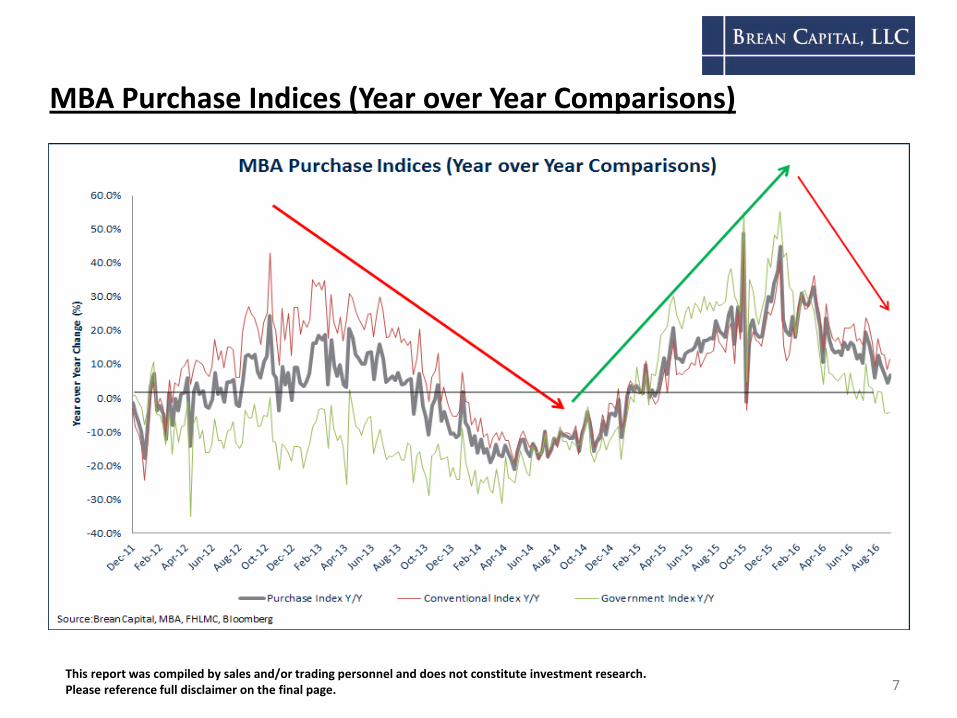
MBA Purchase Indices (Year over Year Comparisons)

This report was compiled by sales and/or trading personnel and does not constitute investment research. Please reference full disclaimer on the final page. 8
30yr Mortgage Rates

This report was compiled by sales and/or trading personnel and does not constitute investment research. Please reference full disclaimer on the final page. 9
The GNMA Marketplace

This report was compiled by sales and/or trading personnel and does not constitute investment research. Please reference full disclaimer on the final page. 10
GNMA – Market Overview
Supply
• Refinancing Activity Remains Robust
Will be Very Sensitive to +/-25bp Moves in Rates
• Purchase Activity Aided by the return of First Time Home Buyers
Demand
• Fed
• Banks
• Asia (Japan)
• Government Bond Funds
Shorter Duration Products

This report was compiled by sales and/or trading personnel and does not constitute investment research. Please reference full disclaimer on the final page. 11
Coupon Stack and G2/FN Swaps
This report was compiled by sales and/or trading personnel and does not constitute investment research. Please reference full disclaimer on the final page. 12
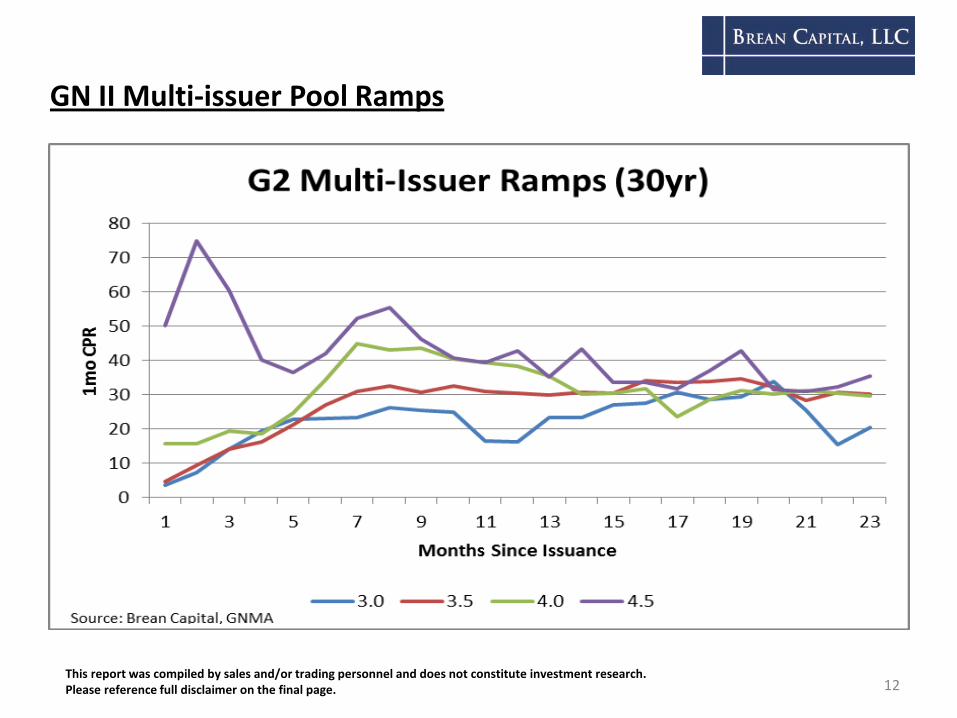
GN II Multi-issuer Pool Ramps

This report was compiled by sales and/or trading personnel and does not constitute investment research. Please reference full disclaimer on the final page. 13
G2 / FN Swaps – Historical Spreads

This report was compiled by sales and/or trading personnel and does not constitute investment research. Please reference full disclaimer on the final page. 14
GNMA – Pool Issuance

This report was compiled by sales and/or trading personnel and does not constitute investment research. Please reference full disclaimer on the final page. 15
GNMA – CMO Issuance

This report was compiled by sales and/or trading personnel and does not constitute investment research. Please reference full disclaimer on the final page. 16
What the Fed Owns in GNMA MBS

This report was compiled by sales and/or trading personnel and does not constitute investment research. Please reference full disclaimer on the final page. 17
GNMA WAC Drift
This report was compiled by sales and/or trading personnel and does not constitute investment research. Please reference full disclaimer on the final page. 18
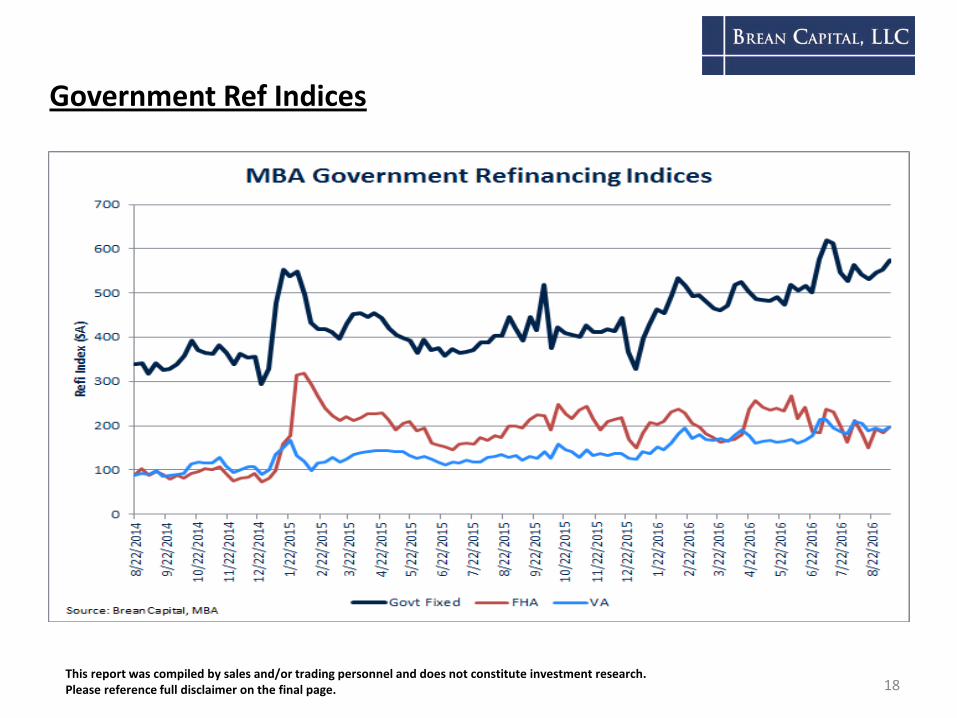
Government Ref Indices

This report was compiled by sales and/or trading personnel and does not constitute investment research. Please reference full disclaimer on the final page. 19
Specified Pool Pay-ups

This report was compiled by sales and/or trading personnel and does not constitute investment research. Please reference full disclaimer on the final page. 20
Housing Finance Authorities
This report was compiled by sales and/or trading personnel and does not constitute investment research. Please reference full disclaimer on the final page. 21
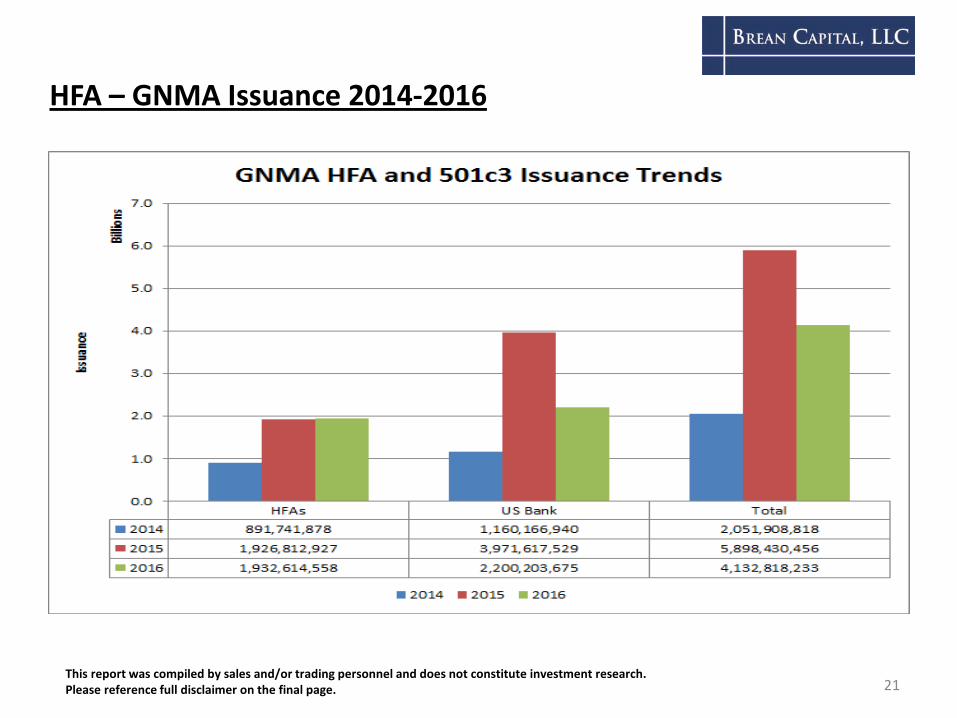
HFA – GNMA Issuance 2014-2016
This report was compiled by sales and/or trading personnel and does not constitute investment research. Please reference full disclaimer on the final page. 22
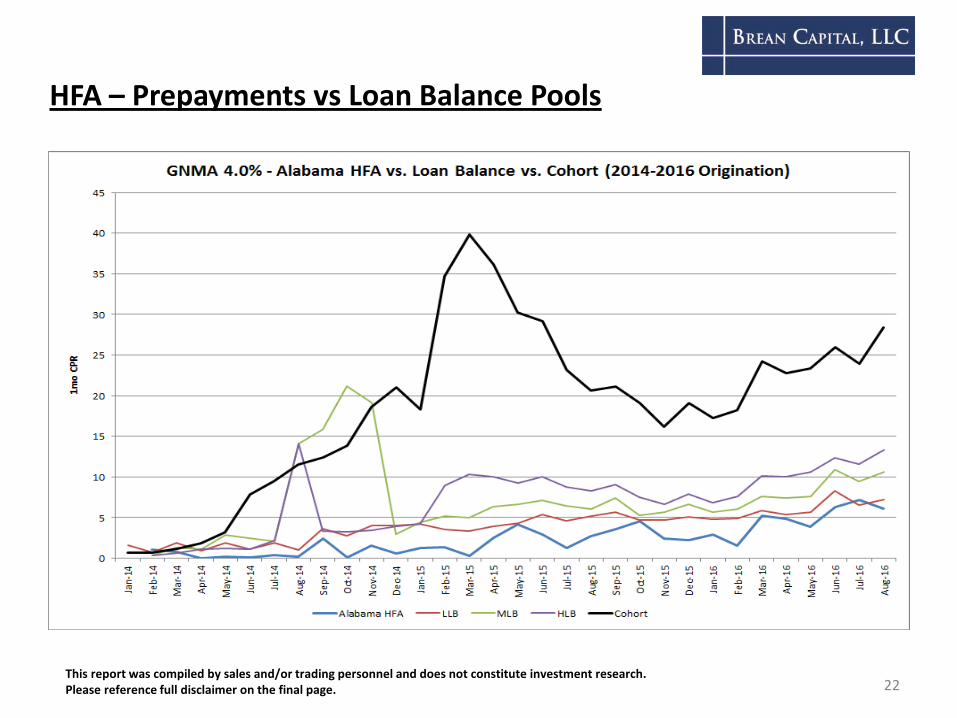
HFA – Prepayments vs Loan Balance Pools

This report was compiled by sales and/or trading personnel and does not constitute investment research. Please reference full disclaimer on the final page. 23
HFA – Relative Value Considerations
• Down Payment Assistance - Grants vs. Second Liens
• Second Lien Forgiveness
• Re-subordination
• HPA / Turnover

This report was compiled by sales and/or trading personnel and does not constitute investment research. Please reference full disclaimer on the final page. 24
Investor Concerns

This report was compiled by sales and/or trading personnel and does not constitute investment research. Please reference full disclaimer on the final page. 25
Investor Wish List
• Liquidity• GN I / GN II• Deliverability• HECM CMO Re-REMICs
• Reporting• Loan Level Data
• Rules and Regulations• MIP• HECM
• Servicer Behavior• Refinancing• Buy-outs
Please reference full disclaimer on the final page.This report was compiled by sales and/or trading personnel and does not constitute investment research.
Disclaimer
This report has been prepared and issued by the Market Strategy Group of Brean Capital, LLC. It was not prepared by the Firm’s research department and, as such, should not be viewed as impartial. Investors should be aware that the Firm may have a conflict of interest that could affect the objectivity of this report. The author of this report may have discussed the information contained herein with others within or outside the Firm who may have already acted on the basis of this information (including by trading for the Firm’s account or communicating the information contained herein to other customers of the Firm). We act as principal in transactions with you, and accordingly, you must determine the appropriateness of such transactions or investment strategy and address any legal, tax or accounting considerations applicable to you. Certain transactions, including those involving derivatives, asset-backed and high-yield securities, give rise to substantial risk and are not suitable for all investors. Brean Capital, LLC cannot, nor does not, make any claim as to the prepayment consistency and/or the future performance of any securities or structures mentioned in this report. Any yields, yield spreads and/or average lives mentioned in this report consider prepayment assumptions that may or may not be met. Changes in payments may significantly affect yield and average life. The information contained in this report was obtained from various sources that we believe to be reliable, but we do not guarantee its accuracy or completeness. Email transmission cannot be guaranteed to be secure or error free.
26
This report has been prepared and circulated for general information only and presents the authors’ views of general market and economic conditions and specific industries and/or sectors. This report is not intended to and does not provide a recommendation with respect to any security. The information and opinions contained in this report speak only as of the date of this report and are subject to change without notice. Any prices provided in this report (other than those identified as historical) are indicative only and do not represent firm quotes as to price and size. Investors are cautioned that statements regarding future prospects may not be realized and that past performance is not indicative of future results. This report does not constitute an offer, or a solicitation of an offer, to buy or sell any securities or other financial instruments, including any securities mentioned in this report. Nothing in this report constitutes or should be construed to be accounting, tax, investment or legal advice. Additional information regarding the contents of this report is available upon request.
Brean Capital, LLC is a registered U.S. Broker Dealer, member of SIPC, FINRA and licensed with various state securities regulatory authorities.
All rights reserved by Brean Capital LLC. Any unauthorized use, duplication or redistribution by any person for any purpose is strictly prohibited without the consent of Brean Capital, LLC. Receipt and review of this document constitutes your agreement to abide by the restriction specified in this paragraph.

Today at the “Mae”John Getchis, Senior Vice President, Office of Capital Markets, Ginnie Mae

2
Ginnie Mae’s Historic Growth1968-2016
An
nu
al
MB
S O
uts
tan
din
g
Trillions
of U.S.
Dollars
Source: Office of Capital Markets
$0.0
$0.2
$0.4
$0.6
$0.8
$1.0
$1.2
$1.4
$1.6
$1.8
1996-1997
Ginnie Mae reaches
$500 billion mark
2009-2010
Ginnie Mae reaches
$1 trillion mark
2016
Ginnie Mae reaches
$1.7 trillion mark
Source: Office of Capital Markets

3
16
Sources: Fannie Mae and Freddie Mac monthly reports; Ginnie Mae data includes HECMs
-
*Data for Fannie and Freddie are available through July 2016. Data for Ginnie Mae is available through July 2016.
Agency MBS Outstanding in Billions*
Ginnie Mae MBS Outstanding Volume Continues to Grow
Jul
July 2016: $2,851B
July 2016: $1,793B

0%
25%
50%
75%
100%
$-
$300
$600
$900
$1,200
$1,500
$1,800
Dec-09 Dec-10 Dec-11 Dec-12 Dec-13 Dec-14 Dec-15
Depository RPB Non-Depository RPB Percent Depository
The Percentage of Outstanding Single Family MBS Serviced by Non-Depositories has Grown Substantially from Dec 2009 to July 2016
Jul-16
UP
B (
$B
)P
erce
nt D
ep
osito
ry
UPB UPB

0%
25%
50%
75%
100%
$-
$300
$600
$900
$1,200
Dec-09 Dec-10 Dec-11 Dec-12 Dec-13 Dec-14 Dec-15
Depository RPB Non-Depository RPB Percent Depository
This Shift Toward Non-Depositories is Similar for the FHA Portion of the Single Family MBS Portfolio
UP
B (
$B
)P
erce
nt D
ep
osito
ry
Jul-16
UPB UPB

-40%
-20%
0%
20%
40%
60%
80%
100%
200912 201012 201112 201212 201312 201412 201512 201607
Total Single Family Program
Non Depository Depository
Non-Depositories Outpace Depositories in Year-Over-Year UPB Growth for Past Six Years
-40%
-20%
0%
20%
40%
60%
80%
100%
200912 201012 201112 201212 201312 201412 201512 201607
FHA Portion of Single Family Program
Non Depository Depository
* *
* Growth figures are for each calendar year; 2016 figure is through July 2016.

7
Comparing Purchase and Refinance Issuance Dollars
Source: embs.com
$0
$5
$10
$15
$20
$25
$30
Au
g-1
3
Sep
-13
Oct
-13
No
v-1
3
De
c-1
3
Jan
-14
Feb
-14
Mar
-14
Ap
r-1
4
May
-14
Jun
-14
Jul-
14
Au
g-1
4
Sep
-14
Oct
-14
No
v-1
4
De
c-1
4
Jan
-15
Feb
-15
Mar
-15
Ap
r-1
5
May
-15
Jun
-15
Jul-
15
Au
g-1
5
Sep
-15
Oct
-15
No
v-1
5
De
c-1
5
Jan
-16
Feb
-16
Mar
-16
Ap
r-1
6
May
-16
Jun
-16
Jul-
16
Au
g-1
6
Bill
ion
s
Purchase Refinance
Ginnie Mae
$0
$10
$20
$30
$40
$50
$60
Au
g-1
3
Oct
-13
De
c-1
3
Feb
-14
Ap
r-1
4
Jun
-14
Au
g-1
4
Oct
-14
De
c-1
4
Feb
-15
Ap
r-1
5
Jun
-15
Au
g-1
5
Oct
-15
De
c-1
5
Feb
-16
Ap
r-1
6
Jun
-16
Au
g-1
6
Bill
ion
s
Fannie Mae
$0
$5
$10
$15
$20
$25
$30
$35
$40
Au
g-1
3
Oct
-13
De
c-1
3
Feb
-14
Ap
r-1
4
Jun
-14
Au
g-1
4
Oct
-14
De
c-1
4
Feb
-15
Ap
r-1
5
Jun
-15
Au
g-1
5
Oct
-15
De
c-1
5
Feb
-16
Ap
r-1
6
Jun
-16
Au
g-1
6
Bill
ion
s
Freddie Mac

8
Issue Amount for Insuring Agencies of Ginnie Mae Securities
Source: embs.com
$0
$5,000,000,000
$10,000,000,000
$15,000,000,000
$20,000,000,000
$25,000,000,000
$30,000,000,000
Au
g-1
1
Oct
-11
De
c-1
1
Feb
-12
Ap
r-1
2
Jun
-12
Au
g-1
2
Oct
-12
De
c-1
2
Feb
-13
Ap
r-1
3
Jun
-13
Au
g-1
3
Oct
-13
De
c-1
3
Feb
-14
Ap
r-1
4
Jun
-14
Au
g-1
4
Oct
-14
De
c-1
4
Feb
-15
Ap
r-1
5
Jun
-15
Au
g-1
5
Oct
-15
De
c-1
5
Feb
-16
Ap
r-1
6
Jun
-16
Au
g-1
6
ISSU
E A
MO
UN
T
CONSTITUENT FIXED RATE ISSUE AMOUNT August 2011 - August 2016
GNMA FHA
GNMA VA
GNMA RHS
GNMA PIH

9
*30-Year and 20-Year MBS products include:
Fannie Mae: FNM30, FNM30HILTV, FNM30JM, FNM30INITIO, FNM30RELO, FNM30FHA, FNM30PPAYP, FNM20, FNM20HILTV
Freddie Mac: FHL30CONV, FHL30RELO, FHLG30INIOJM, FHL30FHA, FHL30, FHLG30MOD, FHLG30FHA, FHLG30RELO,
FHLG30PPAYP, FHLG30INITIO, FHLG30HILTV, FHLG30JM, FHLG30, FHLG20, FHLG20JM, FHL20HILTV, FHL20INITIO
Ginnie Mae: GNMII30M, GNM30, GNMII30C, GNMII30MJM, GNMIIBD, GNMIIFHASEC, GNMBD, GNM20, GNMII20M, GNMII20C
Revenues
($ Billions)
Ginnie Mae is Significant in SF Fixed
Rate MBS Issuance
$0
$10
$20
$30
$40
$50
$60
$70
$80
$90
De
c-1
1
Feb
-12
Ap
r-1
2
Jun
-12
Au
g-1
2
Oct
-12
De
c-1
2
Feb
-13
Ap
r-1
3
Jun
-13
Au
g-1
3
Oct
-13
De
c-1
3
Feb
-14
Ap
r-1
4
Jun
-14
Au
g-1
4
Oct
-14
De
c-1
4
Feb
-15
Ap
r-1
5
Jun
-15
Au
g-1
5
Oct
-15
De
c-1
5
Feb
-16
Ap
r-1
6
Jun
-16
Au
g-1
6
MB
S G
RO
SS
IS
SU
AN
CE
VA
LU
E
30-YEAR AND 20-YEAR FIXED RATE SINGLE-FAMILY MBS MARKETSHARE*
Ginnie Mae
Fannie Mae
Freddie Mac
10
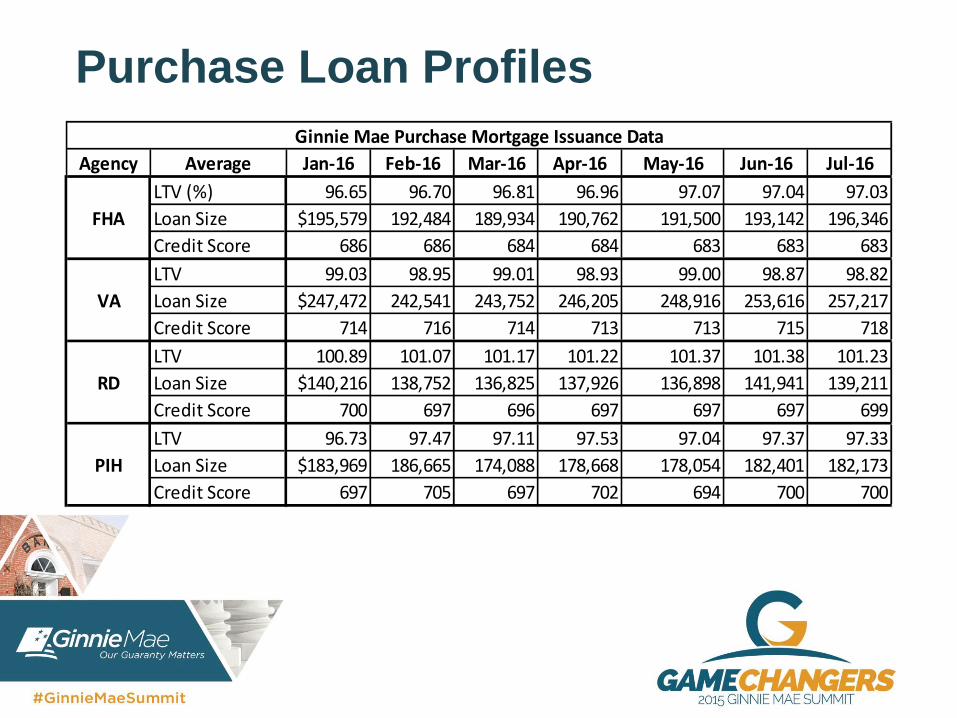
Purchase Loan Profiles
Agency Average Jan-16 Feb-16 Mar-16 Apr-16 May-16 Jun-16 Jul-16
LTV (%) 96.65 96.70 96.81 96.96 97.07 97.04 97.03
Loan Size $195,579 192,484 189,934 190,762 191,500 193,142 196,346
Credit Score 686 686 684 684 683 683 683
LTV 99.03 98.95 99.01 98.93 99.00 98.87 98.82
Loan Size $247,472 242,541 243,752 246,205 248,916 253,616 257,217
Credit Score 714 716 714 713 713 715 718
LTV 100.89 101.07 101.17 101.22 101.37 101.38 101.23
Loan Size $140,216 138,752 136,825 137,926 136,898 141,941 139,211
Credit Score 700 697 696 697 697 697 699
LTV 96.73 97.47 97.11 97.53 97.04 97.37 97.33
Loan Size $183,969 186,665 174,088 178,668 178,054 182,401 182,173
Credit Score 697 705 697 702 694 700 700
Ginnie Mae Purchase Mortgage Issuance Data
FHA
VA
RD
PIH

Component Purchase Volume
$0
$2
$4
$6
$8
$10
$12
$14
$16
$18
201601 201602 201603 201604 201605 201606 201607
Bill
ion
s
FHA
PIH
RD
VA

12
Purchase Volume Growth –Top Issuers
Jan 16 Purchases = $22.0 BillionJuly 16 Purchases = $30.1 Billion
$-
$500,000,000
$1,000,000,000
$1,500,000,000
$2,000,000,000
July vs. January 2016 Increases in Purchase Amounts by Issuer

Top 20 States Purchase from January-July 2016
Total Jan-July PurchaseVolume = $155 Billion
-
5,000
10,000
15,000
20,000
25,000
30,000
35,000
40,000
45,000
CA TX FL VA GA MD WA CO AZ NC NY PA NJ IL OH TN MI NV SC IN
In $
Mill
ion
s
January - July 2016 (7 months) $ Volume Cumulative Purchases

14
• Alignment of interest: issuer → credit risk insurer → Ginnie Mae
• Functioning TBA Market
• Transparency: constantly improving disclosure with securities & loans
• Combination provides:• comfort to value securities
• scale for liquidity to attract capital globally
Critical Operating Principles