gis aided erosion risk analyses on the vodno mountain awaraness/presentation… · implement these...
TRANSCRIPT
Faculty of forestry Faculty of forestry –– Skopje, Institute of forestry,Skopje, Institute of forestry,bulbul ..”” AlexandarAlexandar MakedonskiMakedonski ““ bb. 1000 Skopje, bb. 1000 Skopje,
phone: +389 2 3135 033phone: +389 2 3135 033EE--mail: [email protected] mail: [email protected] [email protected][email protected]
Web site: http://Web site: http:// www.sf.ukim.edu.mkwww.sf.ukim.edu.mk
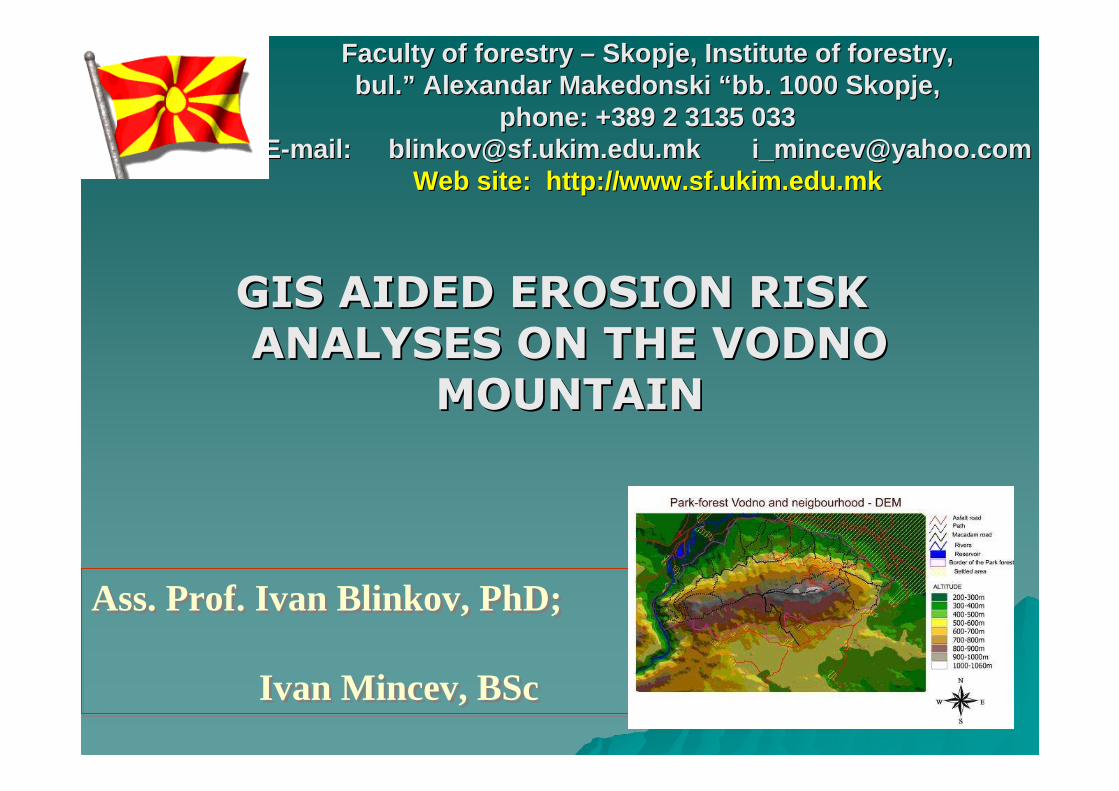
GIS AIDED EROSION RISK GIS AIDED EROSION RISK
ANALYSES ON THE VODNO ANALYSES ON THE VODNO
MOUNTAINMOUNTAIN
Ass. Prof. Ivan Blinkov, PhD;
Ivan Mincev, BSc
Ass. Prof. Ivan Blinkov, PhD;
Ivan Mincev, BSc
BackgroundBackground
�� Erosion processes >>> damages:Erosion processes >>> damages:
-- On site On site ––
soil losses; soil losses;
water loss, water loss,
landscape deteriorationlandscape deterioration
-- Off site Off site ––
torrential flash floods >> damages on houses torrential flash floods >> damages on houses
and infrastructure, and infrastructure,
filling up reservoirs, filling up reservoirs,
mechanical and chemical pollution of the watermechanical and chemical pollution of the water
��RiskRisk is a is a conceptconcept that denotes a potential that denotes a potential negative impact to an negative impact to an assetasset or some or some characteristic of characteristic of valuevalue that may arise from some that may arise from some present present processprocess or future or future eventevent. .
�� In everyday usage, In everyday usage, riskrisk is often used is often used synonymously with the synonymously with the probabilityprobability of a known of a known loss. Usually, the probability of that event and loss. Usually, the probability of that event and some assessment of its expected harm must be some assessment of its expected harm must be combined into a believable combined into a believable scenarioscenario (an (an outcome), which combines the set of risk, regret outcome), which combines the set of risk, regret and reward probabilities into an and reward probabilities into an expected valueexpected valuefor that outcome.for that outcome.
�� Paradoxically, a probable loss can be uncertain Paradoxically, a probable loss can be uncertain and relative in an individual event while having a and relative in an individual event while having a certainty in the aggregate of multiple events. certainty in the aggregate of multiple events.

��Risk managementRisk management is the human is the human activity which integrates activity which integrates
�� riskrisk recognitionrecognition, ,
�� risk assessmentrisk assessment, ,
�� developing developing strategiesstrategies to manage it, to manage it,
�� mitigation of riskmitigation of risk using managerial using managerial resources.resources.
�� The strategies include transferring the risk to The strategies include transferring the risk to another party, avoiding the risk, reducing the another party, avoiding the risk, reducing the negative effect of the risk, and accepting negative effect of the risk, and accepting some or all of the consequences of a some or all of the consequences of a particular risk.particular risk.
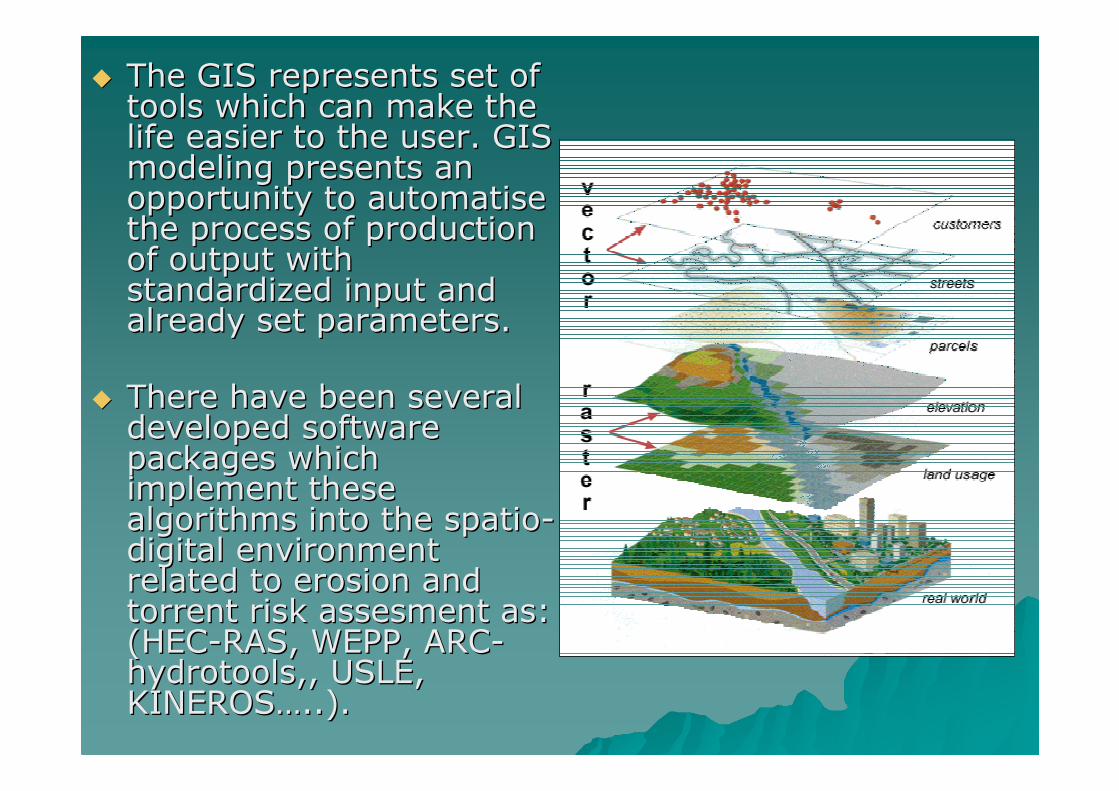
�� The GIS represents set of The GIS represents set of tools which can make the tools which can make the life easier to the user. GIS life easier to the user. GIS modeling presents an modeling presents an opportunity to opportunity to automatiseautomatisethe process of production the process of production of output with of output with standardized input and standardized input and already set parameters. already set parameters.
�� There have been several There have been several developed software developed software packages which packages which implement these implement these algorithms into the algorithms into the spatiospatio--digital environment digital environment related to erosion and related to erosion and torrent risk torrent risk assesmentassesment as: as: (HEC(HEC--RAS, WEPP, ARCRAS, WEPP, ARC--hydrotoolshydrotools,, USLE, ,, USLE, KINEROSKINEROS……..). ..).
AimsAims
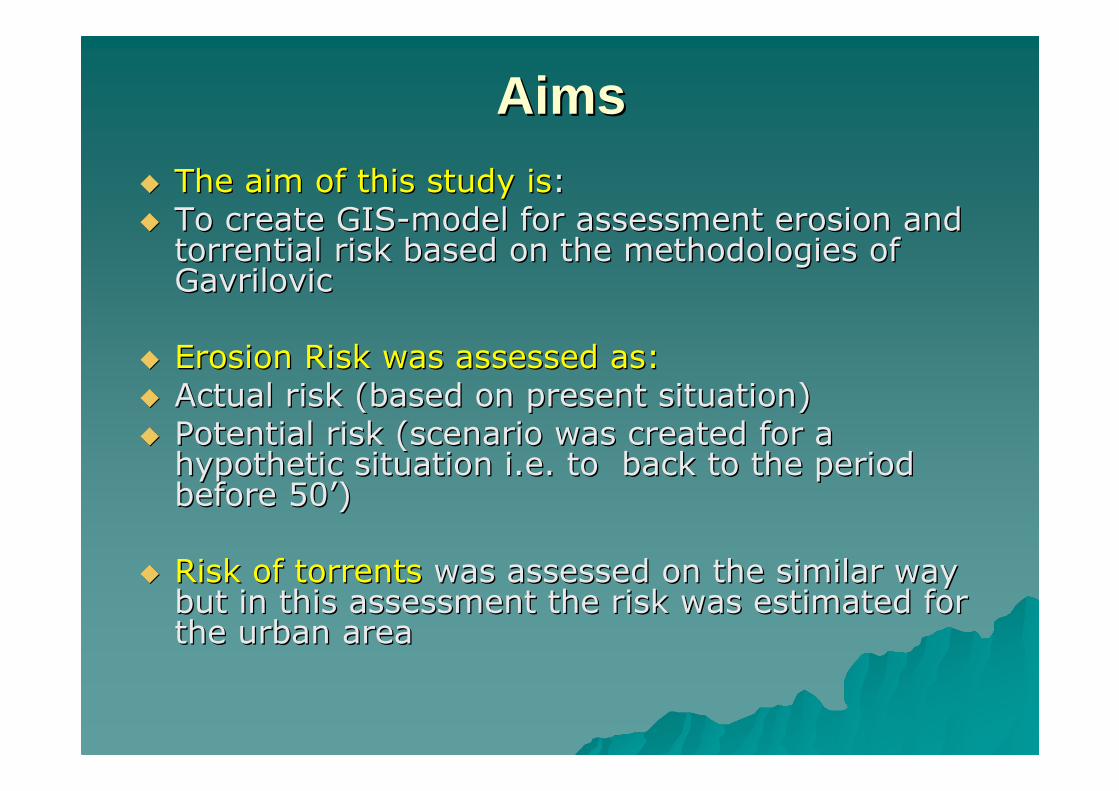
�� The aim of this study isThe aim of this study is::
�� To create GISTo create GIS--model for assessment erosion and model for assessment erosion and torrential risk based on the methodologies of torrential risk based on the methodologies of GavrilovicGavrilovic
�� Erosion Risk was assessed as:Erosion Risk was assessed as:
�� Actual risk (based on present situation)Actual risk (based on present situation)
�� Potential risk (scenario was created for a Potential risk (scenario was created for a hypothetic situation i.e. to back to the period hypothetic situation i.e. to back to the period before 50before 50’’) )
�� Risk of torrents Risk of torrents was assessed on the similar way was assessed on the similar way but in this assessment the risk was estimated for but in this assessment the risk was estimated for the urban area the urban area
�� The objectives of this study are:The objectives of this study are:
�� To recognize erosion and torrent riskTo recognize erosion and torrent risk
�� To create basic numerical and To create basic numerical and
graphical (GIS) datasetgraphical (GIS) dataset
�� To assess the on site erosion risk To assess the on site erosion risk
using GIS using GIS
�� To assess the torrential riskTo assess the torrential risk
MethodologyMethodology
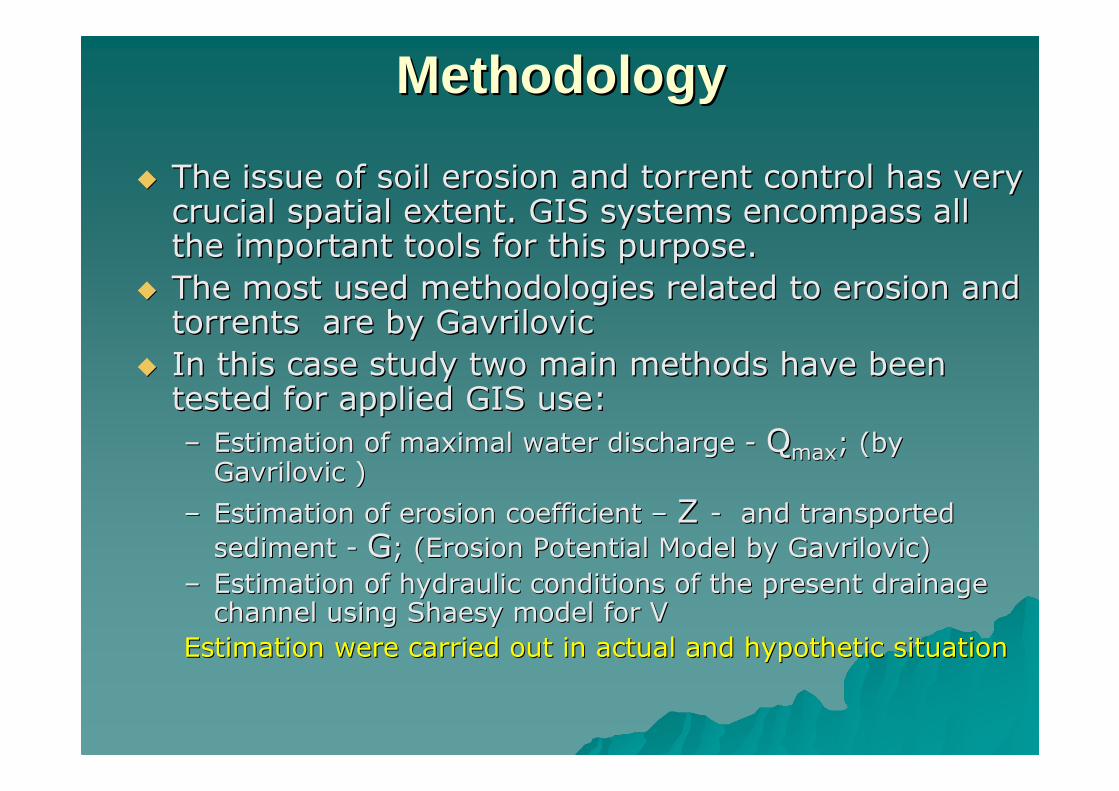
�� The issue of soil erosion and torrent control has very The issue of soil erosion and torrent control has very crucial spatial extent. GIS systems encompass all crucial spatial extent. GIS systems encompass all the important tools for this purpose. the important tools for this purpose.
�� The most used methodologies related to erosion and The most used methodologies related to erosion and torrents are by Gavrilovic torrents are by Gavrilovic
�� In this case study two main methods have been In this case study two main methods have been tested for applied GIS use:tested for applied GIS use:
–– Estimation of maximal water discharge Estimation of maximal water discharge -- QQmaxmax; (by ; (by Gavrilovic )Gavrilovic )
–– Estimation of erosion coefficient Estimation of erosion coefficient –– Z Z -- and transported and transported
sediment sediment -- GG; (Erosion Potential Model by Gavrilovic); (Erosion Potential Model by Gavrilovic)
–– Estimation of hydraulic conditions of the present drainage Estimation of hydraulic conditions of the present drainage channel using channel using ShaesyShaesy model for V model for V
Estimation were carried out in actual and hypothetic situationEstimation were carried out in actual and hypothetic situation
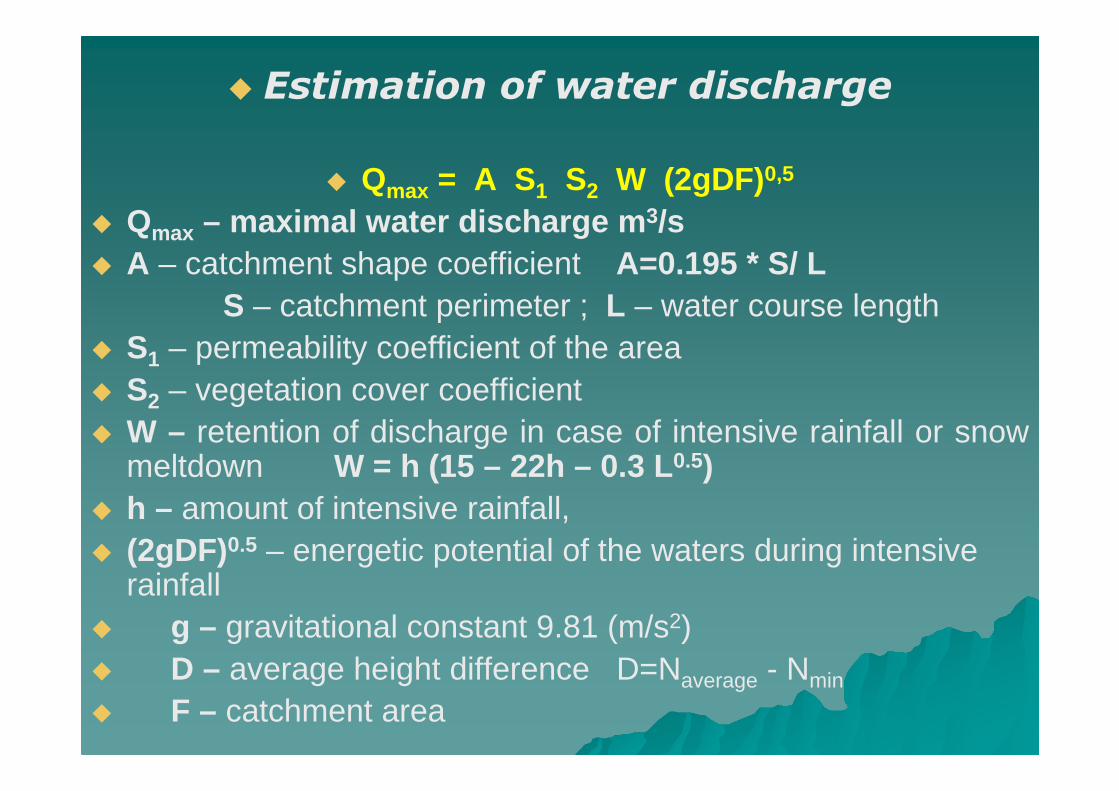
� Estimation of water discharge
� Qmax = A S1 S2 W (2gDF)0,5
� Qmax – maximal water discharge m 3/s� A – catchment shape coefficient A=0.195 * S/ L
S – catchment perimeter ; L – water course length� S1 – permeability coefficient of the area� S2 – vegetation cover coefficient� W – retention of discharge in case of intensive rainfall or snow
meltdown W = h (15 – 22h – 0.3 L 0.5)� h – amount of intensive rainfall, � (2gDF)0.5 – energetic potential of the waters during intensive
rainfall � g – gravitational constant 9.81 (m/s2) � D – average height difference D=Naverage - Nmin
� F – catchment area
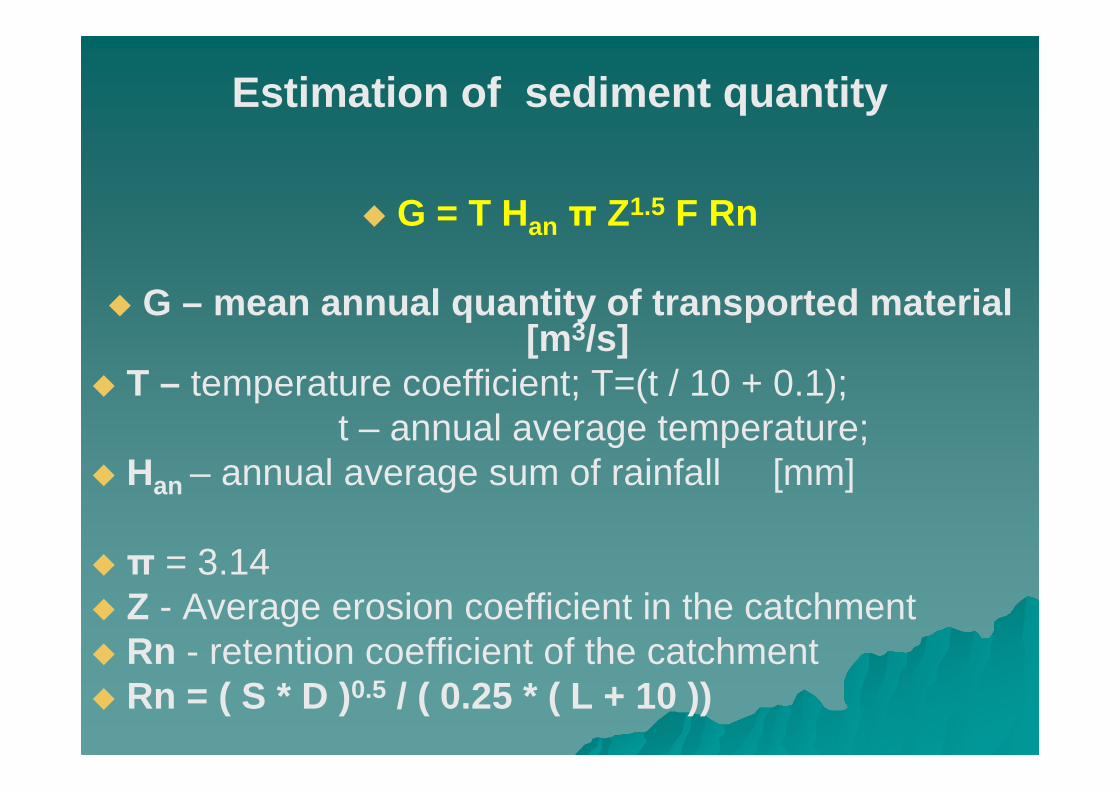
Estimation of sediment quantity
� G = T Han π Z1.5 F Rn
� G – mean annual quantity of transported material [m3/s]
� T – temperature coefficient; T=(t / 10 + 0.1); t – annual average temperature;
� Han – annual average sum of rainfall [mm]
� π = 3.14� Z - Average erosion coefficient in the catchment� Rn - retention coefficient of the catchment� Rn = ( S * D )0.5 / ( 0.25 * ( L + 10 ))

Estimation of channel hydraulic Estimation of channel hydraulic capacitiescapacities
�� Q = F * VQ = F * V
� F – cross profile area – m2
� V – mean water velocity m/s
�� V = K C (R J )^V = K C (R J )^0,5 0,5
� K – torrential coefficient� C – velocity coefficient by Basin� R – hydraulic radius R = F / O � J – bad slope
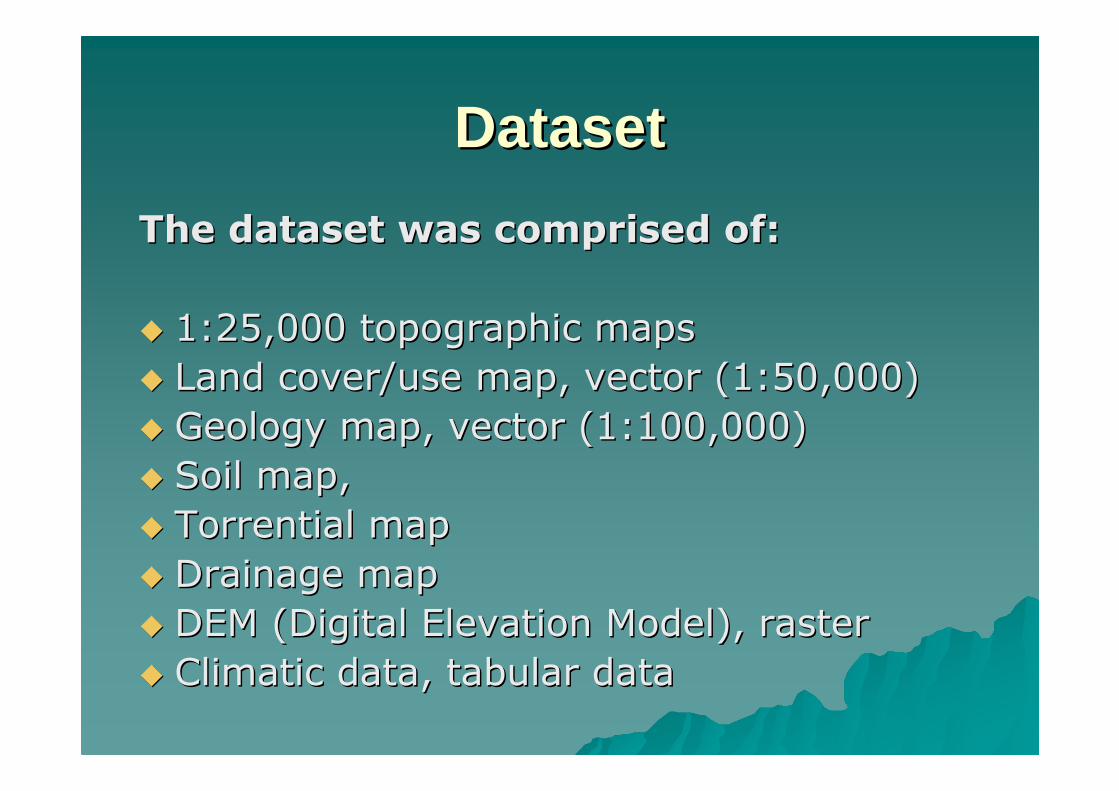
DatasetDataset
The dataset was comprised of:The dataset was comprised of:
�� 1:25,000 topographic maps1:25,000 topographic maps
�� Land cover/use map, vector (1:50,000)Land cover/use map, vector (1:50,000)
�� Geology map, vector (1:100,000)Geology map, vector (1:100,000)
�� Soil map,Soil map,
�� Torrential mapTorrential map
�� Drainage mapDrainage map
�� DEM (Digital Elevation Model), rasterDEM (Digital Elevation Model), raster
�� Climatic data, tabular dataClimatic data, tabular data
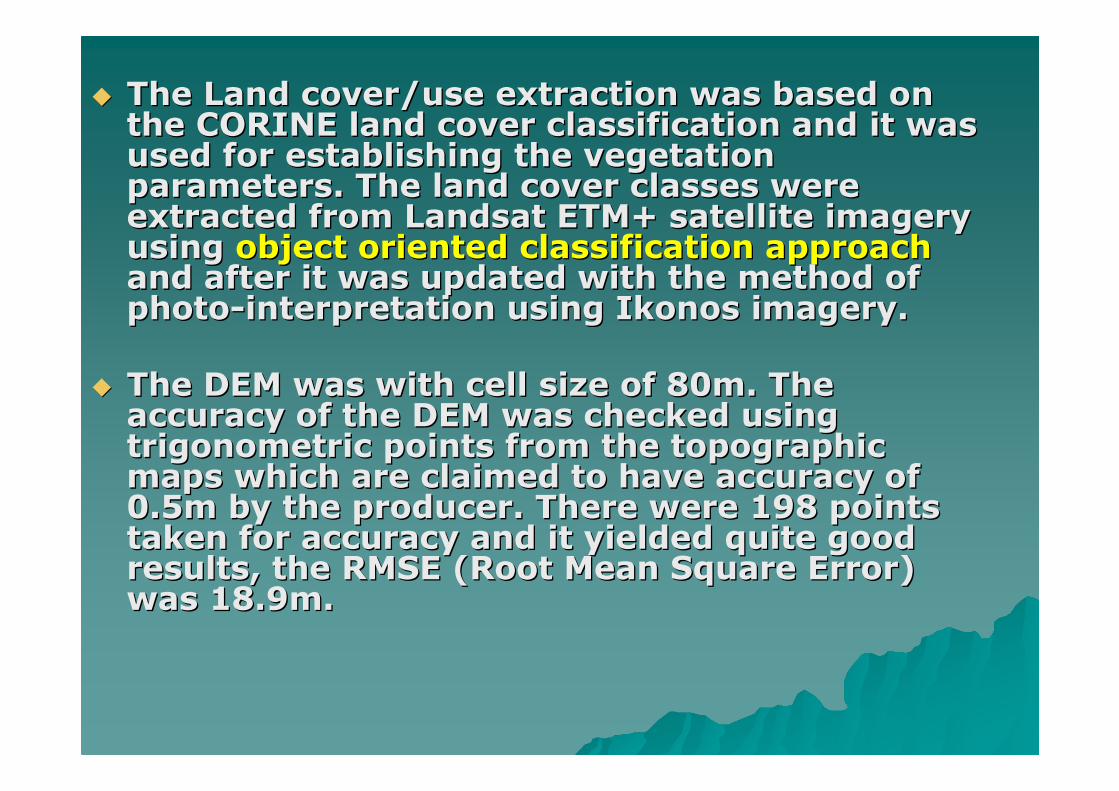
�� The Land cover/use extraction was based on The Land cover/use extraction was based on the CORINE land cover classification and it was the CORINE land cover classification and it was used for establishing the vegetation used for establishing the vegetation parameters. The land cover classes were parameters. The land cover classes were extracted from Landsat ETM+ satellite imagery extracted from Landsat ETM+ satellite imagery using using object oriented classification approachobject oriented classification approachand after it was updated with the method of and after it was updated with the method of photophoto--interpretation using interpretation using IkonosIkonos imagery. imagery.
�� The DEM was with cell size of 80m. The The DEM was with cell size of 80m. The accuracy of the DEM was checked using accuracy of the DEM was checked using trigonometric points from the topographic trigonometric points from the topographic maps which are claimed to have accuracy of maps which are claimed to have accuracy of 0.5m by the producer. There were 198 points 0.5m by the producer. There were 198 points taken for accuracy and it yielded quite good taken for accuracy and it yielded quite good results, the RMSE (Root Mean Square Error) results, the RMSE (Root Mean Square Error) was 18.9m. was 18.9m.
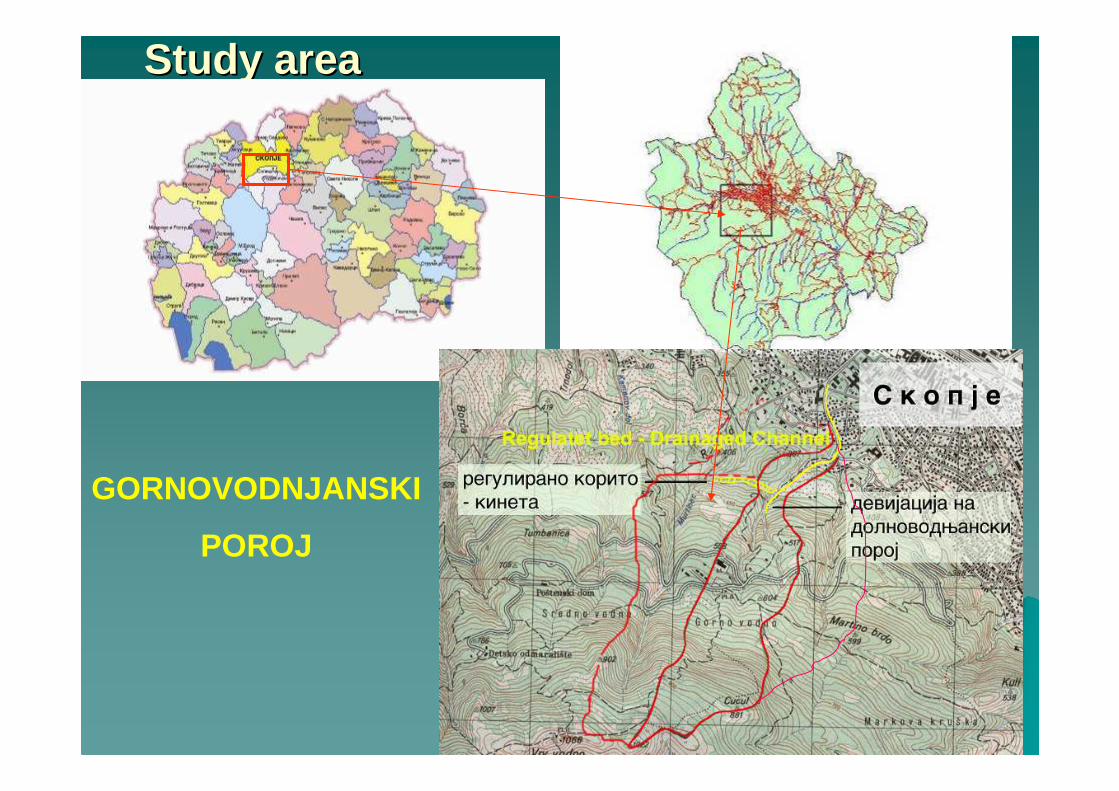
Study areaStudy area
GORNOVODNJANSKI
POROJ
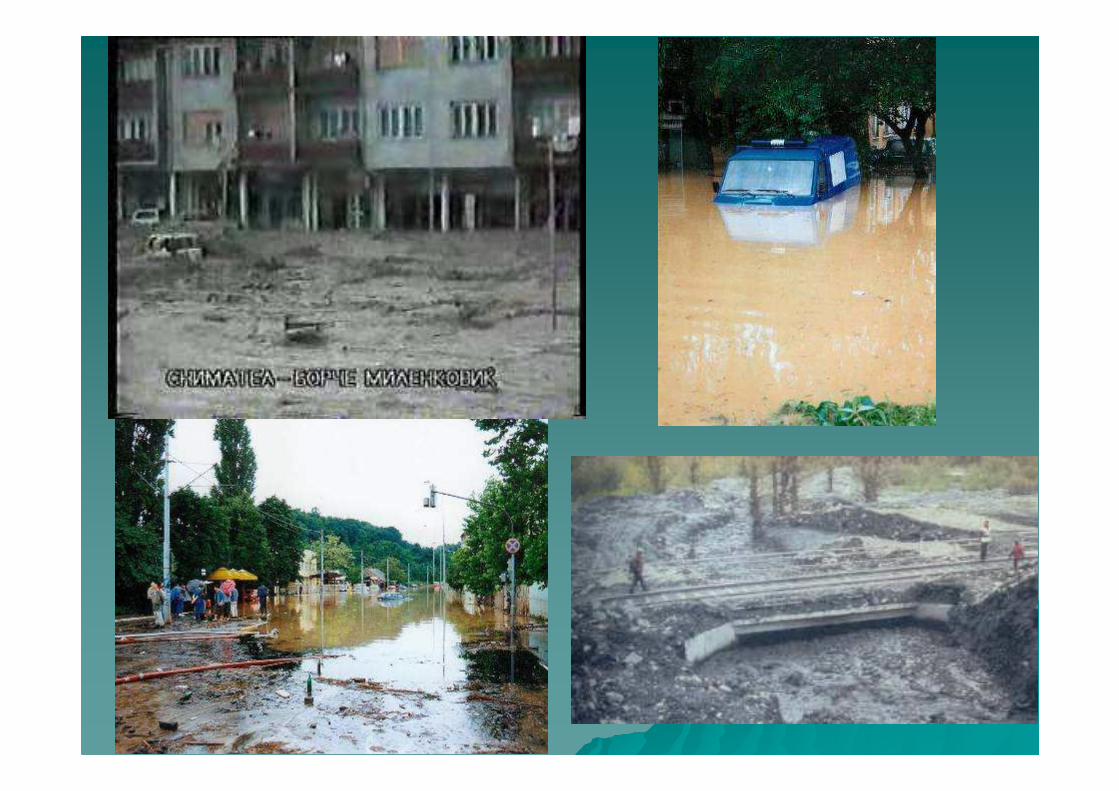
Why this torrent ?Why this torrent ?
�� Date : 1.06.1951 Date : 1.06.1951 –– time: about 17.ootime: about 17.oo
�� High intensity precipitation result in High intensity precipitation result in catastrophic disaster catastrophic disaster -- flash floodflash flood
�� 1 guilty, large number of injured1 guilty, large number of injured
�� 25 000 m25 000 m33 sedimented material around sedimented material around ““Stara rampaStara rampa”” (Old gate) ,(Old gate) ,
�� Damaged infrastructure and housesDamaged infrastructure and houses
�� Flooded and covered with sediment Flooded and covered with sediment yards yards
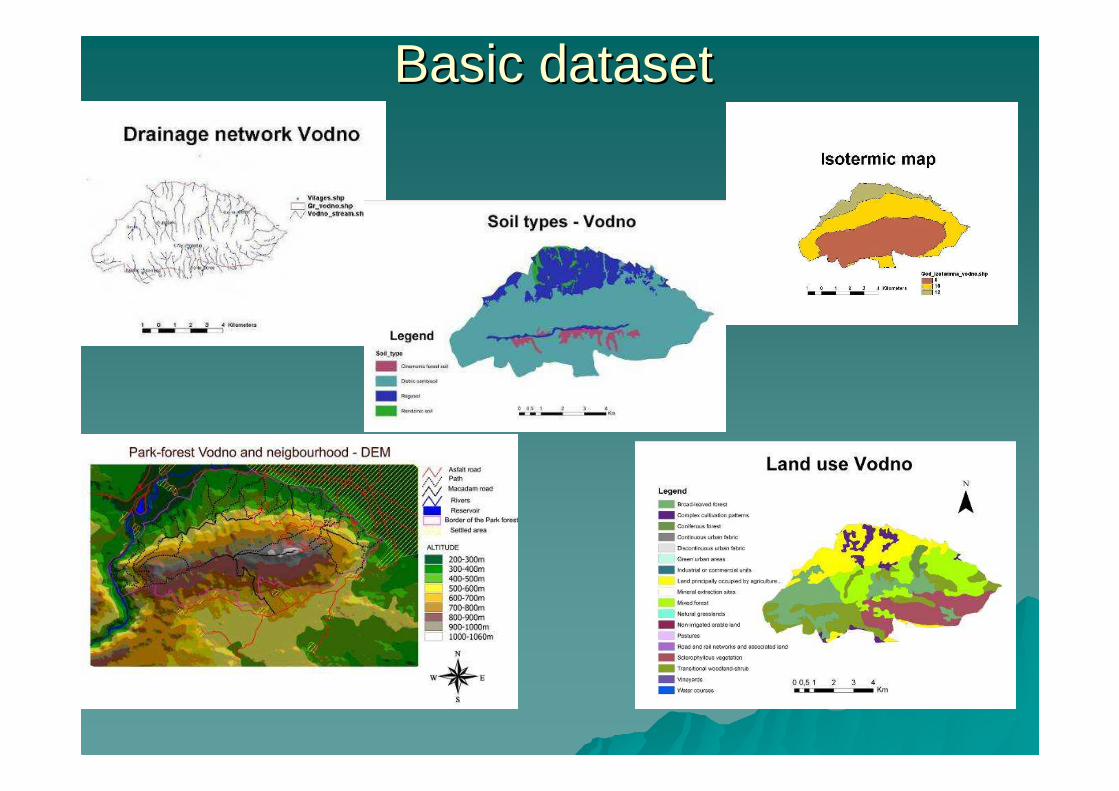
Basic datasetBasic dataset
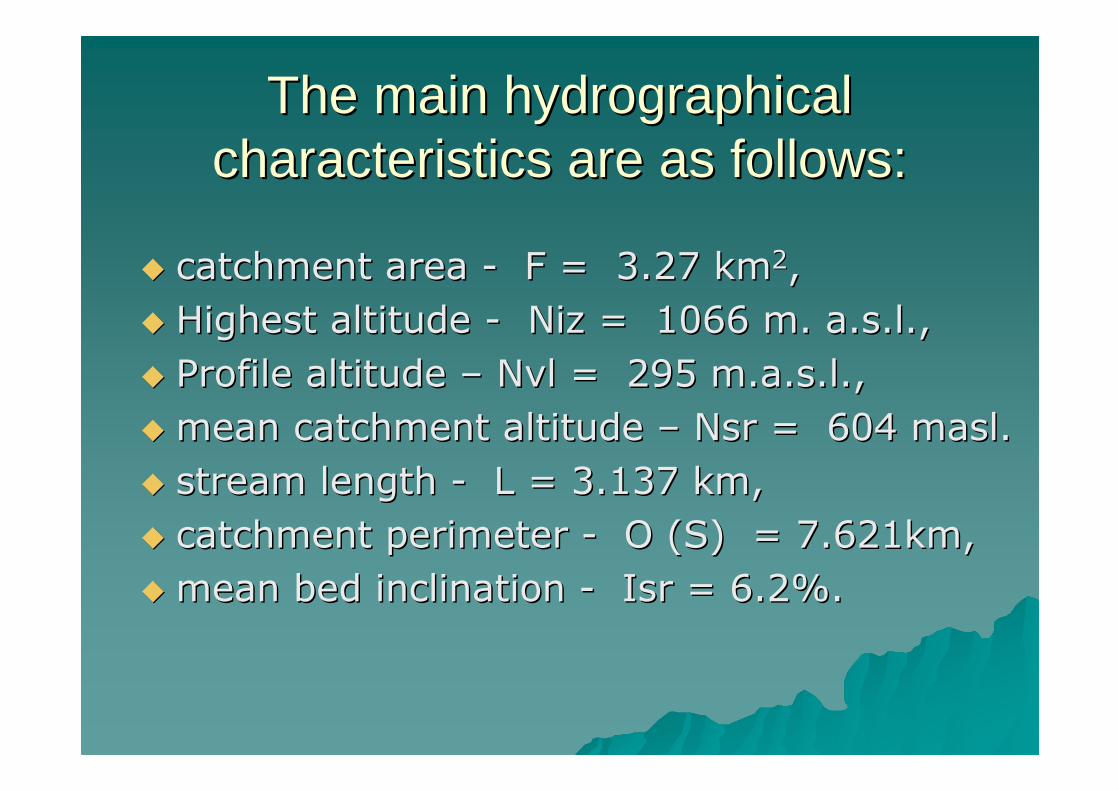
The main hydrographical The main hydrographical characteristics are as follows:characteristics are as follows:
�� catchment area catchment area -- F = 3.27 kmF = 3.27 km22,,
�� Highest altitude Highest altitude -- NizNiz = 1066 m. = 1066 m. a.s.la.s.l.,.,
�� Profile altitude Profile altitude –– NvlNvl = 295 = 295 m.a.s.lm.a.s.l.,.,
�� mean catchment altitude mean catchment altitude –– NsrNsr = 604 = 604 maslmasl..
�� stream length stream length -- L = 3.137 km,L = 3.137 km,
�� catchment perimeter catchment perimeter -- O (S) = 7.621km,O (S) = 7.621km,
�� mean bed inclination mean bed inclination -- IsrIsr = 6.2%.= 6.2%.
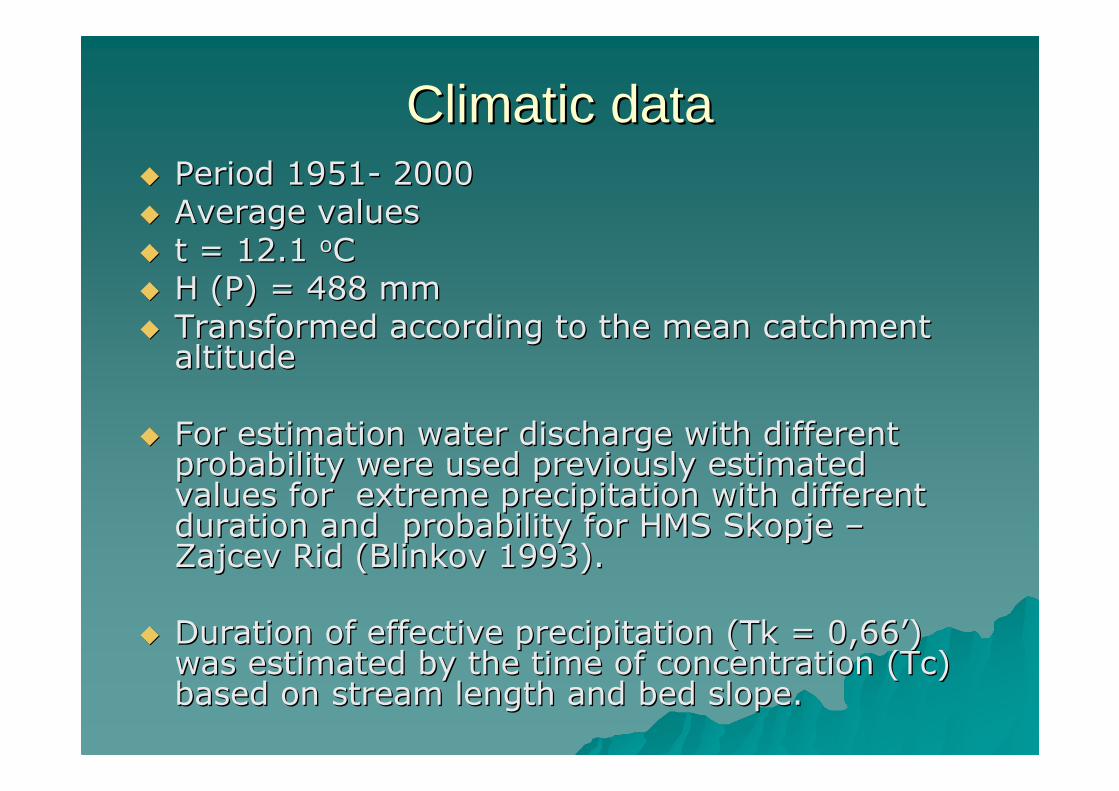
Climatic dataClimatic data�� Period 1951Period 1951-- 20002000
�� Average valuesAverage values
�� t = 12.1 t = 12.1 ooCC
�� H (P) = 488 mmH (P) = 488 mm
�� Transformed according to the mean catchment Transformed according to the mean catchment altitudealtitude
�� For estimation water discharge with different For estimation water discharge with different probability were used previously estimated probability were used previously estimated values for extreme precipitation with different values for extreme precipitation with different duration and probability for HMS Skopje duration and probability for HMS Skopje ––ZajcevZajcev Rid (Blinkov 1993). Rid (Blinkov 1993).
�� Duration of effective precipitation (Duration of effective precipitation (TkTk = 0,66= 0,66’’) ) was estimated by the time of concentration (was estimated by the time of concentration (TcTc) ) based on stream length and bed slope. based on stream length and bed slope.
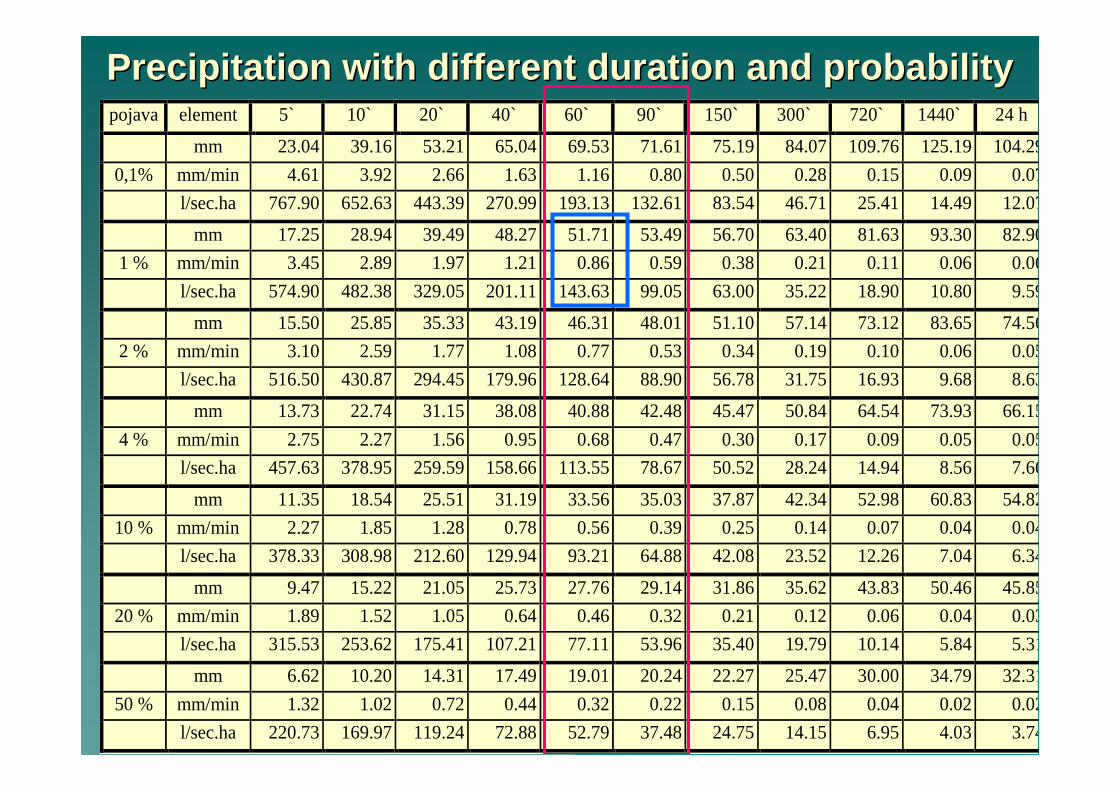
Precipitation with different duration and probabili ty Precipitation with different duration and probabili ty pojava element 5` 10` 20` 40` 60` 90` 150` 300` 720` 1440` 24 h
mm 23.04 39.16 53.21 65.04 69.53 71.61 75.19 84.07 109.76 125.19 104.29
0,1% mm/min 4.61 3.92 2.66 1.63 1.16 0.80 0.50 0.28 0.15 0.09 0.07
l/sec.ha 767.90 652.63 443.39 270.99 193.13 132.61 83.54 46.71 25.41 14.49 12.07
mm 17.25 28.94 39.49 48.27 51.71 53.49 56.70 63.40 81.63 93.30 82.90
1 % mm/min 3.45 2.89 1.97 1.21 0.86 0.59 0.38 0.21 0.11 0.06 0.06
l/sec.ha 574.90 482.38 329.05 201.11 143.63 99.05 63.00 35.22 18.90 10.80 9.59
mm 15.50 25.85 35.33 43.19 46.31 48.01 51.10 57.14 73.12 83.65 74.56
2 % mm/min 3.10 2.59 1.77 1.08 0.77 0.53 0.34 0.19 0.10 0.06 0.05
l/sec.ha 516.50 430.87 294.45 179.96 128.64 88.90 56.78 31.75 16.93 9.68 8.63
mm 13.73 22.74 31.15 38.08 40.88 42.48 45.47 50.84 64.54 73.93 66.15
4 % mm/min 2.75 2.27 1.56 0.95 0.68 0.47 0.30 0.17 0.09 0.05 0.05
l/sec.ha 457.63 378.95 259.59 158.66 113.55 78.67 50.52 28.24 14.94 8.56 7.66
mm 11.35 18.54 25.51 31.19 33.56 35.03 37.87 42.34 52.98 60.83 54.82
10 % mm/min 2.27 1.85 1.28 0.78 0.56 0.39 0.25 0.14 0.07 0.04 0.04
l/sec.ha 378.33 308.98 212.60 129.94 93.21 64.88 42.08 23.52 12.26 7.04 6.34
mm 9.47 15.22 21.05 25.73 27.76 29.14 31.86 35.62 43.83 50.46 45.85
20 % mm/min 1.89 1.52 1.05 0.64 0.46 0.32 0.21 0.12 0.06 0.04 0.03
l/sec.ha 315.53 253.62 175.41 107.21 77.11 53.96 35.40 19.79 10.14 5.84 5.31
mm 6.62 10.20 14.31 17.49 19.01 20.24 22.27 25.47 30.00 34.79 32.31
50 % mm/min 1.32 1.02 0.72 0.44 0.32 0.22 0.15 0.08 0.04 0.02 0.02
l/sec.ha 220.73 169.97 119.24 72.88 52.79 37.48 24.75 14.15 6.95 4.03 3.74
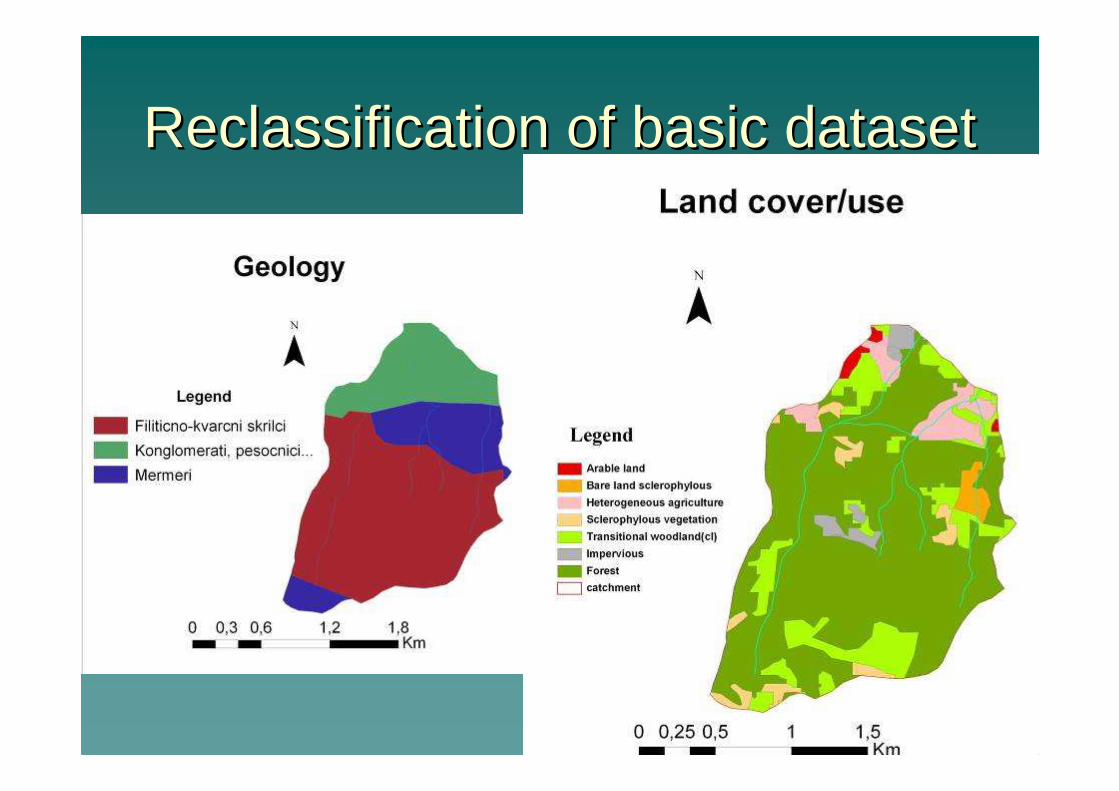
Reclassification of basic datasetReclassification of basic dataset
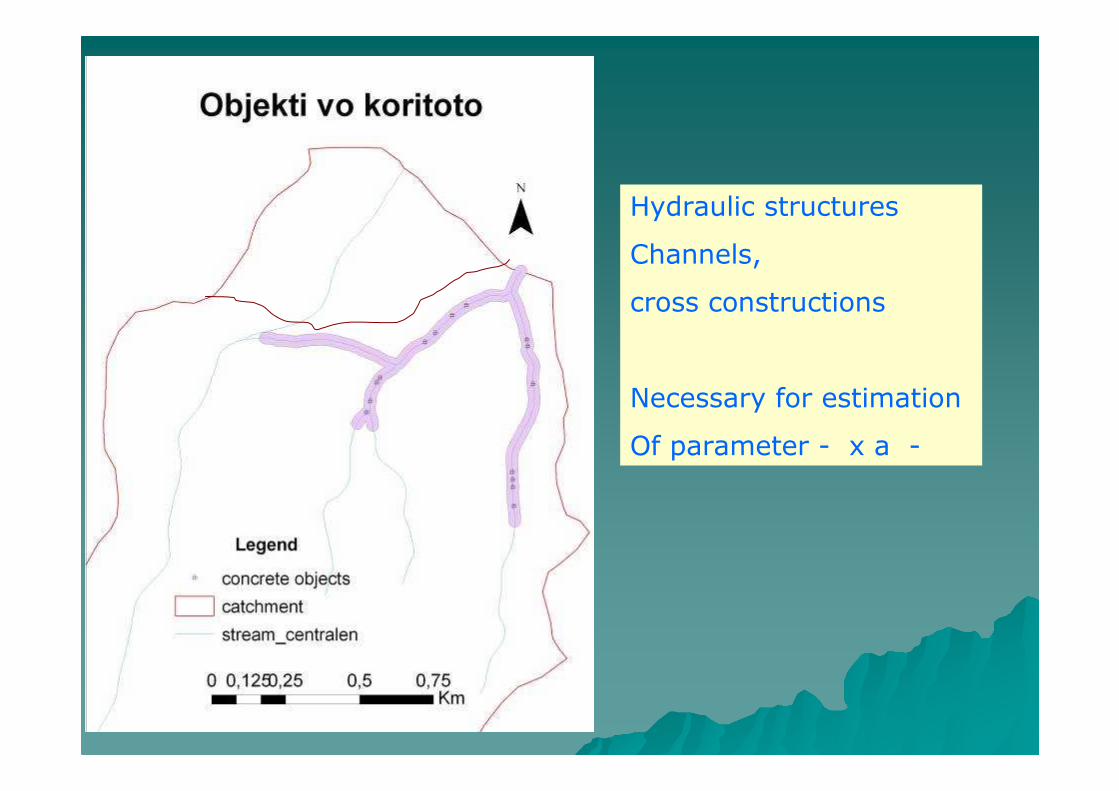
Hydraulic structures
Channels,
cross constructions
Necessary for estimation
Of parameter - x a -
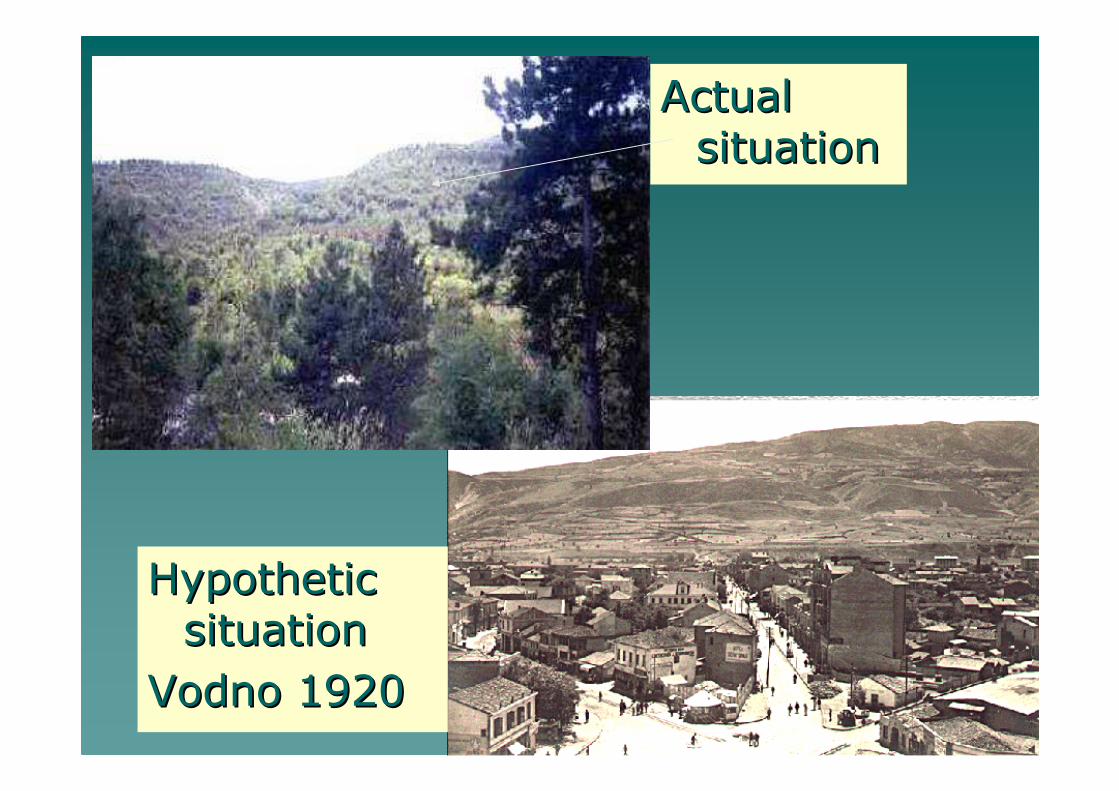
Actual Actual
situationsituation
Hypothetic Hypothetic
situationsituation
Vodno 1920Vodno 1920
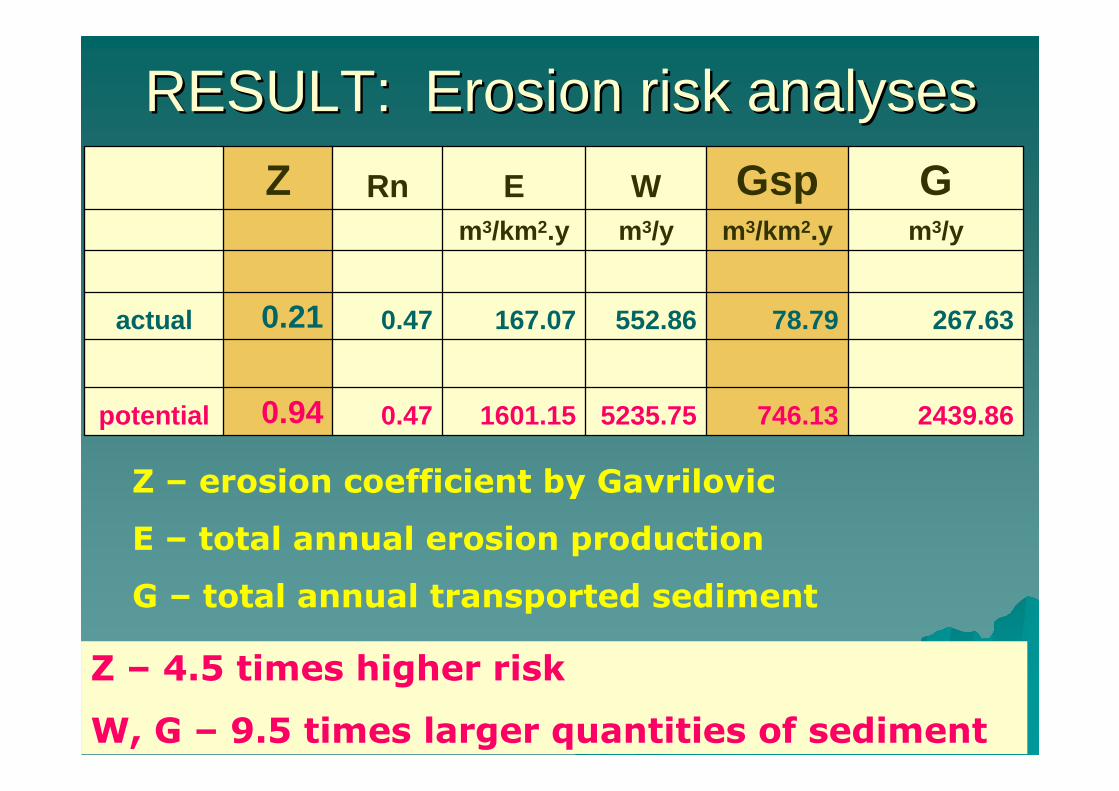
RESULT: Erosion risk analysesRESULT: Erosion risk analyses
2439.86746.13 5235.75 1601.15 0.47 0.94 potential
267.6378.79 552.86 167.07 0.47 0.21 actual
m3/ym3/km 2.ym3/ym3/km 2.y
GGspWERnZ
Z – erosion coefficient by Gavrilovic
E – total annual erosion production
G – total annual transported sediment
Z – 4.5 times higher risk
W, G – 9.5 times larger quantities of sediment
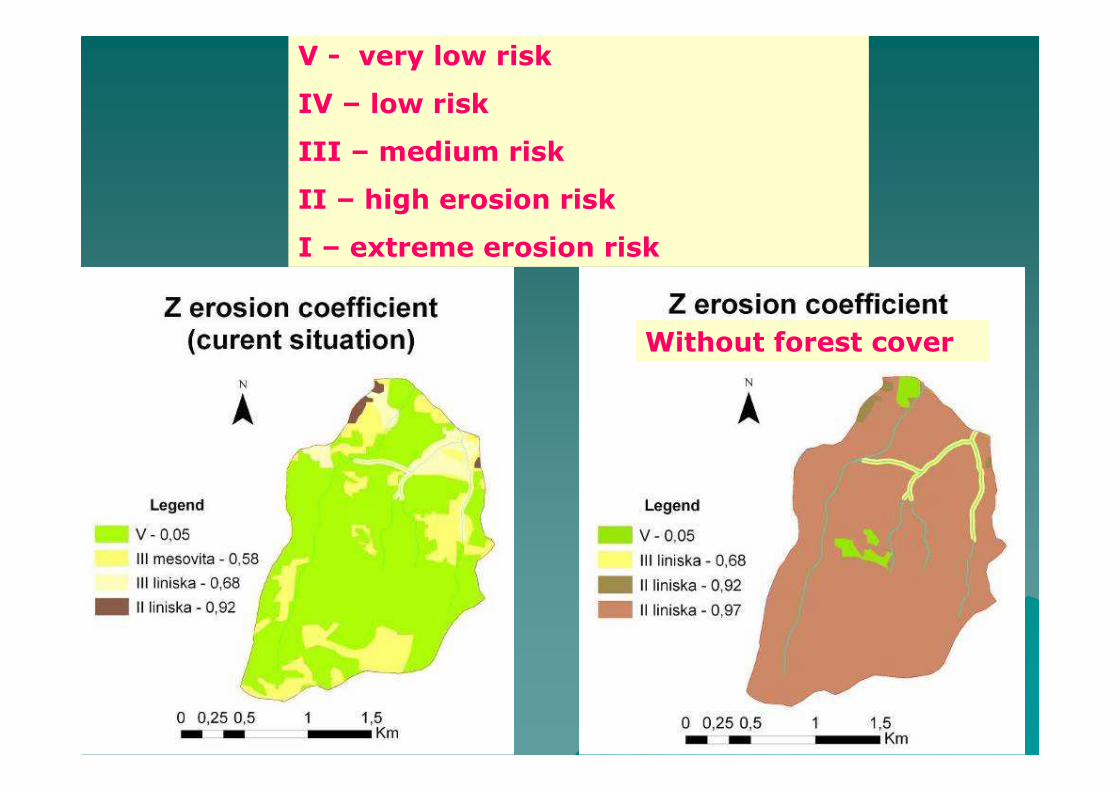
V - very low risk
IV – low risk
III – medium risk
II – high erosion risk
I – extreme erosion risk
Without forest cover
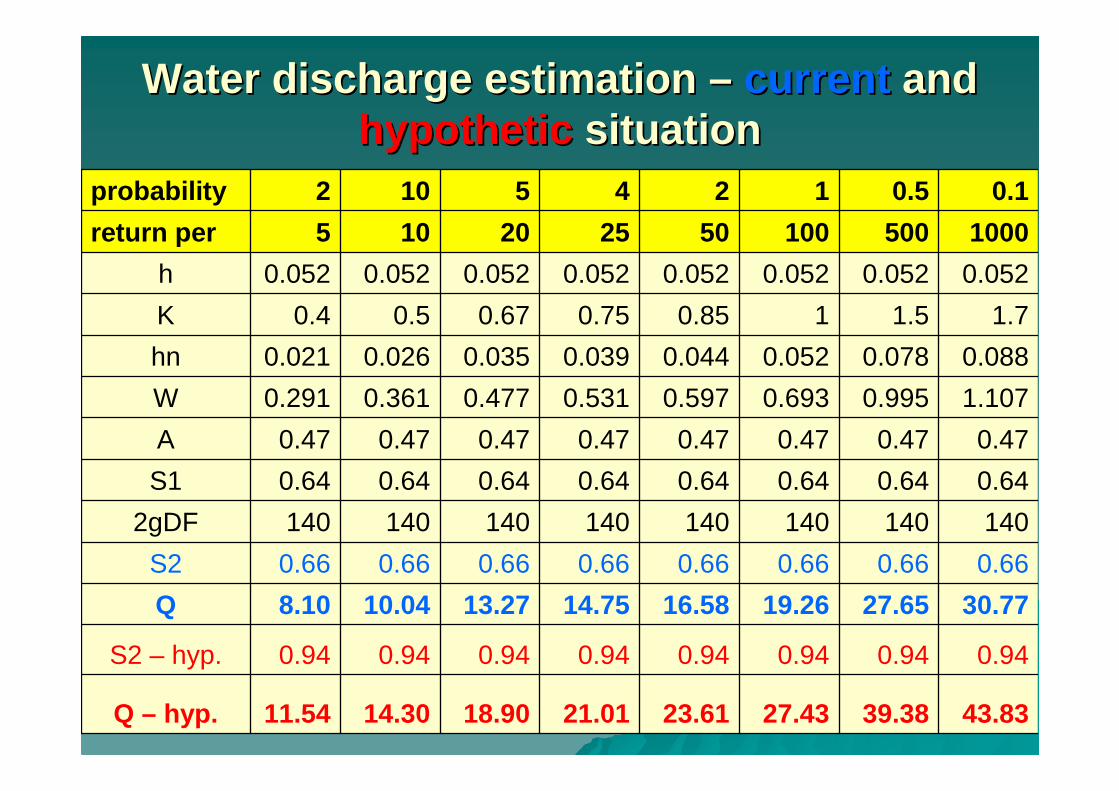
Water discharge estimation Water discharge estimation –– currentcurrent and and hypothetichypothetic situationsituation
43.8339.3827.4323.6121.0118.9014.3011.54Q – hyp.
0.940.940.940.940.940.940.940.94S2 – hyp.
30.7727.6519.2616.5814.7513.2710.048.10Q
0.660.660.660.660.660.660.660.66S2
1401401401401401401401402gDF
0.640.640.640.640.640.640.640.64S1
0.470.470.470.470.470.470.470.47A
1.1070.9950.6930.5970.5310.4770.3610.291W
0.0880.0780.0520.0440.0390.0350.0260.021hn
1.71.510.850.750.670.50.4K
0.0520.0520.0520.0520.0520.0520.0520.052h
1000500100502520105return per
0.10.51245102probability
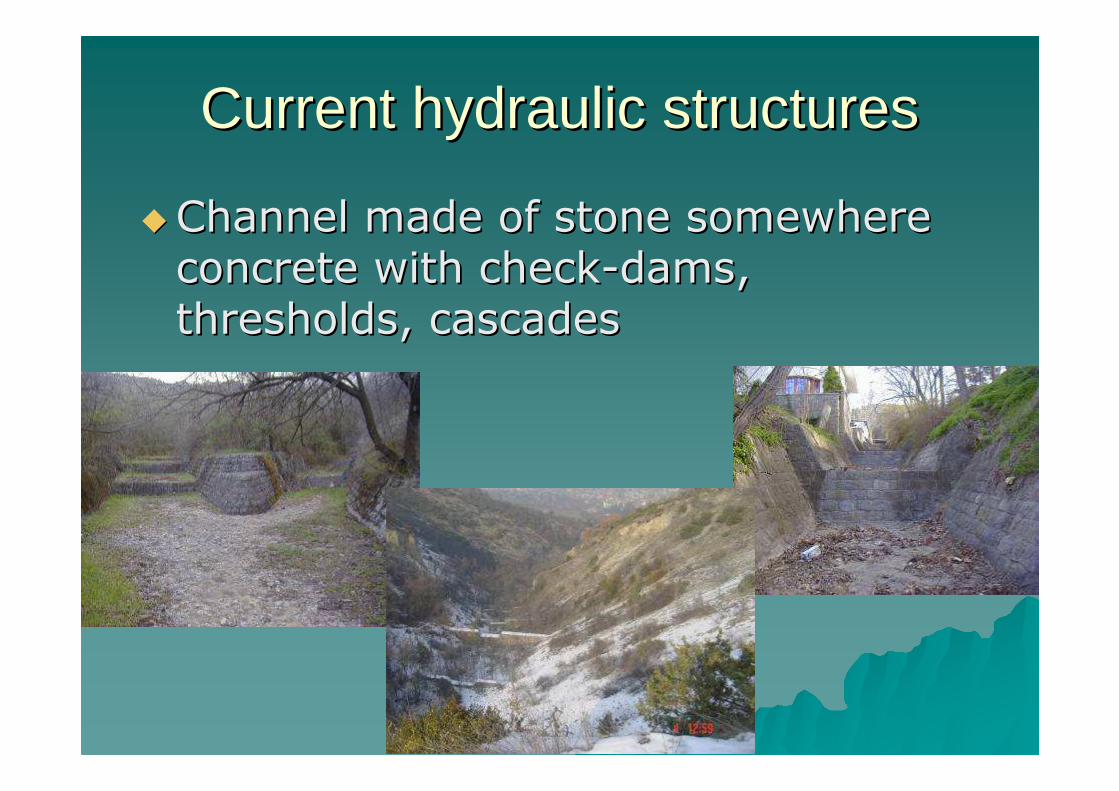
Current hydraulic structuresCurrent hydraulic structures
��Channel made of stone somewhere Channel made of stone somewhere
concrete with checkconcrete with check--dams, dams,
thresholds, cascadesthresholds, cascades
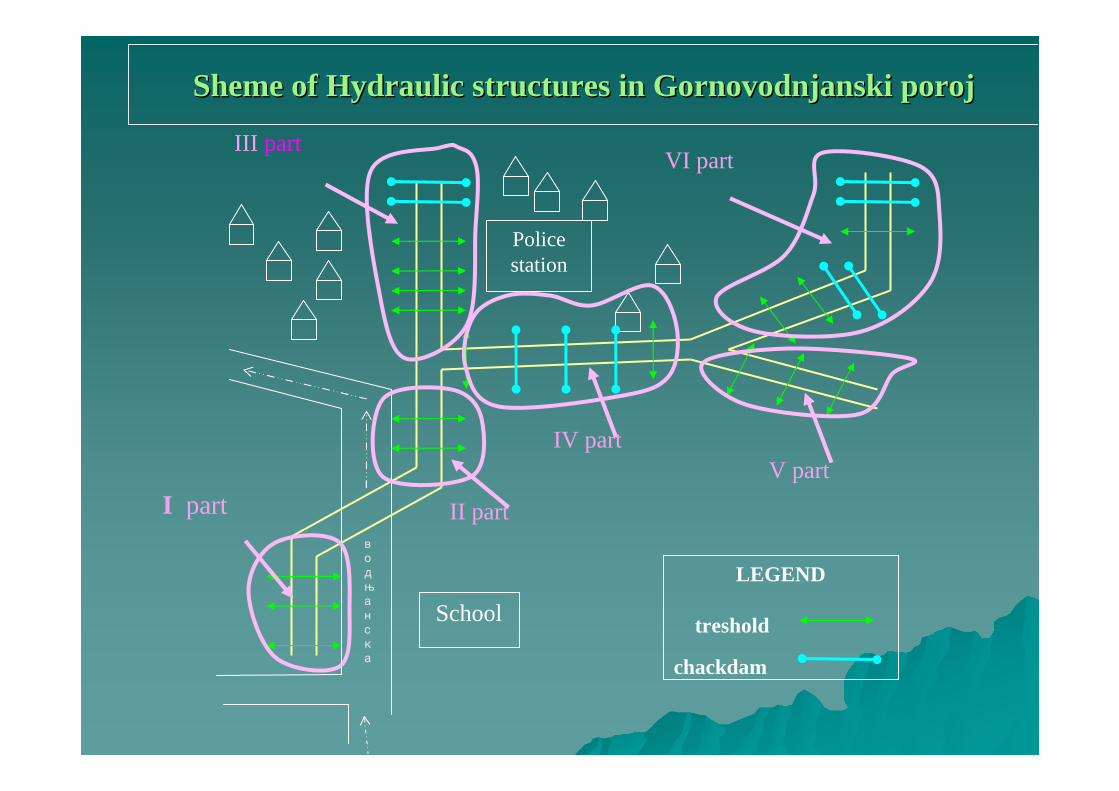
Policestation
LEGEND
treshold
chackdam
School
v
o
d
w
a
n
s
k
a
I part II part
IV part
VI partIII part
V part
ShemeSheme of Hydraulic structures in of Hydraulic structures in GornovodnjanskiGornovodnjanski porojporoj
O.U
KO^O
RACIN
v
o
d
w
a
n
s
k
a
I II
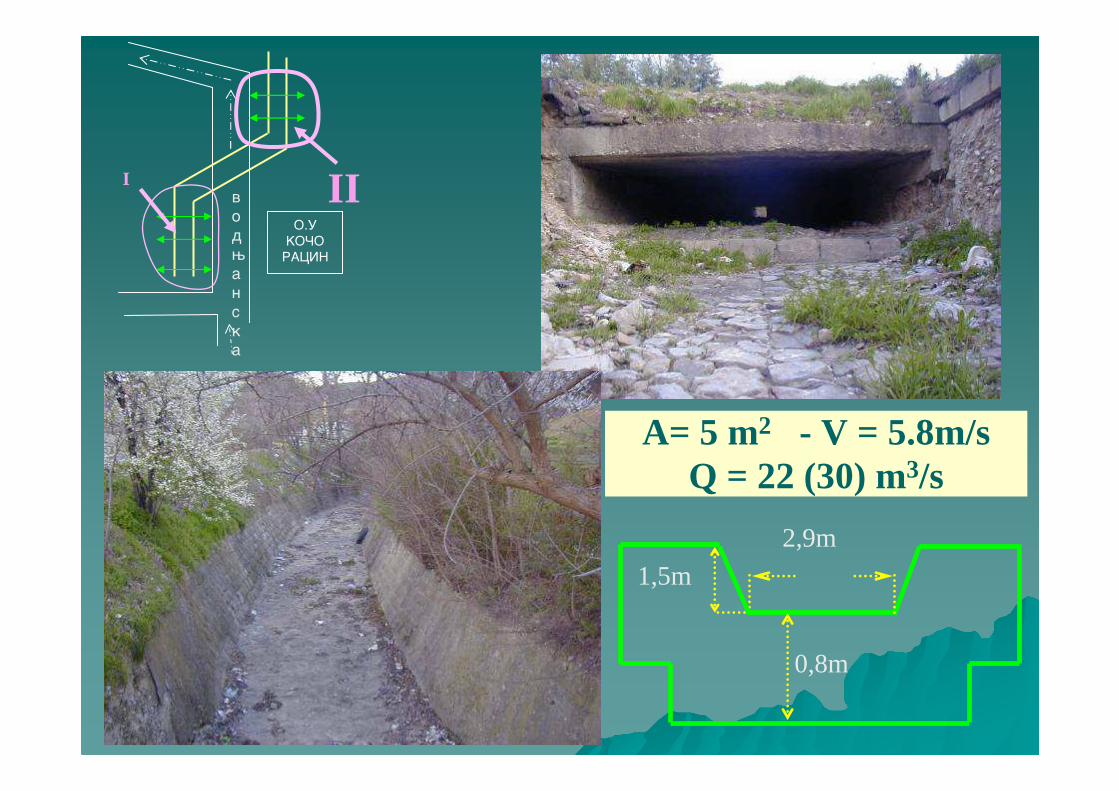
2,9m
0,8m
1,5m
A= 5 m2 - V = 5.8m/sQ = 22 (30) m3/s
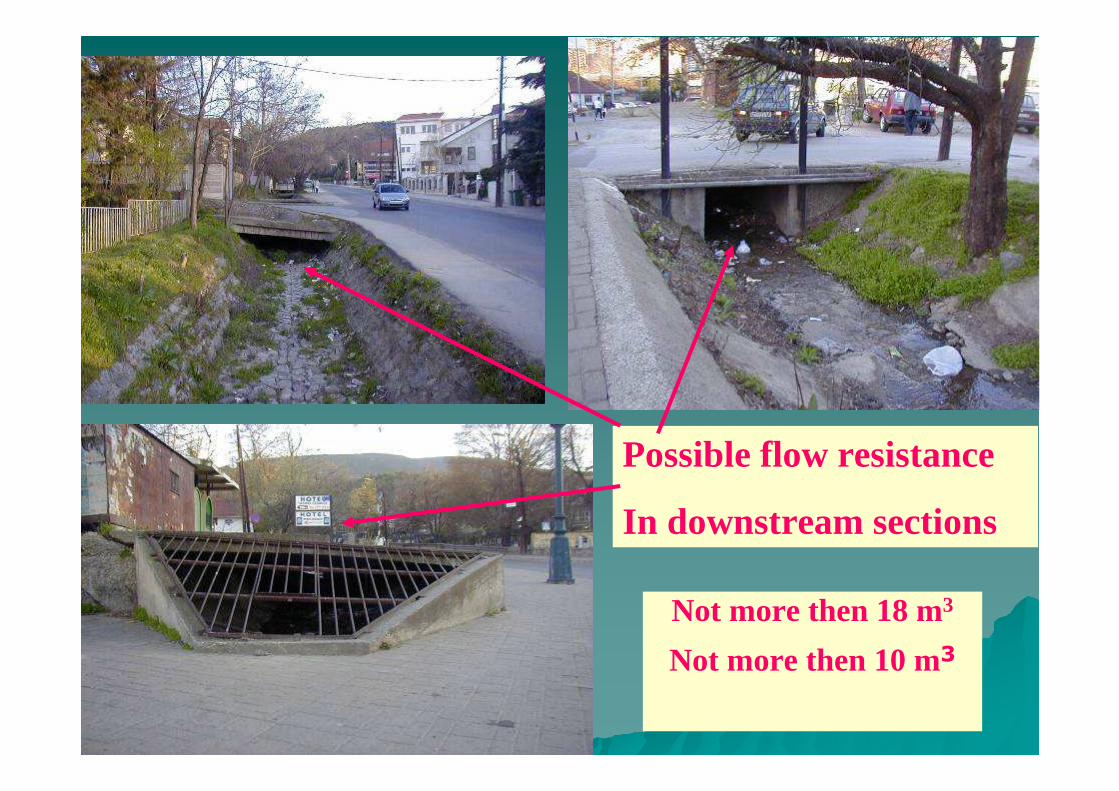
Possible flow resistance
In downstream sections
Not more then 18 m3
Not more then 10 m3
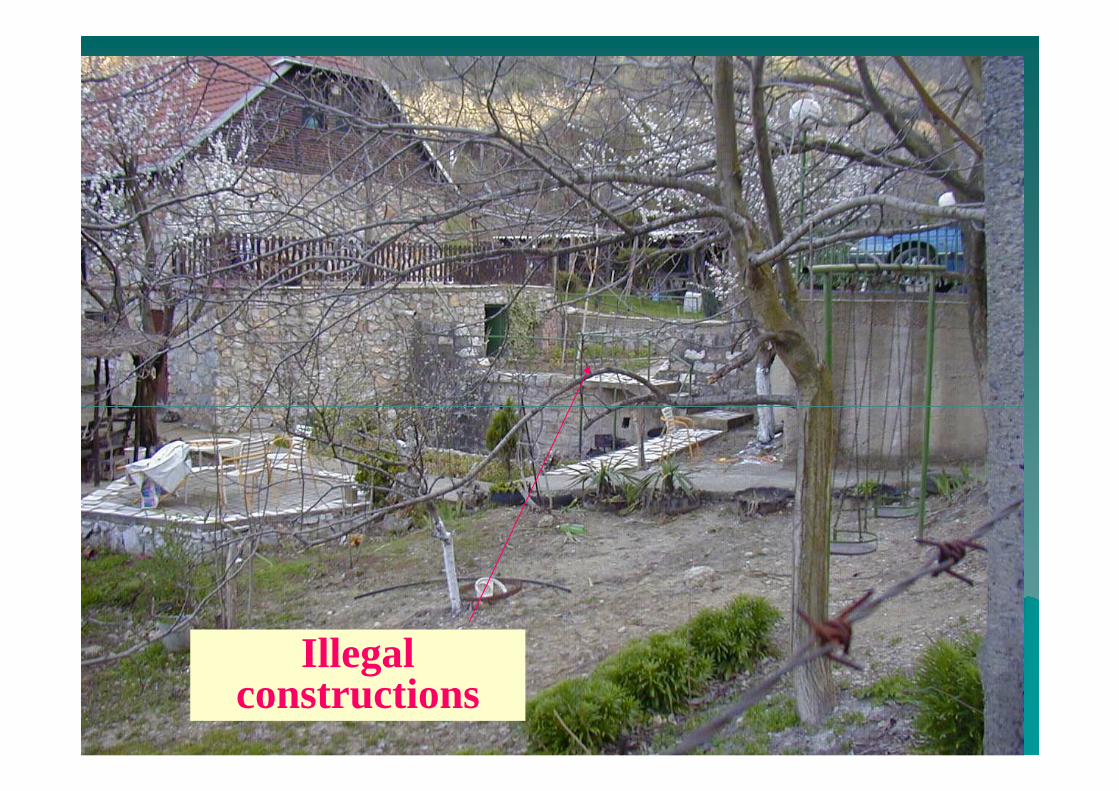
Illegal constructions
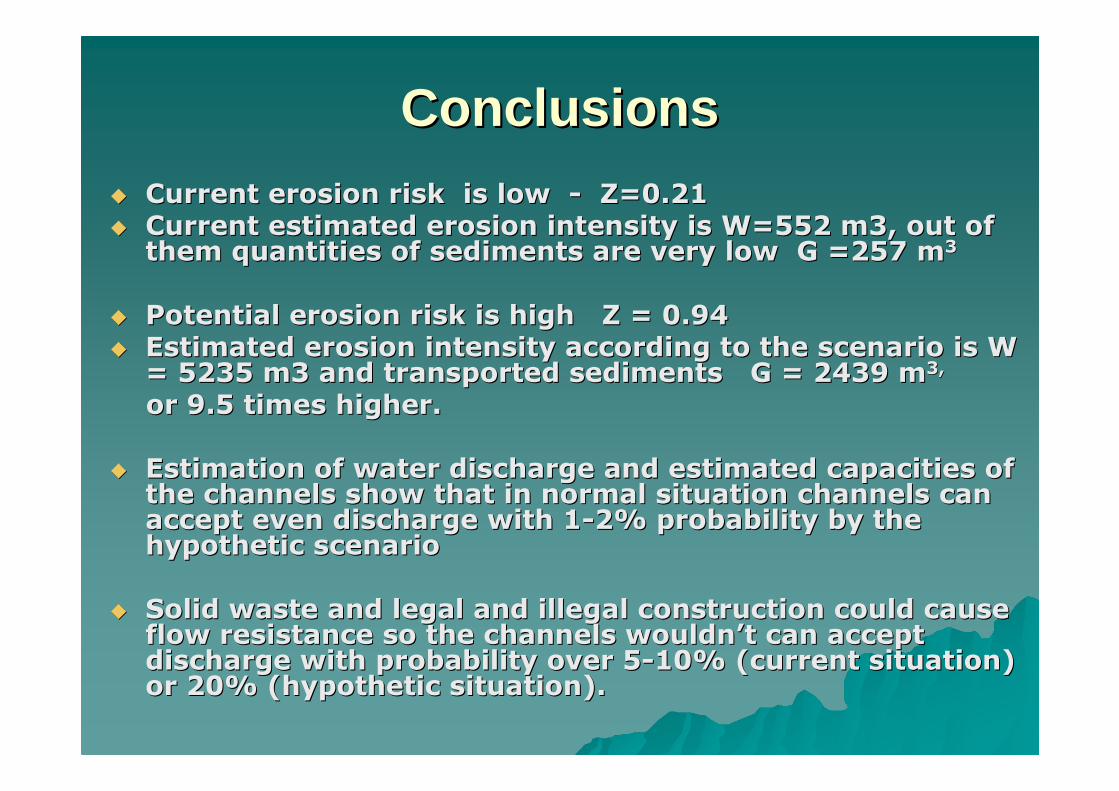
ConclusionsConclusions�� Current erosion risk is low Current erosion risk is low -- Z=0.21Z=0.21
�� Current estimated erosion intensity is W=552 m3, out of Current estimated erosion intensity is W=552 m3, out of them quantities of sediments are very low G =257 mthem quantities of sediments are very low G =257 m33
�� Potential erosion risk is high Z = 0.94 Potential erosion risk is high Z = 0.94
�� Estimated erosion intensity according to the scenario is W Estimated erosion intensity according to the scenario is W = 5235 m3 and transported sediments G = 2439 m= 5235 m3 and transported sediments G = 2439 m3, 3,
or 9.5 times higher.or 9.5 times higher.
�� Estimation of water discharge and estimated capacities of Estimation of water discharge and estimated capacities of the channels show that in normal situation channels can the channels show that in normal situation channels can accept even discharge with 1accept even discharge with 1--2% probability by the 2% probability by the hypothetic scenario hypothetic scenario
�� Solid waste and legal and illegal construction could cause Solid waste and legal and illegal construction could cause flow resistance so the channels wouldnflow resistance so the channels wouldn’’t can accept t can accept discharge with probability over 5discharge with probability over 5--10% (current situation) 10% (current situation) or 20% (hypothetic situation).or 20% (hypothetic situation).

Do we Like it!Do we Like it!
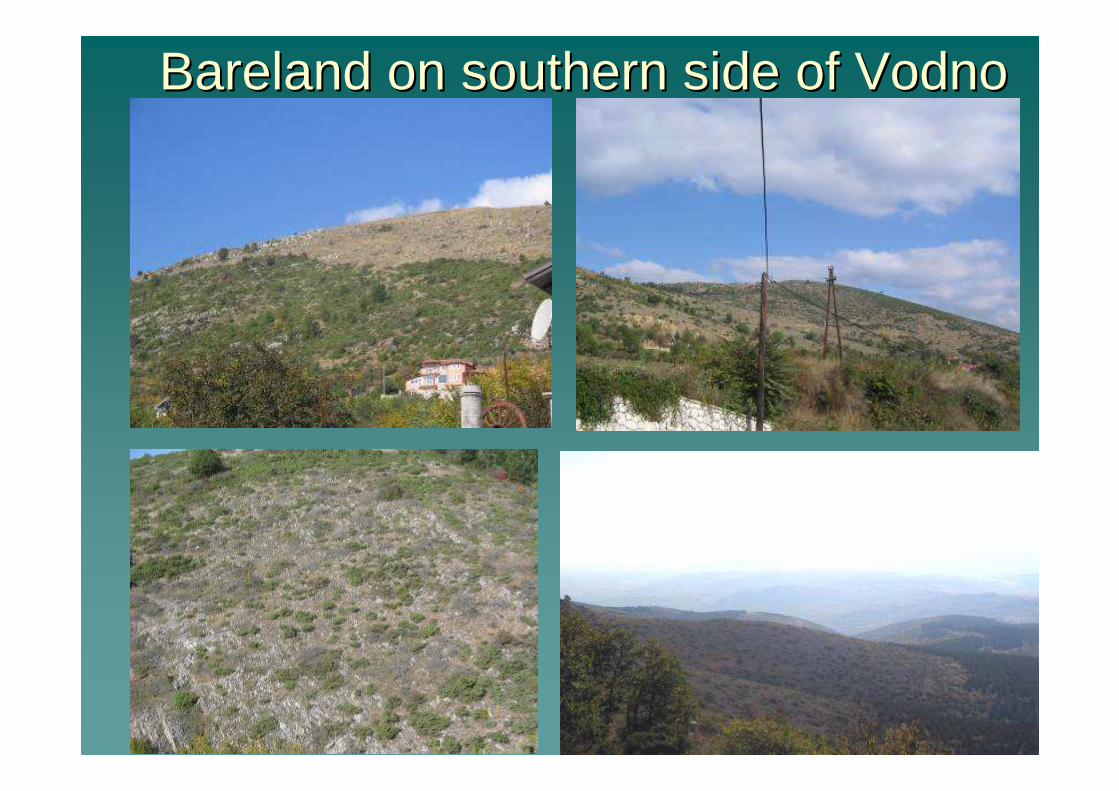
Bareland on southern side of VodnoBareland on southern side of Vodno
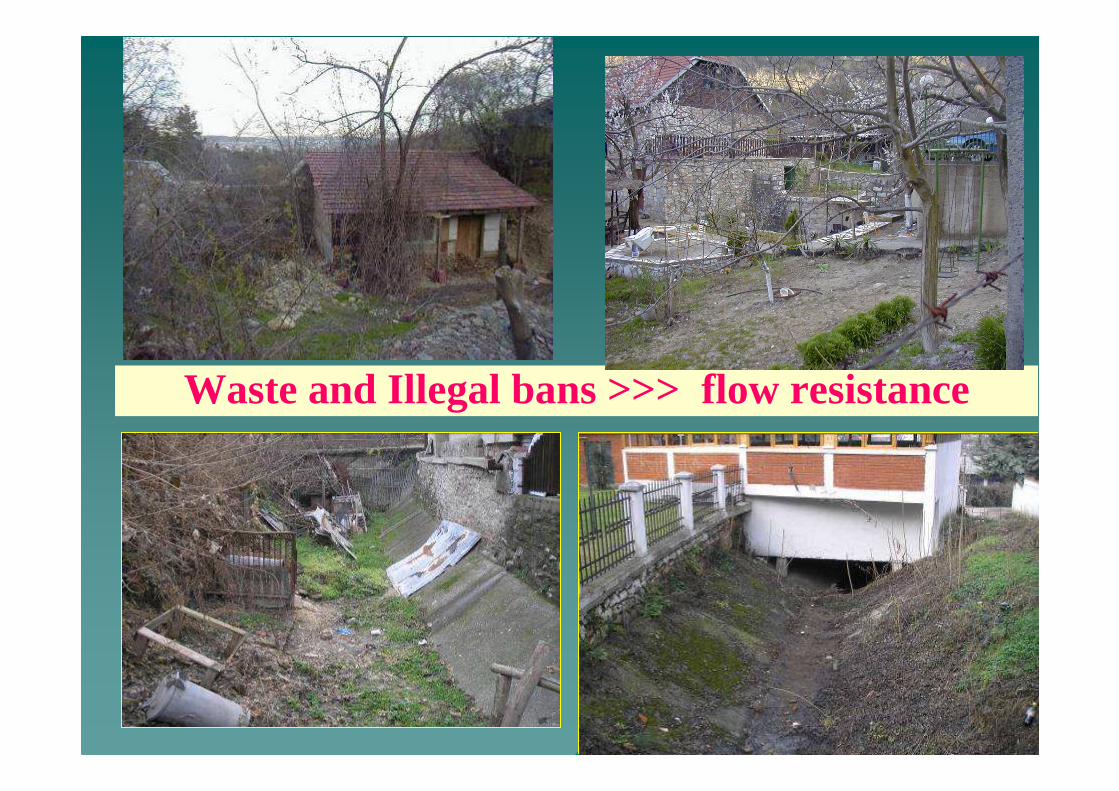
Waste and Illegal bans >>> flow resistance
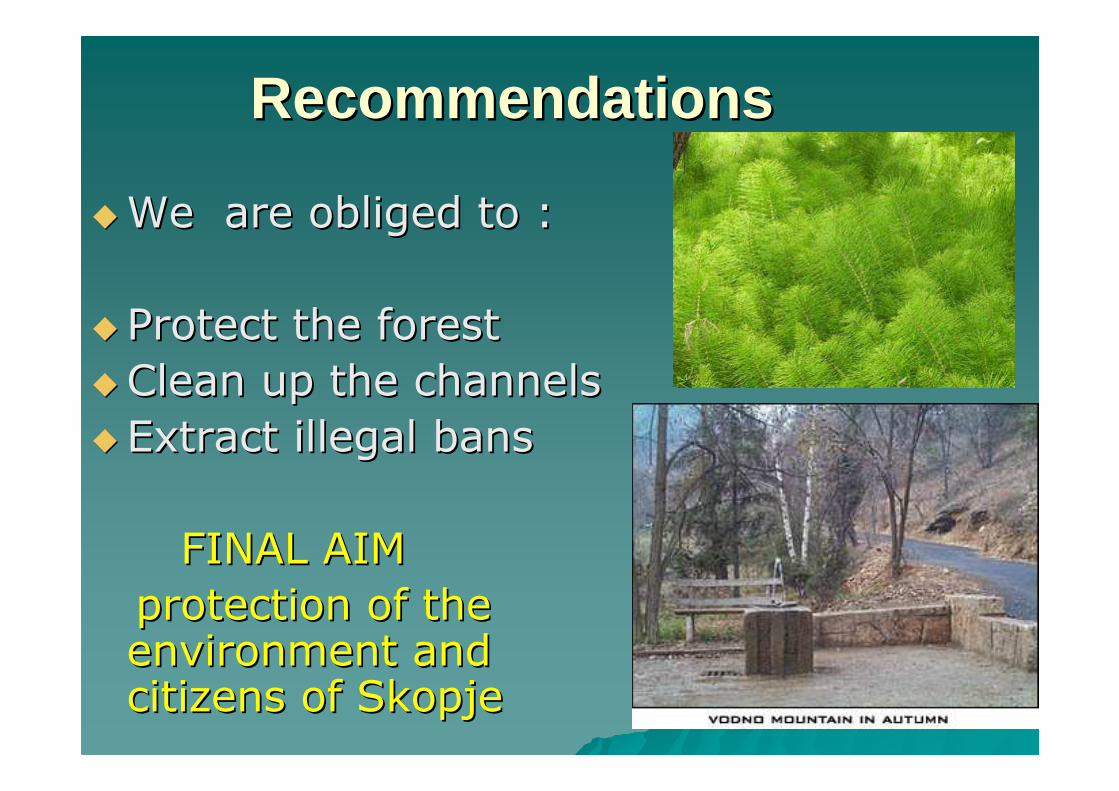
RecommendationsRecommendations
��We are obliged to :We are obliged to :
�� Protect the forest Protect the forest
��Clean up the channelsClean up the channels
�� Extract illegal bans Extract illegal bans
FINAL AIM FINAL AIM
protection of the protection of the environment and environment and citizens of Skopjecitizens of Skopje
RIMADIMARisk-, Disaster-Management & prevention of natural hazards in mountainous and/or forested
regionsRef.nr.: 5D102 RIMADIMA