gis-aided play assessment of several basins in offshore peruperu the offshore basins of peru peru is...
TRANSCRIPT

GIS-Aided Play Assessment of Several Basins in Offshore Peru Tarek Ghazi – GeoKnowledge USA, Inc.
ESRI PUG – Houston, Texas – April 4, 2006 1 of 29
Peru
GIS-Aided Play Assessment of Several Basins in Offshore Peru
Tarek GhaziGeoKnowledge USA, Inc.
ESRI PUGHouston – April 4, 2006
Salaverry BasinEocene Play
AbstractGaffney, Cline and Associates recently completed a study for PERUPETRO S.A. on the sequence stratigraphy of the offshore continental shelf-slope of Peru. This study produced a new interpretation of the geologic framework, and a qualitative assessment of its petroleum potential. Building upon this new study, a more quantitative estimate of prospective petroleum resources was undertaken for several of these offshore basins. A GIS was used to construct play maps from conventional structure and isopach maps. The GIS also helped in estimating ranges in the number and size of potential petroleum accumulations in these plays. A stochastic risk, resource and valuation system was then used to estimate recoverable resources in each play, and to aggregate these play-level results for each basin. This quantitative resource estimate illuminated new petroleum potential in a very lightly explored area. Furthermore, it demonstrated the value of a GIS in the regional play assessment process.

GIS-Aided Play Assessment of Several Basins in Offshore Peru Tarek Ghazi – GeoKnowledge USA, Inc.
ESRI PUG – Houston, Texas – April 4, 2006 2 of 29
Acknowledgements
• Thanks to Rolando Bolaños at Perupetro for permission to use the data.
• Thanks also to Pete Emmet, Bob Hickman, Glenn Granata, Angel Callejon, Menno Dinkelman, and Maurice Slot for their excellent geotechnical work, performed under the auspices of Gaffney, Cline and Associates.
The structural and stratigraphic framework for the play assessment presented here was produced in a previous study for Perupetro by Gaffney, Cline & Associates (see the references at the end of this presentation). Thanks to Perupetro for permission to use the framework, and to the excellent team who originally built it.
GIS-Aided Play Assessment of Several Basins in Offshore Peru Tarek Ghazi – GeoKnowledge USA, Inc.
ESRI PUG – Houston, Texas – April 4, 2006 3 of 29
Objectives• Review one style of GIS use in play
assessment.– Likely elementary for many.
• Everything done manually. Looking for advice on automating.– Scripts and/or models
• Also looking for other ways to improve the overall approach.
The objectives of this presentation are to review the GIS-aided style of play assessment that was applied to the offshore basins of Peru, and to solicit feedback on how this process might be improved and automated.

GIS-Aided Play Assessment of Several Basins in Offshore Peru Tarek Ghazi – GeoKnowledge USA, Inc.
ESRI PUG – Houston, Texas – April 4, 2006 4 of 29
Outline
• Where is Peru? What did we do?
• What is a play? A play element?
• GIS in play element mapping (a lot)
• GIS in feature counting and sizing (a little)
• GIS in visualizing the results (even less)
We begin with a brief introduction to Peru and the previous framework study, and continue with some basic play assessment definitions. We conclude with a summary of a GIS-aided play assessment work process, with particular emphasis on play element mapping.

GIS-Aided Play Assessment of Several Basins in Offshore Peru Tarek Ghazi – GeoKnowledge USA, Inc.
ESRI PUG – Houston, Texas – April 4, 2006 5 of 29
Peru
The Offshore Basins of Peru
Peru is located on the west coast of South America, south of Ecuador and north of Bolivia and Chile. The left-hand map shows the location of the six offshore basins that werestudied in the original framework project. The Salaverry basin is highlighted in red because it was used as the example for this presentation.

GIS-Aided Play Assessment of Several Basins in Offshore Peru Tarek Ghazi – GeoKnowledge USA, Inc.
ESRI PUG – Houston, Texas – April 4, 2006 6 of 29
USTDA Project – The Framework
The Data
4 dry holesSeepsSeismic (20 km grid)
Gravity
Deep Trench
The Salaverry Basin is a rank wildcat exploration province. It has not been drilled, and is covered only by regional gravity and magnetic data, and by a 20-kilometer grid of 2-D seismic lines. The nearest wells (four dry holes) were drilled in the Trujillo Basin to the west. In spite of the dry holes, the Trujillo Basin is covered with oil seeps, which indicate an active petroleum system. We postulate a similar system in the Salaverry Basin. The deep trench that lies west of the Trujillo and Salaverry basins marks this as a convergent continental margin that has been disturbed by almost every style of structural deformation. The red line marks the location of an example seismic line that is shown in the following two slides to illustrate this structural complexity.

GIS-Aided Play Assessment of Several Basins in Offshore Peru Tarek Ghazi – GeoKnowledge USA, Inc.
ESRI PUG – Houston, Texas – April 4, 2006 7 of 29
Example Seismic Section – West Half
Trujillo Basin Salaverry High
4,500 m
W E
66 km
The Trujillo Basin is at the leading edge of a continental crustal plate under which an oceanic plate is being subducted. Notice how heavily faulted and folded the basin is. In contrast to the structural complexity of the Trujillo Basin, the Salaverry Basin has a much simpler elongated bowl shape, as illustrated in the easterly continuation of this example seismic line in the next slide.

GIS-Aided Play Assessment of Several Basins in Offshore Peru Tarek Ghazi – GeoKnowledge USA, Inc.
ESRI PUG – Houston, Texas – April 4, 2006 8 of 29
Example Seismic Section – East Half
Salaverry Basin
3,500 m
W E
74 km
The Salaverry Basin was chosen as the example for this presentation because of this simpler, less faulted structure.

GIS-Aided Play Assessment of Several Basins in Offshore Peru Tarek Ghazi – GeoKnowledge USA, Inc.
ESRI PUG – Houston, Texas – April 4, 2006 9 of 29
Example Map – Total Sediment Isopach
This is one of the many structure and thickness maps that were produced as part of the original framework project. It shows the total sediment thickness in the Sechura, Trujillo and Salaverry basins. The thickest parts of these basins are represented in red.

GIS-Aided Play Assessment of Several Basins in Offshore Peru Tarek Ghazi – GeoKnowledge USA, Inc.
ESRI PUG – Houston, Texas – April 4, 2006 10 of 29
A play …
… is an area* within a basin that contains afamily of prospects with similar regional controls, including (but not limited to) source, reservoir, trap seal, migration and preservation.
*area generally equals reservoir extent Salaverry Basin
Eocene Play
Having set the regional stage in offshore Peru, it is time for a few basic play assessment definitions. A “play” has been defined in many ways in the geological literature. For the purposes of this presentation, it is an area within a basin that contains a family of known and/or postulated prospects that share similar regional controls on the accumulation of hydrocarbons. These regional controls include, but are not limited to, source, reservoir, seal, trap, migration and preservation. The area of a play is the maximum areal extent of the reservoir rock. The example map in this slide represents the Eocene Carbonate play in the Salaverry Basin.

GIS-Aided Play Assessment of Several Basins in Offshore Peru Tarek Ghazi – GeoKnowledge USA, Inc.
ESRI PUG – Houston, Texas – April 4, 2006 11 of 29
A part play …
… is an area within a play that contains afamily of prospects with identical regional controls.
Salaverry BasinEocene Part Plays
* after Grant, et al. (1996)
Red = PoorYellow = FairGreen = Good*
A play often exhibits regional variations in the hydrocarbon controls. In the Salaverry Eocene example, the green-colored “sweet spot” along the axis of the basin is an area where the controls in this play are especially good. The yellow area represents a part of this play where the controls are fair. Lastly, the red area represents a third part of this play where the controls are poor. Each of these three areas constitutes a “part play” that contains a family of known and/or postulated prospects that would share the same regional risks in the play assessment.

GIS-Aided Play Assessment of Several Basins in Offshore Peru Tarek Ghazi – GeoKnowledge USA, Inc.
ESRI PUG – Houston, Texas – April 4, 2006 12 of 29
A play element …
… is an area within a play that characterizes one of the regional controls.
Salaverry BasinEocene Part Plays
Salaverry BasinSource Play Element
The previous map shows three part plays that were produced by intersecting maps for each of the regional controls – source, reservoir, seal, trap, etc. The map in this slide shows the regional variation in just one of those “play elements” – in this case, source. The following slides detail the GIS-aided process that was used to map each play element and the final part-play map.

GIS-Aided Play Assessment of Several Basins in Offshore Peru Tarek Ghazi – GeoKnowledge USA, Inc.
ESRI PUG – Houston, Texas – April 4, 2006 13 of 29
Play Element Mapping
1. Georeference contour map2. Import map grid to GIS raster3. Classify raster4. Filter raster5. Convert raster to polygons6. Dissolve selected polygons7. Intersect with other play elements8. Classify the intersection9. Reclassify and dissolve final result
The play element mapping process breaks down into these nine steps. Most of them require some geologic interpretation and experimentation, which might necessitate several iterations before moving to the next step.

GIS-Aided Play Assessment of Several Basins in Offshore Peru Tarek Ghazi – GeoKnowledge USA, Inc.
ESRI PUG – Houston, Texas – April 4, 2006 14 of 29
1. Georeference contour map
• GIF preserves color
• No “pyramids”
• Save the reference points to a file
Salaverry BasinCretaceous (Source)
Isopach
0-500
751-1,000501-750
1,001+
meters
The first step is to import and georeference an image of the original structure or isopach map that describes the play element. This example is the isopach map that represents the thickness of the prospective source interval in this play. The three bullets are tips for importing and georeferencing these images.

GIS-Aided Play Assessment of Several Basins in Offshore Peru Tarek Ghazi – GeoKnowledge USA, Inc.
ESRI PUG – Houston, Texas – April 4, 2006 15 of 29
2. Import map grid to GIS raster
• Export tabbed X,Y,Z from G&G system
• Edit “X Y Z” as first line
• “Add XY Data”
• Convert to raster
• Check against georeferencedoriginal map
Salaverry BasinCretaceous (Source)
Isopach
Step 2 is to import the grid that corresponds to the map image from Step 1, and to convert it to a raster using the Spatial Analyst. Flip back and forth between the colored raster and the georeference map to confirm that the raster matches the original data.
GIS-Aided Play Assessment of Several Basins in Offshore Peru Tarek Ghazi – GeoKnowledge USA, Inc.
ESRI PUG – Houston, Texas – April 4, 2006 16 of 29
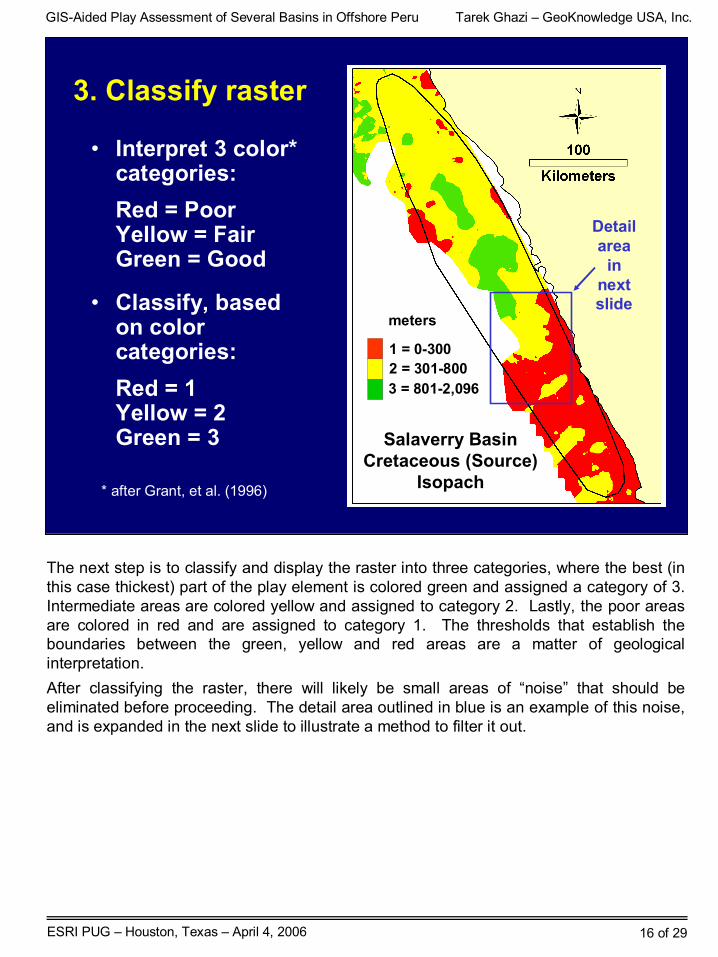
3. Classify raster
• Interpret 3 color* categories:Red = PoorYellow = FairGreen = Good
• Classify, based on color categories:Red = 1Yellow = 2Green = 3 Salaverry Basin
Cretaceous (Source)Isopach
1 = 0-3002 = 301-8003 = 801-2,096
meters
* after Grant, et al. (1996)
Detail area
in next slide
The next step is to classify and display the raster into three categories, where the best (in this case thickest) part of the play element is colored green and assigned a category of 3. Intermediate areas are colored yellow and assigned to category 2. Lastly, the poor areas are colored in red and are assigned to category 1. The thresholds that establish the boundaries between the green, yellow and red areas are a matter of geological interpretation.After classifying the raster, there will likely be small areas of “noise” that should be eliminated before proceeding. The detail area outlined in blue is an example of this noise, and is expanded in the next slide to illustrate a method to filter it out.

GIS-Aided Play Assessment of Several Basins in Offshore Peru Tarek Ghazi – GeoKnowledge USA, Inc.
ESRI PUG – Houston, Texas – April 4, 2006 17 of 29
4. Filter raster • MajorityFilter with Raster Calculator• “Four” adjacent cells, and “Half” option.• Run several times for maximum benefit.
Before After
The Majority Filter helps erase the noise by replacing the values of the isolated cells with the value of the neighboring cells. There are several options for this filter. The right combination of options and the appropriate number of filtering iterations is again a matter of geological interpretation.

GIS-Aided Play Assessment of Several Basins in Offshore Peru Tarek Ghazi – GeoKnowledge USA, Inc.
ESRI PUG – Houston, Texas – April 4, 2006 18 of 29
5. Convert raster to polygons
• Maintain in a geodatabase for automatic perimeter and area
Salaverry BasinCretaceous (Source)
Isopach
The remaining steps of the play element mapping process operate on polygons, rather than rasters, so it is necessary at this point to convert the filtered raster into polygons using the Convert function in the Spatial Analyst. Keep those polygons and all subsequent data in a geodatabase to simplify data management and to take advantage of the automatic calculation of area and perimeter attributes.

GIS-Aided Play Assessment of Several Basins in Offshore Peru Tarek Ghazi – GeoKnowledge USA, Inc.
ESRI PUG – Houston, Texas – April 4, 2006 19 of 29
6. Dissolve selected polygons
• Intersected with basin outline first
• Edit classification attribute
• Dissolve based on edited classification attribute
Salaverry BasinCretaceous (Source)
Isopach
Flip back and forth between this slide and the previous one to see the effect of dissolving some of the smaller polygons in this step. As in most of the steps, which ones you choose to dissolve is subject to geological interpretation. In this case, all of the polygons that were smaller than the minimum prospect size were dissolved. The procedure is to sort the polygon area attribute in ascending order and then inspect each one to decide whether or not to change the classification attribute to match the neighboring polygon(s). Once those decisions are made, the Dissolve function (based on the classification attribute) is used to erase the small polygons.

GIS-Aided Play Assessment of Several Basins in Offshore Peru Tarek Ghazi – GeoKnowledge USA, Inc.
ESRI PUG – Houston, Texas – April 4, 2006 20 of 29
7. Intersect with other play elements
Source Thickness Source Maturity Thickness + Maturity
Up to now, we have been looking at the source thickness play element only. We would perform Steps 1-6 on other maps, like source maturity, to produce the other components that we intend to combine into an overall map of source adequacy. In Step 7, we intersect all of the component play element maps to produce the overall map. The example in this slide shows the intersection of source thickness and maturity.
GIS-Aided Play Assessment of Several Basins in Offshore Peru Tarek Ghazi – GeoKnowledge USA, Inc.
ESRI PUG – Houston, Texas – April 4, 2006 21 of 29
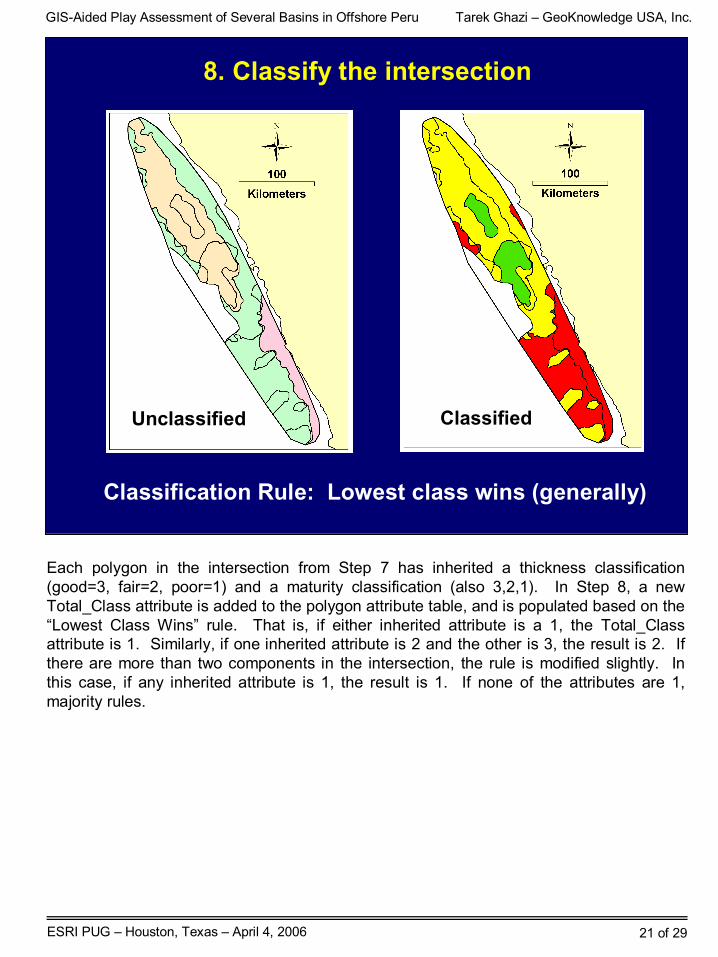
8. Classify the intersection
Unclassified Classified
Classification Rule: Lowest class wins (generally)
Each polygon in the intersection from Step 7 has inherited a thickness classification (good=3, fair=2, poor=1) and a maturity classification (also 3,2,1). In Step 8, a new Total_Class attribute is added to the polygon attribute table, and is populated based on the “Lowest Class Wins” rule. That is, if either inherited attribute is a 1, the Total_Class attribute is 1. Similarly, if one inherited attribute is 2 and the other is 3, the result is 2. If there are more than two components in the intersection, the rule is modified slightly. In this case, if any inherited attribute is 1, the result is 1. If none of the attributes are 1, majority rules.
GIS-Aided Play Assessment of Several Basins in Offshore Peru Tarek Ghazi – GeoKnowledge USA, Inc.
ESRI PUG – Houston, Texas – April 4, 2006 22 of 29
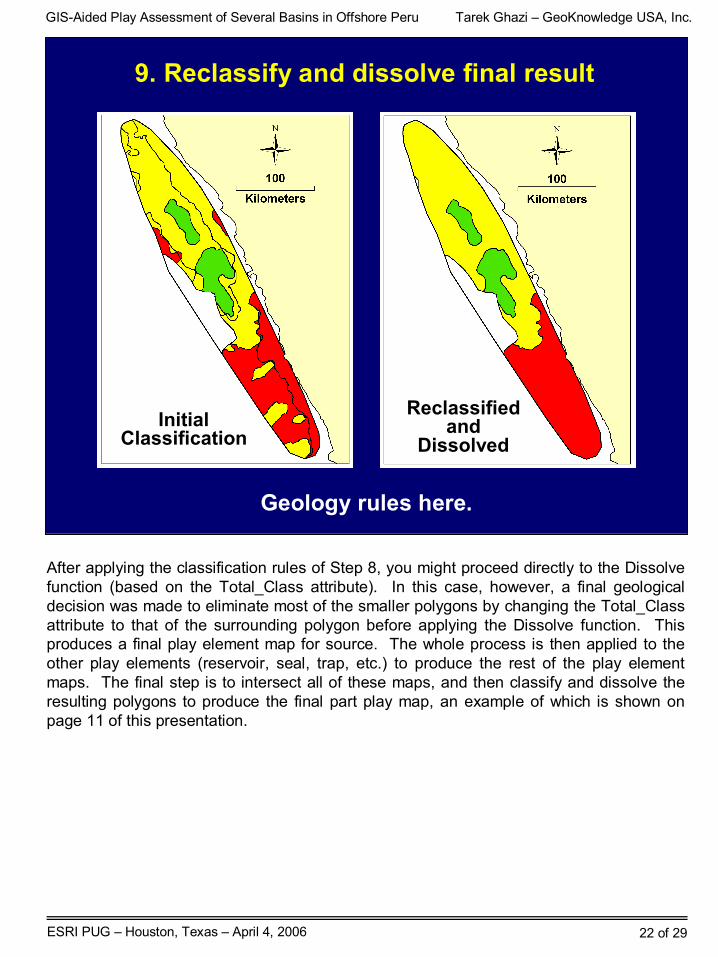
9. Reclassify and dissolve final result
Geology rules here.
Initial Classification
Reclassified and
Dissolved
After applying the classification rules of Step 8, you might proceed directly to the Dissolve function (based on the Total_Class attribute). In this case, however, a final geological decision was made to eliminate most of the smaller polygons by changing the Total_Class attribute to that of the surrounding polygon before applying the Dissolve function. This produces a final play element map for source. The whole process is then applied to the other play elements (reservoir, seal, trap, etc.) to produce the rest of the play element maps. The final step is to intersect all of these maps, and then classify and dissolve the resulting polygons to produce the final part play map, an example of which is shown on page 11 of this presentation.

GIS-Aided Play Assessment of Several Basins in Offshore Peru Tarek Ghazi – GeoKnowledge USA, Inc.
ESRI PUG – Houston, Texas – April 4, 2006 23 of 29
Outline
Where is Peru? What did we do?
What is a play? A play element?
GIS in play element mapping (a lot)
• GIS in feature counting and sizing (a little)
• GIS in visualizing the results (even less)
Most of this presentation has been devoted to the play element mapping process. However, the GIS is also useful in determining the size and number of prospects that might occur within the part play polygons. Of course, the GIS also helps in visualizing the final results of the play assessment. The remainder of this presentation provides a few quick examples of these other GIS applications in play assessment.

GIS-Aided Play Assessment of Several Basins in Offshore Peru Tarek Ghazi – GeoKnowledge USA, Inc.
ESRI PUG – Houston, Texas – April 4, 2006 24 of 29
GIS in Feature Counting
• Only green and yellow part plays
• Chop out known features
• Chop out dry tests
• Chop out seismic buffer
• What’s left is “postulated area”
Detail area in next slide
After determining the gross boundaries of the part plays, it is necessary to excise areas that correspond to known prospects (that are assessed separately), dry tests and a buffer around seismic lines or other data that have shown no prospective anomalies. What’s left is the net area over which additional “postulated accumulations” might occur. This example map shows the net postulated area for the Salaverry Eocene Carbonate play. The detail area in red contains two large parts of the postulated area that will be useful in the next slide in determining a maximum number of postulated accumulations in the play.

GIS-Aided Play Assessment of Several Basins in Offshore Peru Tarek Ghazi – GeoKnowledge USA, Inc.
ESRI PUG – Houston, Texas – April 4, 2006 25 of 29
GIS in Feature Counting
• Determine “large trap minimum”
• Stuff as many as you can in the best areas you have
• Calculate ratio of area in features vs. total area
• Apply judiciously Area in Features = 30 km2 x 12 = 360 km2
Total Area = 774 km2
Ratio = 0.47
Having determined the net postulated area in the previous step, the question becomes, “How many postulated accumulations might occur in the net area?” To answer this question, we first must determine the minimum size of feature that we are interested in counting in our assessment. In this case the “large trap minimum” is 30 km2. Next, we use the GIS to position as many of these minimum-sized features in the largest contiguous pieces of net postulated area, to estimate a ratio of postulated feature area vs. total area. Multiplying this ratio times the total net postulated area and dividing by the large trap minimum will yield the maximum possible number of postulated features. Use this maximum to limit the probability density function that you choose for the number of postulated features. Remember that this method yields an absolute maximum, with a negligible chance of occurring. You may choose to use a lower maximum, if the higher maximum appears geologically unreasonable.

GIS-Aided Play Assessment of Several Basins in Offshore Peru Tarek Ghazi – GeoKnowledge USA, Inc.
ESRI PUG – Houston, Texas – April 4, 2006 26 of 29
GIS in Feature Sizing
• What is the biggest feature that you can stuff into the largest no-data area?
• Regardless of other statistics, you can’t get anything bigger than that. Otherwise, you would have seen it on the seismic.
Area in Largest Feature = 190 km2
Having determined a reasonable range of number of postulated features, the final question becomes, “How big might the postulated accumulations be?” To answer that question we will use the same example area as in the previous two slides, but this time we are determining the maximum size of feature that fits within the largest contiguous part of the net postulated area. In this example, the largest feature that will fit between the seismic line buffer areas is 190 km2. Here again, this represents an absolute maximum area. If it were any bigger, it would have appeared on at least one seismic line. As always, if this maximum area appears geologically unreasonable, you are free to use a smaller number.
GIS-Aided Play Assessment of Several Basins in Offshore Peru Tarek Ghazi – GeoKnowledge USA, Inc.
ESRI PUG – Houston, Texas – April 4, 2006 27 of 29
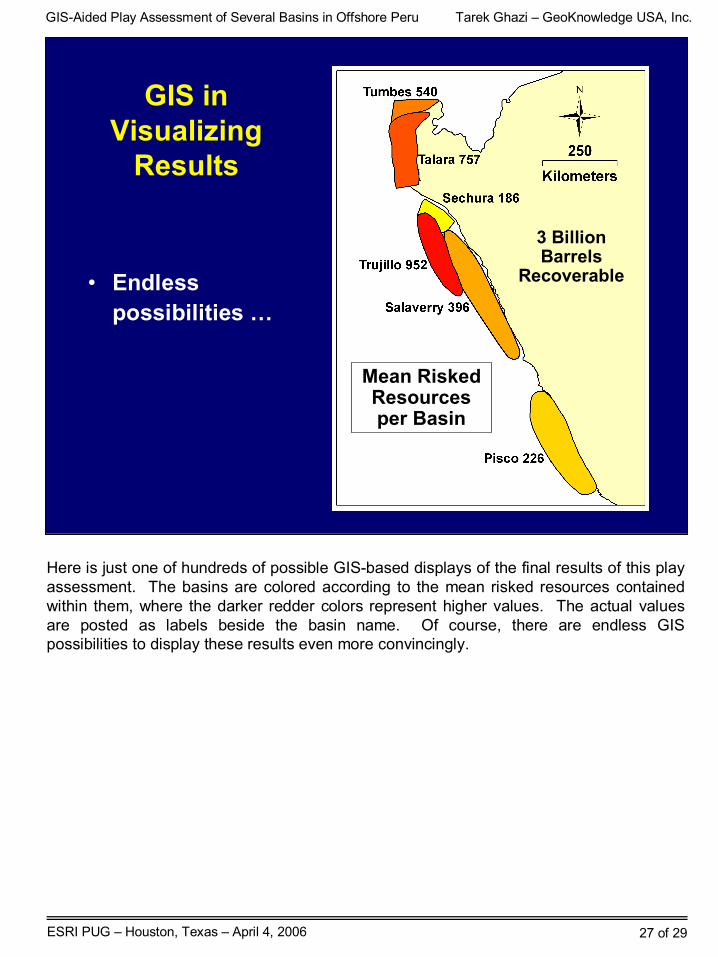
GIS in Visualizing
Results
• Endless possibilities …
Mean Risked Resources per Basin
3 Billion Barrels
Recoverable
Here is just one of hundreds of possible GIS-based displays of the final results of this play assessment. The basins are colored according to the mean risked resources contained within them, where the darker redder colors represent higher values. The actual values are posted as labels beside the basin name. Of course, there are endless GIS possibilities to display these results even more convincingly.
GIS-Aided Play Assessment of Several Basins in Offshore Peru Tarek Ghazi – GeoKnowledge USA, Inc.
ESRI PUG – Houston, Texas – April 4, 2006 28 of 29
References
• Grant, S., Milton, N., and Thompson, M., 1996, “Play fairway analysis and risk mapping: an example using the Middle Jurassic Brent Group in the northern North Sea” in Quantification and Prediction of Petroleum Resources, edited by A.G. Doré and R. Sinding-Larsen, NPF (Norwegian Petroleum Society) Special Publication 6, pp. 167-181, Elsevier
• “Sequence Stratigraphy Analysis of the Peruvian Offshore Continental Shelf-Slope,” 2005, prepared for Perupetro S. A. by Gaffney, Cline & Associates, and funded by the USTDA. Copies available upon request to and subject to approval by Perupetro (http://www.systemdigital.com/peru/pdf/Offshore%20Basins%20Summary.pdf)
The green-yellow-red “traffic-light” style of play element mapping has been described most recently in the first reference in this slide. If you are interested in more detail about the prospectivity of offshore Peru, the original framework study (the second reference) is available from Perupetro. The results of the play assessment shown in this presentation will also be available shortly from Perupetro.

GIS-Aided Play Assessment of Several Basins in Offshore Peru Tarek Ghazi – GeoKnowledge USA, Inc.
ESRI PUG – Houston, Texas – April 4, 2006 29 of 29
Thank You!
• Tarek Ghazi• Technical Director – Play Assessment Solutions• [email protected]• Work: (832) 252-7624 ext. 12• Cell: (281) 639-2028
If you have any questions or comments, especially about how the play element mapping process might be improved and/or automated, please feel free to contact the author. Also, please note that the material presented here is solely the opinion of this author, and has not been reviewed, nor has it been endorsed by anyone else, including (but not limited to) GeoKnowledge, the USTDA, Perupetro, Gaffney, Cline & Associates and the original framework team.