gis best practices for non-governmental organizations · 2012-09-18 · gis technology enables...
TRANSCRIPT
NongovernmentalOrganizations
GIS Best PracticesApril 2010
i
Table of Contents
What Is GIS? 1
Introduction 3
Part I: NGOs Helping the Environment
Disease Causing Steep Decline of Bats 7
Conserving the Land of Napa County, California 13
Discovering Gems of Wildlife Viewing 17
Supporting Island Land Conservation 21
Using GIS to Remedy Coal Mining's Aftermath 25
Part 2: NGOs Helping Society
Restoring Angola's Electricity Network 31
Hopeworks Founder Father Jeff Putthoff EncouragesYouth Development with Technology Training 35
Constructing a Community Water System in Laos 39
Ghana Project Leverages GIS-Based Title Registrationand Microfi nance to Alleviate Poverty 45
Early Warning Planning for Mosquito-Borne Epidemics 53
There's No Place Like Close to Home 57
GIS BEST PRACTICES 1 WWW.ESRI.COM
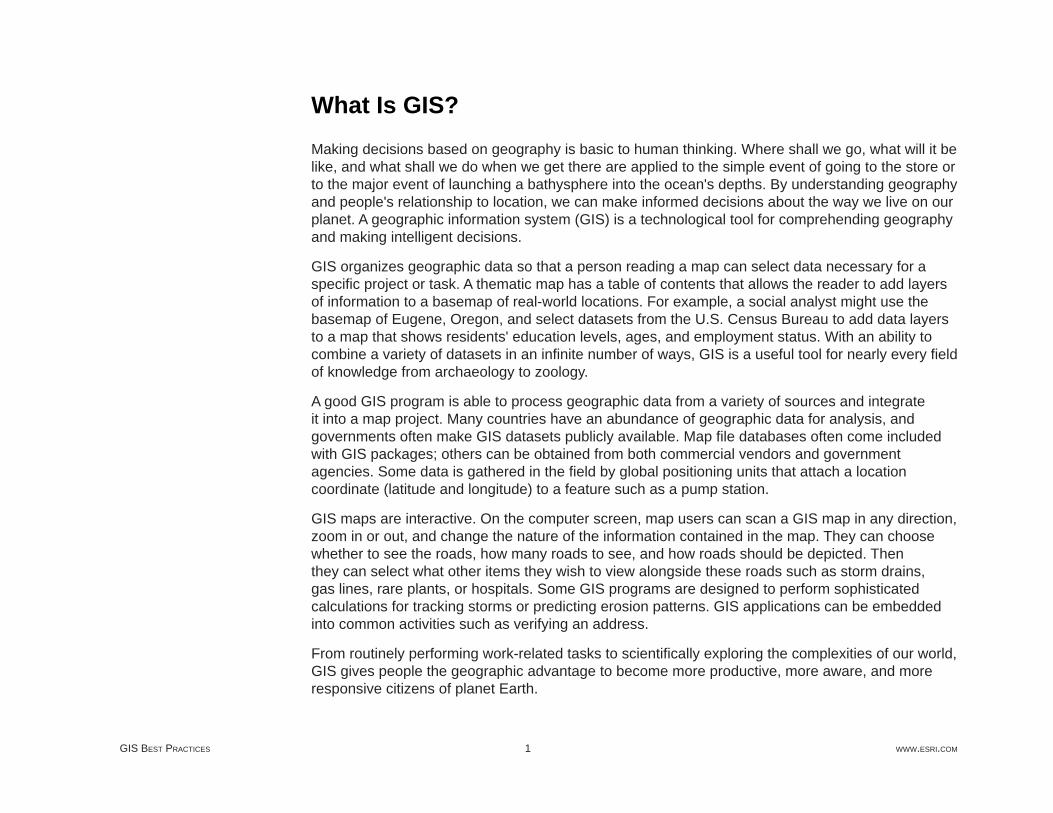
What Is GIS?Making decisions based on geography is basic to human thinking. Where shall we go, what will it be like, and what shall we do when we get there are applied to the simple event of going to the store or to the major event of launching a bathysphere into the ocean's depths. By understanding geography and people's relationship to location, we can make informed decisions about the way we live on our planet. A geographic information system (GIS) is a technological tool for comprehending geography and making intelligent decisions.
GIS organizes geographic data so that a person reading a map can select data necessary for a specifi c project or task. A thematic map has a table of contents that allows the reader to add layers of information to a basemap of real-world locations. For example, a social analyst might use the basemap of Eugene, Oregon, and select datasets from the U.S. Census Bureau to add data layers to a map that shows residents' education levels, ages, and employment status. With an ability to combine a variety of datasets in an infi nite number of ways, GIS is a useful tool for nearly every fi eld of knowledge from archaeology to zoology.
A good GIS program is able to process geographic data from a variety of sources and integrate it into a map project. Many countries have an abundance of geographic data for analysis, and governments often make GIS datasets publicly available. Map fi le databases often come included with GIS packages; others can be obtained from both commercial vendors and government agencies. Some data is gathered in the fi eld by global positioning units that attach a location coordinate (latitude and longitude) to a feature such as a pump station.
GIS maps are interactive. On the computer screen, map users can scan a GIS map in any direction, zoom in or out, and change the nature of the information contained in the map. They can choose whether to see the roads, how many roads to see, and how roads should be depicted. Then they can select what other items they wish to view alongside these roads such as storm drains, gas lines, rare plants, or hospitals. Some GIS programs are designed to perform sophisticated calculations for tracking storms or predicting erosion patterns. GIS applications can be embedded into common activities such as verifying an address.
From routinely performing work-related tasks to scientifi cally exploring the complexities of our world, GIS gives people the geographic advantage to become more productive, more aware, and more responsive citizens of planet Earth.
GIS BEST PRACTICES 3 WWW.ESRI.COM
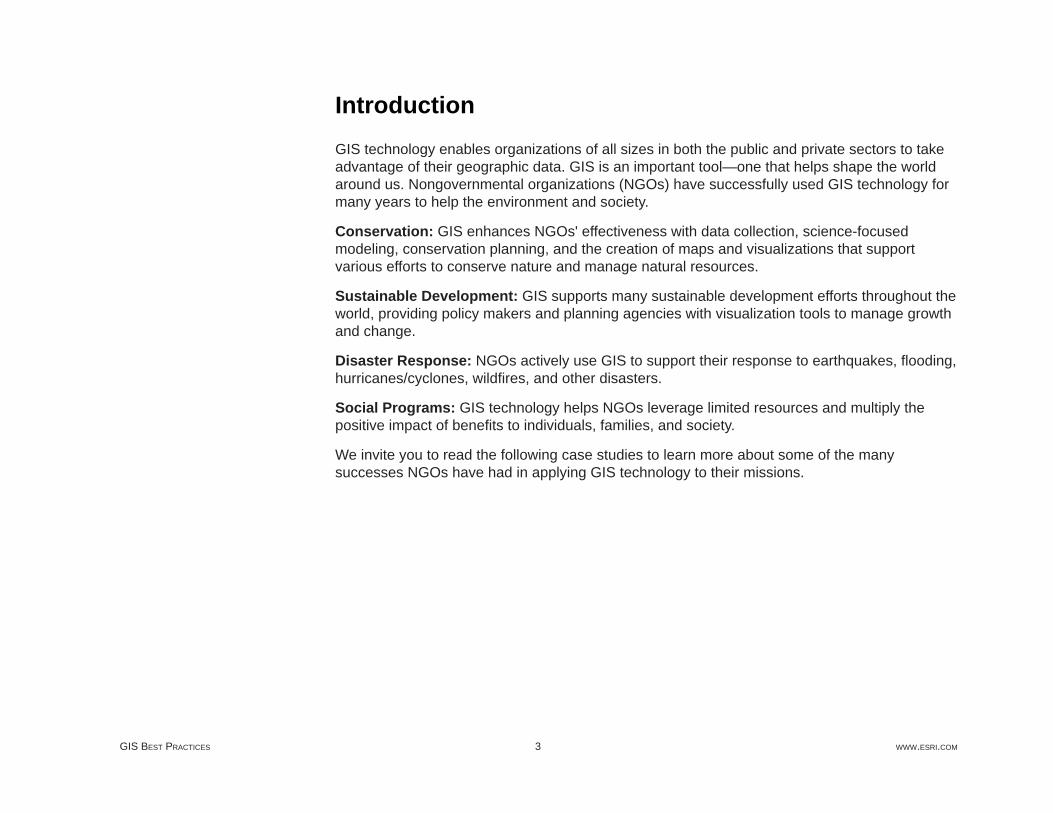
IntroductionGIS technology enables organizations of all sizes in both the public and private sectors to take advantage of their geographic data. GIS is an important tool—one that helps shape the world around us. Nongovernmental organizations (NGOs) have successfully used GIS technology for many years to help the environment and society.
Conservation: GIS enhances NGOs' effectiveness with data collection, science-focused modeling, conservation planning, and the creation of maps and visualizations that support various efforts to conserve nature and manage natural resources.
Sustainable Development: GIS supports many sustainable development efforts throughout the world, providing policy makers and planning agencies with visualization tools to manage growth and change.
Disaster Response: NGOs actively use GIS to support their response to earthquakes, fl ooding, hurricanes/cyclones, wildfi res, and other disasters.
Social Programs: GIS technology helps NGOs leverage limited resources and multiply the positive impact of benefi ts to individuals, families, and society.
We invite you to read the following case studies to learn more about some of the many successes NGOs have had in applying GIS technology to their missions.
Part 1: NGOs Helping the Environment
WWW.ESRI.COMGIS BEST PRACTICES 7
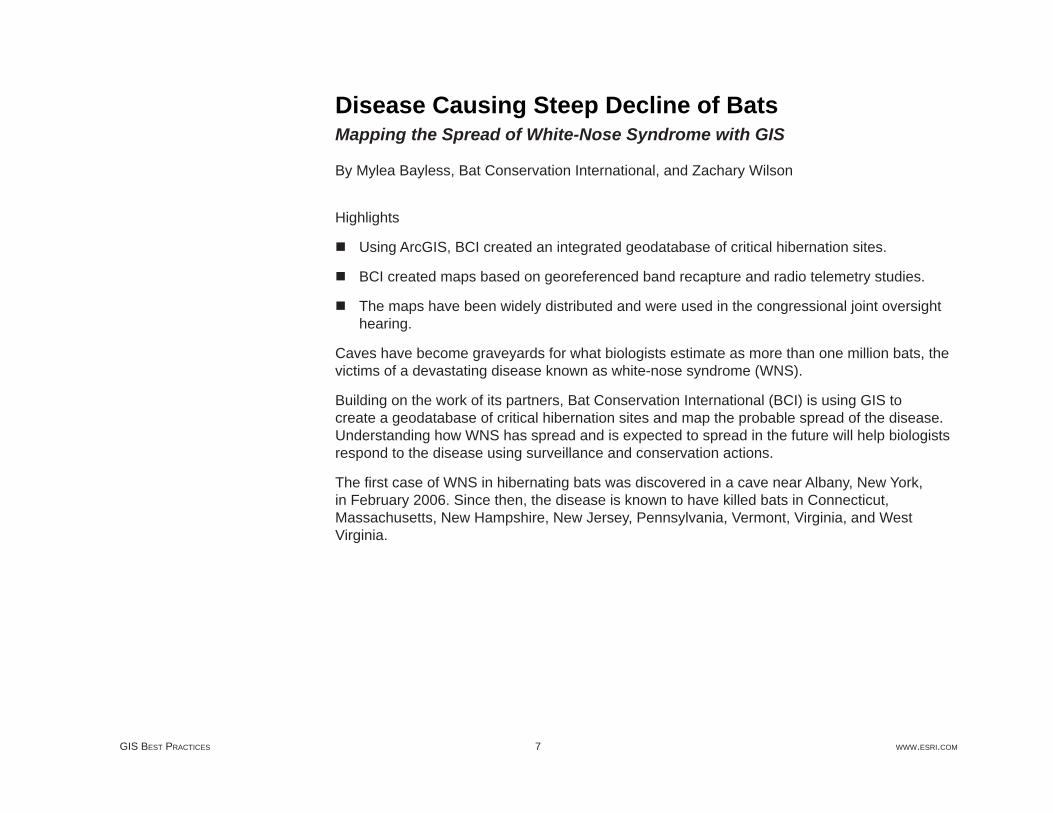
Disease Causing Steep Decline of BatsMapping the Spread of White-Nose Syndrome with GIS
By Mylea Bayless, Bat Conservation International, and Zachary Wilson
Highlights
Using ArcGIS, BCI created an integrated geodatabase of critical hibernation sites.
BCI created maps based on georeferenced band recapture and radio telemetry studies.
The maps have been widely distributed and were used in the congressional joint oversight hearing.
Caves have become graveyards for what biologists estimate as more than one million bats, the victims of a devastating disease known as white-nose syndrome (WNS).
Building on the work of its partners, Bat Conservation International (BCI) is using GIS to create a geodatabase of critical hibernation sites and map the probable spread of the disease. Understanding how WNS has spread and is expected to spread in the future will help biologists respond to the disease using surveillance and conservation actions.
The fi rst case of WNS in hibernating bats was discovered in a cave near Albany, New York, in February 2006. Since then, the disease is known to have killed bats in Connecticut, Massachusetts, New Hampshire, New Jersey, Pennsylvania, Vermont, Virginia, and West Virginia.
APRIL 2010 8 NONGOVERNMENTAL ORGANIZATIONS
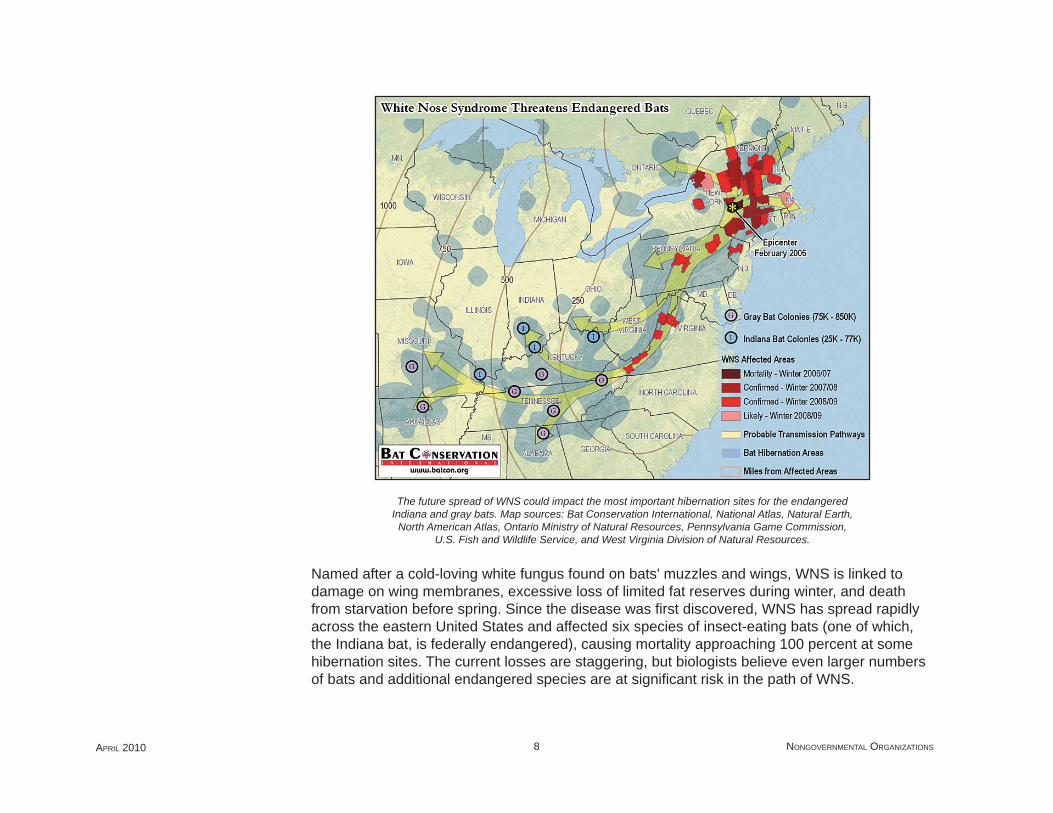
The future spread of WNS could impact the most important hibernation sites for the endangered Indiana and gray bats. Map sources: Bat Conservation International, National Atlas, Natural Earth,
North American Atlas, Ontario Ministry of Natural Resources, Pennsylvania Game Commission, U.S. Fish and Wildlife Service, and West Virginia Division of Natural Resources.
Named after a cold-loving white fungus found on bats' muzzles and wings, WNS is linked to damage on wing membranes, excessive loss of limited fat reserves during winter, and death from starvation before spring. Since the disease was fi rst discovered, WNS has spread rapidly across the eastern United States and affected six species of insect-eating bats (one of which, the Indiana bat, is federally endangered), causing mortality approaching 100 percent at some hibernation sites. The current losses are staggering, but biologists believe even larger numbers of bats and additional endangered species are at signifi cant risk in the path of WNS.

GIS BEST PRACTICES 9 WWW.ESRI.COM
BCI, a nonprofi t organization based in Austin, Texas, is committed to conserving bats and their ecosystems through worldwide partnerships, research, management, education, and outreach. Most North American bat species feed on night-fl ying insect pests that impact forests, agriculture, and human health. Globally, bats provide countless millions of dollars of ecosystem services, including insect/pest management, pollination, seed dispersal, and growing ecotourism appeal. Bats exist in every biome on earth except the extreme Arctic and Antarctic regions and are vital to maintaining balance in ecosystems. More than 1,100 species of bats worldwide account for nearly 20 percent of all mammal species, yet they are poorly studied and often neglected in conservation planning, leaving many bat species endangered or threatened with extinction. Now bats face another threat, WNS, which is causing the most precipitous decline of North American wildlife in recorded history. Such losses alone are expected to have unprecedented consequences on ecosystem health throughout North America, with unknown economic consequences.
GIS technology is helping biologists better understand the spread of WNS. Spatial analysis of currently affected areas and potential future spread is necessary for focusing efforts to raise awareness and promote preparedness. For example, states within the path of WNS will likely develop WNS surveillance plans and adjust their budgets to plan for the cost of a WNS response. BCI has a long history of working with state and federal agencies planning bat conservation activities but has never had in-house GIS capabilities. A few past projects have focused on developing geospatial datasets, but no long-term plan was in place for establishing GIS as part of day-to-day operations. In October 2008, BCI applied for and received an ESRI conservation grant for ArcGIS software to support its new strategic plan to spatially enable the organization.
As WNS has progressed, Cal Butchkowski of the Pennsylvania Game Commission has used GIS to compile reports into a comprehensive map showing WNS-affected counties across the northeastern United States. Affected sites have been aggregated at the county level to protect sensitive cave and mine location information. Butchkowski's maps clearly show the spread of WNS across the landscape.
BCI's conservation mission led to additional questions about the future spread of WNS and the threat it posed. BCI became concerned that WNS could reach hibernation sites housing the largest numbers of endangered Indiana (Myotis sodalis) and gray (Myotis grisescens) bats in the United States, but the organization did not have the data necessary to visualize the potential risk. Colleagues at the Pennsylvania Game Commission, U.S. Fish and Wildlife Service,
Why We Need to Protect Bats
GIS—An Essential Tool for Understanding WNS
APRIL 2010 10 NONGOVERNMENTAL ORGANIZATIONS
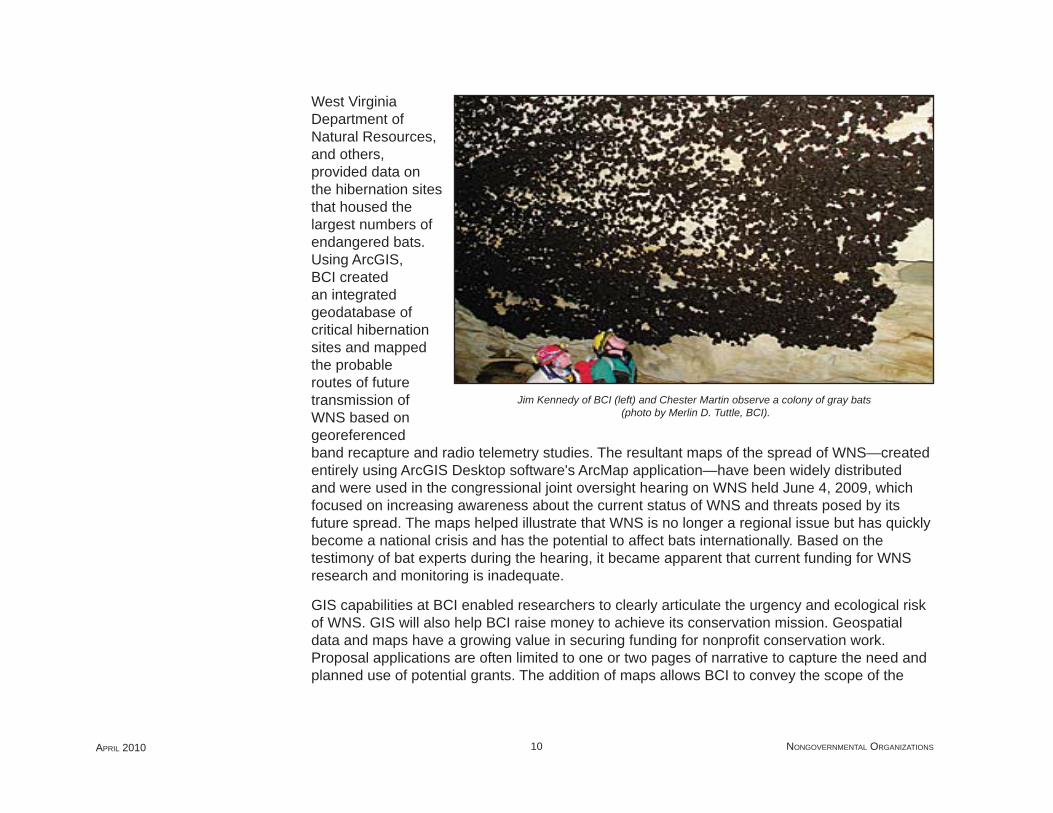
West Virginia Department of Natural Resources, and others, provided data on the hibernation sites that housed the largest numbers of endangered bats. Using ArcGIS, BCI created an integrated geodatabase of critical hibernation sites and mapped the probable routes of future transmission of WNS based on georeferenced band recapture and radio telemetry studies. The resultant maps of the spread of WNS—created entirely using ArcGIS Desktop software's ArcMap application—have been widely distributed and were used in the congressional joint oversight hearing on WNS held June 4, 2009, which focused on increasing awareness about the current status of WNS and threats posed by its future spread. The maps helped illustrate that WNS is no longer a regional issue but has quickly become a national crisis and has the potential to affect bats internationally. Based on the testimony of bat experts during the hearing, it became apparent that current funding for WNS research and monitoring is inadequate.
GIS capabilities at BCI enabled researchers to clearly articulate the urgency and ecological risk of WNS. GIS will also help BCI raise money to achieve its conservation mission. Geospatial data and maps have a growing value in securing funding for nonprofi t conservation work. Proposal applications are often limited to one or two pages of narrative to capture the need and planned use of potential grants. The addition of maps allows BCI to convey the scope of the
Jim Kennedy of BCI (left) and Chester Martin observe a colony of gray bats (photo by Merlin D. Tuttle, BCI).
GIS BEST PRACTICES 11 WWW.ESRI.COM
problem and work area at a glance without exceeding space constraints for the proposal text. The future opportunities GIS will bring to BCI are exciting, both to explore conservation issues and articulate BCI's mission.
Mylea Bayless is a conservation biologist who focuses on white-nose syndrome, southeastern rare bats, and bats in bridges. Zachary Wilson is an independent GIS consultant.
BCI graciously acknowledges the support and investment of its many partners and funders—including the Benefi cia Foundation, the Department of Defense Legacy Program, Disney's Rapid Response Fund, the Kabcenell Foundation, the National Fish and Wildlife Foundation, the National Park Service, the Nina Mason Pulliam Charitable Trust, the U.S. Fish and Wildlife Service, the U.S. Geological Survey, the Wallace Global Fund, ESRI, and other numerous state and federal agencies responsible for managing our nation's wildlife. The following links provide the latest information on white-nose syndrome: www.batcon.org/wns, www.fws.gov/northeast/white_nose.html, www.nwhc.usgs.gov/disease_information/ white-nose_syndrome, and www .fort.usgs.gov/WNS.
(Reprinted from the Winter 2009/2010 issue of ArcNews magazine)
About the Authors
More Information
GIS BEST PRACTICES 13 WWW.ESRI.COM
Conserving the Land of Napa County, CaliforniaA Nonprofi t Organization's GIS Success Story
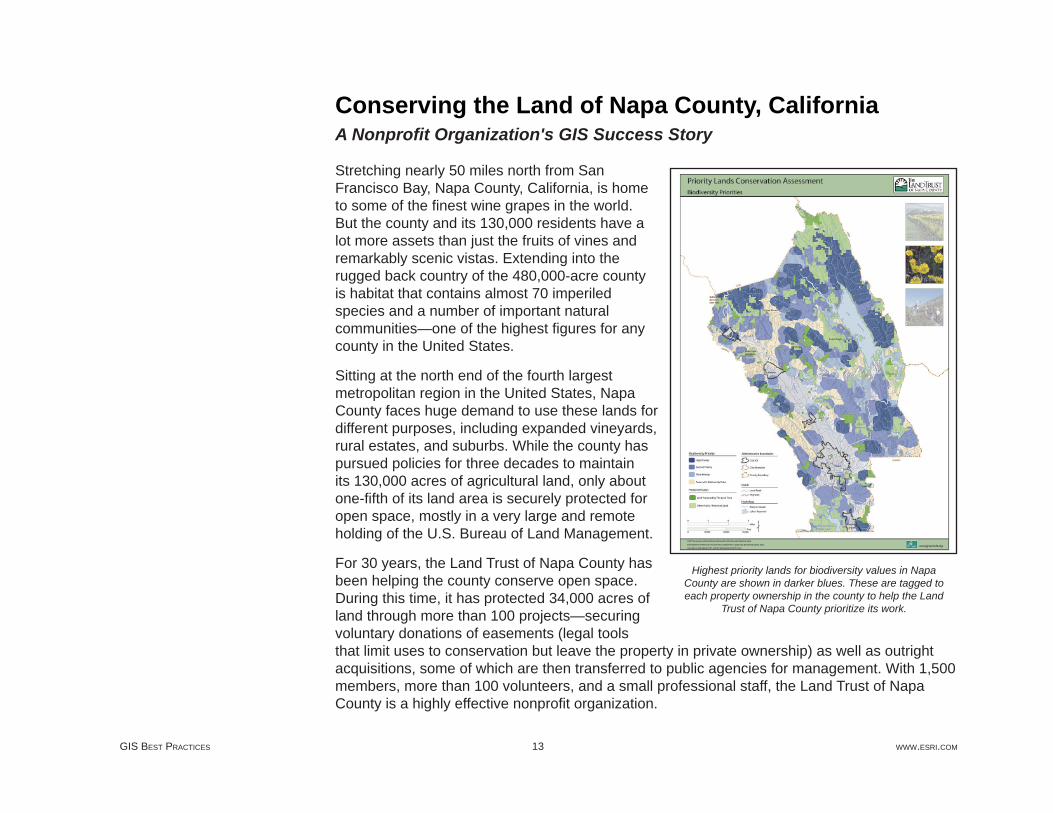
Stretching nearly 50 miles north from San Francisco Bay, Napa County, California, is home to some of the fi nest wine grapes in the world. But the county and its 130,000 residents have a lot more assets than just the fruits of vines and remarkably scenic vistas. Extending into the rugged back country of the 480,000-acre county is habitat that contains almost 70 imperiled species and a number of important natural communities—one of the highest fi gures for any county in the United States.
Sitting at the north end of the fourth largest metropolitan region in the United States, Napa County faces huge demand to use these lands for different purposes, including expanded vineyards, rural estates, and suburbs. While the county has pursued policies for three decades to maintain its 130,000 acres of agricultural land, only about one-fi fth of its land area is securely protected for open space, mostly in a very large and remote holding of the U.S. Bureau of Land Management.
For 30 years, the Land Trust of Napa County has been helping the county conserve open space. During this time, it has protected 34,000 acres of land through more than 100 projects—securing voluntary donations of easements (legal tools that limit uses to conservation but leave the property in private ownership) as well as outright acquisitions, some of which are then transferred to public agencies for management. With 1,500 members, more than 100 volunteers, and a small professional staff, the Land Trust of Napa County is a highly effective nonprofi t organization.
Highest priority lands for biodiversity values in Napa County are shown in darker blues. These are tagged to each property ownership in the county to help the Land
Trust of Napa County prioritize its work.
APRIL 2010 14 NONGOVERNMENTAL ORGANIZATIONS
The Land Trust has actively used GIS in almost all elements of its work. Developing display maps, analyzing landscapes to set priorities, and helping with outreach and fund-raising have all evolved over many years in response to needs and the capacity of GIS. Beginning in the late 1990s, the Land Trust adopted ArcView as its GIS and trained one of its staff members in its use. The Land Trust also engaged the nonprofi t GreenInfo Network (San Francisco, California) to help assemble data, develop basic display maps, and become an ongoing partner in its work. ArcGIS Desktop (ArcView) software was chosen because of its dominance in land management tasks and agencies and ESRI's wider support for conservation organizations.
One of the fi rst projects this team completed using ArcView was a display poster, showing the land holdings and other protected areas. This poster has continually been updated and improved and is now maintained using ArcGIS Desktop.
In 2003, the Land Trust of Napa County took a major step forward with GIS. Working with a planning consultant, Tina Stott, it developed a plan to set key priorities for its future conservation work. It commissioned the Nature Conservancy and its partner, NatureServe (www.natureserve .org), to apply an innovative conservation planning tool, Vista (formerly Project Aldo), to better assess biodiversity. The Vista tool is now an extension to ArcGIS. NatureServe worked with new and highly detailed vegetation data developed by the Institute for California's Environment, University of California, Davis. The Nature Conservancy and NatureServe used ArcView and ArcInfo to identify key landscape linkages that would maintain the composition, structure, and vitality of important ecological systems in the county. Endangered, threatened, or declining terrestrial or aquatic species were also identifi ed as targets for protection. Based on this, protection priorities were set using the conservation values and measures of vulnerability to development. All of this data was correlated to ownership boundaries provided by the county of Napa, allowing the Land Trust to understand not only the ecological character of the landscape but also the nature of each landowner's holdings.
GreenInfo Network then worked with the trust's team to apply ArcView and ArcGIS Spatial Analyst to defi ne scenic zones, agricultural areas, and needed recreational lands and to design the maps that would convey this information to the trust's stakeholders and the public. All of this information was published in a special report that set the trust's future direction for the next 10 years.
GIS BEST PRACTICES 15 WWW.ESRI.COM
In another effort, in late 2005, the Land Trust applied GIS to a particular opportunity, a large ranch that was up for sale. The GIS team applied the ArcGIS Spatial Analyst extension to analyze other properties that were in the viewshed of the proposed acquisition to help the Land Trust identify other owners who might be approached for donations to support protecting the ranch.
The Land Trust of Napa County has an ambitious goal to save an additional 17,000 acres of land by 2010.
For more information, visit the Land Trust of Napa County at www.napalandtrust.org. For more information on Vista, visit www.natureserve.org. For more information about GreenInfo Network, visit www.greeninfo.org.
(Reprinted from the Summer 2006 issue of ArcNews magazine)
More Information
GIS BEST PRACTICES 17 WWW.ESRI.COM
Discovering Gems of Wildlife ViewingNew Jersey Audubon Society Uses GIS to Create Trail Maps
Highlights
NJAS used ArcPad on a Pocket PC with a handheld GPS unit to collect trail information.
With ArcGIS Desktop, the staff easily provides trail updates and changes in land use or features.
The ArcGIS Desktop editing feature allowed NJAS to smooth trail lines and add attribute table information.
New Jersey Audubon Society (NJAS), a nonprofi t environmental organization, is dedicated to fostering an environmental awareness and a conservation ethic among New Jersey's citizens. With 36 wildlife sanctuaries, many of them right in people's own "backyards," these mostly undiscovered gems offer a number of wildlife viewing experiences for New Jersey residents. So what is the best way to get people out and to try nature? Provide accurate maps to help make the experience enjoyable. Maps that identify trail length, highlights, and cautions remove fear of the unknown and encourage a little exploration. In addition, by mapping the sanctuaries, NJAS is able to highlight places to see rare wildlife and habitats, as well as identify areas that should be closed due to the presence of threatened or endangered species. While NJAS's nine staffed sanctuaries have been successful in getting people out on the trail, the unstaffed properties remain open but largely unused. NJAS's task? To bring these ecological gems to the attention of New Jersey residents and encourage passive recreation.
It rapidly became apparent that simply publicizing the sanctuaries was not enough. These sites have hiking trails that meander through grassland, forest, and wetland habitat. Many sites have trails in rugged terrain, while other locations offer a simple, relaxing walk suitable for small children. A few of the sanctuaries had hand-drawn maps, but these were dated and generally lacked suffi cient detail in terms of demonstrating unique habitat features as well as trail length and the ruggedness of the terrain. The system was clearly in need of an overhaul. The solution was to create computer-generated maps that not only show hiking trails but also offer relevant feature information about each sanctuary.

APRIL 2010 18 NONGOVERNMENTAL ORGANIZATIONS
This trail map was created by the Scherman-Hoffman Wildlife Sanctuary. As many New Jersey Audubon Society (NJAS) sanctuaries are adjacent to
state or national parks, connector trails are included so that visitors may easily expand their hikes. This map highlights vernal pools and
similar landscape features to enhance nature walks.
NJAS had experience with ArcView and found that ESRI's upgrade to ArcGIS Desktop provided even better mapping capability to help it achieve its goal. The staff was also able to use ArcGIS Desktop to incorporate New Jersey State Department of Environmental Protection shapefi les,
GIS BEST PRACTICES 19 WWW.ESRI.COM
specifi cally elevation, land-cover types, streams, political boundaries, roads, and sensitive wildlife habitat layers. Parcel boundaries were either generated using tax maps or uploaded from municipal GIS sites.
To acquire trail and specifi c feature information not available as a GIS data layer, NJAS used ArcPad on a Pocket PC with a handheld GPS unit connection for satellite reception. Staff members walked each property with hiking trails or where trails were being developed while recording trail information in ArcPad. They collected site-specifi c data, such as parking, sanctuary nature center (where appropriate), overlooks, vernal pools, pollinator meadows, trail benches, and unique historical features. Using ArcPad and being on-site also gave staff the ability to map potential hazards, such as surface mines, using this accurately pinpointed information to refl ect areas as closed or show caution.
Back at the offi ce, staff uploaded all the data into ArcGIS Desktop, and some amount of postprocessing was required. The editing feature allowed NJAS to smooth trail lines and add attribute table information, such as trail name, length, and description. To complete the map, NJAS included some additional data layers, such as elevation and parcels. Some additional postprocessing using New Jersey aerial imagery allowed staff to be more specifi c about certain landscape features (e.g., the presence of a small meadow in a forest) and, where applicable, other data layers, such as adjacent open space or state and federal parks. Once all data layers were set, staff members measured all trails for approximate trail length. Before the map layout was designed, they clipped the data layers so that only features within and immediately around the sanctuary boundary would be displayed. Then they manipulated the information for quick and easy visual interpretation.
To get the average person out on the trail, it is important to create a map with suffi cient content that is easy to read. To complete the fi nal map picture, each sanctuary trail was identifi ed with a brief description that included length, degree of diffi culty, highlights, and cautions. For consistency, most NJAS trail maps shared the same basic format and layout, with variations refl ective of special features of a particular property.
NJAS's mapping effort has allowed it to promote its 15 hikeable sanctuaries, covering more than 55 miles of trails, full of excellent opportunities for watching and learning about wildlife and wildlife habitats. Visitors now have all the necessary details to plan their trip, from estimating hiking time to the most appropriate footwear and the specifi cs on terrain—all this offering a good start to getting out and trying nature. These maps have been incorporated into a booklet that
APRIL 2010 20 NONGOVERNMENTAL ORGANIZATIONS
briefl y describes the history of each sanctuary, its fl ora and fauna, stewardship activities, and directions. Because NJAS used ArcGIS Desktop in the generation of its trail maps, its staff can easily provide trail updates or modify changes in land use or features. The most current maps are available for download from the NJAS Web site (www.njaudubon.org). Best of all, NJAS now has a collection of trail maps that looks professional, providing easy-to-interpret information that will encourage more passive recreation.
(Reprinted from the Summer 2009 issue of ArcNews magazine)

GIS BEST PRACTICES 21 WWW.ESRI.COM
Supporting Island Land ConservationConservation Trust of Puerto Rico Finds GIS to Be the Ideal Tool
As a result of rapid urban sprawl and the depletion of natural resources on the island of Puerto Rico, the government of Puerto Rico and the U.S. Department of the Interior created the Conservation Trust of Puerto Rico in 1970. The trust is a nonprofi t institution devoted to the acquisition and protection of ecologically important lands in Puerto Rico and the development and promotion of environmental, educational, and research activities in natural protected areas. Today, the trust owns and manages about 19,000 acres of important natural habitats of many species of fl ora and fauna, including critical habitats for threatened and endangered species; conserves historically important landscapes and man-made structures; and protects unique natural and historical landscapes.
With GIS, the Conservation Trust of Puerto Rico has been able to, for example, generate 3D visualizations of its properties and adjacent land parcels with proposed construction projects.
APRIL 2010 22 NONGOVERNMENTAL ORGANIZATIONS
After recognizing the need to effectively manage its geographic information, the trust decided to establish, in July 2003, the Conservation Trust's GIS Unit (CTGISU). In essence, CTGISU has the purpose of creating, managing, and updating the GIS data concerning the existing and potential natural protected areas and projects of the trust. The core of CTGISU is ArcView software.
The fi rst task of CTGISU was to determine the location of all natural protected areas managed by the trust in a geographic database. For this purpose, the coordinate information from the land surveys of all properties was plotted in the ArcView interface as x,y events in the cases where the coordinate system was known. When arbitrary geographic coordinates were used, the polygons were drawn with an unknown coordinate system and georeferenced using the ArcGIS Spatial Analyst extension. To accomplish this task, high-resolution IKONOS satellite imagery for Puerto Rico was used as a background, and referencing image and recorded GPS data from identifi able land parcel limits was used to make the polygon adjustment. As a result, the trust managed to accurately locate more than 40 land parcels that constitute the 19 natural protected areas owned by the trust.
CTGISU used GIS, including the ArcGIS 3D Analyst extension, as a tool to assist in the decision-making processes that involve the evaluation of land parcels offered to the trust by private landowners. Life zones, vegetation cover, critical habitats, biodiversity, and potential expansion are, among others, important criteria evaluated by the trust to establish and validate the interest in acquiring a particular portion of land. All these criteria are displayed as GIS layers in ArcView, then overlaid along with the boundaries of a property to determine if the property is important in terms of at least one of the criteria mentioned above.
After creating the information regarding land stewardship, CTGISU began the process of generating the GIS data for managing the properties, for example, the delineation of trails and locations of critical species, restoration sites, and discernible landmarks like cave entrances. CTGISU also located areas of existing and potential confl ict, such as proposed development, dwellers, and sources of contamination. All this information was generated using the Leica GS-20 GPS system. Land features discernible from the IKONOS satellite imagery were digitized on screen.
GIS has also proved to be an ideal tool for creating comprehensible maps that fulfi ll the educational needs of the trust. For example, several maps created with ArcView have been published in periodicals and publications of the trust, for example, La Naturaleza de la Isla de Vieques: 100 Milliones de Años de Historia (The Nature of the Island of Vieques: 100 Million
Answering Questions
GIS BEST PRACTICES 23 WWW.ESRI.COM
Years of History), a publication that describes the natural history of one of Puerto Rico's island-municipalities, and 100 x 35, a periodical for the general public that educates about the environmental issues of the island.
With these ArcGIS technologies available, the trust has been able to, for example, generate 3D visualizations of its properties and adjacent land parcels with proposed construction projects. These visualizations have effectively supported the protection and defense strategies against the impact of proposed developments in the neighboring lands of a natural reserve.
(Reprinted from the Winter 2006/2007 issue of ArcNews magazine)
GIS BEST PRACTICES 25 WWW.ESRI.COM
Using GIS to Remedy Coal Mining's AftermathPennsylvanian Coalition Designs Mapping Application to Target Areas Most in Need of Reclamation
Highlights
Pennsylvania receives congressional funding extension to reclaim abandoned coal mines.
ArcGIS application maximizes reclamation budget.
Demonstration shows offi cials that GIS is the best solution to address high-priority areas.
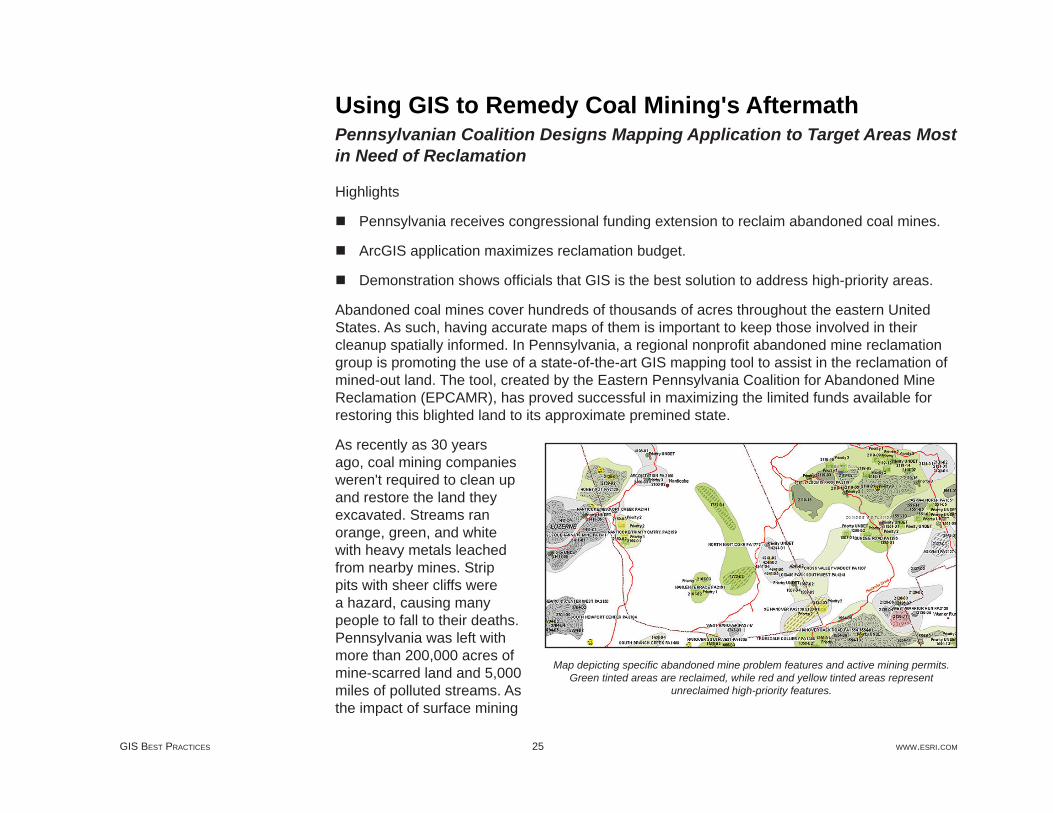
Abandoned coal mines cover hundreds of thousands of acres throughout the eastern United States. As such, having accurate maps of them is important to keep those involved in their cleanup spatially informed. In Pennsylvania, a regional nonprofi t abandoned mine reclamation group is promoting the use of a state-of-the-art GIS mapping tool to assist in the reclamation of mined-out land. The tool, created by the Eastern Pennsylvania Coalition for Abandoned Mine Reclamation (EPCAMR), has proved successful in maximizing the limited funds available for restoring this blighted land to its approximate premined state.
As recently as 30 years ago, coal mining companies weren't required to clean up and restore the land they excavated. Streams ran orange, green, and white with heavy metals leached from nearby mines. Strip pits with sheer cliffs were a hazard, causing many people to fall to their deaths. Pennsylvania was left with more than 200,000 acres of mine-scarred land and 5,000 miles of polluted streams. As the impact of surface mining
Map depicting specifi c abandoned mine problem features and active mining permits. Green tinted areas are reclaimed, while red and yellow tinted areas represent
unreclaimed high-priority features.
APRIL 2010 26 NONGOVERNMENTAL ORGANIZATIONS
became evident in the mid-1970s, Congress passed the Surface Mine Control and Reclamation Act (SMCRA) in 1977. SMCRA attached a per-ton fee to all extracted coal to create an interest-accruing federal reclamation fund. The fund is maintained by the United States Department of the Interior Offi ce of Surface Mining (OSM) and is dispersed to states and Native American tribes that still face problems caused by coal mines abandoned before 1977.
Because Pennsylvania leads most states in the amount of reclamation that needs to be done, in 2006, Congress authorized an increase in Pennsylvania's reclamation allotment to $1.4 billion over the next 15 years. With so many abandoned mines still awaiting reclamation in Pennsylvania, EPCAMR sought a way to more effi ciently pinpoint the areas in need of remediation. Although the new allotment will signifi cantly increase the work that can be done, $1.4 billion still needs to go a long way.
With a grant from the Foundation for Pennsylvania Watersheds and an agreement with the OSM's Technical Innovation Professional Services (TIPS) Program, EPCAMR used ArcGIS Desktop software's ArcMap and the Publisher extension to create a tool to keep track of abandoned mines. Called the Reclaimed Abandoned Mine Land Information System (RAMLIS), the application creates highly detailed maps at different scales with layers of information that help identify the areas most in need of remediation. RAMLIS also combines state, federal, and local data in maps that reveal all the components of mines, such as mine discharge points, backfi lled strip pits, and reclaimed mine shafts. To work safely and effectively, reclamation crews must know the location of these features. Knowing the location of fl ooded voids, for example, can potentially save enormous expense—and even lives.
The dynamic, interactive maps assist reclamation efforts because they allow the public and local municipalities to understand what features are contained within a mine site and which features can be fi xed using SMCRA funding. Map layers show a multitude of problems caused by leaving mines unattended. For example, the quality of water running off these sites is identifi ed in a stream layer from the Pennsylvania Department of Environmental Protection (DEP) called the Integrated List of Waters. This layer shows streams that do not meet their intended use because pollution from the seepage of mining by-products drains into the stream. By turning on this layer, users can see certain sections of a stream that are impacted by mine drainage of heavy metals, such as iron or aluminum, into the stream. Toxic discharge from this runoff also decreases the pH to uninhabitable levels for fi sh and other aquatic organisms.
RAMLIS is also useful for civic management/land development. Elected offi cials can add their layers to this system for further analysis of a problem (e.g., input a tax parcel layer to
GIS BEST PRACTICES 27 WWW.ESRI.COM
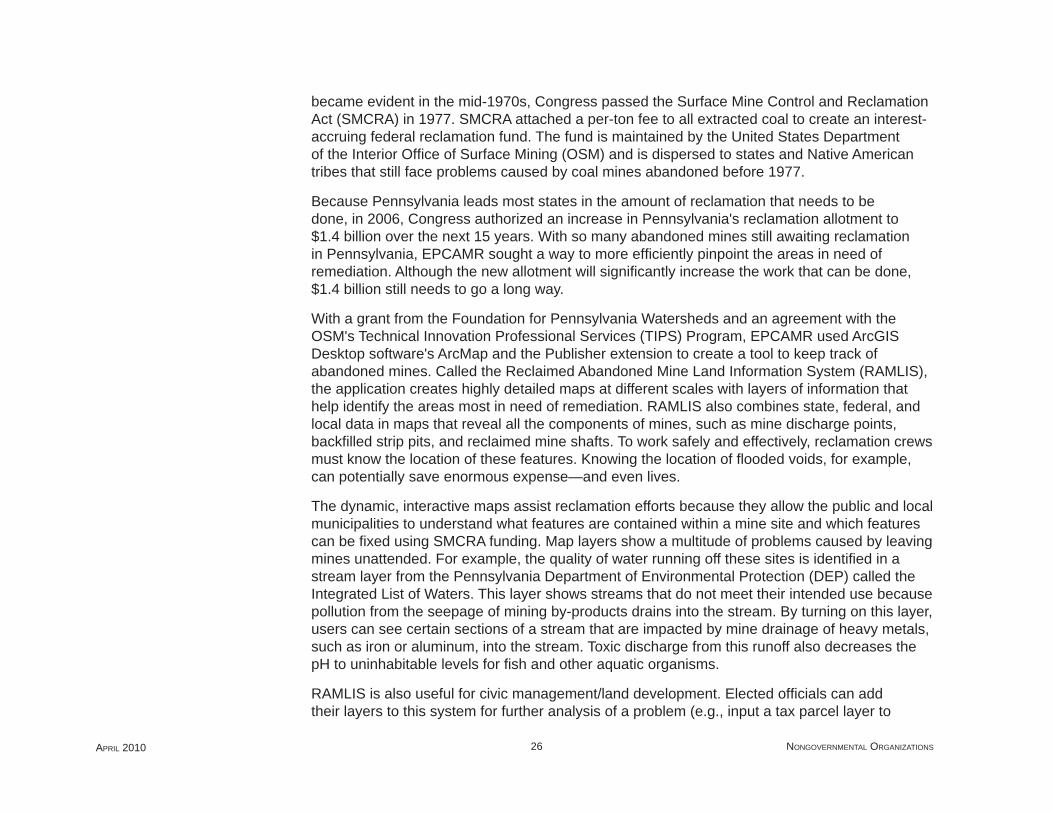
examine neighborhoods for economic impacts because of local mine hazards). Local and county planning commissions use the program as a tool for land-use planning, storm water and fl oodplain management, and a host of other development-related issues. The tool contains road centerlines; municipal, county, and watershed boundaries; full-color aerial photos; and land-use datasets as background data.
Map showing streams impacted by pollutant runoff from abandoned mine in Schuykill County, Pennsylvania.
Recently, EPCAMR took the application on the road to demonstrate its benefi ts to municipal offi cials throughout northeastern Pennsylvania. The goal of the workshops was to show how ArcGIS not only maximizes the value of reclamation budgets but also increases public
APRIL 2010 28 NONGOVERNMENTAL ORGANIZATIONS
awareness of mine hazards. In a fl agging economy, and following a string of harrowing coal mine accidents in the past few years, EPCAMR's message couldn't have been more timely.
To show municipal planners and public offi cials what GIS was capable of, EPCAMR offered to produce up to three free maps for municipalities containing abandoned mines. One map was required to depict mined-out land, while the content of the other two was left up to elected offi cials based on available data. In a survey conducted after the tour, many of these municipalities responded that the new maps were helpful, since the old maps used for planning and maintenance were an average of 15 years old. Several municipalities were also interested in obtaining their own GIS software and technicians.
"If we can convince public offi cials who are in charge of making sound land-use planning decisions for their communities, it might turn the light bulb on for them," says Robert Hughes, regional coordinator for EPCAMR. "We're trying to say, 'Let us show you how GIS can be used to effectively allocate a limited amount of funding and resources over time.'" ArcGIS helps municipalities, as well as state and federal offi cials, by providing concrete evidence of potential health and safety hazards, such as subsidence-prone areas. "Pollution from residual coal mine chemicals, illegal dumping, and land cave-ins is a real concern to some of these communities," says Hughes. "GIS gives us the best solution to identify and respond to these problems on a local level."
To date, approximately 22,500 acres of mine lands in Pennsylvania have been cleaned up, and more than 280 mine drainage treatment systems are in place to treat polluted water. EPCAMR hopes the workshops in Pennsylvania continue to spread the GIS message to other organizations.
To learn more about Pennsylvania's mine reclamation work, visit www.orangewaternetwork.org.
(Reprinted from the Fall 2008 issue of ArcNews magazine)
More Information

Part 2: NGOs Helping Society
GIS BEST PRACTICES 31 WWW.ESRI.COM
Restoring Angola's Electricity NetworkGovernment Seeks 100 Percent Electrifi cation in Urban Areas, 60 Percent in Adjoining Areas
Highlights
Electricity planning moves forward with the updating of 20-year-old maps.
Improved information leads to electricity service for more than 6,500 households.
GIS improves transparency and stakeholder participation in municipal planning.
Angolans have suffered three decades of civil war, and only in recent years have they been able to begin the slow process of reclaiming their nation by rebuilding both the physical and social infrastructure necessary for peace, security, and economic growth. A critical component of this progress is the restoration of the electricity network. The government of Angola has set a goal to provide 100 percent electrifi cation in urban areas and 60 percent electrifi cation in adjoining areas by 2012. The U.S. Agency for International Development (USAID) is assisting Angola's government in reaching this target. A pilot project is under way to address the electrifi cation goals, piloting innovative methods to improve electrifi cation in the adjoining areas.
To address this need, the Academy for Educational Development (AED), a leading nonprofi t organization working globally to improve education, health, civil society, and economic development, is working with Empresa Distribuidor de Electricidade (EDEL), Angola's national electricity distribution company, and two municipal governments to provide training in urban planning, engineering, and capacity building through the USAID-funded Angola Electricity Support Program (AESP).
APRIL 2010 32 NONGOVERNMENTAL ORGANIZATIONS
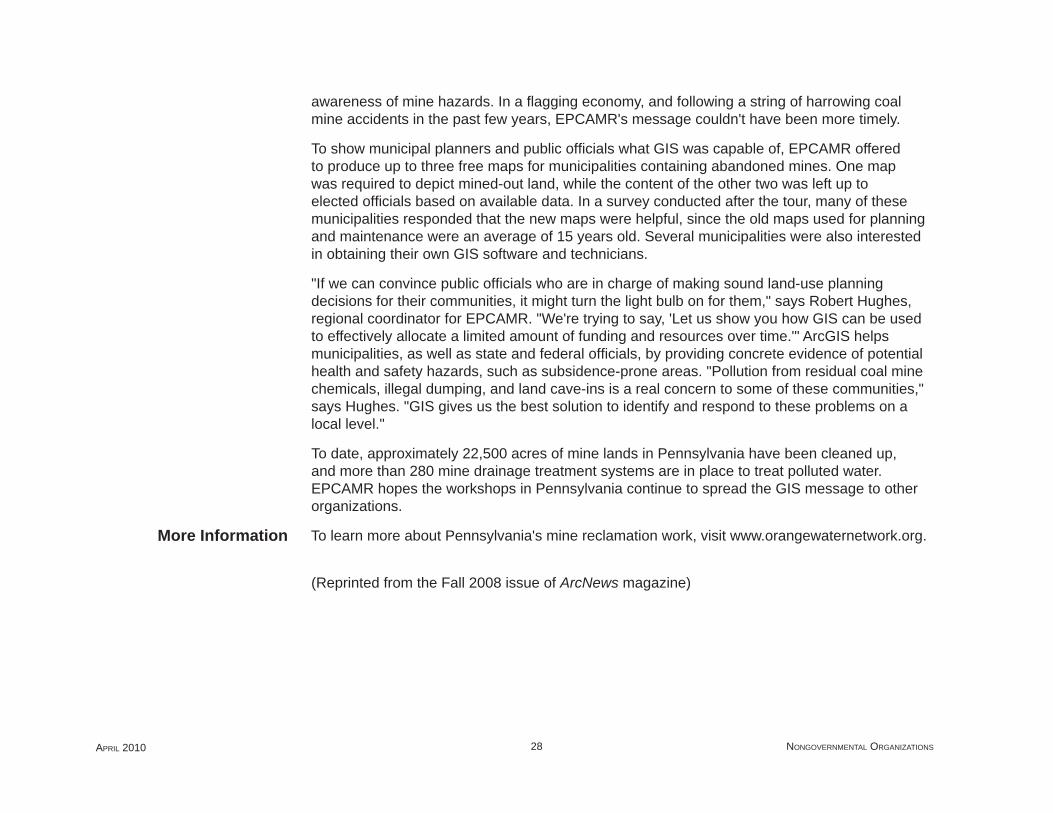
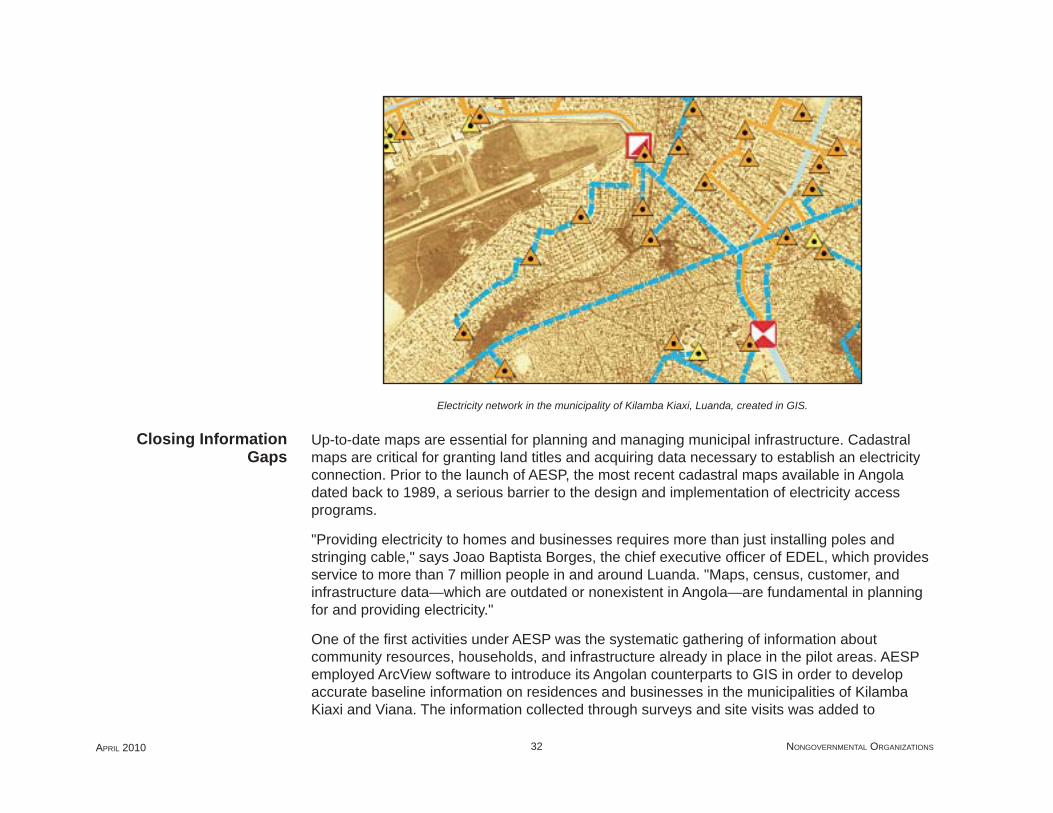
Electricity network in the municipality of Kilamba Kiaxi, Luanda, created in GIS.
Up-to-date maps are essential for planning and managing municipal infrastructure. Cadastral maps are critical for granting land titles and acquiring data necessary to establish an electricity connection. Prior to the launch of AESP, the most recent cadastral maps available in Angola dated back to 1989, a serious barrier to the design and implementation of electricity access programs.
"Providing electricity to homes and businesses requires more than just installing poles and stringing cable," says Joao Baptista Borges, the chief executive offi cer of EDEL, which provides service to more than 7 million people in and around Luanda. "Maps, census, customer, and infrastructure data—which are outdated or nonexistent in Angola—are fundamental in planning for and providing electricity."
One of the fi rst activities under AESP was the systematic gathering of information about community resources, households, and infrastructure already in place in the pilot areas. AESP employed ArcView software to introduce its Angolan counterparts to GIS in order to develop accurate baseline information on residences and businesses in the municipalities of Kilamba Kiaxi and Viana. The information collected through surveys and site visits was added to
Closing Information Gaps
GIS BEST PRACTICES 33 WWW.ESRI.COM
geographic data and maps to create the most up-to-date geographic information systems for the two municipalities.
AED selected ArcView based on ESRI's reputation and because the software is easy to use for inputting and manipulating data for utility, governmental, and community use.
The newly created maps contain information on land plots and existing electric networks and are providing EDEL with vital information, such as street addresses, meter numbers, and where houses are connected to the electrical system. That information will help EDEL deliver more accurate electricity bills, provide better customer service, and extend the network.
A further breakdown of the layered datasets provides information detailing the extent of electrical infrastructure. With this information, AED and local stakeholders were able to gather and analyze trend information and establish a concrete understanding of who was benefi ting from electricity, differentiating between legal and illegal connections and identifying which households were not electrifi ed.
In addition to upgrading the quality and type of information available, there is a capacity-building component to AESP. To date, EDEL and municipal government staff have been trained on the use and application of ArcView software and GIS principles. The training was so successful—and the software so useful—that EDEL has secured its own ArcView software licenses.
As this project continues, training has been expanded to local stakeholders, including small businesses, civil servants, and residents. Within a forum of open dialog and transparency, municipal governments will have increased opportunities for iterative planning, fl exibility, and adjustment. This will lead not only to improved electrical infrastructure but also to increased capacity through collective engagement, planning, and improved governance practices.
A Sustainable Intervention
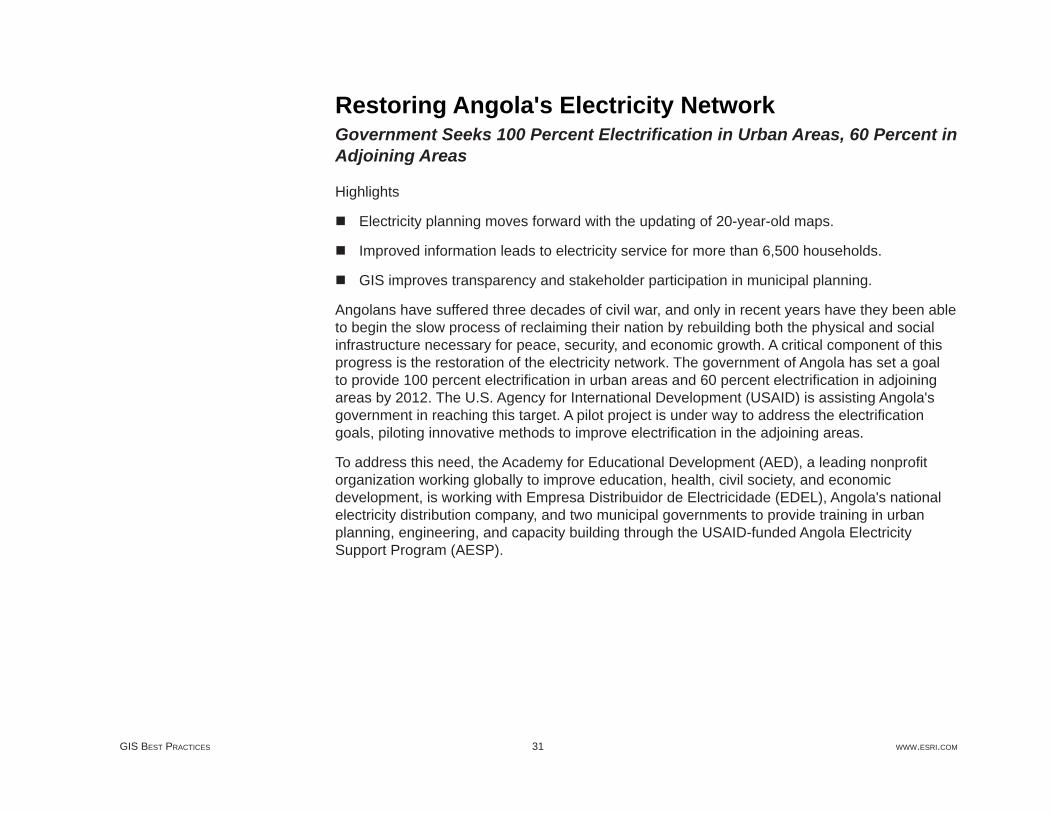
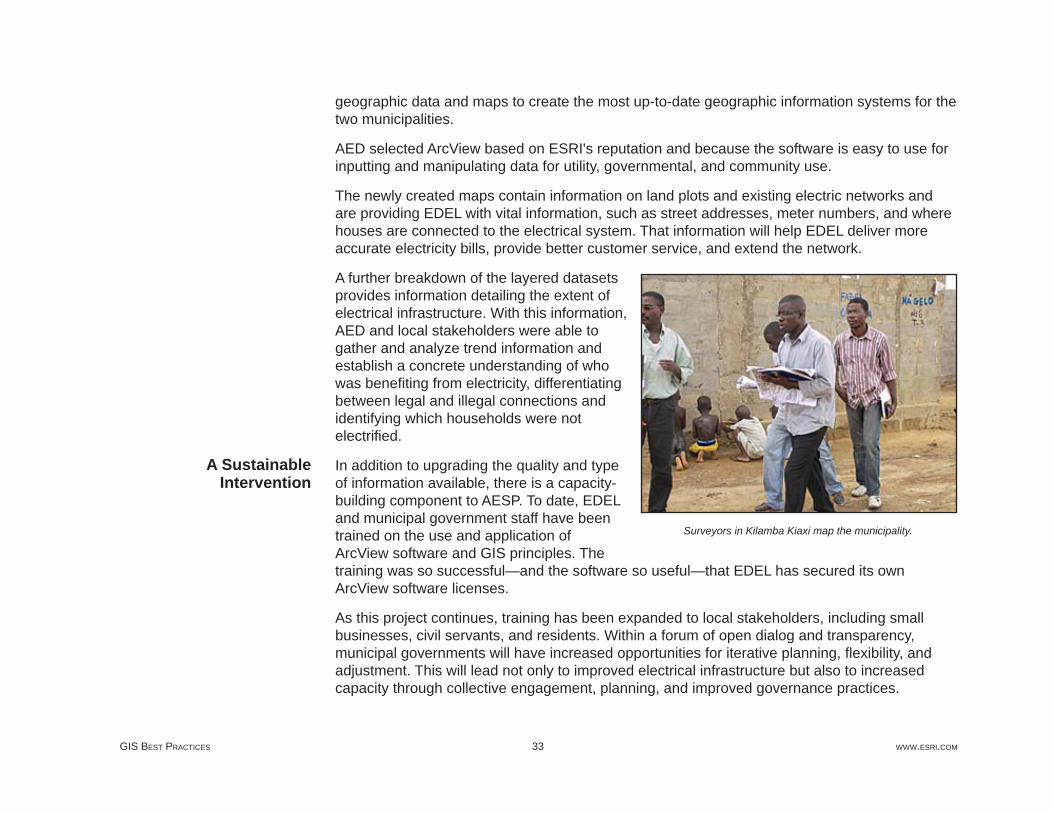
Surveyors in Kilamba Kiaxi map the municipality.
APRIL 2010 34 NONGOVERNMENTAL ORGANIZATIONS
Community members in the AESP pilot areas place a high value on the information that has become available to them through the application of GIS. Equipped with information, community groups and individual households are better able to communicate their needs to EDEL and advocate improved service.
GIS has forged new paths and shed new light on underutilized power sources, forecasting, and long-term capital planning. AESP has increased access to electricity or improved electricity service for more than 6,500 households. Another 25,000 households will be supplied with electricity in 2009.
(Reprinted from the Winter 2009/2010 issue of ArcNews magazine)
GIS BEST PRACTICES 35 WWW.ESRI.COM
Hopeworks Founder Father Jeff Putthoff Encourages Youth Development with Technology TrainingHope Thrives in Camden, New Jersey, Through Nonprofi t Organization
As a city that has twice been named the nation's most dangerous in recent years, Camden, New Jersey, can be a diffi cult place for young people to chart successful paths for their lives. In response to this youth crisis that includes a high dropout rate, pastoral teams from three local churches developed Hopeworks 'N Camden. Technology training, including a GIS component, is a big part of what draws youth aged 14 to 23 to this program.
Though opportunities to learn GIS and Web design/development offer important and useful instruction for the youth, the organization's overall focus is youth development. When youth come to Hopeworks, a staff member helps them create a personal development plan to identify goals and outline the steps necessary to achieve those goals. If the target is college, the plan could include staying in school, getting good grades, preparing to take the SAT, and thinking about fi nancial aid.
In general, Hopeworks is set up to help the youth in all areas of their lives by teaching them about being on time, being productive, and addressing problems when they arise. At any given time, the program has 20 to 30 kids participating, and 873 have gone through the program since it began in 2000. Some of these participants are in high school, and others have dropped out; there are also a few who are in juvenile correction facilities.
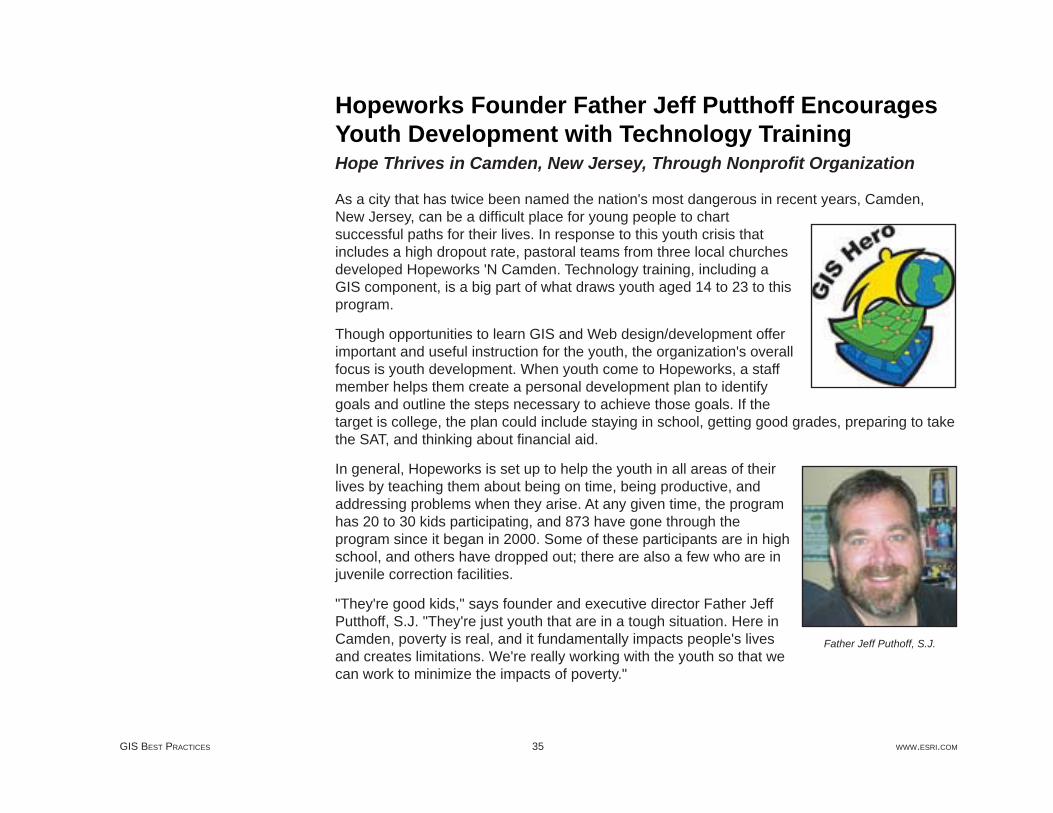
"They're good kids," says founder and executive director Father Jeff Putthoff, S.J. "They're just youth that are in a tough situation. Here in Camden, poverty is real, and it fundamentally impacts people's lives and creates limitations. We're really working with the youth so that we can work to minimize the impacts of poverty."
Father Jeff Puthoff, S.J.
APRIL 2010 36 NONGOVERNMENTAL ORGANIZATIONS
Putthoff, a Jesuit priest, developed the concept for Hopeworks and invited pastors from two nearby Lutheran churches to participate. Then, an intern at a neighboring nonprofi t organization introduced Putthoff to GIS; he quickly decided to include it in the program. "GIS is a cool technology that's spatial. It helps you think. It helps you do all sorts of things, while being very practical," he says. "It helps us learn about our community."
With GIS, youth at Hopeworks conduct surveys of their neighborhoods and map things such as vacant buildings, green spaces, and malfunctioning streetlights. They have also mapped features for cities such as Baltimore, Maryland; Denver, Colorado; St. Louis, Missouri; and Trenton, New Jersey.
Establishing funding for GIS and Web development projects is one of Putthoff's primary jobs. Clients offer a way to keep money fl owing into the program. To conduct this GIS work, youth at Hopeworks use ArcGIS Desktop software and ArcPad along with Hewlett-Packard's iPAQ handheld PCs and a Trimble GeoXT handheld, which are used to gather GPS points in the fi eld.
In addition to receiving valuable training, participants in the program can also fi nd jobs with Hopeworks. When youth enter the Hopeworks program, they learn various technology-related skills and that work is unpaid. After that training period, those who have gained skill and are motivated can earn paying jobs.
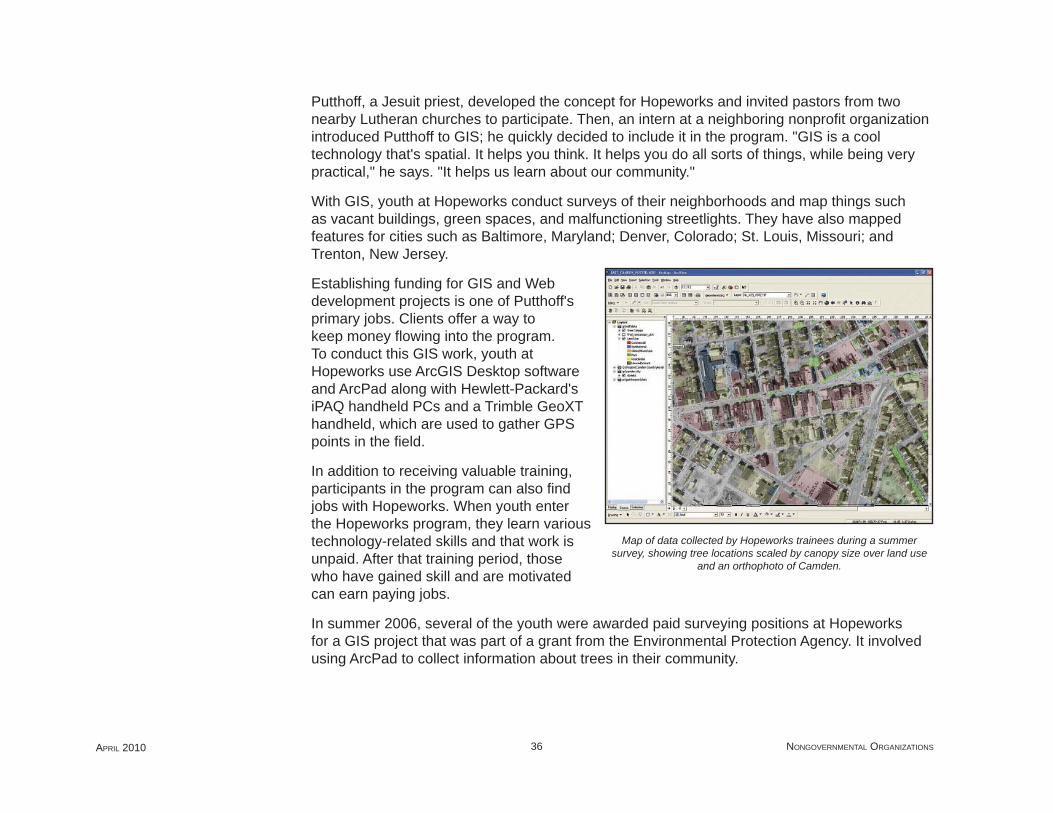
In summer 2006, several of the youth were awarded paid surveying positions at Hopeworks for a GIS project that was part of a grant from the Environmental Protection Agency. It involved using ArcPad to collect information about trees in their community.
Map of data collected by Hopeworks trainees during a summer survey, showing tree locations scaled by canopy size over land use
and an orthophoto of Camden.
GIS BEST PRACTICES 37 WWW.ESRI.COM
In 2005, Hopeworks paid approximately $70,000 in youth salaries. In a good year, Putthoff estimates that the organization brings in $140,000 to $160,000 from work that the youth produce.
Though the program does help kids get jobs and get into college, Putthoff is quick to point out that the program is not just about GIS or Web training. "In a very basic way, it's about saving a life, giving a helping hand to someone's vision so that the future can be life-giving."
He offers the example of a person who recently went through Hopeworks and is now at Rutgers studying GIS and journalism. A GIS enthusiast, this student returned to Hopeworks to assist with its summer program. Citing this youth's experience, Putthoff notes that Hopeworks is about providing opportunities to people like this young man, in this case, exposing someone to GIS when he otherwise wouldn't have been.
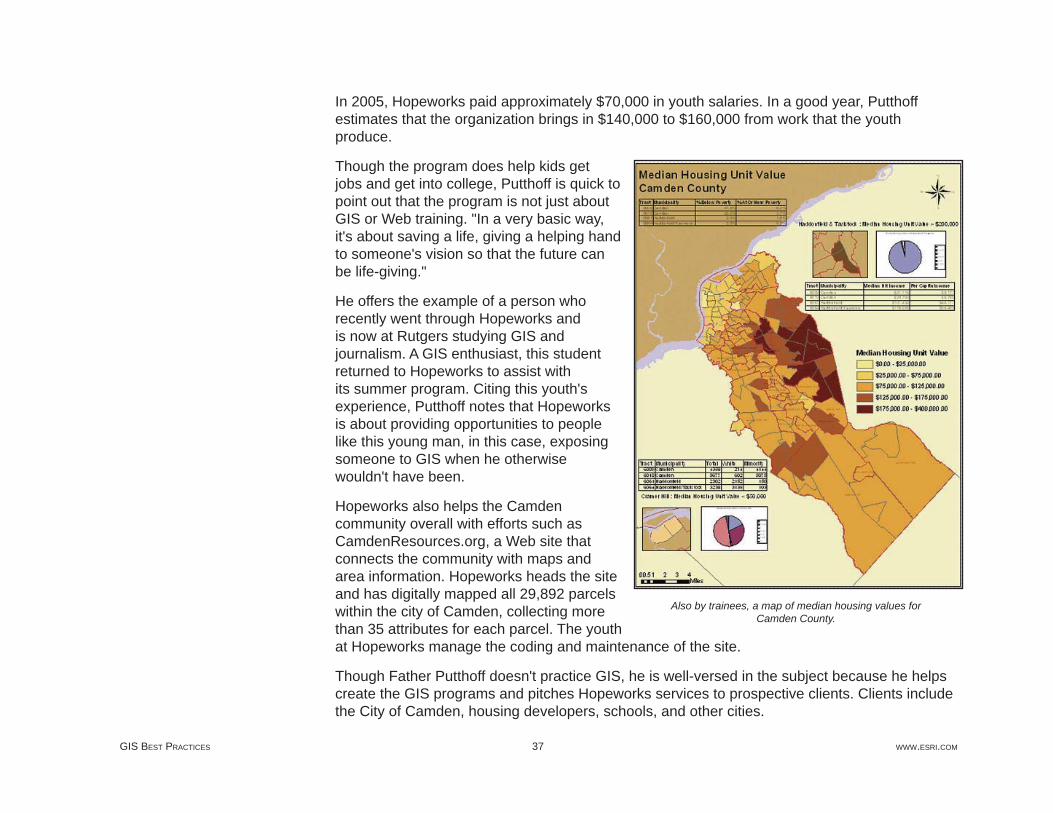
Hopeworks also helps the Camden community overall with efforts such as CamdenResources.org, a Web site that connects the community with maps and area information. Hopeworks heads the site and has digitally mapped all 29,892 parcels within the city of Camden, collecting more than 35 attributes for each parcel. The youth at Hopeworks manage the coding and maintenance of the site.
Though Father Putthoff doesn't practice GIS, he is well-versed in the subject because he helps create the GIS programs and pitches Hopeworks services to prospective clients. Clients include the City of Camden, housing developers, schools, and other cities.
Also by trainees, a map of median housing values for Camden County.
APRIL 2010 38 NONGOVERNMENTAL ORGANIZATIONS
Of his interest in GIS, Putthoff shares, "I've created a program that I wish I could do instead of having to worry about funding it. I absolutely love GIS. I'm a spatial thinker, so I love being able to project data spatially. I like how maps tell stories. I think maps speak to people." One of the fi rst GIS projects Hopeworks conducted was creating a map of a nearby Latino neighborhood to bring English and Spanish speakers together and allow them to communicate about issues in the area using a map.
"Father Jeff is a really good idea guy; he has fantastic ideas and lets us run loose with them," says GIS director Tarren Anderson. "He's a very enthusiastic guy, always going 90 miles an hour, and I'm trying to keep up."
If you would like more information about Hopeworks 'N Camden or are interested in supporting the organization or becoming a GIS mentor, e-mail [email protected].
(Reprinted from the Fall 2006 issue of ArcNews magazine)
More Information

GIS BEST PRACTICES 39 WWW.ESRI.COM
Constructing a Community Water System in LaosGIS an Essential Tool to Successfully Complete the Life-Providing Project
By Jeff La Frenierre, Engineers Without Borders
Highlights
Designing and constructing a water system required detailed and accurate mapping using ArcGIS and ArcPad.
Integrating GPS data with GIS, the team calculated that a stream was near enough to be a clean water source.
ArcGIS helped resolve the pipeline routing problem so that the course could be staked out.
Throughout their lives, the people of Ban Phakeo, a small village in the highlands of Laos, have been burdened with the same fundamental challenge faced by more than a billion people worldwide: lack of access to a safe and reliable source of drinking water. Each day, residents—usually women or children—walked down a hill to a covered puddle fed by a dripping seep, fi lled buckets or pots with murky water, and carried their heavy loads back uphill to their homes. Depending on how recently it had rained and how many people had visited the seep before them, there often wasn't enough water to fi ll their vessels immediately; thus, they had to wait for the pool to refi ll, drip by drip. And, as if the burden in time and effort needed to fetch the water weren't bad enough, the water they carried home was contaminated by fecal coliforms and other harmful bacteria and often made them—and especially their youngest children—sick.
The people of Ban Phakeo were well aware of the disadvantage and danger in which their water situation placed them, but with an average annual household income of only US$150, they simply did not have the means to solve this critical problem themselves. The village, home to about 170 Hmong (an ethnic minority who live in the highlands of several Southeast Asian countries), is located more than two hours' walk from the nearest road, lacks any water or sanitation infrastructure, and is without electricity. Residents are subsistence farmers, growing or harvesting from the surrounding forests nearly everything they eat and a great deal of what they use in their daily lives.
APRIL 2010 40 NONGOVERNMENTAL ORGANIZATIONS
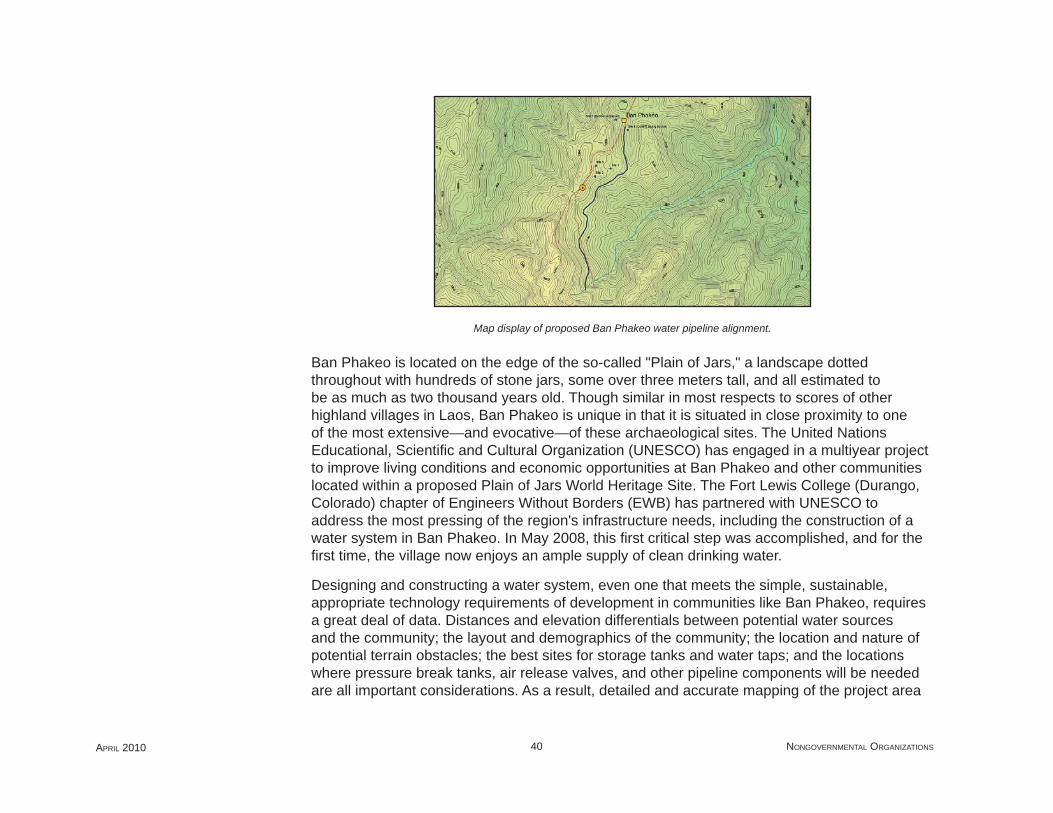
Map display of proposed Ban Phakeo water pipeline alignment.
Ban Phakeo is located on the edge of the so-called "Plain of Jars," a landscape dotted throughout with hundreds of stone jars, some over three meters tall, and all estimated to be as much as two thousand years old. Though similar in most respects to scores of other highland villages in Laos, Ban Phakeo is unique in that it is situated in close proximity to one of the most extensive—and evocative—of these archaeological sites. The United Nations Educational, Scientifi c and Cultural Organization (UNESCO) has engaged in a multiyear project to improve living conditions and economic opportunities at Ban Phakeo and other communities located within a proposed Plain of Jars World Heritage Site. The Fort Lewis College (Durango, Colorado) chapter of Engineers Without Borders (EWB) has partnered with UNESCO to address the most pressing of the region's infrastructure needs, including the construction of a water system in Ban Phakeo. In May 2008, this fi rst critical step was accomplished, and for the fi rst time, the village now enjoys an ample supply of clean drinking water.
Designing and constructing a water system, even one that meets the simple, sustainable, appropriate technology requirements of development in communities like Ban Phakeo, requires a great deal of data. Distances and elevation differentials between potential water sources and the community; the layout and demographics of the community; the location and nature of potential terrain obstacles; the best sites for storage tanks and water taps; and the locations where pressure break tanks, air release valves, and other pipeline components will be needed are all important considerations. As a result, detailed and accurate mapping of the project area
GIS BEST PRACTICES 41 WWW.ESRI.COM
is typically a critical fi rst step in the process. In Ban Phakeo, ArcGIS technology—especially ArcPad mobile GIS—proved to be an essential tool.
Engineers Without Borders is a national nonprofi t organization comprising both professional and student chapters from throughout the country. Thus far, EWB groups have completed more than 170 projects in 41 countries. The Fort Lewis College chapter (EWB-FLC) was founded in 2004 and has since constructed water systems in rural communities in Thailand and Ecuador. The 2008 project in Ban Phakeo represents the fi rst phase of a multiyear commitment to at least six villages in Laos' Plain of Jars region. EWB-FLC is a multidisciplinary group of Fort Lewis College students, former students and faculty, and professional partners from the Durango area.
In December 2007, two EWB-FLC team members traveled to Ban Phakeo to identify and map potential water sources and pipeline routes. At fi rst, villagers suggested a variety of small water seeps in the vicinity of the village as possible sources for the new system. Taken together, it was estimated that seven of these seeps could probably supply suffi cient water for the village, but the quality of several of these sources was questionable, and the need to build a system of pipelines from each of the seven sites to central storage tanks would be complex given the mountainous terrain surrounding the village. After an evening of discussion, village leaders mentioned a small stream that they knew had good, clean water but that was thought to be too far away. Given the uncertainty of the seeps, the team decided to examine this stream and make detailed measurements of its distance and elevation differential from the village.
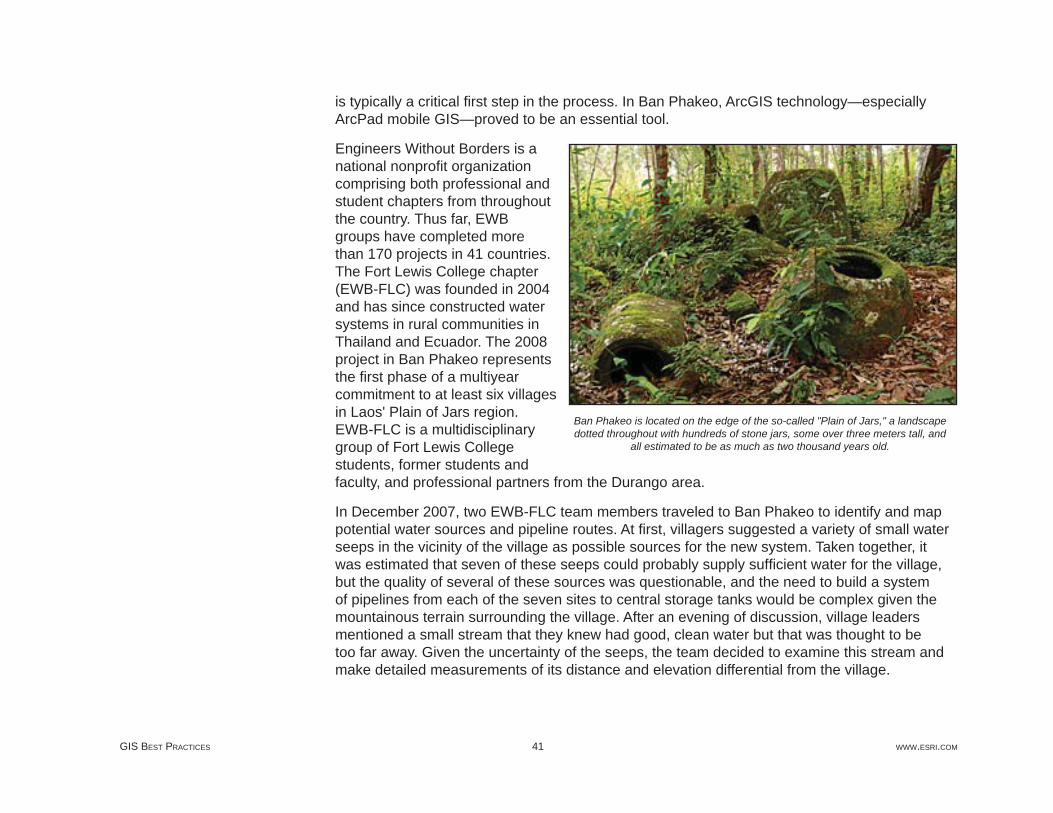
Ban Phakeo is located on the edge of the so-called "Plain of Jars," a landscape dotted throughout with hundreds of stone jars, some over three meters tall, and
all estimated to be as much as two thousand years old.

APRIL 2010 42 NONGOVERNMENTAL ORGANIZATIONS
Integrating GPS data collection with ArcGIS mapping and analysis capabilities, ArcPad 7 software allowed the team to quickly calculate that the stream was near enough to the village, and could be intercepted at a high enough elevation, to be a feasible water source. Community leaders were again consulted, and they agreed that villagers would be willing to both dig the necessary pipeline trench and protect the stream's upper watershed from any human use. Having thus identifi ed the water source, the next step was to identify the best route for the pipeline. Given that the water system would be a gravity-fed pipeline without any pumps, this step required careful attention. The problem, however, was that steep terrain and extremely dense tropical vegetation made this very diffi cult to accomplish on the ground.
Upon returning to Colorado, team members turned to ArcGIS software to help resolve the pipeline routing problem. A detailed topographic map would have answered most questions, but it isn't possible to obtain such a map for this portion of Laos. Instead, a 90-meter digital elevation model (DEM) generated in 2000 during the Shuttle Radar Topography Mission (SRTM) was obtained and converted into a 10-meter interval topographic map using the ArcGIS Spatial Analyst extension. Though a map created from a DEM with a 90-meter resolution is somewhat generalized, the topographic output was compared with GPS data points and photos collected during the December trip and found to be suffi ciently accurate for the pipeline design. With this information in hand, it was now possible to stake the pipeline route and purchase the correct quantities of pipe and other materials needed for what would be a nearly four-kilometer pipeline. One team member returned to Ban Phakeo in March and completed these tasks.
A 12-person team arrived in Ban Phakeo in early May to undertake the construction of the water system. Again, GPS technology and ArcPad 7 played an important role in the project. While villagers had just fi nished digging the pipeline trench, locations, elevations, and distances required verifi cation before work could get under way. Using a TopCon GMS-2 GPS receiver,
GPS data collection along the pipeline in Ban Phakeo Village.
GIS BEST PRACTICES 43 WWW.ESRI.COM
the necessary data was easily collected despite rugged terrain and very dense vegetation. The GMS-2's ability to track both the American NavStar and Russian GLONASS GPS satellite constellations, allowing for excellent signal strength despite the landscape obstacles, proved essential to this process. For 11 days, the team worked side by side with villagers to transport materials, set and glue PVC pipe, construct a stream diversion structure, and build tap stands. Throughout the process, detailed mapping using ArcPad continued, including a detailed as-built survey of the pipeline and its components, demographic mapping of each village household, and collection of site measurements for preferred locations of the seven new latrines EWB-FLC plans to construct in 2009.
For the fi rst time, villagers have as much water as they need whenever they need it and can drink that water without worrying about whether or not they will become sick from it. With taps situated within the village, individuals spend less time and energy fetching their household water supplies, their personal hygiene is improved, and their overall health less at risk.
Jeff La Frenierre has been a member of Engineers Without Borders—Fort Lewis College since 2004. He has participated in assessment and project implementation trips in Thailand, Ecuador, and Laos. He is currently a graduate student at the University of Denver, Colorado, in the Department of Geography.
For additional information about the efforts of Engineers Without Borders—Fort Lewis College, visit www.fortlewis.edu/academics/school_arts_sciences/physics_engineering/ewb_webpage/ewbfl c.htm. For more information about Engineers Without Borders in general, or to fi nd a chapter near you, visit www.ewb-usa.org. To learn more about the Plain of Jars and UNESCO's sustainable development initiative, visit www.unescobkk.org/index.php?id=2945.
(Reprinted from the Fall 2008 issue of ArcNews magazine)
About the Author
More Information
GIS BEST PRACTICES 45 WWW.ESRI.COM
Ghana Project Leverages GIS-Based Title Registration and Microfi nance to Alleviate PovertyBy Peter Rabley, International Land Systems, Inc.
Highlights
The project was presented to the United Nations Commission on the Legal Empowerment of the Poor.
System incorporates ArcGIS functionality to link title information with the digital parcel map.
Title and parcel data for loan processing is batched and provided to the ministry.
A pilot project under way in the African nation of Ghana seeks to demonstrate the vital role that formalization of landownership can play in helping the poor take a crucial fi rst step away from poverty. Focused on one of the poorest areas in the capital city of Accra, the pilot is leveraging the latest geospatial technologies to create a land titling process and GIS-based land records system where neither existed in the past.
Impetus for the Ghana pilot comes from the Clinton Global Initiative (CGI), started by former U.S. president Bill Clinton to challenge some of the world's leading organizations and individuals to make commitments that positively impact global health, poverty, climate change, and education. Accepting the CGI challenge to work toward alleviating poverty was First American Corp., a major title insurance and real estate information provider based in Santa Ana, California.
With an extensive background in land titling, Craig DeRoy, then president of First American, embraced the economic theories described by Dr. Hernando de Soto in his acclaimed book The Mystery of Capital. The Peruvian economist is among the fi rst to identify and describe the relationship between the formal recognition of property rights and the fi ght against poverty. DeRoy saw the CGI challenge as an opportunity to put de Soto's ideas into action.
APRIL 2010 46 NONGOVERNMENTAL ORGANIZATIONS
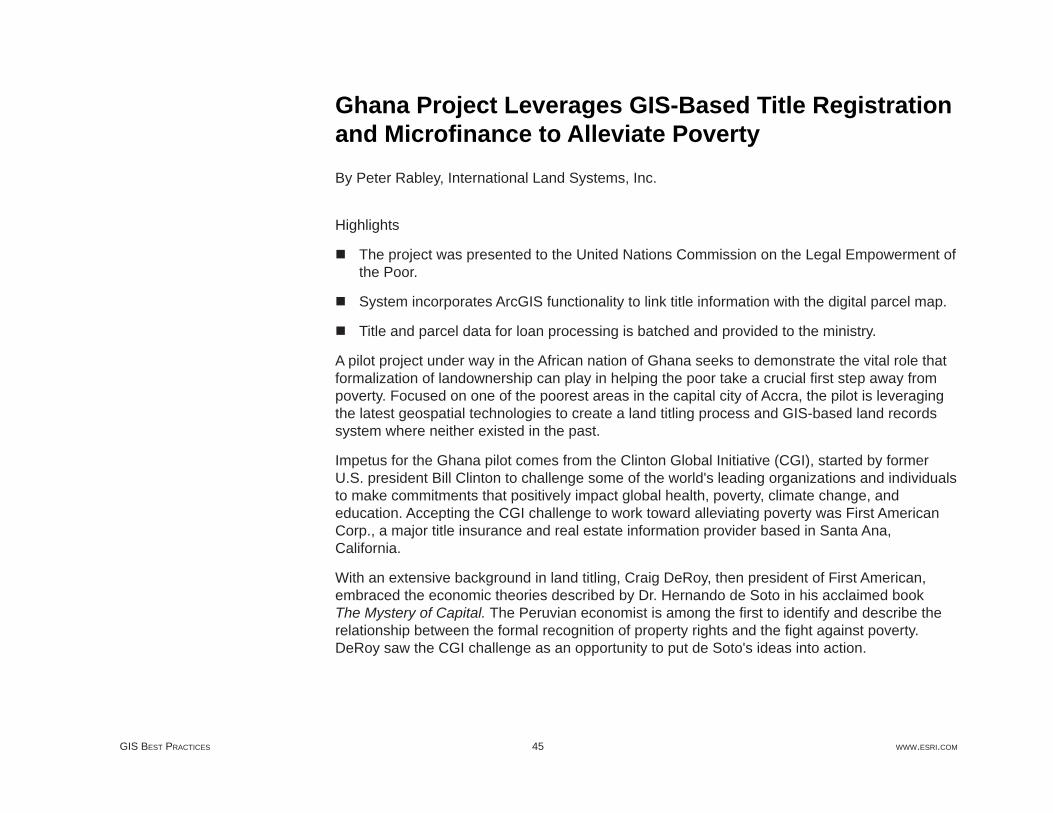
Using ILS MultiCadastre, all surveyed schools can be viewed. The ILS document scanning system plug-in allows for documents and images associated with each property to be examined as well.
With several partners, DeRoy presented the concept of a pilot project to the United Nations Commission on the Legal Empowerment of the Poor, which seeks to "make legal protection and economic opportunity not the privilege of the few but the right of all." The project received immediate feedback and encouragement from the commission's cochairpersons, Madeleine Albright and de Soto.
"Government recognition of landownership [through land titling] gives the poor an identity, which yields numerous benefi ts," says DeRoy. "The land title can ultimately be used as an asset to leverage permanent change in their economic and fi nancial futures."
According to de Soto, poor people almost everywhere in the world have one thing in common—the only asset they have is the land they occupy. Unfortunately, very few of these people have ever received any type of legal recognition that the land is theirs, especially in situations where

GIS BEST PRACTICES 47 WWW.ESRI.COM
the ownership is informal or based on customary forms of tenure. Without a registered deed, title, or lease, the owner cannot leverage the land as collateral to take out a loan that might be used to start a business or improve the property.
From an economic perspective, this untitled land represents trapped capital that could be accessed to stimulate the local fi nancial market with microfi nance loans and mortgages. But gaining access to this hidden capital requires the landowners to have formal titles or deeds to their properties.
De Soto's research revealed that the benefi ts of formal landownership extend beyond the monetary value of loans and mortgages and provide another crucial stepping-stone out of the hopelessness of poverty. A land title gives a person an address, often for the fi rst time, which dramatically improves that individual's sense of identity. As a result, the impoverished enjoy a greater feeling of security that their land won't be taken away and that they can improve the property. People with land titles are more likely to put their children in local schools and demand basic services from the government.
Despite these benefi ts, land titling and registration are out of reach for most of the poor. The process itself may be too daunting for governments to implement in poverty-stricken areas where no property mapping has ever occurred. And even in countries where titles and deeds do exist, the procedure may be too complicated, expensive, and time-consuming for low-income people to consider. As a result, the capital remains locked in the land, the local economy suffers, and the poor have no way out of their poverty. The ILS DSS system allows for the creation of a
paralegal title based on information gathered during the interview process.
APRIL 2010 48 NONGOVERNMENTAL ORGANIZATIONS
First American and CGI clearly understood the benefi ts of land titling and in 2006 agreed on a commitment for the U.S. company to develop a template for cost-effective, in-country creation and maintenance of a land record system that ensures a means for establishing and holding the legal title to a property. To lead this project beyond the original commitment, DeRoy took early retirement and formed a new company called Corporate Initiatives Development Group (CIDG).
"In creating the land record template, the challenge was not in developing it, but in actually implementing it and making it practical," says DeRoy. "There had been much historic debate on the effects of formalizing landownership for the poor, but little had been done to bring these theories to market. I believed it could be done if the right individuals and companies could be engaged, leveraging years of experience and intelligence in land and technology issues to put together a process that could be made simple."
He sought to extend the CGI commitment to include an in-country pilot implementation. To make the pilot a reality, CIDG assembled a team consisting of International Land Systems, Inc. (ILS), Opportunity International, Trimble Navigation, and ESRI. Each provides a capability vital to the development of a practical land record system:
ILS, an ESRI Business Partner in Silver Spring, Maryland, is implementing its commercial off-the-shelf GIS-based land recording and registration system, the key deliverable in the pilot.
Opportunity International of San Diego, California, is a nonprofi t microfi nance lender already active in Africa.
Trimble Navigation of Sunnyvale, California, is providing handheld mobile GPS devices that are being used to map the parcels in the fi eld.
ESRI is supplying core technology, in addition to managing the land surveying and mapping activities to create a parcel map, for the land registry database through Sambus Company Ltd., ESRI's international distributor in Ghana.
Selection of Opportunity International as a partner in the pilot highlights the important role that microfi nance can play in the alleviation of poverty through formalized land titling. Historically, microfi nance has focused on lending relatively small amounts of money—$50–$500—to individuals for use in starting in-home businesses. A sewing machine, for instance, can allow a woman to make and sell clothing in her neighborhood. Usually based on short-term paybacks, these loans are often made in trust groups so that peer pressure, not collateral, is the incentive
Assembling the Team
GIS BEST PRACTICES 49 WWW.ESRI.COM
for repayment. The result is a repayment rate of more than 95 percent on microfi nance loans worldwide.
"Microfi nance brings capital to these emerging markets in a very responsible way," explains DeRoy. "The creation of micro-entrepreneurs is a proven approach to the transformation of entire communities. In our project, we move microfi nance one step further by placing Opportunity International, the microfi nance lender, into the position of acting as a trusted broker for its clients seeking land registration. This use of the private sector serves to initiate, simplify, and accelerate a process that is often stymied by overwhelming governmental procedures and bureaucracy."
In recent years, microfi nance lenders have been looking to expand their reach by loaning larger amounts of money for a variety of uses beyond entrepreneurial business, but this type of lending often requires an asset to be offered as collateral. More often than not, these lenders experience the other side of the situation described by de Soto. They want to loan money to the poor, but the only asset is untitled land, which can't be used to secure the transaction.
This oft-repeated scenario provided Opportunity International an incentive to facilitate land titling as a means of growing the potential market for its microfi nance product offerings.
In 2007, the participants chose a very poor area known as Ashaiman on the outskirts of Accra, Ghana, as the pilot location. Ashaiman is home to about 400,000 people in a 40-square-kilometer region where most of the structures can best be described as shacks and shanties. It was considered ideal for the pilot because Opportunity International is actively involved in microfi nance there and had already been considering developing loan programs for the hundreds of private schools located in the area.
Operation of private schools is a growing business in Ghana, and the owners are seeking funds to build additional facilities and accommodate more students. From a mapping perspective, the schools were appealing for the pilot because the boundaries of their land are usually well defi ned. The decision was made to target only private schools in the initial pilot, because they presented the best opportunity to demonstrate the mutually benefi cial link that can be made between formalized land registration, microfi nance, and poverty alleviation.
Targeting Ghana's Schools
APRIL 2010 50 NONGOVERNMENTAL ORGANIZATIONS
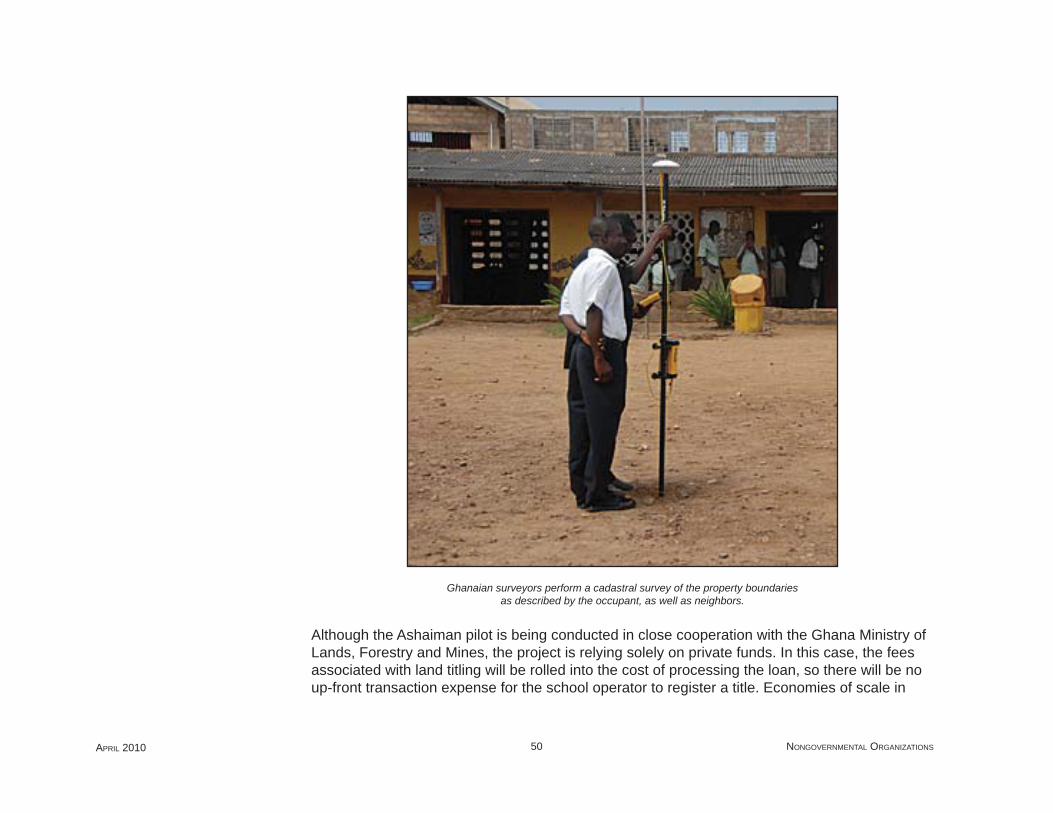
Ghanaian surveyors perform a cadastral survey of the property boundaries as described by the occupant, as well as neighbors.
Although the Ashaiman pilot is being conducted in close cooperation with the Ghana Ministry of Lands, Forestry and Mines, the project is relying solely on private funds. In this case, the fees associated with land titling will be rolled into the cost of processing the loan, so there will be no up-front transaction expense for the school operator to register a title. Economies of scale in
GIS BEST PRACTICES 51 WWW.ESRI.COM
processing multiple titles are expected to reduce costs signifi cantly as the land registry becomes operational.
Implementation of the pilot began in March 2008, and land titling had been completed for more than half of the 51 private schools in the pilot zone by August. This adjudication process, involves surveying the school property with GPS-based mobile GIS equipment, creating a legal description of the land, and collecting property ownership information from the school operators and neighbors via personal interviews conducted by members of the local team. Each school owner has sought to become part of the land registration pilot and actively participated in the required procedures as part of the loan processing.
As the interviews and fi eldwork are completed, ILS is uploading the data into its parcel-based MultiCadastre package, an off-the-shelf product that incorporates ArcGIS functionality to link the title information with the digital parcel map. This system is already managing the entire title registration process and workfl ow in a fully automated environment. For the pilot phase, this system will be maintained at the Sambus offi ce and will generate paralegal land titles that will be provided to the participating schools for use in securing private loans.
The term paralegal title is used to indicate that the titling process has been initiated for acceptance by the private sector to jump-start microfi nance activities. This commitment from the private sector is designed to give the government of Ghana the confi dence to use the paralegal titles as the starting points for offi cial title processing in the public land registry.
While the overall aim of the Ghanaian project is to continue to rely on private-sector entities to perform the land surveying and title recording work in support of microfi nance work, participants are simultaneously assisting the government in modernizing its land titling and cadastral capabilities with many of the same GIS-based systems being implemented in the pilot. All title and parcel data collected for loan processing is batched and provided to the Ministry of Lands for its own land registry, which the team believes will be among the world's most technologically advanced.
According to DeRoy, this project demonstrates the true effect of what is called the "leapfrog factor." Given the rapid pace of technology development, those who come to implement a system of land registration today and are not burdened with existing infrastructure or bureaucracy can gain the maximum benefi t from streamlined and cost-effective new processes while leveraging proven solutions.
APRIL 2010 52 NONGOVERNMENTAL ORGANIZATIONS
"It is terrifi c that microfi nance has matured to the point of being accepted as a traditional banking solution for the emerging markets of the world," says DeRoy.
Peter Rabley is president of International Land Systems, Inc., with more than 20 years of experience designing and implementing land information systems around the world.
Further reading: "The Power of One," Time magazine, July 16, 2007, by Madeleine Albright and Hernando de Soto.
(Reprinted from the Fall 2008 issue of ArcNews magazine)
About the Author
More Information

GIS BEST PRACTICES 53 WWW.ESRI.COM
Early Warning Planning for Mosquito-Borne EpidemicsGIS, High-Resolution Remote Sensing Help Evaluate Degrees of Risk in Senegal
By Yves M. Tourre, Delphine Fontannaz, Cécile Vignolles, Jacques-André Ndione, Jean-Pierre Lacaux, and Murielle Lafaye
Highlights
GIS tools and remote sensing were used to detect potential breeding ponds.
In situ observations validated the indexes.
Using ArcView, researchers calculated mosquito density and evaluated cross-potential risks.
Fifty years of successful efforts in the prevention and control of infectious diseases and epidemics have inspired confi dence and optimism in modern medicine and technology. Nevertheless, epidemics remain a conspicuous challenge to public health today. In the context of climate change and rapidly increasing population, some epidemics are even reemerging.
For example, the Ferlo region in Senegal, Africa, became prone to Rift Valley fever (RVF) in the late 1980s when virus-carrying mosquitoes Aedes vexans and Culex poicilipes appeared. The latter species proliferate near temporary ponds and neighboring humid vegetation. RVF epizootic outbreaks in livestock cause spontaneous abortions and perinatal mortality. So far, human-related disease symptoms are often limited to fl u-like syndromes but can include more severe forms of encephalitis and hemorrhagic fevers. As a result, local socioeconomic resources can be seriously affected.
Professor P. Sabatier at the University of Grenoble indicated that this growing threat created an urgent need for a local early warning system (EWS) for RVF epidemics in Senegal. The goal was to use specifi c GIS tools and remote-sensing images/data to detect potential breeding ponds and evaluate RVF diffusion and areas with potential risks.
APRIL 2010 54 NONGOVERNMENTAL ORGANIZATIONS
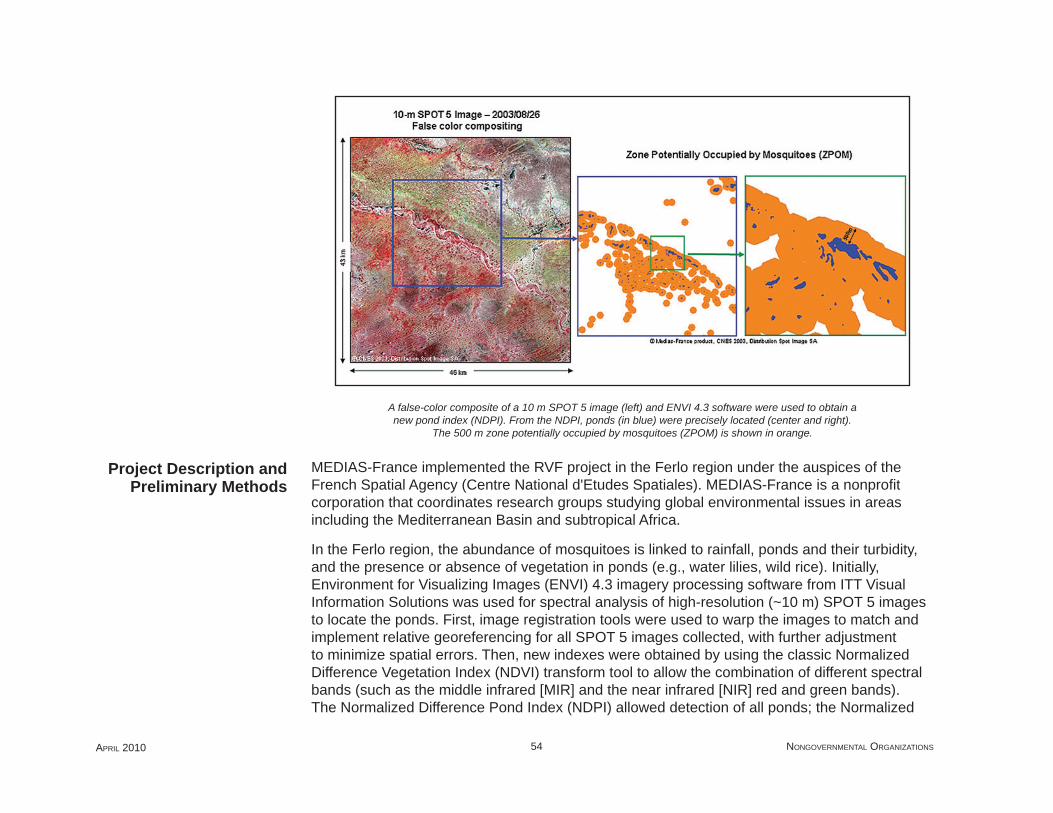
A false-color composite of a 10 m SPOT 5 image (left) and ENVI 4.3 software were used to obtain a new pond index (NDPI). From the NDPI, ponds (in blue) were precisely located (center and right).
The 500 m zone potentially occupied by mosquitoes (ZPOM) is shown in orange.
MEDIAS-France implemented the RVF project in the Ferlo region under the auspices of the French Spatial Agency (Centre National d'Etudes Spatiales). MEDIAS-France is a nonprofi t corporation that coordinates research groups studying global environmental issues in areas including the Mediterranean Basin and subtropical Africa.
In the Ferlo region, the abundance of mosquitoes is linked to rainfall, ponds and their turbidity, and the presence or absence of vegetation in ponds (e.g., water lilies, wild rice). Initially, Environment for Visualizing Images (ENVI) 4.3 imagery processing software from ITT Visual Information Solutions was used for spectral analysis of high-resolution (~10 m) SPOT 5 images to locate the ponds. First, image registration tools were used to warp the images to match and implement relative georeferencing for all SPOT 5 images collected, with further adjustment to minimize spatial errors. Then, new indexes were obtained by using the classic Normalized Difference Vegetation Index (NDVI) transform tool to allow the combination of different spectral bands (such as the middle infrared [MIR] and the near infrared [NIR] red and green bands). The Normalized Difference Pond Index (NDPI) allowed detection of all ponds; the Normalized
Project Description and Preliminary Methods
GIS BEST PRACTICES 55 WWW.ESRI.COM
Difference Turbidity Index (NDTI) allowed the evaluation of water transparency or turbidity. In situ observations by participants from the Center for Ecological Monitoring (Centre de Suivi Ecologique) in nearby Dakar validated the indexes using GPS and GIS.
Using these methods, small ponds were located with precision, making it further possible to map RVF risks from zones potentially occupied by mosquitoes (ZPOM) following recent studies from entomologists on fl ying ranges and spatial distribution of mosquitoes.
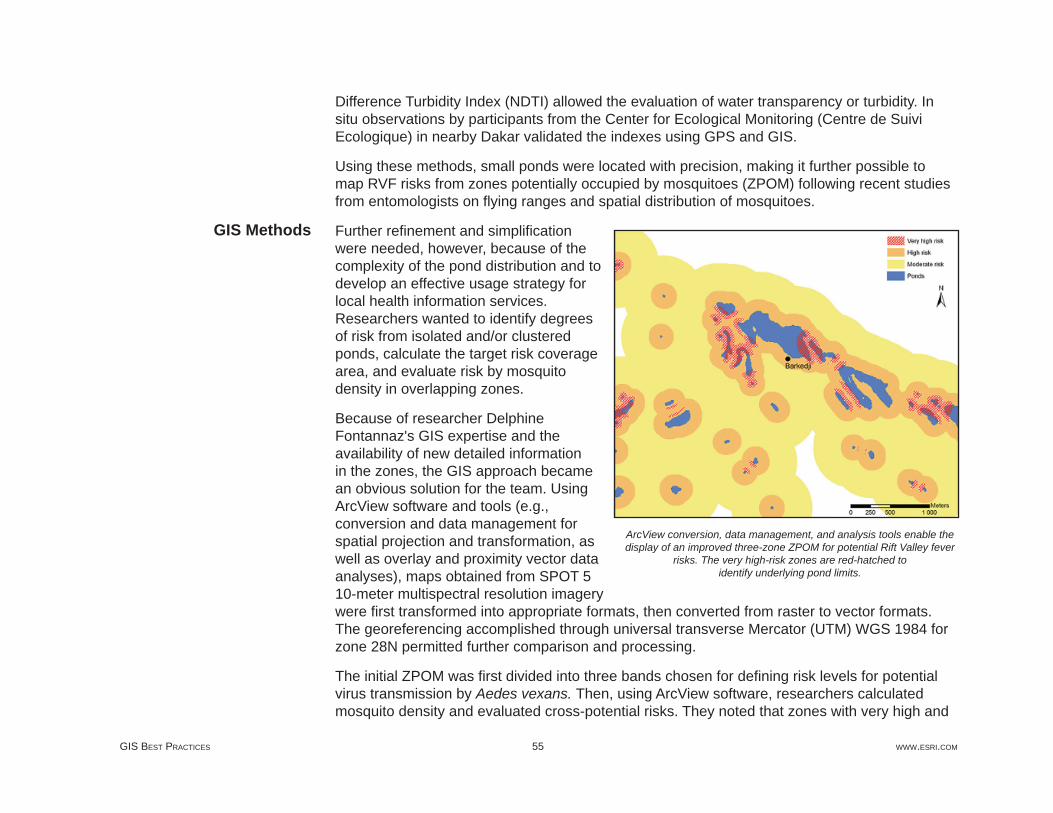
Further refi nement and simplifi cation were needed, however, because of the complexity of the pond distribution and to develop an effective usage strategy for local health information services. Researchers wanted to identify degrees of risk from isolated and/or clustered ponds, calculate the target risk coverage area, and evaluate risk by mosquito density in overlapping zones.
Because of researcher Delphine Fontannaz's GIS expertise and the availability of new detailed information in the zones, the GIS approach became an obvious solution for the team. Using ArcView software and tools (e.g., conversion and data management for spatial projection and transformation, as well as overlay and proximity vector data analyses), maps obtained from SPOT 5 10-meter multispectral resolution imagery were fi rst transformed into appropriate formats, then converted from raster to vector formats. The georeferencing accomplished through universal transverse Mercator (UTM) WGS 1984 for zone 28N permitted further comparison and processing.
The initial ZPOM was fi rst divided into three bands chosen for defi ning risk levels for potential virus transmission by Aedes vexans. Then, using ArcView software, researchers calculated mosquito density and evaluated cross-potential risks. They noted that zones with very high and
GIS Methods
ArcView conversion, data management, and analysis tools enable the display of an improved three-zone ZPOM for potential Rift Valley fever
risks. The very high-risk zones are red-hatched to identify underlying pond limits.
APRIL 2010 56 NONGOVERNMENTAL ORGANIZATIONS
high risks were inhabited by potential reservoirs, i.e., carriers (snakes, frogs, and toads), of the RVF virus and produced an improved ZPOM.
The analyses using GIS technology allowed researchers to see that risks increase when ponds are close to each other. Using GIS technology, researchers created a new, more detailed, and more useful ZPOM. GIS tools provided new products and information for use by local early warning systems in the prevention of disease.
This technique might be improved by adding digitized ecological zone layers. Multidisciplinary users can benefi t from this data by using it to choose strategic positioning of villages and parks according to RVF risks. This new methodology is also being transferred to other teams in Africa for varied types of mosquito vector research.
Tourre, Fontannaz, Vignolles, and Lacaux are affi liated with MEDIAS-France, Toulouse, France; Ndione is affi liated with the Centre de Suivi Ecologique (CSE), Laboratoire de Physique de l'Atmosphère et de l'Océan, Université Simon Fongang, Dakar, Senegal; and Lafaye is affi liated with the Centre National d'Etudes Spatiales (CNES), Toulouse, France.
Visit the Web site at www.redgems.org.
(Reprinted from the Spring 2008 issue of ArcNews magazine)
Results
Future Applications
About the Authors
More Information
GIS BEST PRACTICES 57 WWW.ESRI.COM
There's No Place Like Close to HomeIllinois Takes a Geographic Approach to Foster Care
Highlights
GIS helps identify foster homes in a child's school district.
Program helps children stay within familiar surroundings.
Service is available 24/7.
"A child's universe is about 10 square blocks," observes Nancy Hughes, president and CEO of Volunteers of America of Illinois, a nonprofi t organization involved in foster care in the Chicago area. "Within that world are the familiar touchstones of life—school, playgrounds, neighbors, and friends—a geography refl ected in its familiarity, constancy, and comfort." As part of its mission, Volunteers of America of Illinois serves foster children referred by the Illinois Department of Children and Family Services (IDCFS), which now makes GIS part of the process for matching a child in need of foster care.
Until recently, the assignment process could match a child with a foster home that was possibly 5, 10, or more miles from a child's community. It put children in the situation of not only being removed from parents and perhaps siblings but also from all the other aspects of their daily life—school, teachers, coaches, and friends. That changed when IDCFS began exploring how it might keep a child's existing school or school district in mind as a factor in foster placement. Keeping a child's school, services, activities, and social network constant while the child is going through disruptive changes at home could contribute to better outcomes in everything from academic performance, contact with siblings, and maintaining existing friendships to chances for reunifying with the natural parents. Hughes understands what IDCFS is hoping to achieve and what it means to children to stay in their school. "We know it's important because the kids tell us it's important," says Hughes. As Hughes worked late one evening to help place three children who had just been removed from their home, one of the children said to her, "Tell me I'm going to the same school and I can handle everything else."
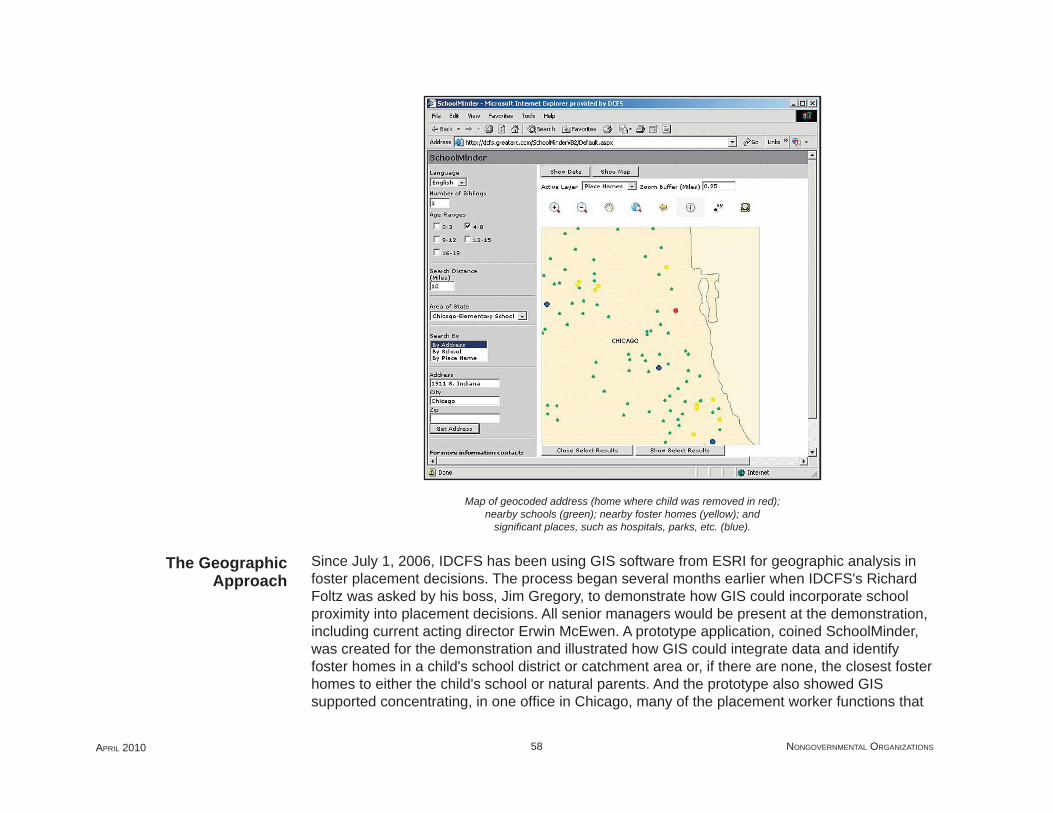
APRIL 2010 58 NONGOVERNMENTAL ORGANIZATIONS
Map of geocoded address (home where child was removed in red); nearby schools (green); nearby foster homes (yellow); and
signifi cant places, such as hospitals, parks, etc. (blue).
Since July 1, 2006, IDCFS has been using GIS software from ESRI for geographic analysis in foster placement decisions. The process began several months earlier when IDCFS's Richard Foltz was asked by his boss, Jim Gregory, to demonstrate how GIS could incorporate school proximity into placement decisions. All senior managers would be present at the demonstration, including current acting director Erwin McEwen. A prototype application, coined SchoolMinder, was created for the demonstration and illustrated how GIS could integrate data and identify foster homes in a child's school district or catchment area or, if there are none, the closest foster homes to either the child's school or natural parents. And the prototype also showed GIS supported concentrating, in one offi ce in Chicago, many of the placement worker functions that
The Geographic Approach
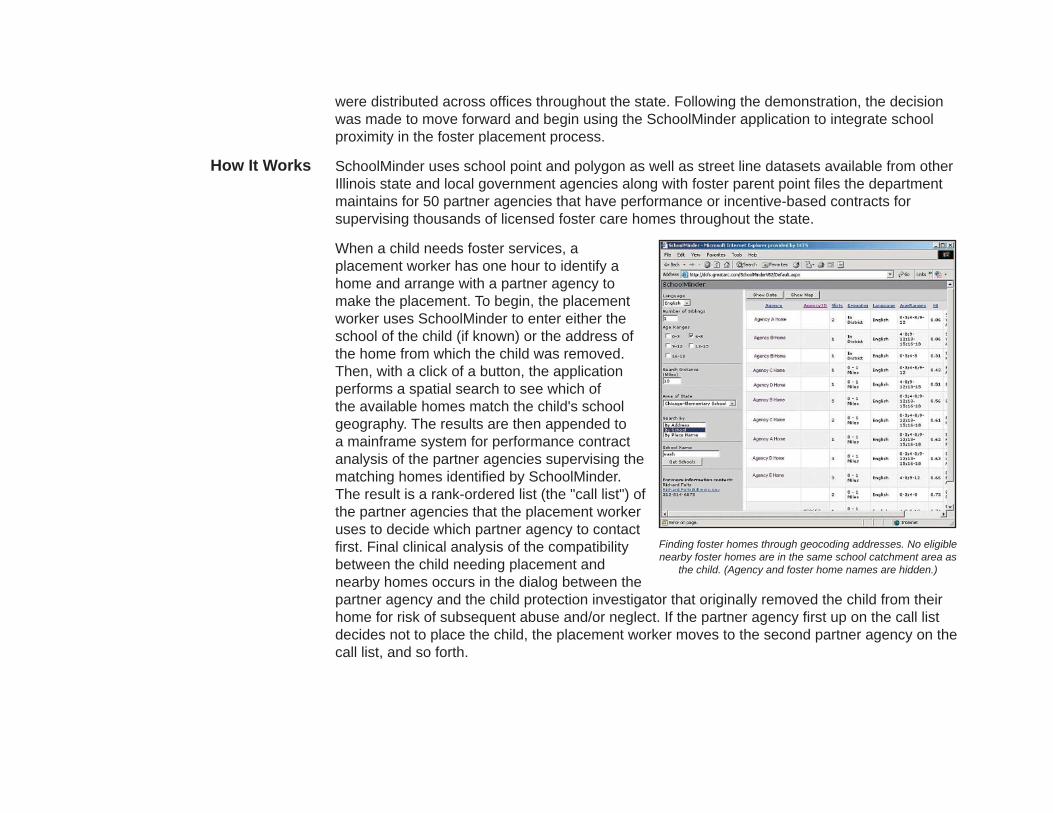
were distributed across offi ces throughout the state. Following the demonstration, the decision was made to move forward and begin using the SchoolMinder application to integrate school proximity in the foster placement process.
SchoolMinder uses school point and polygon as well as street line datasets available from other Illinois state and local government agencies along with foster parent point fi les the department maintains for 50 partner agencies that have performance or incentive-based contracts for supervising thousands of licensed foster care homes throughout the state.
When a child needs foster services, a placement worker has one hour to identify a home and arrange with a partner agency to make the placement. To begin, the placement worker uses SchoolMinder to enter either the school of the child (if known) or the address of the home from which the child was removed. Then, with a click of a button, the application performs a spatial search to see which of the available homes match the child's school geography. The results are then appended to a mainframe system for performance contract analysis of the partner agencies supervising the matching homes identifi ed by SchoolMinder. The result is a rank-ordered list (the "call list") of the partner agencies that the placement worker uses to decide which partner agency to contact fi rst. Final clinical analysis of the compatibility between the child needing placement and nearby homes occurs in the dialog between the partner agency and the child protection investigator that originally removed the child from their home for risk of subsequent abuse and/or neglect. If the partner agency fi rst up on the call list decides not to place the child, the placement worker moves to the second partner agency on the call list, and so forth.
How It Works
Finding foster homes through geocoding addresses. No eligible nearby foster homes are in the same school catchment area as
the child. (Agency and foster home names are hidden.)
APRIL 2010 60 NONGOVERNMENTAL ORGANIZATIONS
Since deploying the SchoolMinder application, the average distances for initial foster care placement in Cook County dropped from 9.9 to 2.5 miles (median numbers dropped from 6.4 to 1.5 miles). Outside Cook County, the average and median dropped from 22.5 to 11.4 and 7.7 to 3.1 miles, respectively. Hughes observes that such an impact is an example of the potential nobility of technology. "There are so many things we can't control when removing a child from an unsafe situation and placing them in foster care," says Hughes. "It's amazing that we've found a way to leverage the spatial information. For the child, it's an extraordinarily wonderful thing."
The benefi ts of the prototype application were clearly measurable, but so were the limitations. "We found with our prototype that all children weren't receiving the benefi ts of GIS equally," Foltz says. "The unit with access to the desktop application works normal business hours. But over half our placements occur outside business hours. It was clear that we needed to move SchoolMinder to a server environment and probably make it available 24/7 throughout the state."
To reach the goal of making SchoolMinder available 24/7, IDCFS turned to Great Arc Technologies, Inc., an ESRI Business Partner, to rewrite the desktop application into a Web-based interface served by ArcGIS Server technology. Brett Ward of Great Arc coordinated the development work. "Everyone is familiar with a Web browser, and most people are comfortable with that type of interface," notes Ward. By moving SchoolMinder to a Web interface, placement workers can log in from any department connection, day or night. Additional improvements will enable staff to perform multipass geocoding and search on place-names when both a child's school and parent's address are unknown. For example, placement workers will be able to enter a hospital's name to start a foster home search if an infant is found abandoned there.
"The big benefi t for me," says Foltz, "is that this system is both industry standard and department compliant. It is a wise choice for the department, both for maintaining our SchoolMinder application, as well as for developing new server-based applications in the future. It's nice knowing I can call on existing department expertise in Visual Basic for Applications (VBA) and ASP.NET if necessary. That leaves me more free time to concentrate on new GIS analysis and reporting than on maintenance of an existing system. It's the former that led to the whole concept of SchoolMinder anyway."
(Reprinted from the Summer 2007 issue of ArcNews magazine)
Benefi ts to Children
The Need for 24-Hour GIS
Copyright © 2010 ESRIAll rights reserved.Printed in the United States of America.
The information contained in this document is the exclusive property of ESRI. This work is protected under United States copyright law and other international copyright treaties and conventions. No part of this work may be reproduced or transmitted in any form or by any means, electronic or mechani-cal, including photocopying and recording, or by any information storage or retrieval system, except as expressly permitted in writing by ESRI. All requests should be sent to Attention: Contracts and Legal Services Manager, ESRI, 380 New York Street, Redlands, CA 92373-8100, USA.
The information contained in this document is subject to change without notice.
U.S. GOVERNMENT RESTRICTED/LIMITED RIGHTSAny software, documentation, and/or data delivered hereunder is subject to the terms of the License Agreement. In no event shall the U.S. Government acquire greater than RESTRICTED/LIMITED RIGHTS. At a minimum, use, duplication, or disclosure by the U.S. Government is subject to restric-tions as set forth in FAR §52.227-14 Alternates I, II, and III (JUN 1987); FAR §52.227-19 (JUN 1987) and/or FAR §12.211/12.212 (Commercial Technical Data/Computer Software); and DFARS §252.227-7015 (NOV 1995) (Technical Data) and/or DFARS §227.7202 (Computer Software), as applicable. Contractor/Manufacturer is ESRI, 380 New York Street, Redlands, CA 92373-8100, USA.
@esri.com, 3D Analyst, ACORN, ADF, AML, ArcAtlas, ArcCAD, ArcCatalog, ArcCOGO, ArcData, ArcDoc, ArcEdit, ArcEditor, ArcEurope, ArcExplorer, ArcExpress, ArcGIS, ArcGlobe, ArcGrid, ArcIMS, ARC/INFO, ArcInfo, ArcInfo Librarian, ArcInfo—Professional GIS, ArcInfo—The World’s GIS, ArcLocation, ArcLogistics, ArcMap, ArcNetwork, ArcNews, ArcObjects, ArcOpen, ArcPad, ArcPlot, ArcPress, ArcQuest, ArcReader, ArcScan, ArcScene, ArcSchool, ArcSDE, ArcSdl, ArcSketch, ArcStorm, ArcSurvey, ArcTIN, ArcToolbox, ArcTools, ArcUSA, ArcUser, ArcView, ArcVoyager, ArcWatch, ArcWeb, ArcWorld, ArcXML, Atlas GIS, AtlasWare, Avenue, Business Analyst Online, BusinessMAP, Community, CommunityInfo, Data Automation Kit, Database Integrator, DBI Kit, EDN, ESRI, ESRI—Team GIS, ESRI—The GIS Company, ESRI—The GIS People, ESRI—The GIS Software Leader, FormEdit, Geographic Design System, ESRI BIS, Geography Matters, Geography Network, GIS by ESRI, GIS Day, GIS for Everyone, GISData Server, JTX, MapBeans, MapCafé, MapData, MapObjects, Maplex, MapStudio, ModelBuilder, MOLE, NetEngine, PC ARC/INFO, PC ARCPLOT, PC ARCSHELL, PC DATA CONVERSION, PC STARTER KIT, PC TABLES, PC ARCEDIT, PC NETWORK, PC OVERLAY, PLTS, Rent-a-Tech, RouteMAP, SDE, Site·Reporter, SML, Sourcebook·America, Spatial Database Engine, StreetEditor, StreetMap, Tapestry, the ARC/INFO logo, the ArcAtlas logo, the ArcCAD logo, the ArcCAD WorkBench logo, the ArcCOGO logo, the ArcData logo, the ArcData Online logo, the ArcEdit logo, the ArcEurope logo, the ArcExplorer logo, the ArcExpress logo, the ArcGIS logo, the ArcGIS Explorer logo, the ArcGrid logo, the ArcIMS logo, the ArcInfo logo, the ArcLogistics Route logo, the ArcNetwork logo, the ArcPad logo, the ArcPlot logo, the ArcPress for ArcView logo, the ArcPress logo, the ArcScan logo, the ArcScene logo, the ArcSDE CAD Client logo, the ArcSDE logo, the ArcStorm logo, the ArcTIN logo, the ArcTools logo, the ArcUSA logo, the ArcView 3D Analyst logo, the ArcView Business Analyst logo, the ArcView Data Publisher logo, the ArcView GIS logo, the ArcView Image Analysis logo, the ArcView Internet Map Server logo, the ArcView logo, the ArcView Network Analyst logo, the ArcView Spatial Analyst logo, the ArcView StreetMap 2000 logo, the ArcView StreetMap logo, the ArcView Tracking Analyst logo, the ArcWorld logo, the Atlas GIS logo, the Avenue logo, the BusinessMAP logo, the Community logo, the Data Automation Kit logo, the Digital Chart of the World logo, the ESRI Data logo, the ESRI globe logo, the ESRI Press logo, the Geography Network logo, the MapCafé logo, the MapObjects Internet Map Server logo, the MapObjects logo, the MOLE logo, the NetEngine logo, the PC ARC/INFO logo, the Production Line Tool Set logo, the RouteMAP IMS logo, the RouteMAP logo, the SDE logo, The World’s Leading Desktop GIS, Water Writes, www.esri.com, www.esribis.com, www.geographynetwork.com, www.gis.com, www.gisday.com, and Your Personal Geographic Information System are trademarks, registered trademarks, or service marks of ESRI in the United States, the European Community, or certain other jurisdictions.
Other companies and products mentioned in the ESRI Web site may be trademarks or registered trademarks of their respective trademark owners.
G42380_ed
Since 1969, ESRI has been giving customers around the world the power to
think and plan geographically. The market leader in geographic information
system (GIS) solutions, ESRI software is used in more than 300,000 organiza-
tions worldwide including each of the 200 largest cities in the United States,
most national governments, more than two-thirds of Fortune 500 companies,
and more than 5,000 colleges and universities. ESRI applications, running on
more than one million desktops and thousands of Web and enterprise serv-
ers, provide the backbone for the world’s mapping and spatial analysis. ESRI
is the only vendor that provides complete technical solutions for desktop,
mobile, server, and Internet platforms.
Visit us at www.esri.com.
380 New York Street
Redlands, CA 92373-8100 USA
909-793-2853 | FAX 909-793-5953