gis in the miami valley region
TRANSCRIPT
GIS in the Miami Valley Region – Where We Are and Where We Are Going
Miami Valley Planning & Zoning Workshop
December 2, 2016
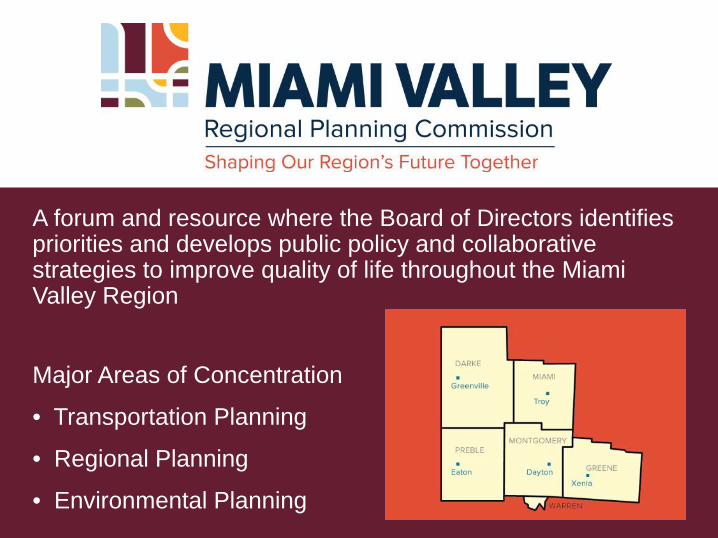
A forum and resource where the Board of Directors identifies priorities and develops public policy and collaborative strategies to improve quality of life throughout the Miami Valley Region
Major Areas of Concentration
• Transportation Planning
• Regional Planning
• Environmental Planning

MVRPC GIS
• Provide a vital operating function in conducting regional planning activities
• Play a leadership role offering data and expertise to local jurisdictions and the general public
Today’s Topics:
• 2015 GIS Needs Assessment • Recreational Asset Inventory and Map • New/Updated Regional GIS Layers • New Service Focused Projects • GIS Training • What’s Next
GIS Needs Assessment: BACKGROUND
• PURPOSE
– Identify how GIS is used in the Miami Valley Region and better understand various needs that exist at the local and regional level
• SURVEY
– First survey was conducted between May 6, 2015 – May 22, 2015 and the follow-up survey was conducted between July 7, 2015 – July 21, 2015
– Each survey was sent out directly to 126 recipients (GIS professionals and/or administrators in the local jurisdictions and other regional organizations) with additional promotion to Southwest Ohio GIS Users Group members
– A total of 64 participants during the first survey and 45 participants during the follow-up survey
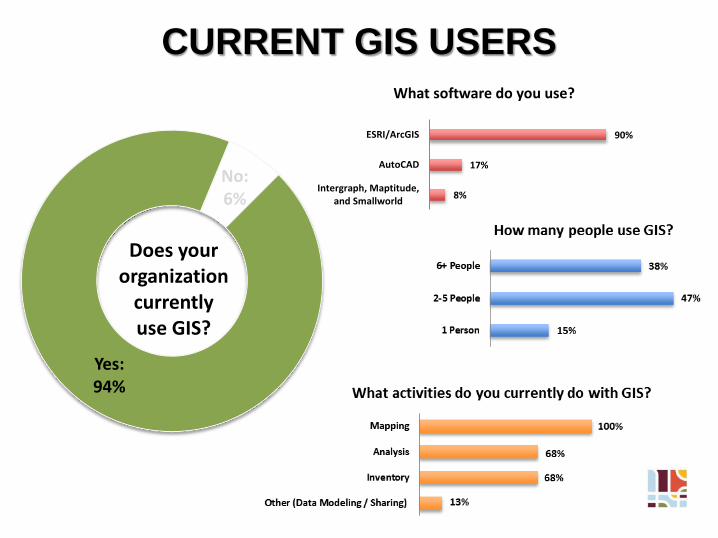
CURRENT GIS USERS
Yes: 94%
No: 6%
Does your organization
currently use GIS?
90%
17%
8%
ESRI/ArcGIS
AutoCAD
Intergraph, Maptitude,and Smallworld
What software do you use?
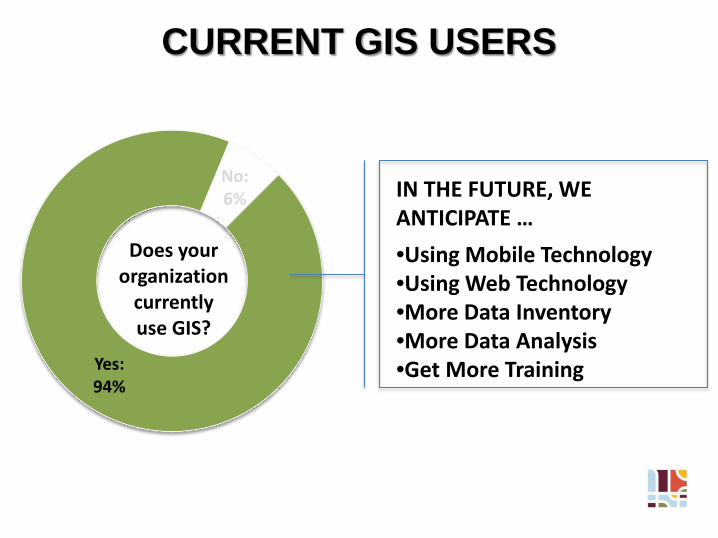
CURRENT GIS USERS
Yes: 94%
No: 6%
Does your organization
currently use GIS?
IN THE FUTURE, WE ANTICIPATE …
•Using Mobile Technology •Using Web Technology •More Data Inventory •More Data Analysis •Get More Training
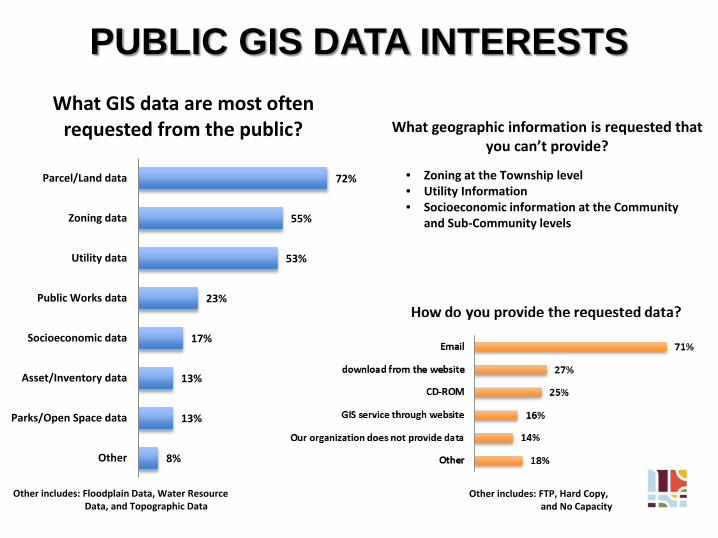
PUBLIC GIS DATA INTERESTS
What geographic information is requested that you can’t provide?
• Zoning at the Township level • Utility Information • Socioeconomic information at the Community
and Sub-Community levels
8%
13%
13%
17%
23%
53%
55%
72%
Other
Parks/Open Space data
Asset/Inventory data
Socioeconomic data
Public Works data
Utility data
Zoning data
Parcel/Land data
What GIS data are most often requested from the public?
Other includes: Floodplain Data, Water Resource Data, and Topographic Data
Other includes: FTP, Hard Copy, and No Capacity

MAP APPS ON THE WEB
Are there any other mapping application(s) that your organization is interested in pursuing in the future?
• Business Directory • Parks • Tableau • Emergency Management Information • Infrastructure • Future Land Use • Asset Management

NO MAP APPS ON THE WEB
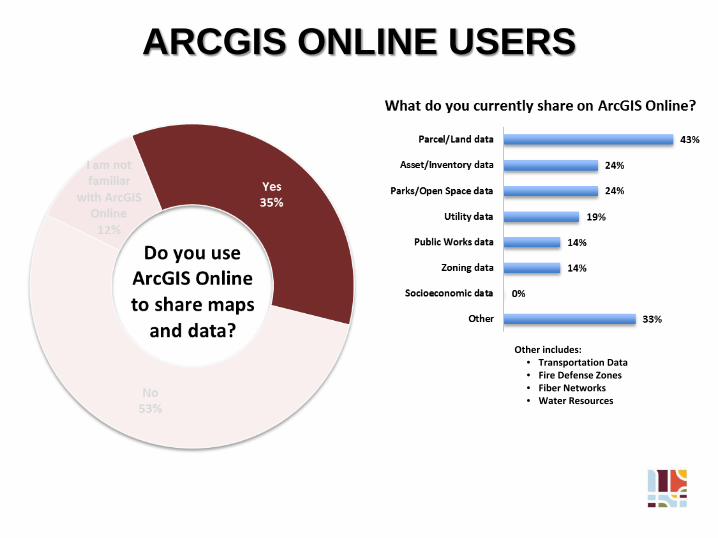
ARCGIS ONLINE USERS
Other includes: • Transportation Data • Fire Defense Zones • Fiber Networks • Water Resources
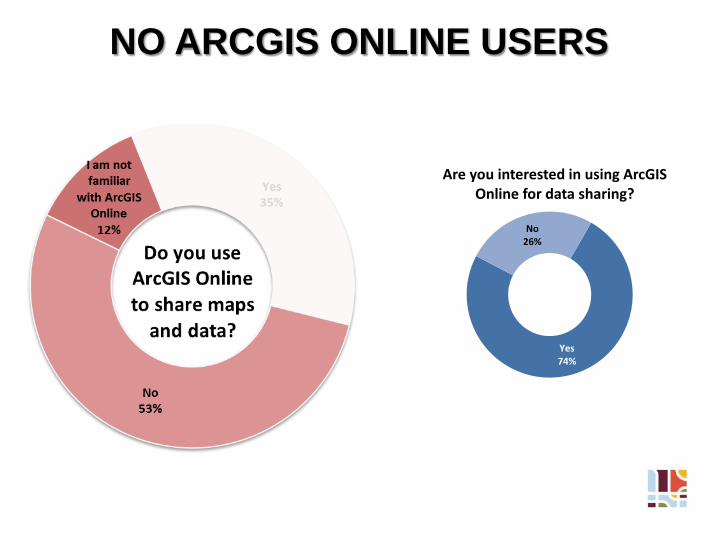
NO ARCGIS ONLINE USERS
Yes 74%
No 26%
Are you interested in using ArcGIS Online for data sharing?

PROJECT IDEAS
• Parcel/Land Data Inventory – Zoning – Future Land Use – Vacancies – Brownfields – 3D Buildings
• Asset Data Inventory
– Utilities (water, sewer, oil, gas, electric, gas, cable, etc)
– Community Point of Interest and Assets
– Recreational Amenities – Emergency Management
Do you have any ideas or suggestions on what project(s) our region should pursue?
• Socioeconomic Data Inventory – Census Demographic
information at the Community and Sub-Community levels
– Business Directory • Others
– Training (Desktop, Data Analysis, Census Data, and ArcGIS Online, etc)
– Data Resource Catalog (listing of who has what data)
– Database Standardization
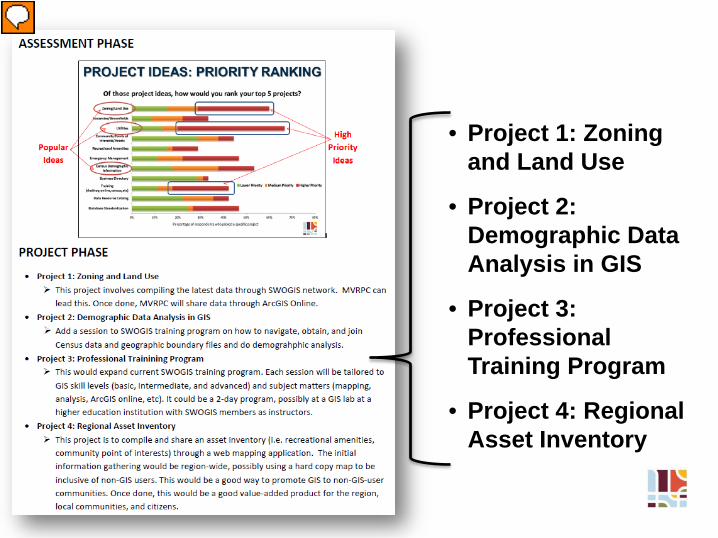
• Project 1: Zoning and Land Use
• Project 2: Demographic Data Analysis in GIS
• Project 3: Professional Training Program
• Project 4: Regional Asset Inventory

PROJECT IDEAS
• Parcel/Land Data Inventory – Zoning – Future Land Use – Vacancies – Brownfields – 3D Buildings
• Asset Data Inventory
– Utilities (water, sewer, oil, gas, electric, gas, cable, etc)
– Community Point of Interest and Assets
– Recreational Amenities – Emergency Management
Do you have any ideas or suggestions on what project(s) our region should pursue?
• Socioeconomic Data Inventory – Census Demographic
information at the Community and Sub-Community levels
– Business Directory • Others
– Training (Desktop, Data Analysis, Census Data, and ArcGIS Online, etc)
– Data Resource Catalog (listing of who has what data)
– Database Standardization

PROJECT IDEAS: PRIORITY RANKING
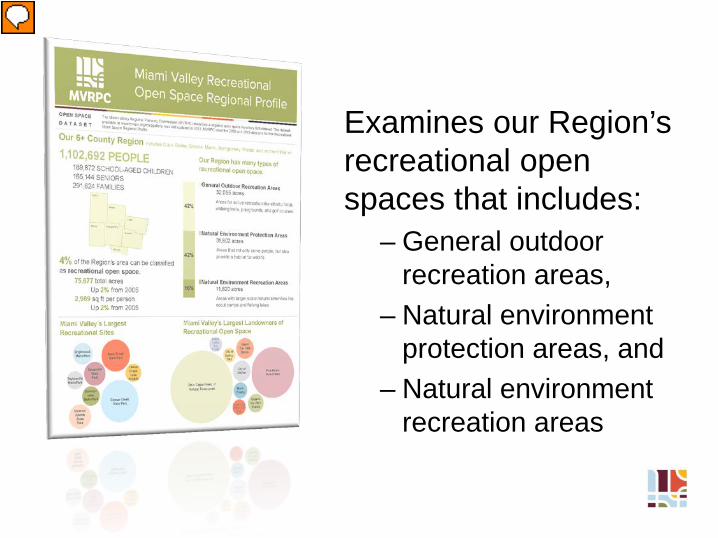
Examines our Region’s recreational open spaces that includes:
– General outdoor recreation areas,
– Natural environment protection areas, and
– Natural environment recreation areas
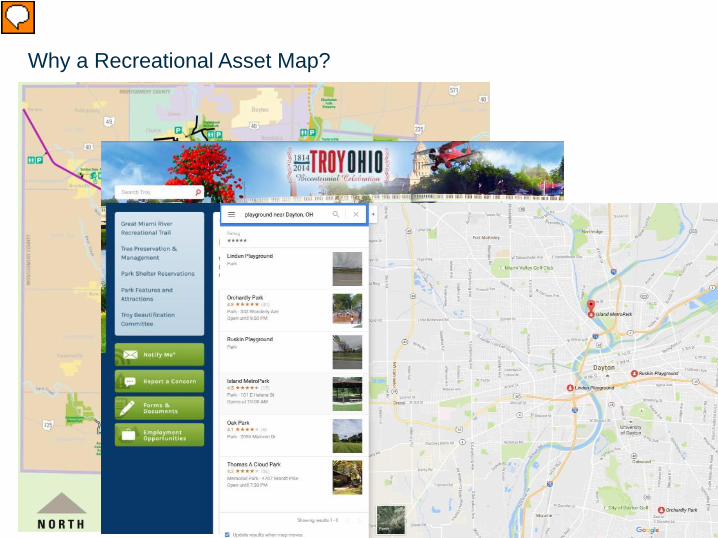
Why a Recreational Asset Map?
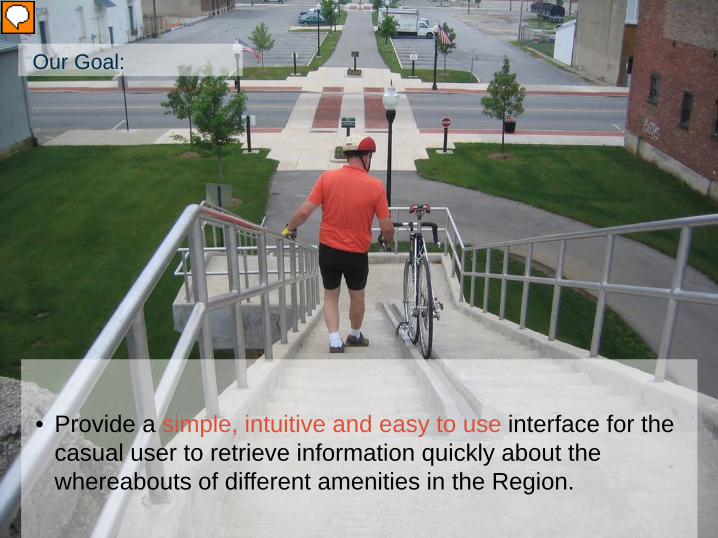
Our Goal:
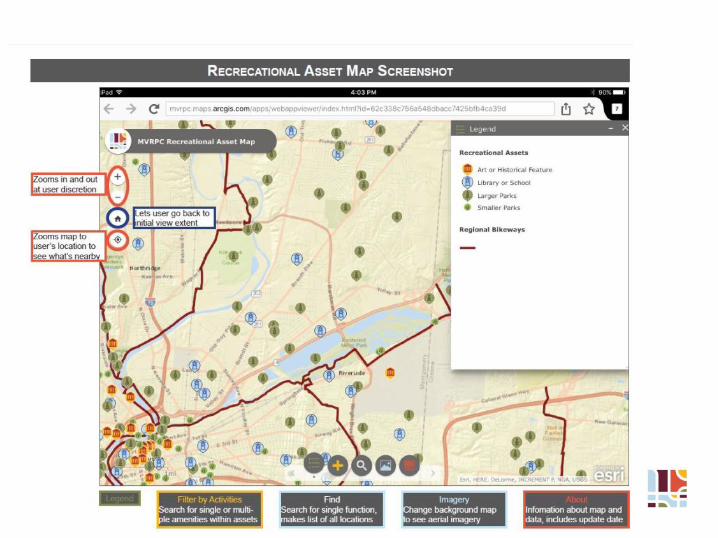
• Provide a simple, intuitive and easy to use interface for the casual user to retrieve information quickly about the whereabouts of different amenities in the Region.
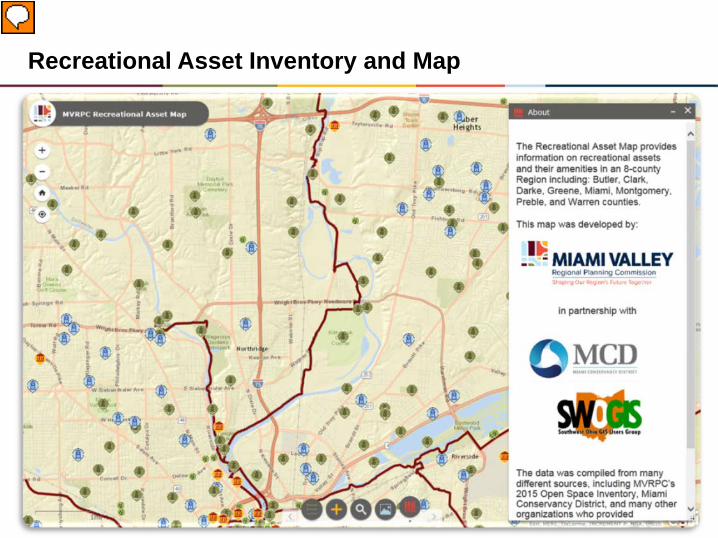
Recreational Asset Inventory and Map
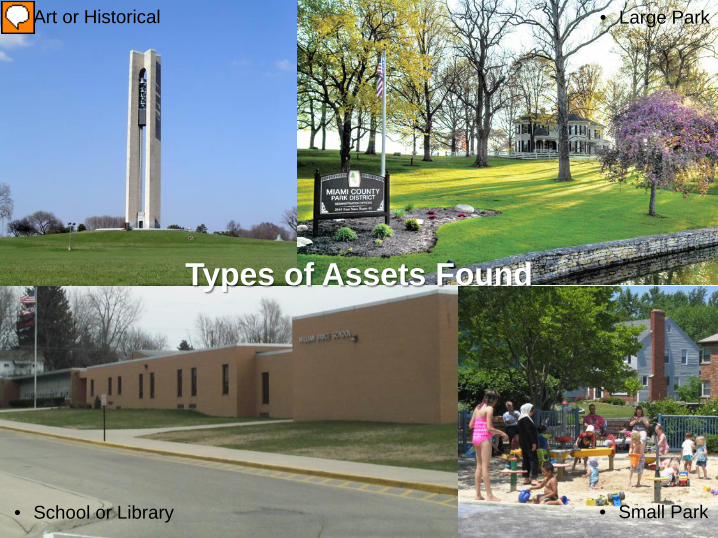
• Art or Historical
• Small Park • Large Park
Types of Assets Found
• School or Library • Small Park
• Large Park
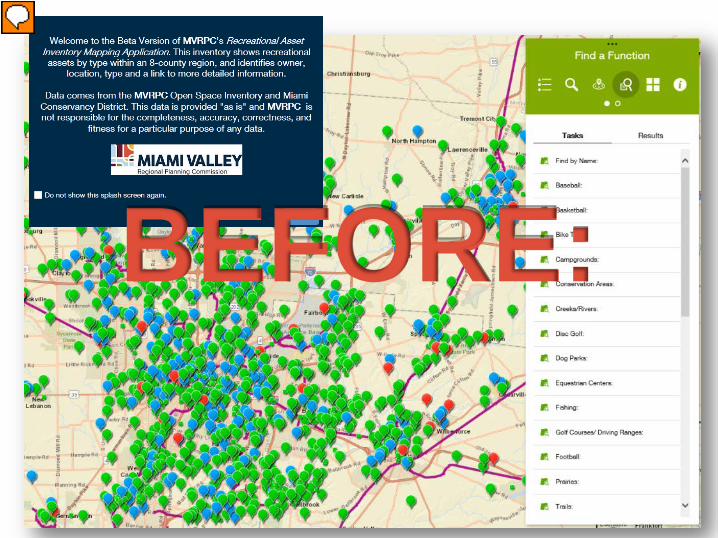
BEFORE:

AFTER
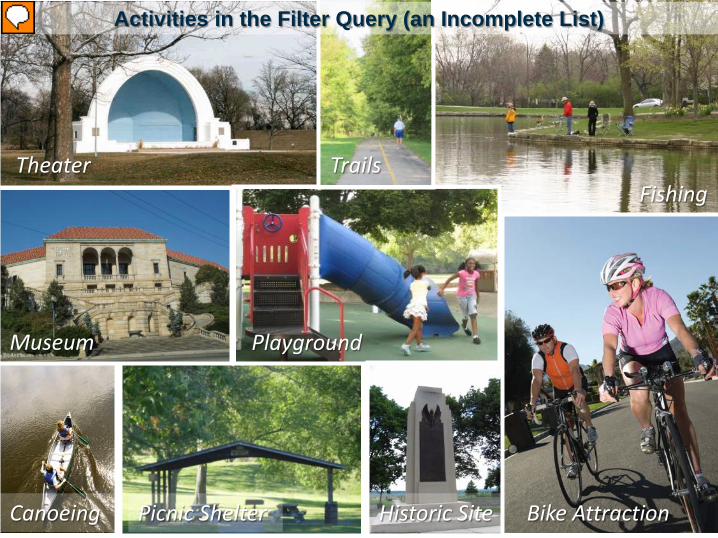
Fishing
Activities in the Filter Query (an Incomplete List)
Theater
Picnic Shelter Bike Attraction
Playground
Canoeing
Trails
Historic Site
Museum


Wish List for Improvements:
Weather:
Air Quality:

PROJECT IDEAS
• Parcel/Land Data Inventory – Zoning – Future Land Use – Vacancies – Brownfields – 3D Buildings
• Asset Data Inventory
– Utilities (water, sewer, oil, gas, electric, gas, cable, etc)
– Community Point of Interest and Assets
– Recreational Amenities – Emergency Management
Do you have any ideas or suggestions on what project(s) our region should pursue?
• Socioeconomic Data Inventory – Census Demographic
information at the Community and Sub-Community levels
– Business Directory • Others
– Training (Desktop, Data Analysis, Census Data, and ArcGIS Online, etc)
– Data Resource Catalog (listing of who has what data)
– Database Standardization
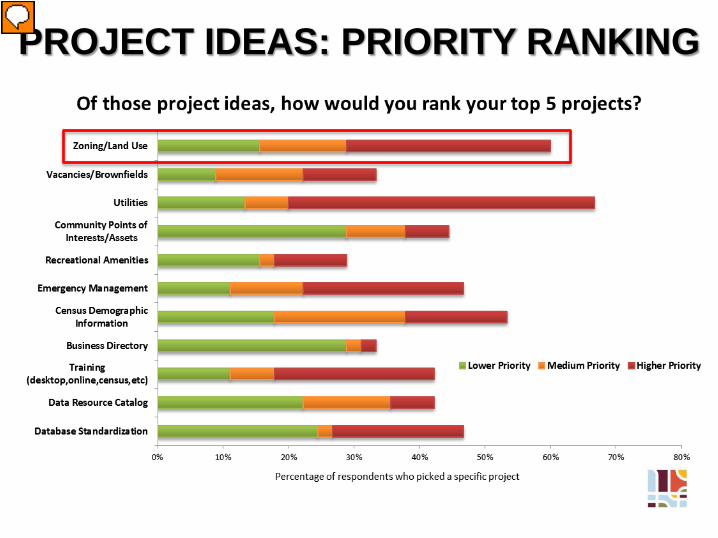
PROJECT IDEAS: PRIORITY RANKING

Updated Regional Layers
• Updated generalized zoning information
• Updated information on jurisdictional adopted land use plans
• An updated Regional Open Space Inventory

Updated Regional Layers: Zoning
Jurisdictional zoning was compiled from across the Region and generalized into several useful categories, updating a layer from 2008
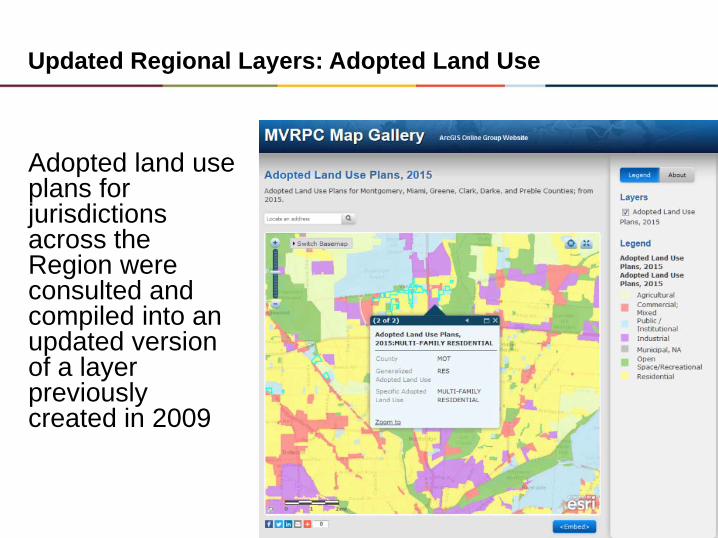
Updated Regional Layers: Adopted Land Use
Adopted land use plans for jurisdictions across the Region were consulted and compiled into an updated version of a layer previously created in 2009
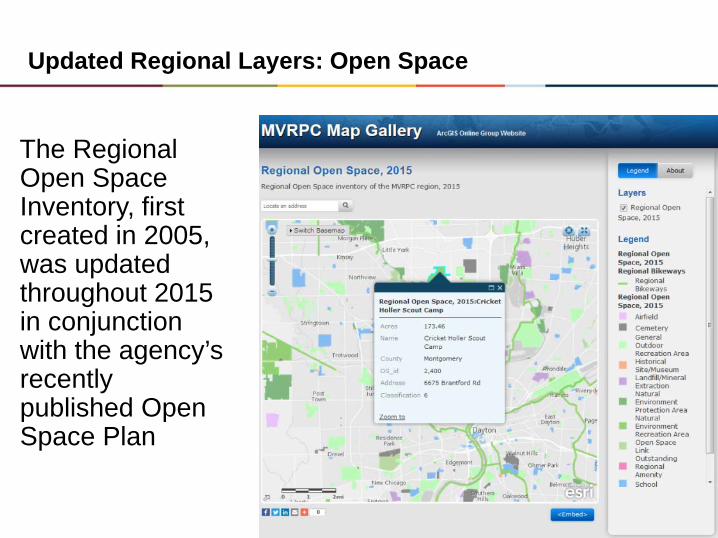
Updated Regional Layers: Open Space
The Regional Open Space Inventory, first created in 2005, was updated throughout 2015 in conjunction with the agency’s recently published Open Space Plan
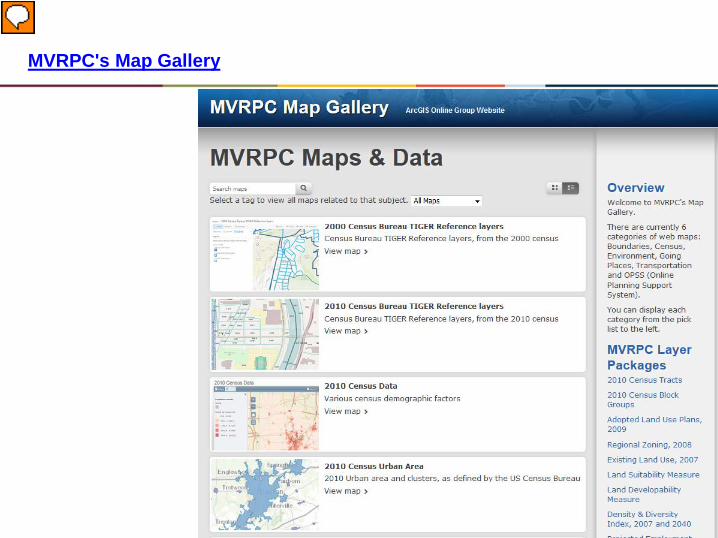
MVRPC's Map Gallery

New Online Mapping Applications
• Montgomery County Land Bank Neighborhood Initiative Program (NIP)
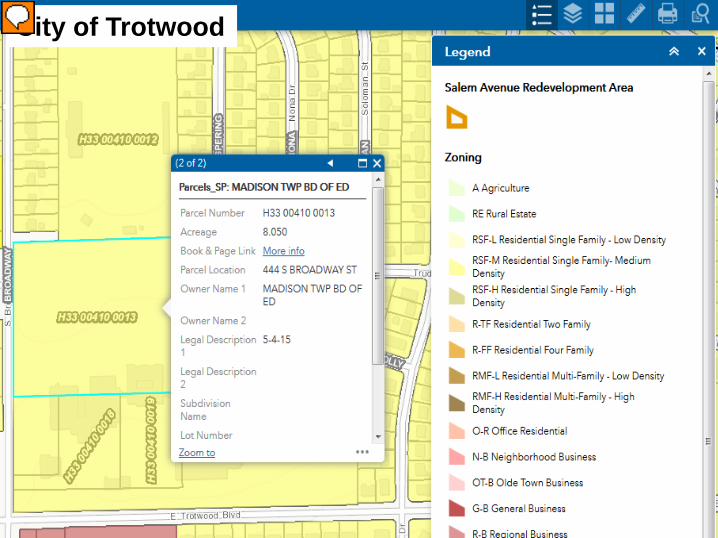
• City of Trotwood Zoning
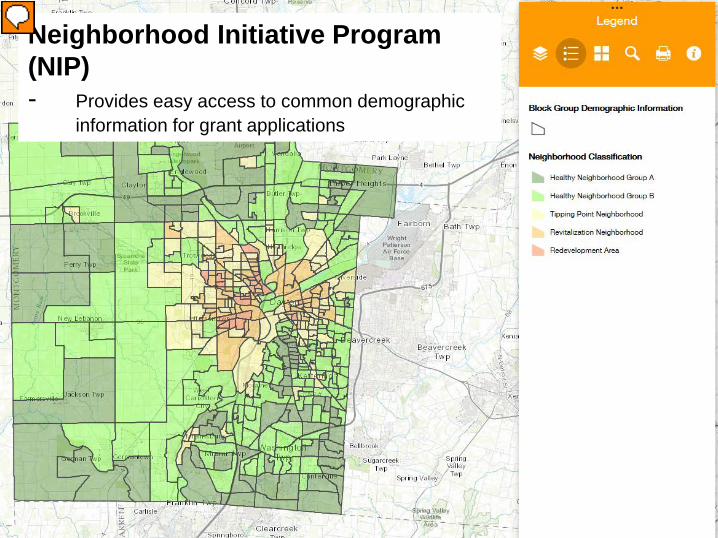
Neighborhood Initiative Program (NIP) - Provides easy access to common demographic information for grant applications

Neighborhood Initiative Program (NIP) - Data available at the Block Group, Jurisdiction and County levels
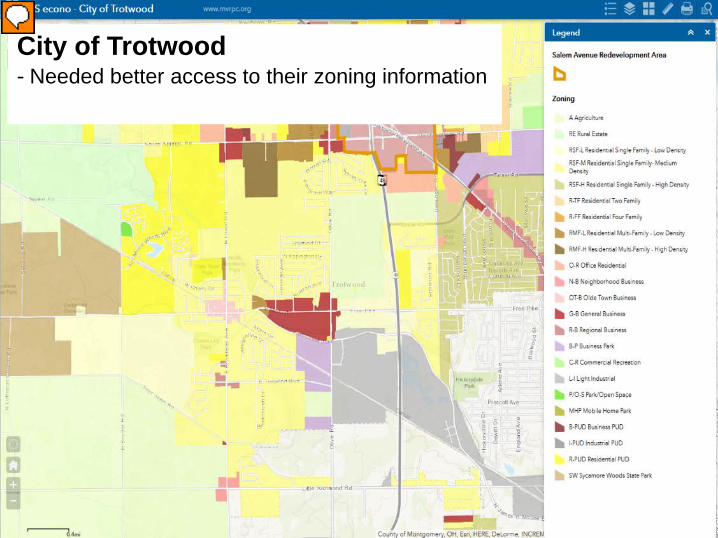
City of Trotwood - Needed better access to their zoning information
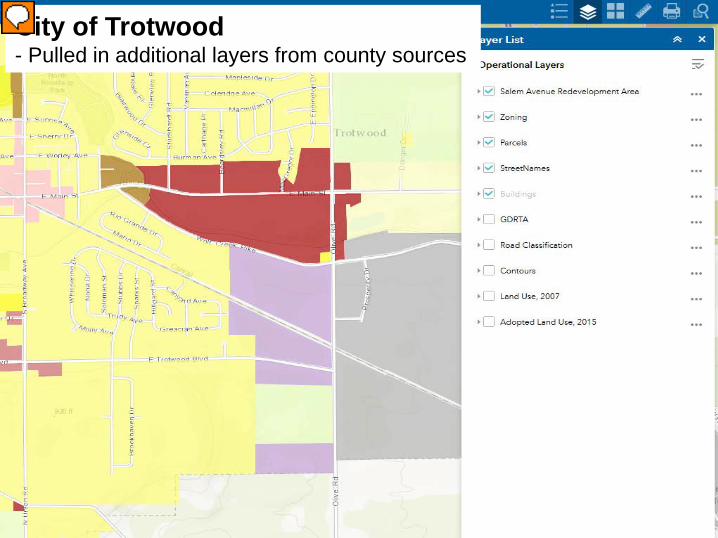
City of Trotwood - Pulled in additional layers from county sources
City of Trotwood

PROJECT IDEAS
• Parcel/Land Data Inventory – Zoning – Future Land Use – Vacancies – Brownfields – 3D Buildings
• Asset Data Inventory
– Utilities (water, sewer, oil, gas, electric, gas, cable, etc)
– Community Point of Interest and Assets
– Recreational Amenities – Emergency Management
Do you have any ideas or suggestions on what project(s) our region should pursue?
• Socioeconomic Data Inventory – Census Demographic
information at the Community and Sub-Community levels
– Business Directory • Others
– Training (Desktop, Data Analysis, Census Data, and ArcGIS Online, etc)
– Data Resource Catalog (listing of who has what data)
– Database Standardization

PROJECT IDEAS: PRIORITY RANKING

GIS Training: GIS & the Census
• This training session focused on hands-on learning on how to use Census data in GIS. It used ArcGIS Online as a platform instead of ArcGIS deskto

26 attendees, 22 of which were from 18 different member organizations.
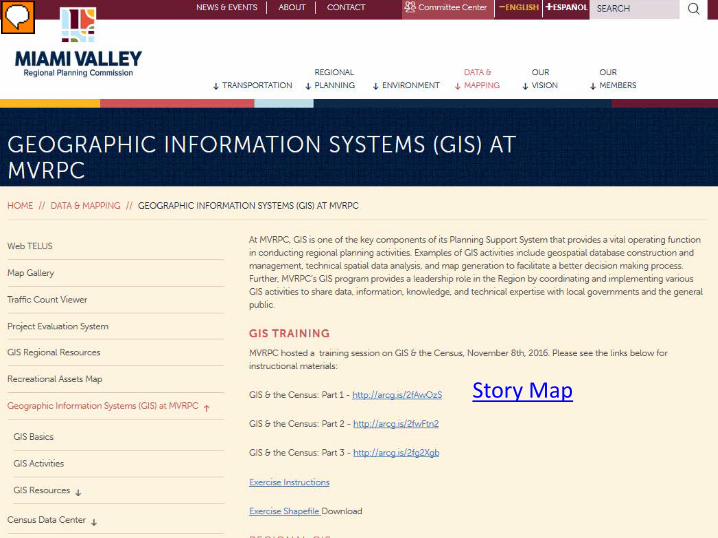
Story Map
Continue to provide GIS Services to share data and expertise with member local jurisdictions and the general public Major Areas of Concentration •Customized web mapping applications to address member’s needs •Subject-based professional training sessions •Regional mapping application(s) through collaborative partnerships
MVRPC GIS – WHAT’S NEXT?
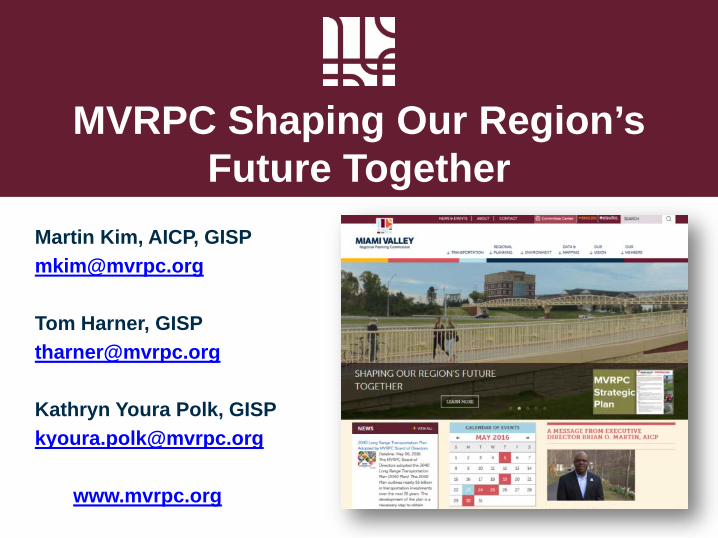
MVRPC Shaping Our Region’s Future Together
Martin Kim, AICP, GISP [email protected] Tom Harner, GISP [email protected] Kathryn Youra Polk, GISP [email protected] www.mvrpc.org