gis mapping in the field of social equity and advocacy...
TRANSCRIPT

GIS MAPPING
IN THE FIELD OF SOCIAL
EQUITY AND ADVOCACY
2010 SOUTHEASTERN COLLOQUIUM ON RACIAL INEQUALITY AND POVERTY
Samir Gambhir
Senior Research Associate (GIS)
Kirwan Institute for the Study of Race and Ethnicity
The Ohio State University

About Kirwan Institute2
Multidisciplinary applied research institute
Our mission is to expand opportunity for all, especially for our most marginalized communities
Founded in 2003 by john powell
About Our Work
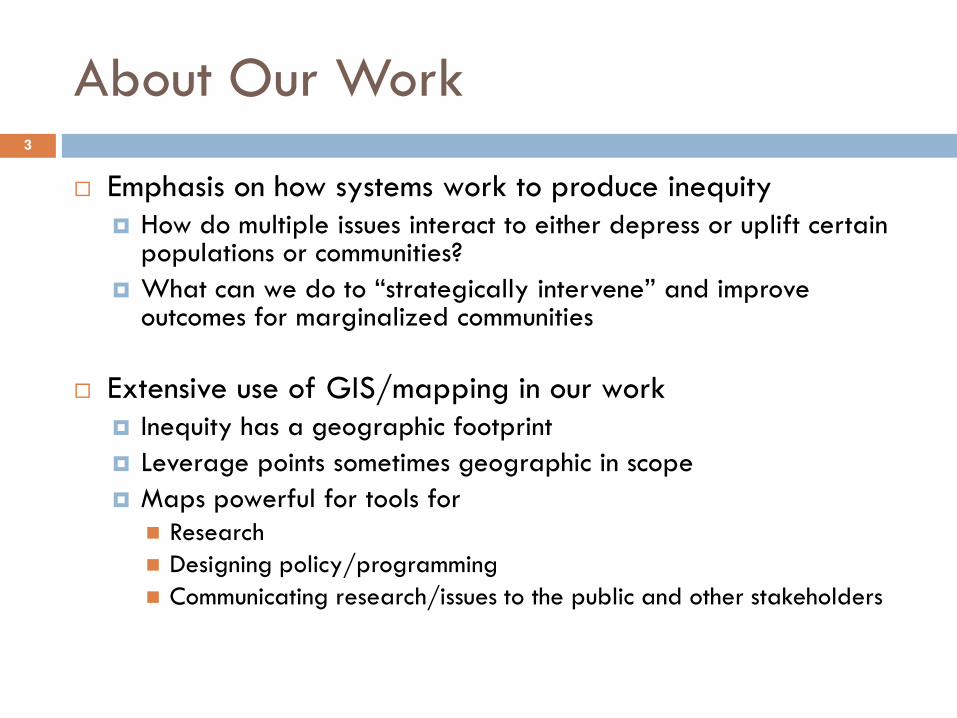
Emphasis on how systems work to produce inequity
How do multiple issues interact to either depress or uplift certain populations or communities?
What can we do to “strategically intervene” and improve outcomes for marginalized communities
Extensive use of GIS/mapping in our work
Inequity has a geographic footprint
Leverage points sometimes geographic in scope
Maps powerful for tools for
Research
Designing policy/programming
Communicating research/issues to the public and other stakeholders
3

GIS, its use and effectiveness
Use of mapping in our work
Opportunity mapping: Assumptions, methodology
and examples
Applications and Impact
Overview4

Introduction5
What is GIS?
"A geographic information system (GIS) is a computer-based tool for mapping and analyzing things that exist and events that happen on earth. GIS technology integrates common database operations such as query and statistical analysis with the unique visualization and geographic
analysis benefits offered by maps."
“GIS allows us to view, understand, question, interpret, and visualize data in many ways that reveal relationships, patterns, and trends in the form of maps, globes, reports, and charts.”
“A GIS helps you answer questions and solve problems by looking at your data in a way that is quickly understood and easily shared.”
Bing maps, Google Earth, GPS
Source: Environmental Systems Research Institute

Why use maps?
Maps are incredibly efficient
compacting volumes of data
ability to convey information in seconds
tell a story or solve a problem
6

Why is visual information important?
A picture is worth a thousand words
“People are able to look at the information based
on where they live or areas they are familiar with
and obtain a better understating”
7
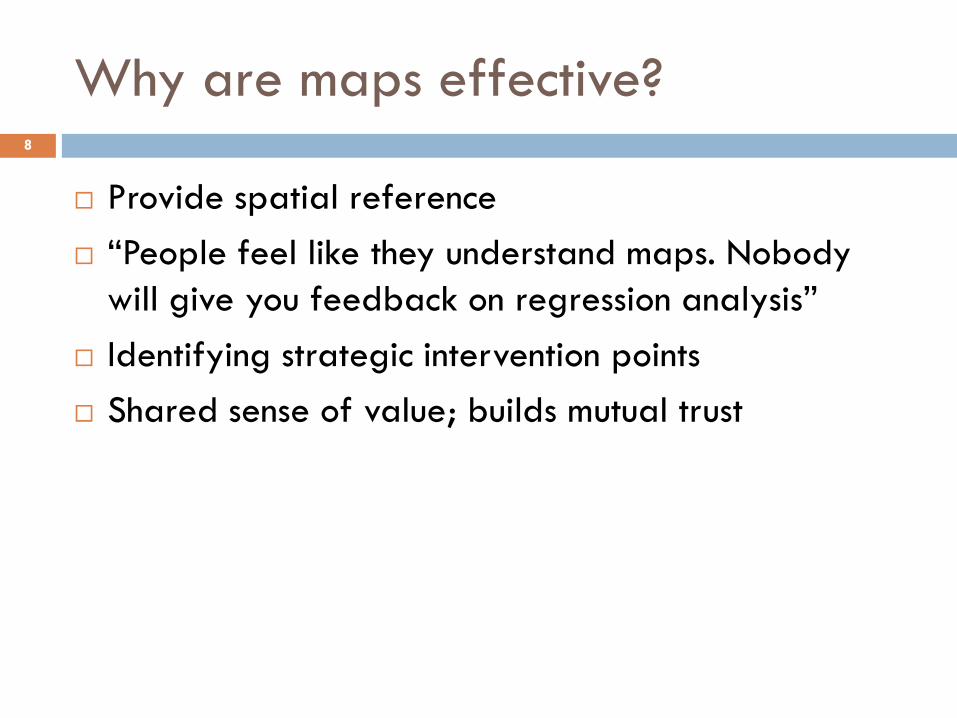
Why are maps effective?
Provide spatial reference
“People feel like they understand maps. Nobody
will give you feedback on regression analysis”
Identifying strategic intervention points
Shared sense of value; builds mutual trust
8

Research project
In collaboration with
The Opportunity Agenda
Joint Center for Political
and Economic Studies
http://opportunityagenda.org/mapping
9

Findings
Maps must be clear and easy to comprehend
Maps work best when framed to convey specific
advocacy issues
Mapping is
powerful in identifying systemic community-based
disadvantage and spatial racialization
very effective at identifying strategic intervention points
a good entry point for uniting diverse coalitions or
stakeholders
10

Space and Social Equity
Racial and social inequity often manifest as spatial inequity
Local issues tend have a regional scope and variation e.g. school performance, housing vacancy
Maps are naturally the best tools to display this spatial phenomena
Maps give us the opportunity to look at our entire regions or states
Informing people about an issue at a scale they may not usually think of
linking communities sharing similar problems
11

Using Maps for Advocacy
In our work we see mapping as serving these primary advocacy goals
Analysis
Existing conditions, spatial trends, scenarios, optimization etc.
Storytelling
A narrative
Combination
12

Analytical Examples
Are minority businesses located in areas of economic
opportunity? (Cleveland)
Are hospital investments benefiting communities of
color? (Columbus)
Are job growth areas connected to transit? (Baltimore)
What is the impact of stimulus money investment on job
creation? (Florida)
13

MBE and Projected Job Change 2000-2030
14

Hospital Investments
and African
American
neighborhoods
Columbus
Health equityresearch
15

Spatial Mismatch
Percent Change in Jobs
30 - 66.6
15 - 30
5 - 15
0 - 5
Job Loss
Recent Job Growth 98-02 and Public Transit
in the Baltimore Region
Job Growth & Public
Transit in Baltimore
16

Stimulus investments
and Job creation in
Orlando MSA, FL
ARRA Investments
17
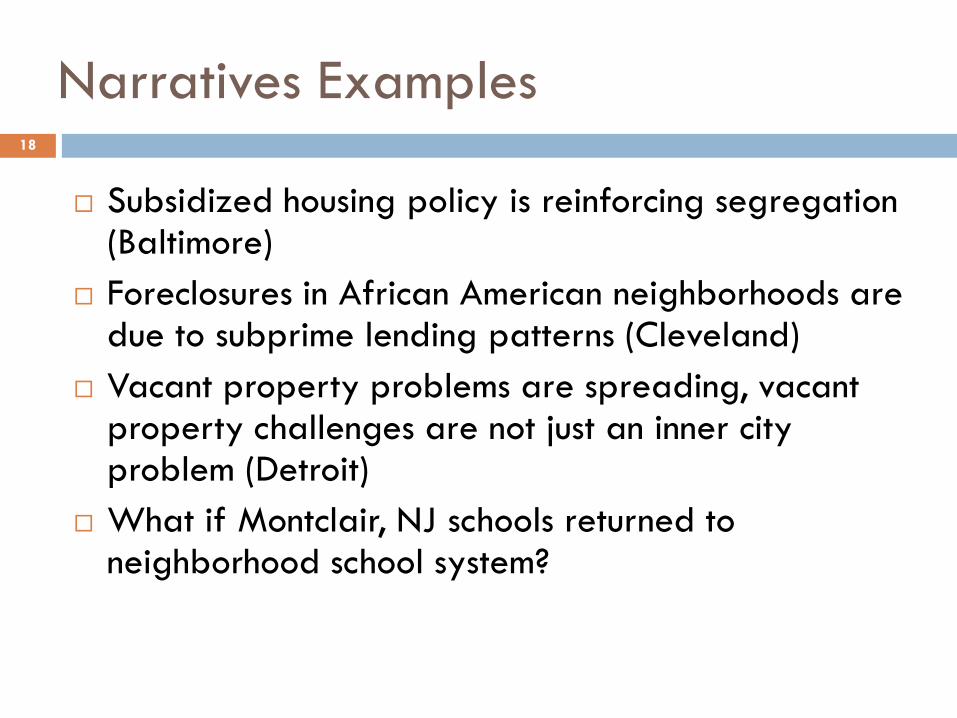
Narratives Examples
Subsidized housing policy is reinforcing segregation (Baltimore)
Foreclosures in African American neighborhoods are due to subprime lending patterns (Cleveland)
Vacant property problems are spreading, vacant property challenges are not just an inner city problem (Detroit)
What if Montclair, NJ schools returned to neighborhood school system?
18

Conditions in
Baltimore
Subsidized housing opportunities in Baltimore are generally clustered in the region’s predominately African American neighborhoods
c
19

Race and Foreclosure (Cleveland MSA)
(Note: Not one of our maps)
20

Race and Subprime Lending (Cleveland MSA)
(Note: Not one of our maps)
Maps: Produced and adapted from Charles Bromley, SAGES
Presidential Fellow, Case Western University
21
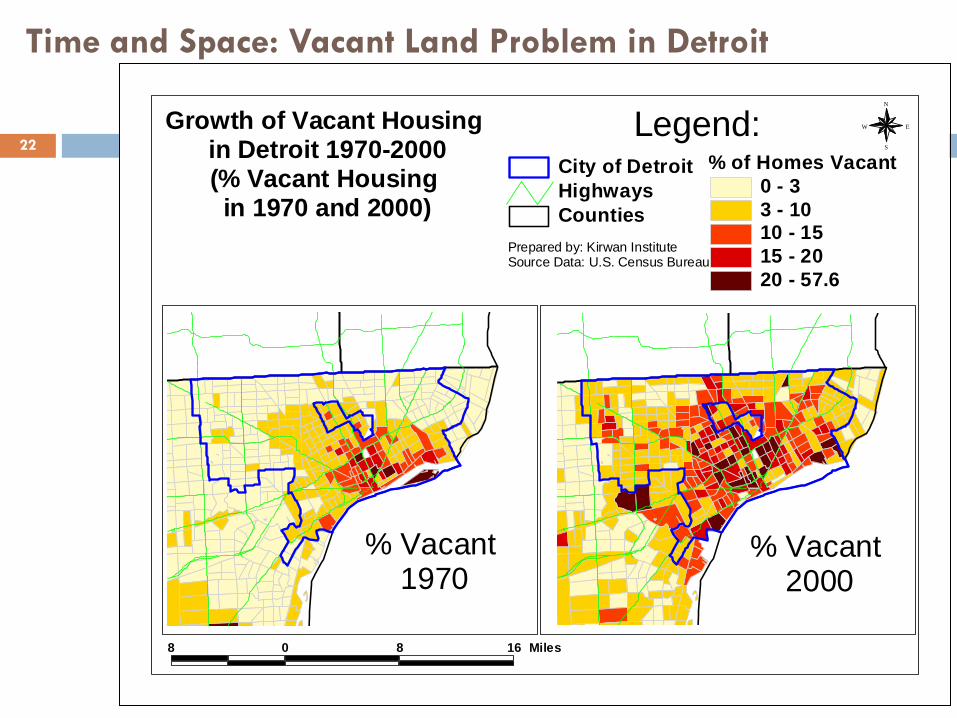
Time and Space: Vacant Land Problem in Detroit
8 0 8 16 Miles
N
EW
S
Growth of Vacant Housing in Detroit 1970-2000(% Vacant Housing in 1970 and 2000)
% Vacant 1970
% Vacant 2000
% of Homes Vacant
0 - 3
3 - 1010 - 15
15 - 20
20 - 57.6
Counties
Highways
City of Detroit
Prepared by: Kirwan InstituteSource Data: U.S. Census Bureau
Legend:22

Montclair School District, NJ

Opportunity Mapping:Combining Analysis with a Strong Narrative
Research tool to
understand the dynamics of “opportunity” within
metropolitan areas
illustrate where opportunity rich communities exist (and
assess who has access to these communities)
understand what needs to be remedied in opportunity poor
communities
Based on Kirwan Institute’s “Communities of
Opportunity” framework
24

The Communities of Opportunity Approach
25
Everyone should have fair access to the critical opportunity structures needed to succeed in life.
Low Opportunity neighborhoods limit the development of human capital.
A Community of Opportunity approach can develop pathways that result in increased social and economic health, benefiting everyone.

The Communities of Opportunity Primer
26
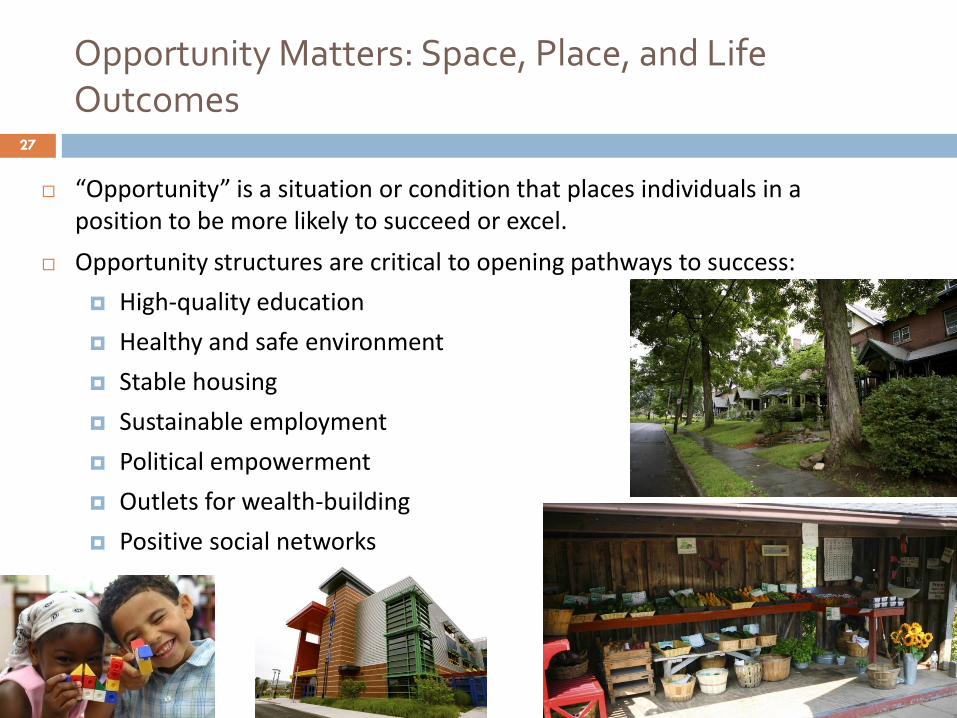
Opportunity Matters: Space, Place, and Life Outcomes
“Opportunity” is a situation or condition that places individuals in a position to be more likely to succeed or excel.
Opportunity structures are critical to opening pathways to success:
High-quality education
Healthy and safe environment
Stable housing
Sustainable employment
Political empowerment
Outlets for wealth-building
Positive social networks
27

Space and Opportunity
28
28

Redlining maps (Hartford, CT)29
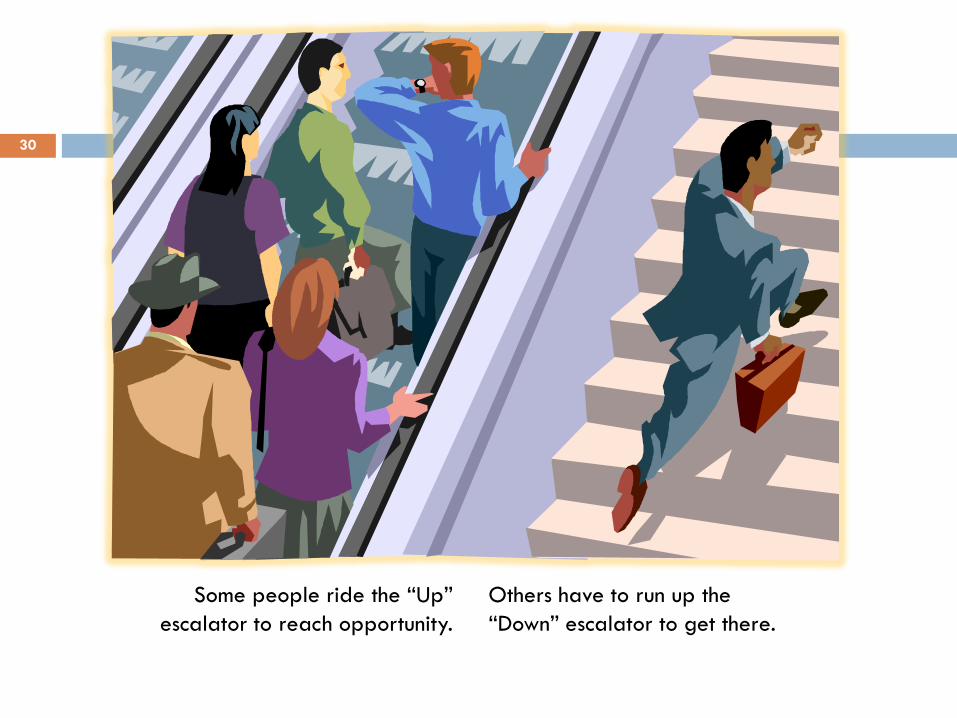
Some people ride the “Up”
escalator to reach opportunity.
Others have to run up the
“Down” escalator to get there.
30
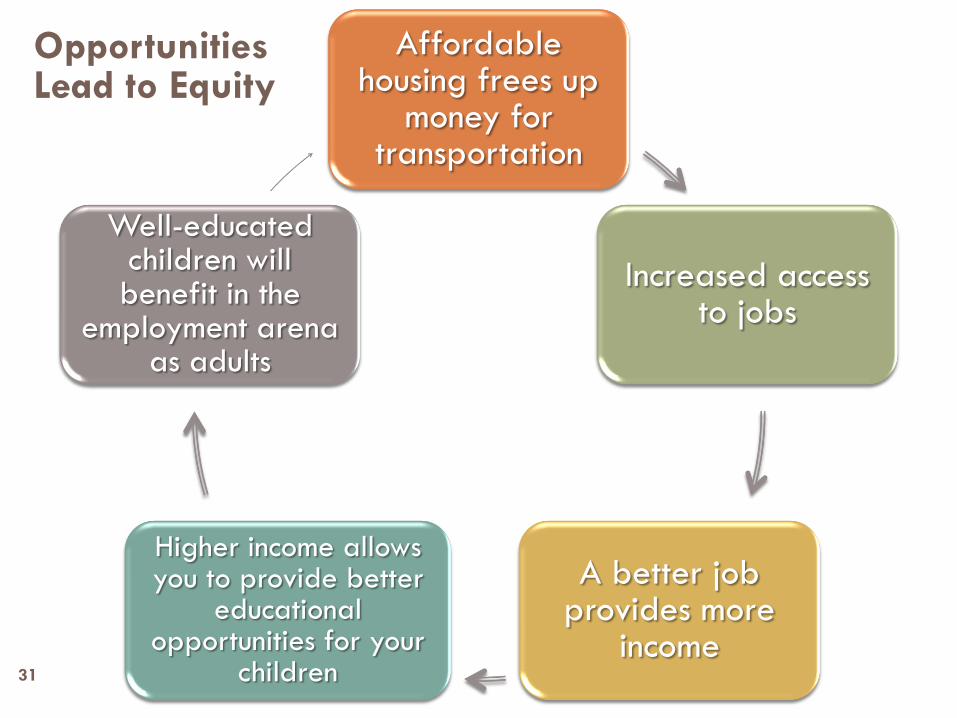
Affordable housing frees up
money for transportation
Increased access to jobs
A better job provides more
income
Higher income allows you to provide better
educational opportunities for your
children
Well-educated children will benefit in the
employment arena as adults
Opportunities Lead to Equity
31

Mapping Opportunity:
Why and How
The Communities of Opportunity framework is inherently spatial
Inequality has a geographic footprint
Maps can visually track the history and presence of discriminatory and
exclusionary policies that spatially segregate people
Identifying places with gaps in opportunity can help direct future investment
and identify structures which impede access to opportunity
The model uses state-of-the-art GIS and extensive data sets to analyze the distribution of opportunity in our metro regions
32

Opportunity Mapping Model
A refined model to depict spatial pattern of
opportunity
Identifying indicators as proxy for opportunity
Supported by social science literature
Data easily available
Index based approach compresses multi-factors to an index
Model is a good communications tool to work with
communities
33

Opportunity Mapping Booklet
34

Mapping Communities of Opportunity: Methods and Indicators
How do you map opportunity? Data representing community conditions is gathered for neighborhood
(census tracts) across the state or region Aggregated to the Census Tract level
Analyzed to create a comprehensive opportunity index for the region
The opportunity index is then mapped and census tracts are broken into quintiles based on their opportunity score Very Low, Low, Moderate, High, Very High
35

OPPORTUNITY MAPPING FOR
ATLANTA METROPOLITAN REGION
Example36
Education Indicators
Adult Education Attainment
Neighborhood School Poverty
Math and Reading Test Scores for Neighborhood
Schools
Teacher Qualifications
37

Education Opportunity Map38

Economic Indicators
Unemployment Rates
Population on Public Assistance
Proximity to Employment
Economic Climate (Job Change)
Business Climate (Business Creation)
39

40
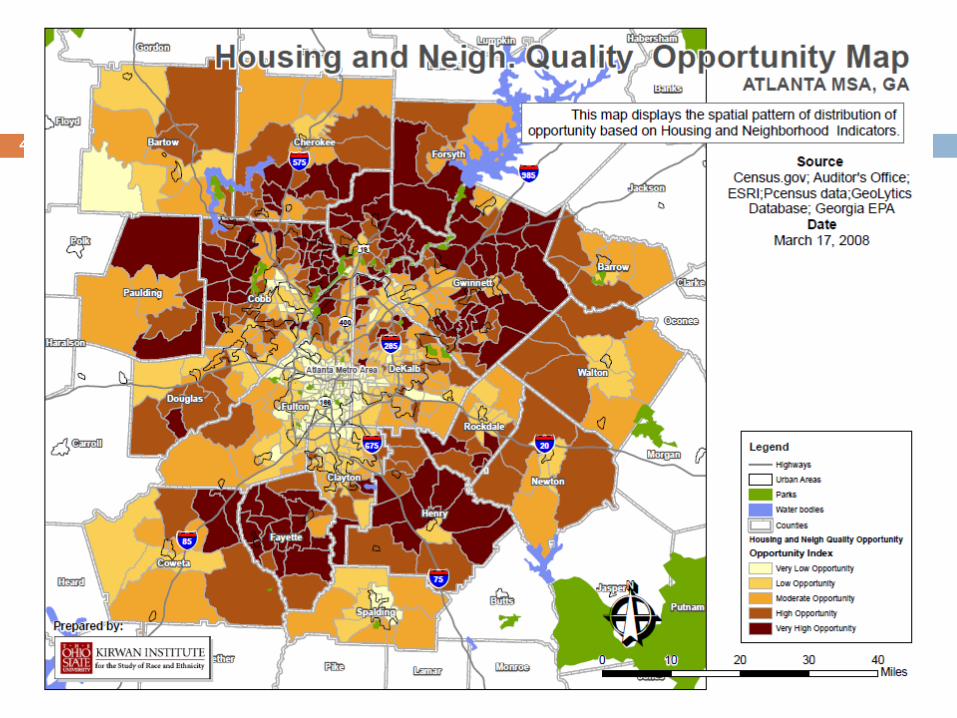
Housing and Neighborhood Indicators
Housing Vacancy Rates
Poverty rates
Crime Rates
Home Ownership
Foreclosures
Property Appreciation
Proximity to Toxic Waste Sites
41
42
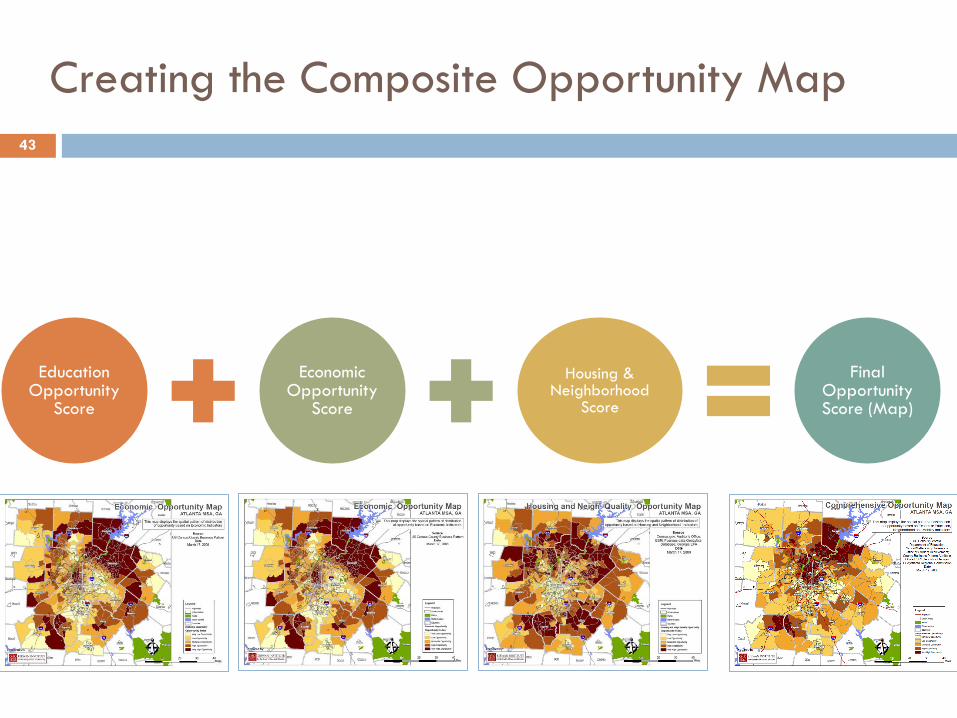
Creating the Composite Opportunity Map
43
Education Opportunity
Score
Economic Opportunity
Score
Housing & Neighborhood
Score
Final Opportunity Score (Map)

44

Opportunity Analysis45

Redlining: 1937 to 200946

African American men are isolated
from neighborhoods of opportunity
in Detroit
Detroit Opportunity
and Race47

Low opportunity neighborhoods have higher number of linguistically isolated households
Austin Opportunity and
Linguistic Isolation
48

Applications and Impact49

Thompson v. HUD50
Fair housing Litigation in Baltimore
brought on behalf of 14,000 African-American residents of public housing
in response to history of racial segregation of public housing
Represented by Maryland ACLU and NAACP Legal Defense Fund
US District Court of Maryland, Judge Marvin Garbis
Began in 1995…judge issued liability ruling in 2005 found HUD liable for violating the federal Fair Housing Act

Opportunity Mapping in Baltimore
51
Use of 14 indicators of neighborhood opportunity to designate high and low opportunity neighborhoods in the Baltimore region
Indicators of Opportunity (General) Neighborhood Quality/Health
Poverty, Crime, Vacancy, Property Values, Population Trends
Economic Opportunity Proximity to Jobs and Job Changes,
Public Transit
Educational Opportunity School Poverty, School Test Scores,
Teacher Qualifications

52
Subsidized housing
opportunities in
Baltimore are
generally clustered in
the region’s lowest
opportunity
neighborhoods

Impacts
Outside of the litigation, the opportunity maps have been used in a variety of ways Program evaluation and planning Monitoring partial consent decree program
Identifying Opportunities/Challenges Assessing opportunities/challenges related to the foreclosure
crisis
Regional housing advocacy Baltimore Regional Housing Coalition
Research Tracking outcomes for families who move to high opportunity
areas (John Hopkins)
53

54
Initial Moves and Secondary Moves by Thompson Consent
Decree Program Participants
c
c
c

MA Legal Services and
Opportunity Communities
Background on this project Originated from effort to incorporate
mapping analysis into legal services
Partners Massachusetts Law Reform Institute,
MA Legal Assistance Corp (foundation) and other Legal Services Entities
Year long process of meeting with stakeholders to understand mapping needs and issues
Training with service providers & agencies (using mapping for programming)
55

Mapping Communities of Opportunity:
Methods and Indicators
Three areas of
opportunity were
analyzed using GIS
mapping capability:
Education Quality and
Opportunity
Economic Health and
Transportation
Neighborhood Stability and
Health
56

Impact
Program design and use within the legal services New programming – proposed “Adopt A Zip Code” program Use in exploring client concerns/challenges Use in litigation (National Consumer Law Center) Internal use by funder (MLAC)
Direct advocacy State opportunity impact assessment (proposed) Dissemination among state agencies
State level program design (public sector) New $5 million state affordable housing program, targeted to
high opportunity communities Implementation still unfolding
57

58

Concluding Thoughts59
Tools and Tips for Using GIS to Support Regional Equity
60
Do not underestimate the power of maps to illustrate problems, build support, increase awareness and change minds
Think regional when mapping
Even when looking at localized issues/problems, you may find they are regional in scope
Maps are just another tool to help you
Do not be wary of the technology
Many places to receive help: universities, research/advocacy organizations, some non-profits
What story do you want to tell?
Utilize maps to tell that story

Thank you!For questions, comments or for more information: www.kirwaninstitute.org
or e-mail us at [email protected]