gitanjali report1
TRANSCRIPT

8/4/2019 Gitanjali report1
http://slidepdf.com/reader/full/gitanjali-report1 1/10
Dugad FinservPrivate Limited
Institutional Analysis
Gitanjali Gems Ltd.
05 October, 2
Email : [email protected] Finserv Private Limited
Investment RationaleGitanjali Gems plans to restructure its business which will unlock its value
for shareholder'sGitanjali Gems, which owns brands such as Nakshatra and Ddamas, is going in forrestructuring. The company has roped in KPMG to help in restructuring itsbusinesses. The board has decided to explore the potential merger of subsidiaries,demerger and other forms of restructuring, or acquisition, or spin-offs with theultimate aim of enhancing and unlocking shareholder value. The restructuringinitiative is expected to be completed over the next year. As per the company, theybelieve that their retail brands are worth Rs 5,000 crores. Hence we believe that itsintrinsic value of the company would be much more than the existing market caponce the restructuring is done.
Demand and positive industry outlook defines promising growth potentialsGems and Jewellery is primarily used to decorate and adorn. The demand fordifferent types of Gems and Jewellery is influenced by several factors like buyerspreferences, properties, varieties, unit values, applications, etc. According to WorldGold Council (WGC), the Indian jewellery market currently is worth about Rs.700bn (USD14.58 bn). Of this, the urban jewellery market is valued at Rs.280 bn(USD5.83 bn) and the rural & semirural market is valued at Rs.420 bn (USD 8.75 bn)Gold jewellery forms around 80% of the Indian jewellery market (approx. Rs.560 bn(USD 11.67 bn)), with the balance comprising fabricated studded jewellery thatincludes diamond studded as well as gemstone studded jewellery.
Infratech business will unlock its value in the coming YearsGitanjali is constructing the first privately owned and managed jewellery SEZ inIndia, the Rajiv Gems Park at Hyderabad, Andhra Pradesh, which is intended tobecome one of the largest gems and jewellery SEZs in India. Gitanjali's Rajiv GemsPark at Hyderabad SEZ, has developed five modern state of art manufacturingfacilities for commercial production and a training center. These facilities are upand running and are employing nearly 1500 workers. There are further more
projects in the pipeline. Hence we believe that Gitanjali Gems will unlock thehidden values on the realty in the coming years. Currently its land bank is valued atRs 1500 crores.
We believe Gitanjali Gems Limited is all set to generate higher revenues withgood margins and also unlock its hidden value by restructuring and real estateAt current price of Rs. 244.25, the stock is trading at a PE of 8.1x and 5.2x andP/BV of 0.8x and 0.7x for FY11E and FY12E respectively. The valuation looksattractive and we recommend “OUTPERFORMER” on the stock with a targetprice of Rs. 338 per share (PE of7.2 x for FY12E), an upside of 38%.
Valuation
Outperformer
Share Holding Pattern
Share Price Movement
Financial Snapshot
Key Stock Summary
Source: Company, DFPL Research
Source: Company, DFPL Research
Source: Company, DFPL Research
Research Team
Email: [email protected]: 022-32255002/32255003Mobile: 9004094415
Source: Company, DFPL Research
Current Market Price 244.45BSE Code 532715
Bloomberg Ticker GITG IN
Face Value 10
Shares Outstanding (in crs) 8.51
Market Cap (Rs crs) 2079.3
Enterprise Value (Rs crs) 4674.6
52-week range (Rs)(H/L) 253.20 / 94
Beta 0.851
Avg. daily Volumes 2 Week 1032926
Dividend Yield (%) 0.8
80
100
120
140
160
180
200
220
240
15000
15800
16600
17400
18200
19000
19800
20600
S ep -0 9 No v-0 9 J an -1 0 Mar -1 0 May -1 0 J ul -1 0
S EN SEX G ita nja li G ems
Particulars (Rs in Crs) FY09 FY10 FY11E FY12E
Net Sales 5088.9 6527.6 7833.2 9243.1
EBITDA 327.0 446.0 509.2 693.2
EBITDA (%) 6.4% 6.8% 6.5% 7.5%
PAT 150.6 200.2 254.7 395.8
PAT (%) 3.0% 3.1% 3.3% 4.3%
EPS 17.7 23.8 30.2 47.0
ROCE (%) 5.0% 6.9% 7.4% 8.9%
ROE (%) 7.2% 9.1% 9.2% 12.6%
P/E (x) 13.8 10.3 8.1 5.2
EV/EBITDA (x) 12.6 10.4 8.6 6.6
8/4/2019 Gitanjali report1
http://slidepdf.com/reader/full/gitanjali-report1 2/10Dugad Finserv Private Limited
Dugad FinservPrivate Limited
Institutional Analys
Company Overview:
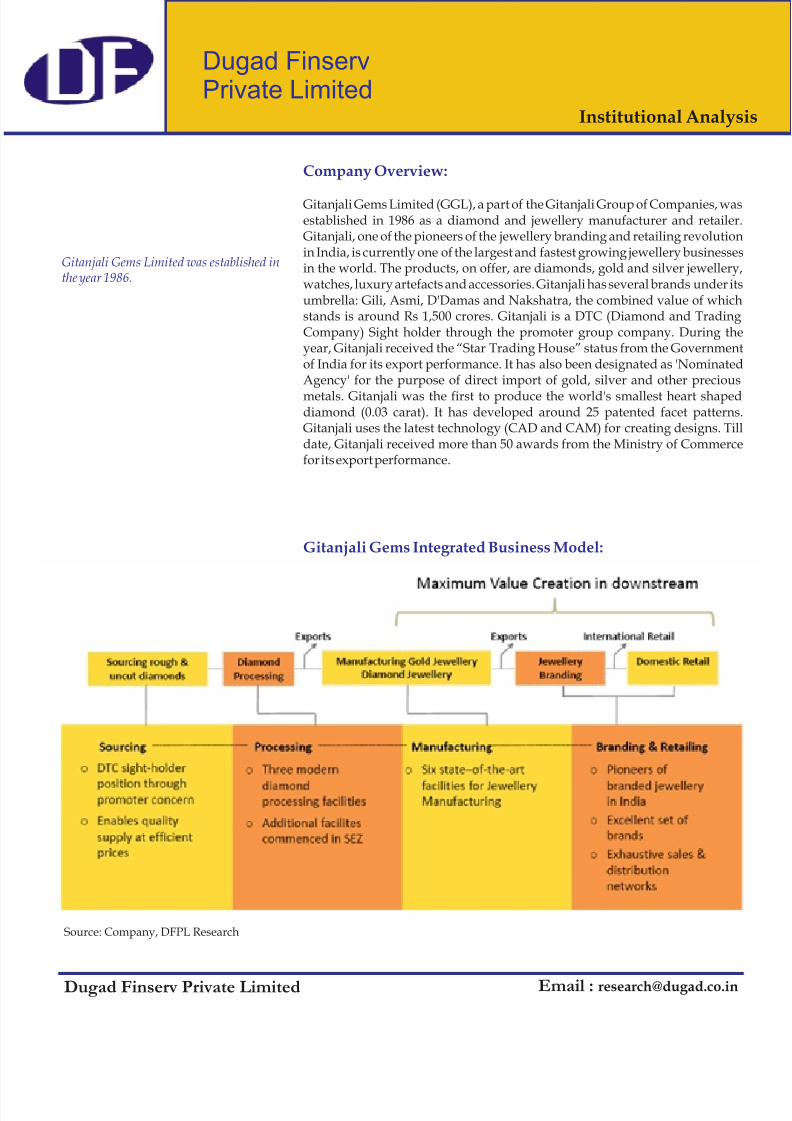
Gitanjali Gems Limited (GGL), a part of the Gitanjali Group of Companies, wasestablished in 1986 as a diamond and jewellery manufacturer and retailerGitanjali, one of the pioneers of the jewellery branding and retailing revolutionin India, is currently one of the largest and fastest growing jewellery businessein the world. The products, on offer, are diamonds, gold and silver jewellerywatches, luxury artefacts and accessories. Gitanjali has several brands under itsumbrella: Gili, Asmi, D'Damas and Nakshatra, the combined value of whichstands is around Rs 1,500 crores. Gitanjali is a DTC (Diamond and TradingCompany) Sight holder through the promoter group company. During theyear, Gitanjali received the “Star Trading House” status from the Governmenof India for its export performance. It has also been designated as 'NominatedAgency' for the purpose of direct import of gold, silver and other precious
metals. Gitanjali was the first to produce the world's smallest heart shapeddiamond (0.03 carat). It has developed around 25 patented facet patternsGitanjali uses the latest technology (CAD and CAM) for creating designs. Tildate, Gitanjali received more than 50 awards from the Ministry of Commercefor its export performance.
Gitanjali Gems Integrated Business Model:
Gitanjali Gems Limited was established inthe year 1986.
Email : [email protected]
Source: Company, DFPL Research

8/4/2019 Gitanjali report1
http://slidepdf.com/reader/full/gitanjali-report1 3/10Dugad Finserv Private Limited
Dugad FinservPrivate Limited
Institutional Analys
According to World Gold Council(WGC), the Indian jewellery market currently is worth about Rs.700 bn(USD14.58 bn). Of this, the urban
jewellery market is valued at Rs.280 bn(USD5.83 bn) and the rural & semiruralmarket is valued at Rs.420 bn (USD 8.75bn).
India is the largest consumer of gold in theworld followed by China and Japan. Indiaconsumes nearly 800 tonnes of goldaccounting for around 22% of the world
gold consumption and nearly 550-600tonnes of this goes into jewellery
consumption.
Email : [email protected]
Investment Rationale:
Favourable Macro EnvironmentIndia has the 2nd largest population and the largest youth population in theworld. It is the World's third largest diamond jewelry market and it will be of thesize $ 5 billion by 2013. India is one of the fastest growing economies in the worldwith 6% growth over the last decade. Currently the rating agency Fitchforecasted India's GDP will register a growth rate of 8.5% for the financial yearFY'11.
Increase in demand and positive industry outlook definespromising growth potentialsGems and Jewellery is primarily used to decorate and adorn. The demand fodifferent types of Gems and Jewellery is influenced by several factors like buyerspreferences, properties, varieties, unit values, applications, etc. According toWorld Gold Council (WGC), the Indian jewellery market currently is worthabout Rs.700 bn (USD14.58 bn). Of this, the urban jewellery market is valued aRs.280 bn (USD5.83 bn) and the rural & semirural market is valued at Rs.420 bn(USD 8.75 bn). Gold jewellery forms around 80% of the Indian jewellery marke(approx. Rs.560 bn (USD 11.67 bn)), with the balance comprising fabricatedstudded jewellery that includes diamond studded as well as gemstone studded
jewellery.
The Indian gems and jewellery industry is competitive in the world market dueto its low cost of production and availability of skilled labour. The industryemploys over 1.30 mn people directly and indirectly. In addition, the industryhas a worldwide distribution network, which has been established over a periodof time.
Comparing to the world production, India's share is negligible. India is thelargest consumer of gold in the world followed by China and Japan. Indiaconsumes nearly 800 tonnes of gold accounting for around 22% of the world goldconsumption and nearly 550-600 tonnes of this goes into jewellery consumptionThe major suppliers to India include Switzerland, South Africa, Australia, Hong
Kong, and UAE. India has well-established capabilities in making hand-made jewellery in traditional as well as modern designs. Indian hand-made jewelleryhas always had a large ethnic demand in various countries with sizeable Indianimmigrant population such as the Middle East and South-East Asian countries.
In recent times, India has also developed capabilities in machine-made jewelleryWith imported or domestic processed studding, Indian machine made jewelleryis expected to generate demand from nonethnic jewellery markets such as USA &Europe. India's exports of gold jewellery were US$ 9.424bn for the FY2009-10Gold jewellery exports from India have grown at a CAGR of over 26.53% for thepast five years. U.A.E., U.S.A. and Singapore are the major export destinations.
8/4/2019 Gitanjali report1
http://slidepdf.com/reader/full/gitanjali-report1 4/10Dugad Finserv Private Limited
Dugad FinservPrivate Limited
Institutional Analys
India occupies a prominent place in the global diamond industry and hasestablished its position as the largestexporter of cut and polished diamonds in theworld. India, China, Israel and Belgium arethe leading countries engaged in thediamond cutting and polishing industry
globally.
Email : [email protected]
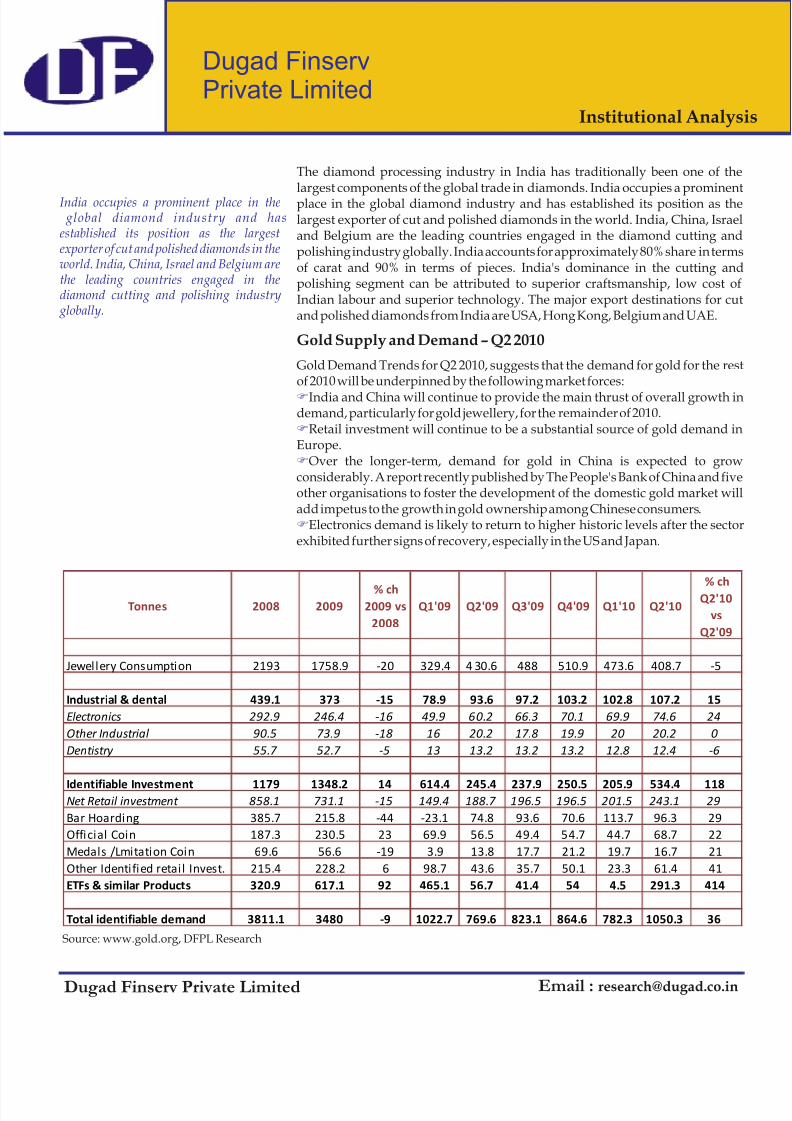
The diamond processing industry in India has traditionally been one of thelargest components of the global trade in diamonds. India occupies a prominenplace in the global diamond industry and has established its position as thelargest exporter of cut and polished diamonds in the world. India, China, Israeand Belgium are the leading countries engaged in the diamond cutting andpolishing industry globally. India accounts for approximately 80% share in termsof carat and 90% in terms of pieces. India's dominance in the cutting andpolishing segment can be attributed to superior craftsmanship, low cost ofIndian labour and superior technology. The major export destinations for cuand polished diamonds from India are USA, Hong Kong, Belgium and UAE.
Gold Supply and Demand – Q2 2010
Gold Demand Trends for Q2 2010, suggests that the demand for gold for the resof 2010 will be underpinned by the following market forces:
India and China will continue to provide the main thrust of overall growth indemand, particularly for gold jewellery, for the remainder of 2010.
Retail investment will continue to be a substantial source of gold demand inEurope.
Over the longer-term, demand for gold in China is expected to growconsiderably. A report recently published by The People's Bank of China and fiveother organisations to foster the development of the domestic gold market wiladd impetus to the growth in gold ownership among Chinese consumers.
Electronics demand is likely to return to higher historic levels after the sectoexhibited further signs of recovery, especially in the US and Japan.
F
F
F
F
Source: www.gold.org, DFPL Research
Tonnes 2008 2009% ch
2009 vs
2008
Q1'09 Q2'09 Q3'09 Q4'09 Q1'10 Q2'10
% ch
Q2'10
vs
Q2'09
Jewellery Consumption 2193 1758.9 -20 329.4 4 30.6 488 510.9 473.6 408.7 -5
Industrial & dental 439.1 373 -15 78.9 93.6 97.2 103.2 102.8 107.2 15
Electronics 292.9 246.4 -16 49.9 60.2 66.3 70.1 69.9 74.6 24
Other Industrial 90.5 73.9 -18 16 20.2 17.8 19.9 20 20.2 0
Dentistry 55.7 52.7 -5 13 13.2 13.2 13.2 12.8 12.4 -6
Identifiable Investment 1179 1348.2 14 614.4 245.4 237.9 250.5 205.9 534.4 118Net Retail investment 858.1 731.1 -15 149.4 188.7 196.5 196.5 201.5 243.1 29
Bar Hoarding 385.7 215.8 -44 -23.1 74.8 93.6 70.6 113.7 96.3 29
Official Coin 187.3 230.5 23 69.9 56.5 49.4 54.7 44.7 68.7 22
Medals /Lmitation Coin 69.6 56.6 -19 3.9 13.8 17.7 21.2 19.7 16.7 21
Other Identified retail Invest. 215.4 228.2 6 98.7 43.6 35.7 50.1 23.3 61.4 41
ETFs & similar Products 320.9 617.1 92 465.1 56.7 41.4 54 4.5 291.3 414
Total identifiable demand 3811.1 3480 -9 1022.7 769.6 823.1 864.6 782.3 1050.3 36
8/4/2019 Gitanjali report1
http://slidepdf.com/reader/full/gitanjali-report1 5/10Dugad Finserv Private Limited
Dugad FinservPrivate Limited
Institutional Analys
Email : [email protected]
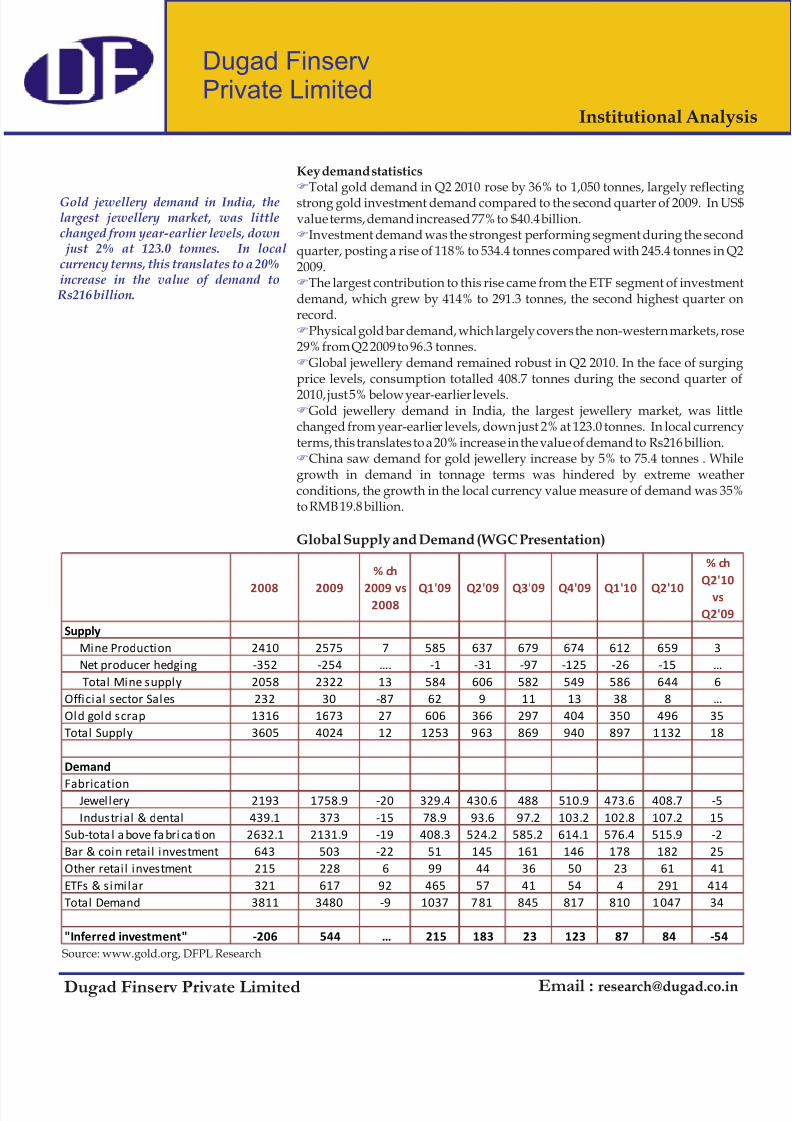
Key demand statisticsTotal gold demand in Q2 2010 rose by 36% to 1,050 tonnes, largely reflecting
strong gold investment demand compared to the second quarter of 2009. In US$value terms, demand increased 77% to $40.4 billion.
Investment demand was the strongest performing segment during the secondquarter, posting a rise of 118% to 534.4 tonnes compared with 245.4 tonnes in Q22009.
The largest contribution to this rise came from the ETF segment of investmendemand, which grew by 414% to 291.3 tonnes, the second highest quarter onrecord.
Physical gold bar demand, which largely covers the non-western markets, rose29% from Q2 2009 to 96.3 tonnes.
Global jewellery demand remained robust in Q2 2010. In the face of surgingprice levels, consumption totalled 408.7 tonnes during the second quarter of
2010, just 5% below year-earlier levels.Gold jewellery demand in India, the largest jewellery market, was little
changed from year-earlier levels, down just 2% at 123.0 tonnes. In local currencyterms, this translates to a 20% increase in the value of demand to Rs216 billion.
China saw demand for gold jewellery increase by 5% to 75.4 tonnes . Whilegrowth in demand in tonnage terms was hindered by extreme weatheconditions, the growth in the local currency value measure of demand was 35%to RMB 19.8 billion.
Global Supply and Demand (WGC Presentation)
F
F
F
F
F
F
F
Source: www.gold.org, DFPL Research
2008 2009
% ch
2009 vs2008
Q1'09 Q2'09 Q3'09 Q4'09 Q1'10 Q2'10
% ch
Q2'10
vs
Q2'09
Supply
Mine Production 2410 2575 7 585 637 679 674 612 659 3
Net producer hedging -352 -254 …. -1 -31 -97 -125 -26 -15 …
Total Mine supply 2058 2322 13 584 606 582 549 586 644 6
Official sector Sales 232 30 -87 62 9 11 13 38 8 …
Old gold scrap 1316 1673 27 606 366 297 404 350 496 35
Total Supply 3605 4024 12 1253 963 869 940 897 1132 18
Demand
FabricationJewellery 2193 1758.9 -20 329.4 430.6 488 510.9 473.6 408.7 -5
Industrial & dental 439.1 373 -15 78.9 93.6 97.2 103.2 102.8 107.2 15
Sub-tota l a bove fa bri ca ti on 2632.1 2131.9 -19 408.3 524.2 585.2 614.1 576.4 515.9 -2
Bar & coin retail investment 643 503 -22 51 145 161 146 178 182 25
Other retail investment 215 228 6 99 44 36 50 23 61 41
ETFs & similar 321 617 92 465 57 41 54 4 291 414
Total Demand 3811 3480 -9 1037 781 845 817 810 1047 34
"Inferred investment" -206 544 … 215 183 23 123 87 84 -54
Gold jewellery demand in India, thelargest jewellery market, was littlechanged from year-earlier levels, down
just 2% at 123.0 tonnes. In localcurrency terms, this translates to a 20%increase in the value of demand to
Rs216 billion.
8/4/2019 Gitanjali report1
http://slidepdf.com/reader/full/gitanjali-report1 6/10Dugad Finserv Private Limited
Dugad FinservPrivate Limited
Institutional Analys
Email : [email protected]
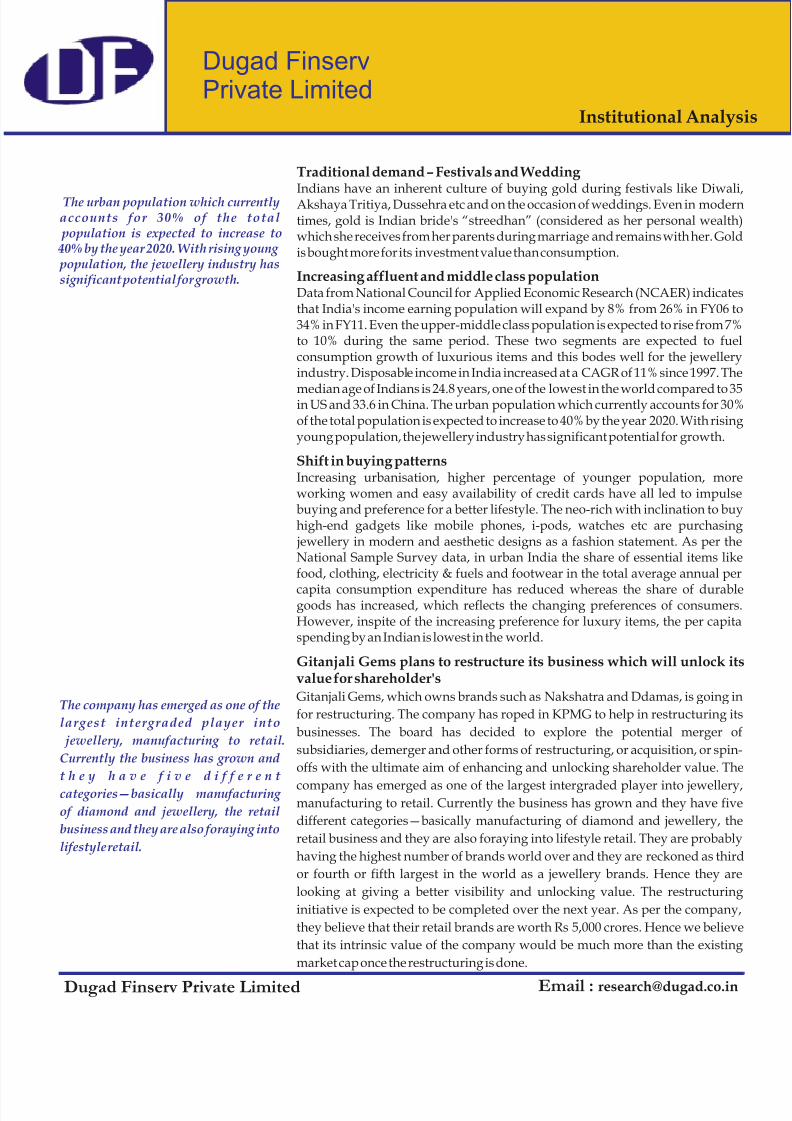
Traditional demand – Festivals and Wedding Indians have an inherent culture of buying gold during festivals like DiwaliAkshaya Tritiya, Dussehra etc and on the occasion of weddings. Even in moderntimes, gold is Indian bride's “streedhan” (considered as her personal wealthwhich she receives from her parents during marriage and remains with her. Goldis bought more for its investment value than consumption.
Increasing affluent and middle class populationData from National Council for Applied Economic Research (NCAER) indicatethat India's income earning population will expand by 8% from 26% in FY06 to34% in FY11. Even the upper-middle class population is expected to rise from 7%to 10% during the same period. These two segments are expected to fueconsumption growth of luxurious items and this bodes well for the jewelleryindustry. Disposable income in India increased at a CAGR of 11% since 1997. The
median age of Indians is 24.8 years, one of the lowest in the world compared to 35in US and 33.6 in China. The urban population which currently accounts for 30%of the total population is expected to increase to 40% by the year 2020. With risingyoung population, the jewellery industry has significant potential for growth.
Shift in buying patternsIncreasing urbanisation, higher percentage of younger population, moreworking women and easy availability of credit cards have all led to impulsebuying and preference for a better lifestyle. The neo-rich with inclination to buyhigh-end gadgets like mobile phones, i-pods, watches etc are purchasing
jewellery in modern and aesthetic designs as a fashion statement. As per theNational Sample Survey data, in urban India the share of essential items likefood, clothing, electricity & fuels and footwear in the total average annual per
capita consumption expenditure has reduced whereas the share of durablegoods has increased, which reflects the changing preferences of consumersHowever, inspite of the increasing preference for luxury items, the per capitaspending by an Indian is lowest in the world.
Gitanjali Gems plans to restructure its business which will unlock itsvalue for shareholder's
Gitanjali Gems, which owns brands such as Nakshatra and Ddamas, is going in
for restructuring. The company has roped in KPMG to help in restructuring its
businesses. The board has decided to explore the potential merger o
subsidiaries, demerger and other forms of restructuring, or acquisition, or spin
offs with the ultimate aim of enhancing and unlocking shareholder value. The
company has emerged as one of the largest intergraded player into jewellerymanufacturing to retail. Currently the business has grown and they have five
different categories—basically manufacturing of diamond and jewellery, the
retail business and they are also foraying into lifestyle retail. They are probably
having the highest number of brands world over and they are reckoned as third
or fourth or fifth largest in the world as a jewellery brands. Hence they are
looking at giving a better visibility and unlocking value. The restructuring
initiative is expected to be completed over the next year. As per the company
they believe that their retail brands are worth Rs 5,000 crores. Hence we believe
that its intrinsic value of the company would be much more than the existing
market cap once the restructuring is done.
The urban population which currentlyaccounts for 30% of the total
population is expected to increase to 40% by the year 2020. With rising young population, the jewellery industry hassignificant potential for growth.
The company has emerged as one of the
largest intergraded player into
jewellery, manufacturing to retail.
Currently the business has grown and
t h e y h a v e f i v e d i f f e r e n t
categories—basically manufacturing
of diamond and jewellery, the retail
business and they are also foraying into
lifestyle retail.

8/4/2019 Gitanjali report1
http://slidepdf.com/reader/full/gitanjali-report1 7/10Dugad Finserv Private Limited
Dugad FinservPrivate Limited
Institutional Analys
Email : [email protected]
Change in business mix (Retail Foray) and its Integrated Business
Model will improve marginsIndia's retail industry is expected to grow at 10- 12% to reach USD 416 billion by2011-12; of which the organised retail market would be around USD 51 billionCurrently, there are three retail formats for jewellery in India. They are: Exclusiveoutlets at malls and shopping centres, Kiosks/displays in departmental outletsand malls, Display of branded jewellery in shops of local jewelers. Gitanjali isundertaking retail expansion through the organic, inorganic and partnershiproutes. Currently, Gitanjali occupies around 1 million square feet of retail spacein India. Around 60% of the organized mall space in India within the jewellerycategory belongs to the Gitanjali Group. Gitanjali has more than 400 exclusivedistributors, with distribution in more than 2000 retail outlets. The Company hasPAN India presence through its over 185 exclusive stores and has more than 215franchisee stores. At present, Gitanjali has 126 stores in the US. Gitanjali has plans
to aggressively expand its domestic outlets. In the coming years, Gitanjali hasplanned for increasing contribution from jewellery segment to 65-70% of totasales by consolidating acquisitions and enhancing rural penetration. Gitanjalhas planned for aggressive retail expansion (entered into Lifestyle Retail as welas Jewel Retail) and is aiming at increasing its retail presence to 2 million squarefeet in the next three years. It plans to capitalize upon the opportunities availablein Tier 2 and Tier 3 cities, as organized retail as a whole, is expected to grow at 2530% in the next five years. Considering its Retail foray and its Integrated BusinesModel, we believe that Gitanjali gems will improve its margins in the comingyears.
Infratech business will unlock its value in the coming Years
Gitanjali is constructing the first privately owned and managed jewellery SEZ inIndia, the Rajiv Gems Park at Hyderabad, Andhra Pradesh, which is intended tobecome one of the largest gems and jewellery SEZs in India. Gitanjali's RajivGems Park at Hyderabad SEZ, has developed five modern state of artmanufacturing facilities for commercial production and a training center. Thesefacilities are up and running and are employing nearly 1500 workers. The uniprovides extensive tax benefits and holidays including the 10 year income taxholiday and 5 year income tax breaks for all firms within the SEZ. World class inhouse facilities are being provided for all leading diamond/Jewellerymanufacturers. A jewellery manufacturing facility, spread over 2 lakh sq. ft, isbeing developed, out of which 1 lakh sq. ft have already been developedGitanjali is planning launch a Residential project of 3,30,000 sq ft at BorivaliMumbai during the year FY 2010-11. They are also planning commercial
premises of 100,000 Sq ft at Andheri MIDC, Mumbai to be developed in FY 2010 11 for rental and outright sale. Hence we believe that Gitanjali Gems will unlockthe hidden values on the realty in the coming years. Currently its land bank isvalued at Rs 1500 crores.
Retail Expansion Plans

8/4/2019 Gitanjali report1
http://slidepdf.com/reader/full/gitanjali-report1 8/10Dugad Finserv Private Limited
Dugad FinservPrivate Limited
Institutional Analys
Financial Analysis
Key Risk
Valuation
On a Consolidated basis, the June quarter net sales rose by 38% to Rs 1865.91crore from Rs 1352.16 crore during the corresponding previous year. TheEBITDA margin increased by 130 basis points to 8.2% for the quarter ended June2010. Thus, EBITDA stands at Rs 153.74 crore compared to Rs 93.54 crore in thecorresponding previous period. Adjusted net profit registered a growth of 73%to Rs 78.7 crore from Rs 45.45 crore.
During the year ended March 2010, Gitanjali Gems Limited's net sales increased
by 28.3% to Rs 6527.63 crore from Rs 5088.88 crore during the corresponding
previous year ended March 2009. The EBITDA margin increased by 36 per cent to
6.8% from 6.4%.
Execution RiskGitanjali plans an aggressive roll-out in the retail segment. We believe theincremental roll-out will depend on the following factors:Success of recently launched stores.The pace of opening of new stores.The terms and conditions for the Jewellers under the associate model.The company's ability to streamline the operations of the stores with goodlogistics and advertising Support.
Slowdown in Key MarketsThe key Jewellery consumer markets are the US, Europe, and Japan. The slowingeconomic growth in these regions may affect demand for Jewellery, which mayaffect the company's bulk export business.
Gold Price VolatilityEmpirical evidence suggests an increase in gold price volatility inversely affectdemand for gold. Any increase in gold price volatility, as a result of financiamarket instability or otherwise, may lead to a decline in Jewellery demandwhich may also affect the company's bulk export business.
Rupee AppreciationSome of the company's revenue comes from exports. The rupee appreciationagainst the US dollar could affect the overall competitive cost advantage ofIndian Jewellery vis-à-vis other exporters.
We believe Gitanjali Gems Limited is all set to generate higher revenues withgood margins and also unlock its hidden value by restructuring and real estateAt current price of Rs. 244.25, the stock is trading at a PE of 8.1x and 5.2x andP/BV of 0.8x and 0.7x for FY11E and FY12E respectively. The valuation lookattractive and we recommend “OUTPERFORMER” on the stock with a targeprice of Rs. 338 per share (PE of7.2 x for FY12E), an upside of 38%.
Email : [email protected]
Source: Company, DFPL Research
0.00
1000.00
2000.00
3000.00
4000.00
5000.00
6000.00
7000.00
8000.00
9000.00
10000.00
FY08 FY09 FY10 FY11E FY12E
Gitanjali Gem's Revenue (in Rs crs)

8/4/2019 Gitanjali report1
http://slidepdf.com/reader/full/gitanjali-report1 9/10Dugad Finserv Private Limited
Dugad FinservPrivate Limited
Institutional Analys
Financial Detail
Consolidated Income Statement Consolidated Balance Sheet
Consolidated Cash Flow
Source: Company, DFPL Research Source: Company, DFPL Research
Source: Company, DFPL ResearchSource: Company, DFPL Research
Ratio Analysis
Email : [email protected]
(Rs Crs) FY09 FY10 FY11E FY12E
Net Sales 5088.88 6527.63 7833.16 9243.12
Net Sales Growth (%) 5.3% 28.3% 20.0% 18.0%
Total Expenditure 4761 .86 6081 .63 7324.00 8549.89
EBITDA 327.02 446.00 509.16 693.23
EBITDA Margin (%) 6.4% 6.8% 6.5% 7.5%
Depreciation 33.60 44.54 48.55 52.09
Interest 137.49 217.57 218.50 242.25
Other Income 2.52 40.85 40.85 40.85
PBT 158.45 224.74 282.96 439.74 Taxes 3.17 23.19 28.30 43.97
Profit Before Minority Interest 155.28 201.55 254.66 395.77
Miniority Interest 4.7 1.38 0 0
Net Profit 150.58 200.17 254.66 395.77
Net Profit Growth (%) -5.6% 32.9% 27.2% 55.4%
Net Profit Margin (%) 3.0% 3.1% 3.3% 4.3%
Adj. Net Profit 150.58 200.05 254.66 395.77
Adj. Net Profit Growth (%) -6.5% 32.9% 27.3% 55.4%
(Rs Crs) FY09 FY10 FY11E FY12E
Share Capital (FV: Rs 10) 85 .06 84.27 84.85 84.85
Shareholder's Funds 2077.48 2196.52 2761.87 3139.75
Total Debt 2046.64 2595.29 2300.00 2550.0
Current Liabilities and Provisions 1754.52 1575.46 1612.11 1882.51
Deffered Tax Liability 18.31 20.72 20.72 20.72
Miniority Interest 9.85 48.31 48.31 48.31
Total Liabilities 5906.80 6436.30 6743.01 7641.29
Net Fixed Assets 306.64 308.74 283.57 263.70
Capital WIP 53.33 62.61 70.00 80.00Deffered Tax Asset 13.49 22.57 22.57 22.57
Investments 33.13 35.91 35.91 35.91
Loans and Advances 467.56 457.49 500.00 550.00
Inventory 1975.82 2079.39 2146.07 2279.13
Cash & Bank balance 297.20 238.64 465.76 611.42
Receivables 2759.63 3230.93 3219.11 3798.54
Misc Expenditure not W/O 0.00 0.02 0.02 0.02
Total Assets 5906.80 6436.30 6743.01 7641.29
(Rs Crs) FY09 FY10 FY11E FY12E
Pre-tax Profit 158.46 224.74 282.96 439.74
Depreciation 33.59 44.54 48.55 52.09
Chg in Working Capital (881.01) (246.58) (60.72) (492.09)
Total Tax Paid (10.35) (23.01) (28.30) ( 43.97)
Other Operat ing act iv it ies 63.13 137 .69 0 .00 0 .00
CF form Operations (I) (636.18) 137.38 242.49 (44.23)
Capi tal Expendi ture (27 .34) (15 .85) (30 .77) (42 .22)
Chg in Investments (105.29) (8.43) 0.00 0.00
Other Investing activities 0.00 0.00 0.00 0.00
CF form Investing (II) (132.63) (24.28) (30.77) (42.22)
Equity Raised/(repaid) 0.00 0.00 328.58 0.00Debt Raised/(repaid) (39.03) (153.77) (295.29) 250.00
Dividend (17.91) (17.89) (17.89) (17.89)
Other financing activities 0.00 0.00 0.00 0.00
CF form Financing (III) (56.94) (171.66) 15.40 232.11
Net Change in cash (I+II+III) (825.75) (58.56) 227.12 145.66
Beginning Cash 1122.95 297.20 238.64 465.76
Ending Cash 297.20 238.64 465.76 611.42
FY09 FY10 FY11E FY12E
Growth Ratios
Sales Growth (%) 5.3% 28.3% 20.0% 18.0%
EBITDA Grow th (%) 20.9% 36.4% 14.2% 36.2%
EPS Growth (%) -5.6% 34.2% 27.2% 55.4%
Profitability Ratios
EBITDA Margin (%) 6.4% 6.8% 6.5% 7.5%
PAT Margin (%) 3.0% 3.1% 3.3% 4.3%
RONW (%) 7.2% 9.1% 9.2% 12.6%
ROCE (%) 5.0% 6.9% 7.4% 8.9%
Per Share RatiosEarnings Per Share 17.7 23.8 30.2 47.0
Cash Per Share 21.7 29.0 35.7 52.8
Book Value Per Share 244.2 260.7 325.5 370.0
Valuation Mul tiples
P/E (x) 13.8 10.3 8.1 5.2
P/BV (x) 1.0 0.9 0.8 0.7
EV/EBITDA 12.6 10.4 8.6 6.6

8/4/2019 Gitanjali report1
http://slidepdf.com/reader/full/gitanjali-report1 10/10Dugad Finserv Private Limited
DISCLAIMER:
The information & opinion in this report has been prepared by DugadFinserv Pvt. Ltd. The report & the informationcontained herein arestrictly confidential and meant solely for the authorized recipients and private circulation and may be restricted by law or regulationin
certain countries. This report is for information purposes only for the authorized recipients and does not construe to be any investment,legal or taxationadvice. This report is based on the information obtained from public sources and sources believed to be reliable,however, no warranty, express orimplied, is given for the accuracy or correctness of the same and it should not be construed as such. It isalso not intended as an offer or solicitation forthe purchase or sale of any financial instrument.DugadFinserv Pvt. Ltd and/or itssubsidiaries and/or directors, employees, officers or associates – including the persons involved in thepreparation/issuance of thisreport may have performed or may seek to perform any investment banking services for such companies or act as advisororlender/borrower to such companies &/or have other possible conflict of interest with respect to any recommendation or anyinformation/opinions thatcould affect the objectivity of this report. As a result, the authorized recipients of this report should rely ontheir own investigations and analysis & seekprofessional advice. Any action taken by any one solely on the basis of the informationcontained herein is their own responsibility alone and DugadFinserv Pvt. Ltd and/or its subsidiaries or its directors, employees orassociates will not be liable in any manner whatsoever for theconsequences of such action taken.No data/ information contained in thisreport shall be copied, forwarded, transmitted or distributed, in part or in whole, in any form or in any media,without the previouswritten consent of DugadFinserv Pvt. Ltd.
Dugad FinservPrivate Limited
Dugad Finserv Private Limited“We advices on New Issues, QIP's, Corporate Finance offerings like Placement of Equity & Debt with DifferenInstitutional Investors, Short term funds arrangement like Debt and equity, Working capital and Debtsyndication and structured Deals.”
Corporate Restructuring - Capital & Debt,Project Financing and Private Equity with Financial Joint VenturesDugad Finserv Private Limited also offer services on raising funds or capital through International Markets.
Contact us:Vijay DugadManaging DirectorDugad Finserv Private LimitedIntermediaires between Corporate and Institutions120,Commodity Exchange Bldg,Plot No.2,3,&4, sector 19,Vashi, Navi Mumbai-400 705PH;022-32255002/[email protected]
Email : research@dugad co in