gladstone gladstone capital gladstone commercial gladstone investment gladstone ...€¦ · ·...
TRANSCRIPT

GLADSTONE
GLADSTONE CAPITAL
GLADSTONE COMMERCIAL
GLADSTONE INVESTMENT
GLADSTONE MANAGEMENTTHE GLADSTONE COMPANIES
GLADSTONE ADMINISTRATION
2012 Annual Report

Gladstone Capital is a publicly traded business development company that pays consistent monthly dividends to its stockholders. The company provides loans to small and medium-sized businesses across the United States and seeks to invest in private companies with profitable operations and strong management teams. Gladstone Capital does not limit its investments to any particular indus tries and has invested in busi-nesses in the manufacturing, distribution, and service sectors. To learn about our company, visit our website at: www.GladstoneCapital.com. You can follow us on Twitter, username “GladstoneComps,” and on Facebook, keyword “The Gladstone Companies.” Our common stock and preferred stock are traded on the NaSdaq Global Select Market under the trading symbols GLad and GLadP, respectively. Our headquarters are located in Washington, dC’s suburb of McLean, Va and we have offices in New York, NY, Chicago, IL and Los angeles, Ca.
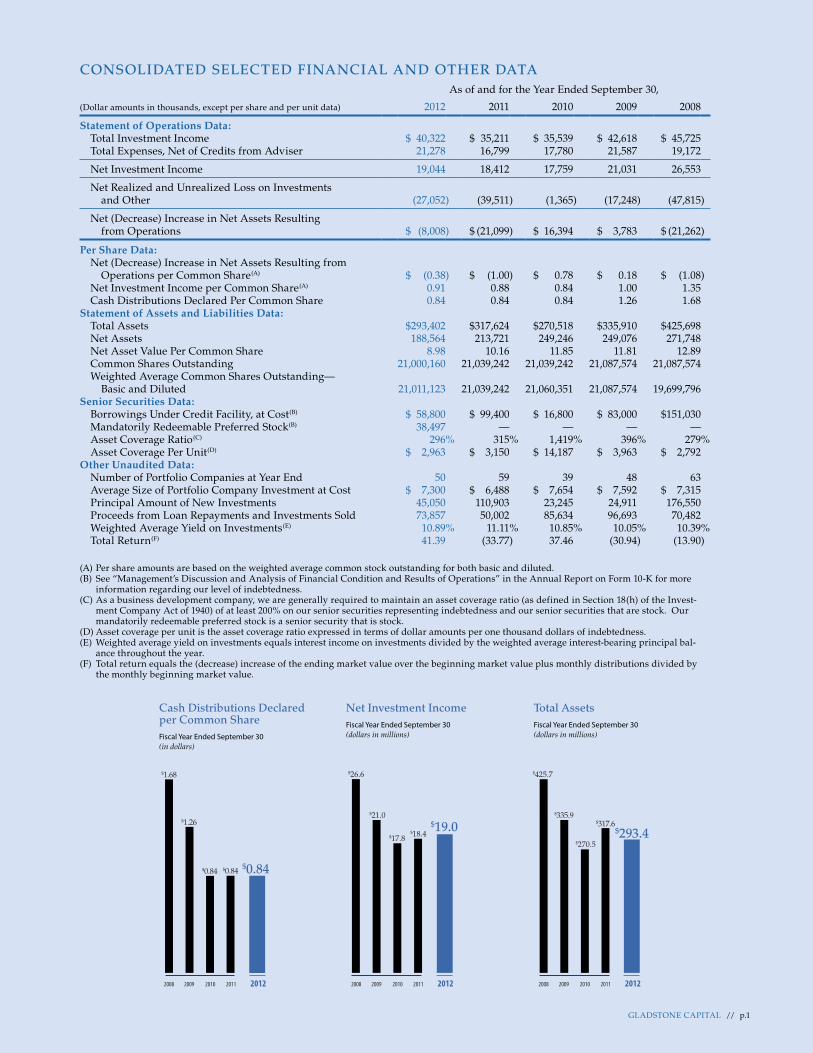
CONSOLIDATED SELECTED FINANCIAL AND OTHER DATAAs of and for the Year Ended September 30,
(Dollar amounts in thousands, except per share and per unit data) 2012 2011 2010 2009 2008
Statement of Operations Data:Total Investment Income $ 40,322 $ 35,211 $ 35,539 $ 42,618 $ 45,725Total Expenses, Net of Credits from Adviser 21,278 16,799 17,780 21,587 19,172
Net Investment Income 19,044 18,412 17,759 21,031 26,553
Net Realized and Unrealized Loss on Investments and Other (27,052) (39,511) (1,365) (17,248) (47,815)
Net (Decrease) Increase in Net Assets Resulting from Operations $ (8,008) $ (21,099) $ 16,394 $ 3,783 $ (21,262)
Per Share Data:Net (Decrease) Increase in Net Assets Resulting from
Operations per Common Share(A) $ (0.38) $ (1.00) $ 0.78 $ 0.18 $ (1.08)Net Investment Income per Common Share(A) 0.91 0.88 0.84 1.00 1.35Cash Distributions Declared Per Common Share 0.84 0.84 0.84 1.26 1.68
Statement of Assets and Liabilities Data:Total Assets $ 293,402 $ 317,624 $ 270,518 $ 335,910 $ 425,698Net Assets 188,564 213,721 249,246 249,076 271,748Net Asset Value Per Common Share 8.98 10.16 11.85 11.81 12.89Common Shares Outstanding 21,000,160 21,039,242 21,039,242 21,087,574 21,087,574Weighted Average Common Shares Outstanding—
Basic and Diluted 21,011,123 21,039,242 21,060,351 21,087,574 19,699,796Senior Securities Data:
Borrowings Under Credit Facility, at Cost(B) $ 58,800 $ 99,400 $ 16,800 $ 83,000 $ 151,030Mandatorily Redeemable Preferred Stock(B) 38,497 — — — —Asset Coverage Ratio(C) 296% 315% 1,419% 396% 279%Asset Coverage Per Unit(D) $ 2,963 $ 3,150 $ 14,187 $ 3,963 $ 2,792
Other Unaudited Data:Number of Portfolio Companies at Year End 50 59 39 48 63Average Size of Portfolio Company Investment at Cost $ 7,300 $ 6,488 $ 7,654 $ 7,592 $ 7,315Principal Amount of New Investments 45,050 110,903 23,245 24,911 176,550Proceeds from Loan Repayments and Investments Sold 73,857 50,002 85,634 96,693 70,482Weighted Average Yield on Investments(E) 10.89% 11.11% 10.85% 10.05% 10.39%Total Return(F) 41.39 (33.77) 37.46 (30.94) (13.90)
(A) Per share amounts are based on the weighted average common stock outstanding for both basic and diluted.(B) See “Management’s Discussion and Analysis of Financial Condition and Results of Operations” in the Annual Report on Form 10-K for more
information regarding our level of indebtedness.(C) As a business development company, we are generally required to maintain an asset coverage ratio (as defined in Section 18(h) of the Invest-
ment Company Act of 1940) of at least 200% on our senior securities representing indebtedness and our senior securities that are stock. Our mandatorily redeemable preferred stock is a senior security that is stock.
(D) Asset coverage per unit is the asset coverage ratio expressed in terms of dollar amounts per one thousand dollars of indebtedness.(E) Weighted average yield on investments equals interest income on investments divided by the weighted average interest-bearing principal bal-
ance throughout the year.(F) Total return equals the (decrease) increase of the ending market value over the beginning market value plus monthly distributions divided by
the monthly beginning market value.
$0.84
$19.0
Cash Distributions Declared per Common ShareFiscal Year Ended September 30(in dollars)
Net Investment IncomeFiscal Year Ended September 30(dollars in millions)
$293.4
Total AssetsFiscal Year Ended September 30(dollars in millions)
2010 201120092008 2012 2010 201120092008 2012
$0.84$0.84
$1.26
$1.68
$18.4$17.8
$21.0
$26.6
$317.6
$270.5
$335.9
$425.7
0.0000
0.4375
0.8750
1.3125
1.7500
0
5
10
15
20
25
30
0
100
200
300
400
500
2010 201120092008 2012
GLADSTONE CAPITAL // p.1

Despite challenges in the marketplace, for the year ended September 30, 2012, we accomplished the following:
Paid twelve monthly cash dividends on our common stock equating to $0.84 for the year, bringing the consecutive monthly total since inception to 110, as of November 30, 2012;
Invested $45.1 million in new portfolio companies and $23.8 million in existing portfolio companies;
Raised $38.5 million of Term Preferred Stock in November 2011, which trades under ticker symbol GLADP on NASDAQ;
Extended our $137 million credit facility for 3 years until January 2015;
Successfully exited 10 investments for $47.5 million, which produced over $4.2 million in exit and prepayment fees; and
Received approval in July 2012 from the SEC to coinvest with certain affiliated investment funds.
FINANCIAL RESULTS: Net Investment Income grew by $0.6 million, or 3.4% when comparing fiscal year 2012 to fiscal year 2011. This increase was primarily due to the increase in interest income of 9.1% from the net overall weighted average portfolio growth year over year and an increase in other income result-ing from success fees from early payoffs of several
proprietary investments. Offsetting this increase was an increase in interest expense on a higher credit facility balance during the year due to draws to fund new investments and also from paying dividends in 2012 on the newly issued term preferred stock. We delivered Net Investment Income per common share of $0.91 for the year ended September 30, 2012 as com-pared to $0.88 for the previous year, a 3.4% increase. As of September 30, 2012, we had cumulative unrealized depreciation of $91.1 million. While we are disappointed in the size of the amount of unreal-ized depreciation, the vast majority of it, or 88%, relates to portfolio companies that originated prior to 2008. While their values have decreased, these com-panies have survived the recession and we believe we will be able to recover a meaningful portion of their value. The cumulative unrealized depreciation on our investments does not have an impact on our current ability to pay distributions to stockholders, although it may be an indication of future realized losses, which could ultimately reduce our income available for distribution. On a related note, the number of our non-accrual investments is higher than we consider acceptable. Even though each non-accrual investment was originated in 2006 and 2007, and likewise, were significantly impacted by the recession, we will con-tinue to work to fix these companies and recover a meaningful portion of our capital.
In fiscal year 2012, our team focused on improving the overall portfolio, which has continued to weather the economic storm. We added some new income-producing investments in 2012, and received several early payoffs that triggered additional fees and income. Paramount among our investment objectives is delivering consistent dividends to our stockholders. We continued to provide consistent dividends in 2012 and since our inception in 2001. We believe we are in a position begin-ning fiscal year 2013 to deliver again.
To Our Shareholders,
p.2

As of September 30, 2012, we had a diversified portfolio containing 99 investments in 50 portfolio companies, which spanned 28 states in 21 industries. We continue to have low leverage on our balance sheet compared to many finance companies—as of September 30, 2012, we had 0.56 cents of debt for each dollar of equity. Since the end of the fiscal year, we have invested $5.5 million in additional loans to two new portfolio companies and $0.7 million to existing portfolio com-panies and received scheduled and unscheduled principal repayments of $1.7 million excluding pay-offs. Additionally, in October 2012, we received $21.1 million from early payoffs at par from our portfolio companies. We are actively working several deals we hope to close in the upcoming quarters and believe we are off to a good start for our 2013 fiscal year.
THE MARKETPLACE: The United States continues to feel the lingering impact of the recession that began in late 2007, although there appears to be some improvement. Over the last four years, the capital markets have experienced significant price volatility and liquidity disruptions, which have caused the market prices of many stocks and debt securities to fluctuate substantially. Currently, our stock is priced above our current net asset value per share. Our stock price has rebounded from September 30, 2011 from $6.86 per share to $8.75 per share in 2012.
THE OUTLOOK: In summary, we had a mixed year in 2012 and are focused on improving our cur-rent portfolio. Many of our portfolio companies made progress, while there are a few that need more work. Our portfolio management team has a successful track record of investing in small- and medium-sized businesses and managing funds paying distributions to stockholders. We believe Gladstone Capital is an attractive investment for investors seeking monthly distributions. We are focused on making conservative investments in profitable businesses with positive cash flows and believe that now is an excellent time
to invest in growing businesses. We pride ourselves on strict adherence to our code of ethics and we remain stewards of your money. While there are no guarantees, we will continue to be conservative and disciplined in our investment approach while striving to deliver shareholder value on your investments in us. We look forward to the 2013 fiscal year and believe it will be a good one. We invite stockholders to attend the Annual Stockholders’ Meeting on February 14, 2013, at the Hilton McLean Tyson’s Corner, 7920 Jones Branch Drive, in McLean, Virginia. We would like to see all of our stockholders at the meeting and please make sure to vote your shares. We invite you all to visit our website, www.gladstonecapital.com, and sign up for email notices to keep up with all our activities. You can also now follow us on Facebook at “The Gladstone Companies” and on Twitter at “GladstoneComps.” Best wishes to you all and thank you for your continued support.
David Gladstone, Chairman of the Board and Chief Executive Officer
Terry L. Brubaker, Vice Chairman of the Board and Chief Operating Officer
George “Chip” Stelljes III, President and Chief Investment Officer
David A. R. Dullum Executive Vice President
We will continue to be conservative and disciplined in our investment approach while striving to deliver shareholder value on your investment. We look forward to the 2013 fiscal year and believe it will be a good one.
GLADSTONE CAPITAL // p.3

Performance Measurement Comparison(1)
The following graph shows the total stockholder return of an investment of $100 in cash on September 30, 2007 for (i) our common stock, (ii) the Standard & Poor’s 500 Index (the “S&P 500”), and (iii) our peer group. The Company’s peer group is composed of American Capital Strategies, Ltd., Apollo Investment Corporation and Ares Capital Corporation. We are primarily a mezzanine lender that focuses on investments in senior, senior subordinated, and junior subor-dinated debt as well as warrants and other equity-like instruments. The companies that we have selected for our peer group are also business development companies and engage in similar investment activity. All values assume reinvestment of the full amount of all dividends.
(1) This section is not “soliciting material,” is not deemed “filed” with the Securities and Exchange Commission, and is not to be incorporated by reference in any filing of our filings under the Securities Act of 1933 or the Securities Exchange Act of 1934, whether made before or after the date hereof and irrespective of any general incorporation language in any such filing.
Peer Group GLAD S&P 500
9/30/07 $100.00 $100.00 $100.009/30/08 $ 71.98 $ 86.10 $ 76.299/30/09 $ 30.25 $ 59.45 $ 69.249/30/10 $ 43.53 $ 81.73 $ 74.759/30/11 $ 43.84 $ 54.13 $ 74.119/30/12 $ 58.77 $ 76.54 $ 94.36
Reliable Biopharmaceutical Corporation Francis Drilling Fluids, Ltd. Winchester Electronics Corporation
We are a specialty finance company that makes loans to and invests in small and medium-sized businesses.In October 2012, our board of direc-tors approved revisions to our investment objectives and strategies that go into effect on or about January 1, 2013. All of our current portfolio investments fit within the scope of the revised objectives and strategies and no changes will need to be made to the current port folio as a result of the revision. Our investments have taken and will typically take the following forms in the range of $5–30 million:
n Senior loans
n Second lien loans
n Senior subordinated loans
n Junior subordinated loans
n Mezzanine loans
n Preferred and common equity or equivalents
Senior term loans are exposed to the least risk of default because they command a senior position with respect to scheduled interest payments, principal payments and collateral. However, these types of loans traditionally have lower returns and lenders typically do not receive any profit enhancements, such as success fees or stock owner-ship, including warrants.
Second lien loans and senior sub-ordinated loans are typically sub-ordinated in their rights to receive principal and interest payments from the borrower to the rights of the holders of senior debt. As a result, these loans are riskier than senior debt. Second lien loans and senior subordinated loans some-times entitle the lender to obtain additional income from success fees and stock ownership.
Junior subordinated loans and mezzanine loans are subordinated in their rights to receive principal and interest payments from the bor-rower to the rights of the holders of senior debt and senior subordinated debt, which permits the junior sub-ordinated lender to obtain higher interest rates and other income such as success fees and stock ownership.
Equity securities do not generally have any current income and value is realized, if at all, upon the sale of the business. Equity securities of established businesses that grow over time may be able to be sold for capital gains.
We believe we are well positioned to provide financing to and make investments in established businesses with strong management teams that will provide stable earnings and cash flow to pay our expenses and make distributions to our stock-holders that grow over time.
Comparison Cumulative Total Return on Investment (in dollars)
9/30/07
0
25
50
75
100
$125
0
25
50
75
100
125
9/30/08 9/30/09 9/30/10 9/30/11 9/30/12
Peer Group GLAD S&P 500
p.4

United States Securities and Exchange CommissionForm 10-K
2012 Annual Report
1-GladstoneCapital12CV_27482.indd 5 11/13/12 11:54 AM
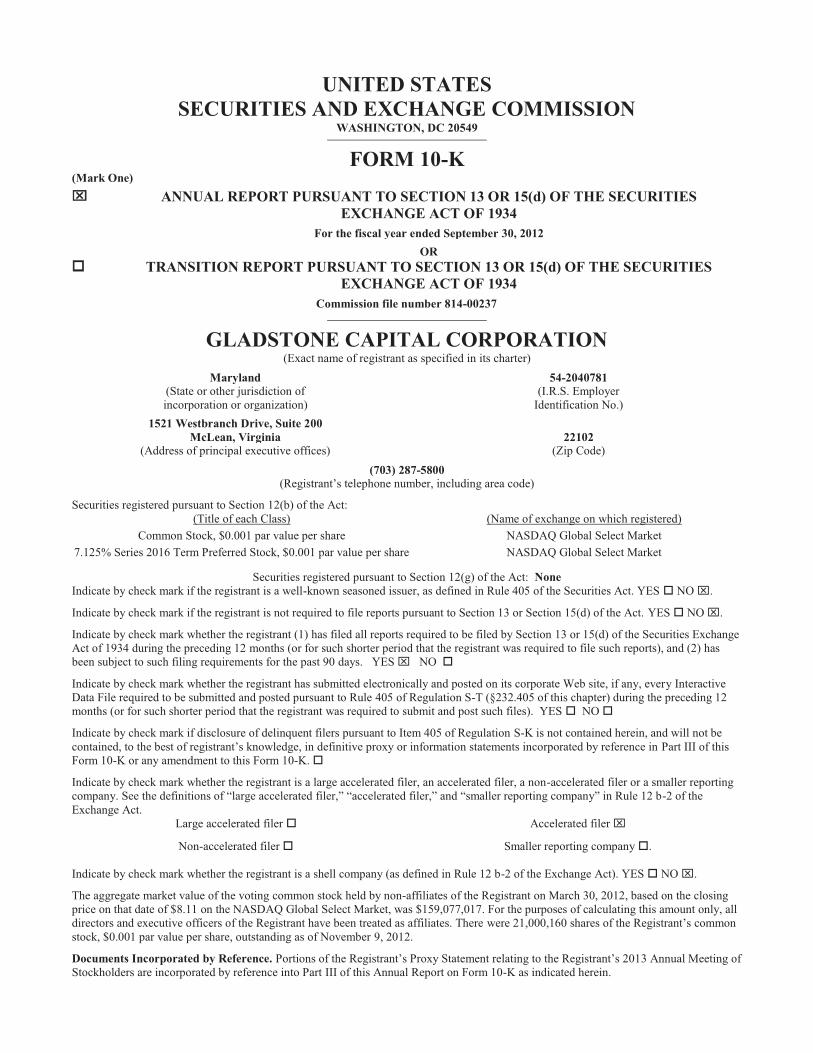
UNITED STATES SECURITIES AND EXCHANGE COMMISSION
WASHINGTON, DC 20549
FORM 10-K (Mark One) �� ANNUAL REPORT PURSUANT TO SECTION 13 OR 15(d) OF THE SECURITIES
EXCHANGE ACT OF 1934
For the fiscal year ended September 30, 2012
OR �� TRANSITION REPORT PURSUANT TO SECTION 13 OR 15(d) OF THE SECURITIES
EXCHANGE ACT OF 1934
Commission file number 814-00237
GLADSTONE CAPITAL CORPORATION (Exact name of registrant as specified in its charter)
Maryland 54-2040781 (State or other jurisdiction of incorporation or organization)
(I.R.S. Employer Identification No.)
1521 Westbranch Drive, Suite 200 McLean, Virginia 22102
(Address of principal executive offices) (Zip Code) (703) 287-5800
(Registrant’s telephone number, including area code)
Securities registered pursuant to Section 12(b) of the Act: (Title of each Class) (Name of exchange on which registered)
Common Stock, $0.001 par value per share NASDAQ Global Select Market 7.125% Series 2016 Term Preferred Stock, $0.001 par value per share NASDAQ Global Select Market
Securities registered pursuant to Section 12(g) of the Act: None Indicate by check mark if the registrant is a well-known seasoned issuer, as defined in Rule 405 of the Securities Act. YES � NO �.
Indicate by check mark if the registrant is not required to file reports pursuant to Section 13 or Section 15(d) of the Act. YES � NO �.
Indicate by check mark whether the registrant (1) has filed all reports required to be filed by Section 13 or 15(d) of the Securities Exchange Act of 1934 during the preceding 12 months (or for such shorter period that the registrant was required to file such reports), and (2) has been subject to such filing requirements for the past 90 days. YES � NO �
Indicate by check mark whether the registrant has submitted electronically and posted on its corporate Web site, if any, every Interactive Data File required to be submitted and posted pursuant to Rule 405 of Regulation S-T (§232.405 of this chapter) during the preceding 12 months (or for such shorter period that the registrant was required to submit and post such files). YES � NO �
Indicate by check mark if disclosure of delinquent filers pursuant to Item 405 of Regulation S-K is not contained herein, and will not be contained, to the best of registrant’s knowledge, in definitive proxy or information statements incorporated by reference in Part III of this Form 10-K or any amendment to this Form 10-K. �
Indicate by check mark whether the registrant is a large accelerated filer, an accelerated filer, a non-accelerated filer or a smaller reporting company. See the definitions of “large accelerated filer,” “accelerated filer,” and “smaller reporting company” in Rule 12 b-2 of the Exchange Act.
Large accelerated filer � Accelerated filer �
Non-accelerated filer � Smaller reporting company �. Indicate by check mark whether the registrant is a shell company (as defined in Rule 12 b-2 of the Exchange Act). YES � NO �.
The aggregate market value of the voting common stock held by non-affiliates of the Registrant on March 30, 2012, based on the closing price on that date of $8.11 on the NASDAQ Global Select Market, was $159,077,017. For the purposes of calculating this amount only, all directors and executive officers of the Registrant have been treated as affiliates. There were 21,000,160 shares of the Registrant’s common stock, $0.001 par value per share, outstanding as of November 9, 2012.
Documents Incorporated by Reference. Portions of the Registrant’s Proxy Statement relating to the Registrant’s 2013 Annual Meeting of Stockholders are incorporated by reference into Part III of this Annual Report on Form 10-K as indicated herein.
1
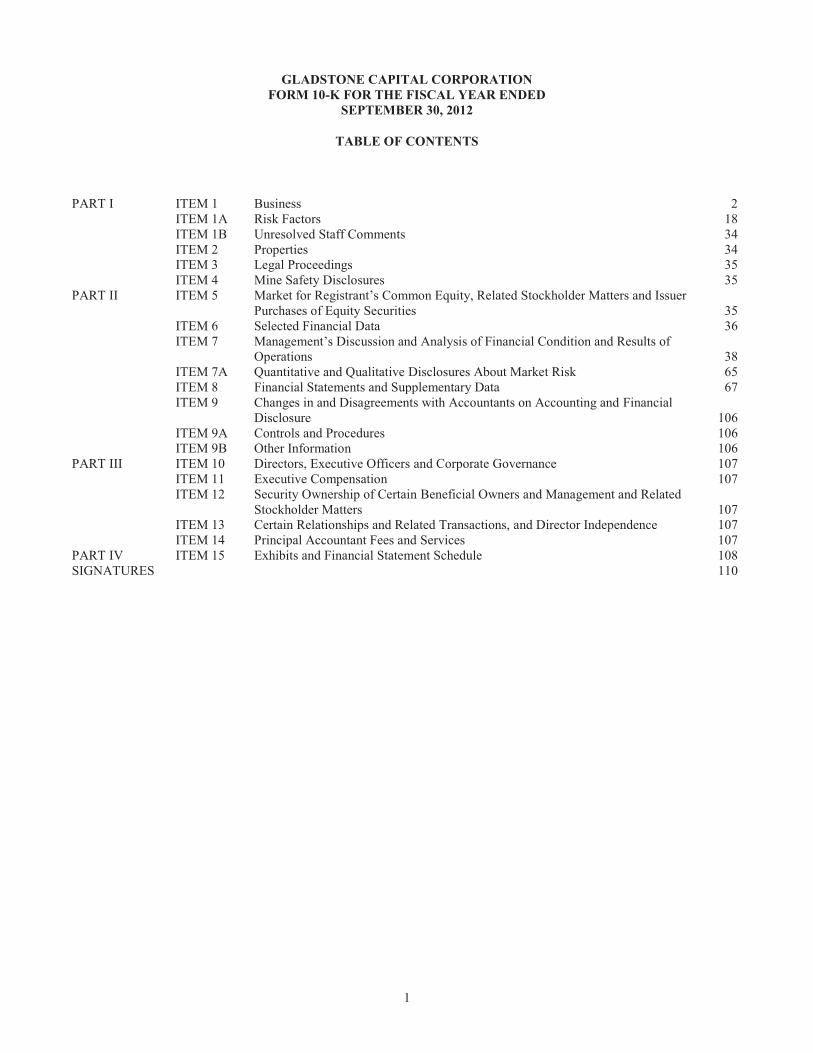
GLADSTONE CAPITAL CORPORATION FORM 10-K FOR THE FISCAL YEAR ENDED
SEPTEMBER 30, 2012
TABLE OF CONTENTS
PART I ITEM 1 Business 2 ITEM 1A Risk Factors 18 ITEM 1B Unresolved Staff Comments 34 ITEM 2 Properties 34 ITEM 3 Legal Proceedings 35 ITEM 4 Mine Safety Disclosures 35 PART II ITEM 5 Market for Registrant’s Common Equity, Related Stockholder Matters and Issuer
Purchases of Equity Securities 35 ITEM 6 Selected Financial Data 36 ITEM 7 Management’s Discussion and Analysis of Financial Condition and Results of
Operations 38 ITEM 7A Quantitative and Qualitative Disclosures About Market Risk 65 ITEM 8 Financial Statements and Supplementary Data 67 ITEM 9 Changes in and Disagreements with Accountants on Accounting and Financial
Disclosure 106 ITEM 9A Controls and Procedures 106 ITEM 9B Other Information 106 PART III ITEM 10 Directors, Executive Officers and Corporate Governance 107 ITEM 11 Executive Compensation 107 ITEM 12 Security Ownership of Certain Beneficial Owners and Management and Related
Stockholder Matters 107 ITEM 13 Certain Relationships and Related Transactions, and Director Independence 107 ITEM 14 Principal Accountant Fees and Services 107 PART IV ITEM 15 Exhibits and Financial Statement Schedule 108 SIGNATURES 110

2
FORWARD-LOOKING STATEMENTS
All statements contained herein, other than historical facts, may constitute “forward-looking statements.” These statements may relate to, among other things, future events or our future performance or financial condition. In some cases, you can identify forward-looking statements by terminology such as “may,” “might,” “believe,” “will,” “provided,” “anticipate,” “future,” “could,” “growth,” “plan,” “intend,” “expect,” “should,” “would,” “if,” “seek,” “possible,” “potential,” “likely” or the negative of such terms or comparable terminology. These forward-looking statements involve known and unknown risks, uncertainties and other factors that may cause our actual results, levels of activity, performance or achievements to be materially different from any future results, levels of activity, performance or achievements expressed or implied by such forward-looking statements. Such factors include, among others: (1) further adverse changes in the economy and the capital markets; (2) risks associated with negotiation and consummation of pending and future transactions; (3) the loss of one or more of our executive officers, in particular David Gladstone, Terry Lee Brubaker, or George Stelljes III (4) changes in our investment objectives and strategy; (5) availability, terms and deployment of capital; (6) changes in our industry, interest rates, exchange rates or the general economy; (7) the degree and nature of our competition; and (8) those factors described in the “Risk Factors” section of this Form 10-K. We caution readers not to place undue reliance on any such forward-looking statements. We undertake no obligation to publicly update or revise any forward-looking statements, whether as a result of new information, future events or otherwise, after the date of this Form 10-K.
PART I
In this Annual Report on Form 10-K, or Annual Report, the “Company,” “we,” “us,” and “our” refer to Gladstone Capital Corporation and its wholly-owned subsidiaries unless the context otherwise indicates. Dollar amounts are in thousands unless otherwise indicated.
ITEM 1. BUSINESS
Overview
We were incorporated under the Maryland General Corporation Laws on May 30, 2001, and completed our initial public offering on August 24, 2001. We operate as a closed-end, non-diversified management investment company and have elected to be treated as a business development company (“BDC”) under the Investment Company Act of 1940, as amended ( the “1940 Act”). For federal income tax purposes, we have elected to be treated as a regulated investment company (“RIC”) under Subchapter M of the Internal Revenue Code of 1986, as amended (the “Code”). We currently continue to qualify as a RIC for federal income tax purposes and obtain favorable RIC tax treatment by meeting certain requirements, including minimum distribution requirements.
Investment Objectives and Strategy
Our board of directors recently approved limited revisions to our investment objectives and strategies, effective on or about January 1, 2013, which revisions are reflected in the descriptions of our investment objectives and strategies below. All of our current portfolio investments fit within the scope of our revised investment objectives and strategies and no changes will need to be made to our current portfolio as a result of this revision.
Our investment objectives are to: (1) achieve and grow current income by investing in debt securities of established businesses that we believe will provide stable earnings and cash flow to pay expenses, make principal and interest payments on our outstanding indebtedness and make distributions to stockholders that grow over time; and (2) provide our stockholders with long-term capital appreciation in the value of our assets by investing in equity securities of established businesses that we believe can grow over time to permit us to sell our equity investments for capital gains. To achieve our objectives, our investment strategy is to invest in several categories of debt and equity securities, with each investment generally ranging from $5 million to $30 million, although investment size may vary, depending upon our total assets or available capital at the time of investment. In general, our investments in debt securities have a term of no more than seven years, accrue interest at variable rates (based on the London Interbank Offered Rate (“LIBOR”)) and, to a lesser extent, at fixed rates. We seek debt instruments that pay interest monthly or, at a minimum, quarterly, have a success fee or deferred interest provision and are primarily interest only with all principal and any accrued but unpaid interest due at maturity. Generally, success fees accrue at a set rate and are contractually due upon a change of control in the business. Some debt securities have deferred interest whereby some portion

3
of the interest payment is added to the principal balance so that the interest is paid, together with the principal, at maturity. This form of deferred interest is often called “paid in kind” (“PIK”). Typically, our equity investments consist of common stock, preferred stock, limited liability company interests, or warrants to purchase the foregoing. Often, these equity investments occur in connection with our original investment, recapitalizing a business, or refinancing existing debt. As of September 30, 2012, our portfolio consisted of loans to 50 companies located in 28 states in 21 different industries with an aggregate fair value of $274.0 million. Since our initial public offering in 2001, we have invested in over 158 different companies, while making over 109 consecutive monthly distributions to common stockholders (excluding the quarterly common distributions prior to that). We expect that our target portfolio over time will primarily include the following four categories of investments in private U.S. companies:
� Senior Debt Securities: We seek to invest a portion of our assets in senior debt securities also known as senior loans, senior term loans, lines of credit and senior notes. Using its assets as collateral, the borrower typically uses senior debt to cover a substantial portion of the funding needs of the business. The senior debt security usually takes the form of first priority liens on the assets of the business. Senior debt securities may include our participation and investment in the syndicated loan market.
� Senior Subordinated Debt Securities: We seek to invest a portion of our assets in senior subordinated debt securities, also known as senior subordinated loans and senior subordinated notes. These senior subordinated debts also include second lien notes and may include participation and investment in syndicated second lien loans. Additionally, we may receive other yield enhancements in connection with these senior subordinated debt securities.
� Junior Subordinated Debt Securities: We seek to invest a portion of our assets in junior subordinated debt
securities, also known as subordinated loans, subordinated notes and mezzanine loans. These junior subordinated debts include second lien notes and unsecured loans. Additionally, we may receive other yield enhancements and warrants to buy common and preferred stock or limited liability interests in connection with these junior subordinated debt securities.
.� Preferred and Common Equity/Equivalents: In some cases we will purchase equity securities which consist of preferred and common equity or limited liability company interests, or warrants or options to acquire such securities, and are in combination with our debt investment in a business. Additionally, we may receive equity investments derived from restructurings on some of our existing debt investments. In some cases, we will own a significant portion of the equity and in other cases we may have voting control of the businesses in which we invest.
Additionally, pursuant to the 1940 Act, we must maintain at least 70% of our total assets in qualifying assets, which generally include each of the investment types listed above. Therefore, the 1940 Act permits us to invest up to 30% of our assets in other non-qualifying assets. See “Regulation as a BDC — Qualifying Assets” for a discussion of the types of qualifying assets in which we may invest under Section 55(a) of the 1940 Act.
Because the majority of the loans in our portfolio consist of term debt of private companies that typically cannot or will not expend the resources to have their debt securities rated by a credit rating agency, we expect that most, if not all, of the debt securities we acquire will be unrated. Investors should assume that these loans would be rated below what is today considered “investment grade” quality. Investments rated below investment grade are often referred to as high yield securities or junk bonds and may be considered high risk, as compared to investment-grade debt instruments.
Investment Concentrations
Year over year, our investment concentration as a percentage of fair value and of cost has remained relatively unchanged. As of September 30, 2012, we held 20 syndicated investments totaling $77.8 million at cost and $78.2 million at fair value, or 21.3% and 28.5 %, respectively, of our total aggregate portfolio. We held 24 syndicated investments totaling $92.1 million at cost and $90.7 million at fair value, or 24.0% and 29.9%, respectively, of our total aggregate portfolio as of September 30, 2011.
4
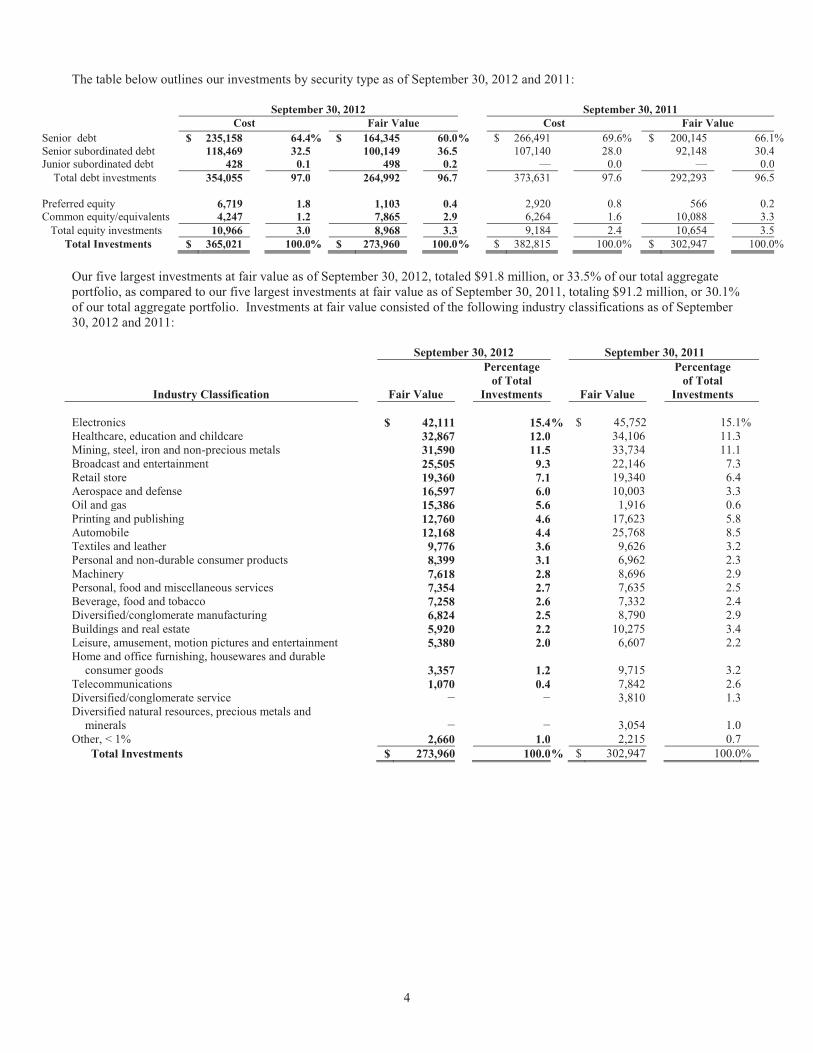
The table below outlines our investments by security type as of September 30, 2012 and 2011:
September 30, 2012 September 30, 2011 Cost Fair Value Cost Fair Value
Senior debt $ 235,158 64.4% $ 164,345 60.0 % $ 266,491 69.6% $ 200,145 66.1% Senior subordinated debt 118,469 32.5 100,149 36.5 107,140 28.0 92,148 30.4 Junior subordinated debt 428 0.1 498 0.2 — 0.0 — 0.0 Total debt investments 354,055 97.0 264,992 96.7 373,631 97.6 292,293 96.5
Preferred equity 6,719 1.8 1,103 0.4 2,920 0.8 566 0.2 Common equity/equivalents 4,247 1.2 7,865 2.9 6,264 1.6 10,088 3.3 Total equity investments 10,966 3.0 8,968 3.3 9,184 2.4 10,654 3.5
Total Investments $ 365,021 100.0% $ 273,960 100.0 % $ 382,815 100.0 % $ 302,947 100.0% Our five largest investments at fair value as of September 30, 2012, totaled $91.8 million, or 33.5% of our total aggregate portfolio, as compared to our five largest investments at fair value as of September 30, 2011, totaling $91.2 million, or 30.1% of our total aggregate portfolio. Investments at fair value consisted of the following industry classifications as of September 30, 2012 and 2011:
September 30, 2012 September 30, 2011
Industry Classification Fair Value
Percentage of Total
Investments Fair Value
Percentage of Total
Investments
Electronics $ 42,111 15.4 % $ 45,752 15.1 % Healthcare, education and childcare 32,867 12.0 34,106 11.3 Mining, steel, iron and non-precious metals 31,590 11.5 33,734 11.1 Broadcast and entertainment 25,505 9.3 22,146 7.3 Retail store 19,360 7.1 19,340 6.4 Aerospace and defense 16,597 6.0 10,003 3.3 Oil and gas 15,386 5.6 1,916 0.6 Printing and publishing 12,760 4.6 17,623 5.8 Automobile 12,168 4.4 25,768 8.5 Textiles and leather 9,776 3.6 9,626 3.2 Personal and non-durable consumer products 8,399 3.1 6,962 2.3 Machinery 7,618 2.8 8,696 2.9 Personal, food and miscellaneous services 7,354 2.7 7,635 2.5 Beverage, food and tobacco 7,258 2.6 7,332 2.4 Diversified/conglomerate manufacturing 6,824 2.5 8,790 2.9 Buildings and real estate 5,920 2.2 10,275 3.4 Leisure, amusement, motion pictures and entertainment 5,380 2.0 6,607 2.2 Home and office furnishing, housewares and durable
consumer goods 3,357 1.2 9,715 3.2
Telecommunications 1,070 0.4 7,842 2.6 Diversified/conglomerate service — — 3,810 1.3 Diversified natural resources, precious metals and
minerals — — 3,054 1.0
Other, < 1% 2,660 1.0 2,215 0.7 Total Investments $ 273,960 100.0 % $ 302,947 100.0 %
5
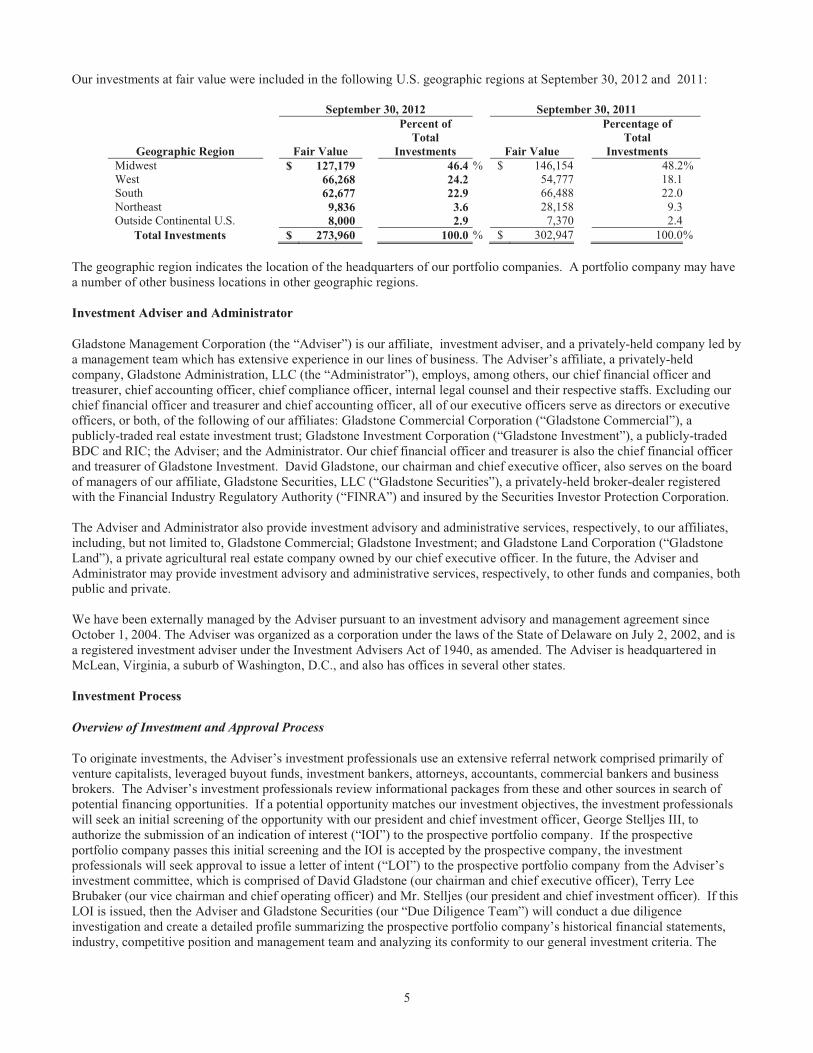
Our investments at fair value were included in the following U.S. geographic regions at September 30, 2012 and 2011:
September 30, 2012 September 30, 2011
Geographic Region
Fair Value
Percent of Total
Investments
Fair Value
Percentage of Total
Investments
Midwest $ 127,179 46.4 % $ 146,154 48.2% West 66,268 24.2 54,777 18.1 South 62,677 22.9 66,488 22.0 Northeast 9,836 3.6 28,158 9.3 Outside Continental U.S. 8,000 2.9 7,370 2.4
Total Investments $ 273,960 100.0 % $ 302,947 100.0 % The geographic region indicates the location of the headquarters of our portfolio companies. A portfolio company may have a number of other business locations in other geographic regions. Investment Adviser and Administrator
Gladstone Management Corporation (the “Adviser”) is our affiliate, investment adviser, and a privately-held company led by a management team which has extensive experience in our lines of business. The Adviser’s affiliate, a privately-held company, Gladstone Administration, LLC (the “Administrator”), employs, among others, our chief financial officer and treasurer, chief accounting officer, chief compliance officer, internal legal counsel and their respective staffs. Excluding our chief financial officer and treasurer and chief accounting officer, all of our executive officers serve as directors or executive officers, or both, of the following of our affiliates: Gladstone Commercial Corporation (“Gladstone Commercial”), a publicly-traded real estate investment trust; Gladstone Investment Corporation (“Gladstone Investment”), a publicly-traded BDC and RIC; the Adviser; and the Administrator. Our chief financial officer and treasurer is also the chief financial officer and treasurer of Gladstone Investment. David Gladstone, our chairman and chief executive officer, also serves on the board of managers of our affiliate, Gladstone Securities, LLC (“Gladstone Securities”), a privately-held broker-dealer registered with the Financial Industry Regulatory Authority (“FINRA”) and insured by the Securities Investor Protection Corporation. The Adviser and Administrator also provide investment advisory and administrative services, respectively, to our affiliates, including, but not limited to, Gladstone Commercial; Gladstone Investment; and Gladstone Land Corporation (“Gladstone Land”), a private agricultural real estate company owned by our chief executive officer. In the future, the Adviser and Administrator may provide investment advisory and administrative services, respectively, to other funds and companies, both public and private. We have been externally managed by the Adviser pursuant to an investment advisory and management agreement since October 1, 2004. The Adviser was organized as a corporation under the laws of the State of Delaware on July 2, 2002, and is a registered investment adviser under the Investment Advisers Act of 1940, as amended. The Adviser is headquartered in McLean, Virginia, a suburb of Washington, D.C., and also has offices in several other states. Investment Process
Overview of Investment and Approval Process
To originate investments, the Adviser’s investment professionals use an extensive referral network comprised primarily of venture capitalists, leveraged buyout funds, investment bankers, attorneys, accountants, commercial bankers and business brokers. The Adviser’s investment professionals review informational packages from these and other sources in search of potential financing opportunities. If a potential opportunity matches our investment objectives, the investment professionals will seek an initial screening of the opportunity with our president and chief investment officer, George Stelljes III, to authorize the submission of an indication of interest (“IOI”) to the prospective portfolio company. If the prospective portfolio company passes this initial screening and the IOI is accepted by the prospective company, the investment professionals will seek approval to issue a letter of intent (“LOI”) to the prospective portfolio company from the Adviser’s investment committee, which is comprised of David Gladstone (our chairman and chief executive officer), Terry Lee Brubaker (our vice chairman and chief operating officer) and Mr. Stelljes (our president and chief investment officer). If this LOI is issued, then the Adviser and Gladstone Securities (our “Due Diligence Team”) will conduct a due diligence investigation and create a detailed profile summarizing the prospective portfolio company’s historical financial statements, industry, competitive position and management team and analyzing its conformity to our general investment criteria. The
6
investment professionals then present this profile to the Adviser’s investment committee, which must approve each investment. Further, each investment is available for review by the members of our Board of Directors, a majority of whom are not “interested persons” as defined in Section 2(a)(19) of the 1940 Act.
Prospective Portfolio Company Characteristics
We have identified certain characteristics that we believe are important in identifying and investing in prospective portfolio companies. The criteria listed below provide general guidelines for our investment decisions, although not all of these criteria may be met by each portfolio company.
� Value-and-Income Orientation and Positive Cash Flow. Our investment philosophy places a premium on fundamental analysis from an investor’s perspective and has a distinct value-and-income orientation. In seeking value, we focus on companies in which we can invest at relatively low multiples of earnings before interest, taxes, depreciation and amortization (“EBITDA”), and that have positive operating cash flow at the time of investment. In seeking income, we typically invest in companies that generate relatively stable to growing sales and cash flow to provide some assurance that they will be able to service their debt and pay any required distributions on preferred stock. Typically, we do not expect to invest in start-up companies or companies with what we believe to be speculative business plans.
� Experienced Management. We generally require that the businesses in which we invest have an experienced management team. We also require the businesses to have in place proper incentives to induce management to succeed and act in concert with our interests as investors, including having significant equity or other interests in the financial performance of their companies.
� Strong Competitive Position in an Industry. We seek to invest in businesses that have developed strong market positions within their respective markets and that we believe are well-positioned to capitalize on growth opportunities. We seek businesses that demonstrate significant competitive advantages versus their competitors, which we believe will help to protect their market positions and profitability.
� Liquidation Value of Assets. The projected liquidation value of the assets, if any, is an important factor in our investment analysis in collateralizing our debt securities.
Extensive Due Diligence
Our Due Diligence Team conducts what we believe are extensive due diligence investigations of our prospective portfolio companies and investment opportunities. The due diligence investigation may begin with a review of publicly available information followed by in depth business analysis, including, but not limited to, some or all of the following:
� a review of the prospective portfolio company’s historical and projected financial information, including a quality of earnings analysis;
� visits to the prospective portfolio company’s business site(s);
� interviews with the prospective portfolio company’s management, employees, customers and vendors;
� review of loan documents;
� background checks and a management capabilities assessment on the prospective portfolio company’s management team; and
� research on the prospective portfolio company’s products, services or particular industry and its competitive position therein.
Upon completion of a due diligence investigation and a decision to proceed with an investment, the Adviser’s investment professionals who have primary responsibility for the investment present the investment opportunity to the Adviser’s investment committee. The investment committee then determines whether to pursue the potential investment. Additional due diligence of a potential investment may be conducted on our behalf by attorneys and independent accountants, as well as other outside advisers, prior to the closing of the investment, as appropriate.
7
We also rely on the long-term relationships that the Adviser’s investment professionals have with venture capitalists, leveraged buyout funds, investment bankers, commercial bankers, private equity sponsors, and business brokers. In addition, the extensive direct experiences of our executive officers and managing directors in the operations of and providing debt and equity capital to small and medium-sized private businesses plays a significant role in our investment evaluation and assessment of risk.
Investment Structure
Once we have determined that an investment meets our standards and investment criteria, we work with the management of that company and other capital providers to structure the transaction in a way that we believe will provide us with the greatest opportunity to maximize our return on the investment, while providing appropriate incentives to management of the company. As discussed above, the capital classes through which we typically structure a deal include senior debt, senior subordinated debt, junior subordinated debt, and preferred and common equity or equivalents. Through our risk management process, we seek to limit the downside risk of our investments by: • making investments with an expected total return (including both interest and potential equity appreciation) that we
believe compensates us for the credit risk of the investment;
• seeking collateral or superior positions in the portfolio company’s capital structure where possible;
• incorporating put rights and call protection into the investment structure where possible; and
• negotiating covenants in connection with our investments that afford our portfolio companies as much flexibility as possible in managing their businesses, consistent with the preservation of our capital.
We expect to hold most of our investments in senior debt and senior and junior subordinated debt until maturity or repayment, but may sell our investments (including our equity investments) earlier if a liquidity event takes place, such as the sale or recapitalization of a portfolio company or, in the case of an equity investment in a company, its initial public offering. Occasionally, we may sell some or all of our investment interests in a portfolio company to a third party, such as an existing investor in the portfolio company, in a privately negotiated transaction. Hedging Strategies
Although a portfolio company of ours has never gone public and we do not expect one of our portfolio companies to go public in the near future, we may undertake hedging strategies with regard to any equity interests that we may have in a portfolio company that goes public. We may mitigate risks associated with the volatility of publicly-traded securities by, for example, selling securities short or writing or buying call or put options. Hedging against a decline in the value of such investments in public companies would not eliminate fluctuations in the values of such investments or prevent losses if the values of such investments decline, but would establish or enhance a hedging strategy to seek to protect our investment in such securities. Therefore, by engaging in hedging transactions, we would seek to moderate the decline in the value of our hedged investments in public companies. However, such hedging transactions could also limit our opportunity to gain from an increase in the value of our investment in the public company. In the future, we may enter into hedging transactions, such as interest rate cap agreements, in connection with the borrowings that we make under our line of credit. We currently do not hold any interest rate cap agreements, although we have done so in the past. Hedging strategies can pose risks to us and our stockholders; however we believe that such activities are manageable because they will be limited to only a portion of our portfolio.
Section 12(a)(3) of the 1940 Act prohibits us from effecting a short sale of any security “in contravention of such rules and regulations or orders as the [Securities and Exchange Commission (“SEC”)] may prescribe as necessary or appropriate in the public interest or for the protection of investors . . .” While the SEC has not promulgated regulations under this statute to date, it is possible that such regulations could be promulgated in the future in a way that would require us to change any hedging strategies that we may adopt. In addition, our ability to engage in short sales may be limited by the 1940 Act’s leverage limitations. We will only engage in hedging activities in compliance with applicable laws and regulations.
8
Competitive Advantages
A large number of entities compete with us and make the types of investments that we seek to make in small and medium-sized privately-owned businesses. Such competitors include private equity funds, leveraged buyout funds, venture capital funds, investment banks and other equity and non-equity based investment funds, and other financing sources, including traditional financial services companies such as commercial banks. Many of our competitors are substantially larger than we are and have considerably greater funding sources that are not available to us. In addition, certain of our competitors may have higher risk tolerances or different risk assessments, which could allow them to consider a wider variety of investments, establish more relationships and build their market shares. Furthermore, many of these competitors are not subject to the regulatory restrictions that the 1940 Act imposes on us as a BDC. However, we believe that we have the following competitive advantages over other providers of financing to small and mid-sized businesses.
Management Expertise
David Gladstone, our chairman and chief executive officer, is also the chairman and chief executive officer of the Adviser and its affiliated companies, other than Gladstone Securities, (the “Gladstone Companies”), and has been involved in all aspects of the Gladstone Companies' investment activities, including serving as a member of the Adviser's investment committee. Terry Lee Brubaker is our vice chairman and chief operating officer and has substantial experience in acquisitions and operations of companies. George Stelljes III is our president and chief investment officer and has extensive experience in leveraged finance. Messrs. Gladstone, Brubaker and Stelljes are also executive officers of the Adviser and, as a result, have principal management responsibility for the Adviser. These three individuals dedicate a significant portion of their time to managing our investment portfolio. Our senior management has extensive experience providing capital to small and mid-sized companies and has worked together at the Gladstone Companies for more than ten years. In addition, we have access to the resources and expertise of the Adviser's investment professionals and supporting staff who possess a broad range of transactional, financial, managerial and investment skills.
Increased Access to Investment Opportunities Developed Through Proprietary Research Capability and an Extensive Network of Contacts
The Adviser seeks to identify potential investments through active origination and due diligence and through its dialogue with numerous management teams, members of the financial community and potential corporate partners with whom the Adviser's investment professionals have long-term relationships. We believe that the Adviser's investment professionals have developed a broad network of contacts within the investment, commercial banking, private equity and investment management communities, and that their reputation in investment management enables us to identify well-positioned prospective portfolio companies, which provide attractive investment opportunities. Additionally, the Adviser expects to generate information from its professionals' network of accountants, consultants, lawyers and management teams of portfolio companies and other companies.
Disciplined, Value and Income-Oriented Investment Philosophy with a Focus on Preservation of Capital
In making its investment decisions, the Adviser focuses on the risk and reward profile of each prospective portfolio company, seeking to minimize the risk of capital loss without foregoing the potential for capital appreciation. We expect the Adviser to use the same value and income-oriented investment philosophy that its professionals use in the management of the other Gladstone Companies and to commit resources to management of downside exposure. The Adviser's approach seeks to reduce our risk in investments by using some or all of the following approaches:
� focusing on companies with good market positions and cash flow;
� investing in businesses with experienced and established management teams; � engaging in extensive due diligence from the perspective of a long-term investor; � investing at low price-to-cash flow multiples; and � adopting flexible transaction structures by drawing on the experience of the investment professionals of the Adviser and
its affiliates.
9
Longer Investment Horizon with Attractive Publicly-traded Model
Unlike private equity and venture capital funds that are typically organized as finite-life partnerships, we are not subject to standard periodic capital return requirements. The partnership agreements of most private equity and venture capital funds typically provide that these funds may only invest investors' capital once and must return all capital and realized gains to investors within a finite time period, often seven to ten years. These provisions often force private equity and venture capital funds to seek returns on their investments by causing their portfolio companies to pursue mergers, public equity offerings, or other liquidity events more quickly than might otherwise be optimal or desirable, potentially resulting in a lower overall return to investors and/or an adverse impact on their portfolio companies. We believe that our flexibility to make investments with a long-term view and without the capital return requirements of traditional private investment vehicles provides us with the opportunity to achieve greater long-term returns on invested capital.
Flexible Transaction Structuring
We believe our management team's broad expertise and its ability to draw upon many years of combined experience enables the Adviser to identify, assess, and structure investments successfully across all levels of a company's capital structure and manage potential risk and return at all stages of the economic cycle. We are not subject to many of the regulatory limitations that govern traditional lending institutions, such as banks. As a result, we are flexible in selecting and structuring investments, adjusting investment criteria and transaction structures and, in some cases, the types of securities in which we invest. We believe that this approach enables the Adviser to identify attractive investment opportunities that will continue to generate current income and capital gain potential throughout the economic cycle, including during turbulent periods in the capital markets. One example of our flexibility is our ability to exchange our publicly-traded stock for the stock of an acquisition target in a tax-free reorganization under the Code. After completing an acquisition in such an exchange, we can restructure the capital of the small company to include senior and subordinated debt.
Leverage
For the purpose of making investments and taking advantage of favorable interest rates, we may issue senior securities up to the maximum amount permitted by the 1940 Act. The 1940 Act currently permits us to issue senior securities representing indebtedness and senior securities that are stock, to which we refer collectively as “Senior Securities,” in amounts such that we maintain an asset coverage ratio, as defined in Section 18(h) of the 1940 Act, of at least 200% on our Senior Securities immediately after each issuance of such Senior Securities. We may also incur such indebtedness to repurchase our common stock. As a result of incurring indebtedness generally, such as through our revolving line of credit or issuing senior securities representing indebtedness, such as our Term Preferred Stock, exposed to the risks of leverage. Although borrowing money for investments increases the potential for gain, it also increases the risk of a loss. A decrease in the value of our investments will have a greater impact on the value of our common stock to the extent that we have borrowed money to make investments. There is a possibility that the costs of borrowing could exceed the income we receive on the investments we make with such borrowed funds. Our Board of Directors is authorized to provide for the issuance of Senior Securities with such preferences, powers, rights and privileges as it deems appropriate, subject to the requirements of the 1940 Act. See “Regulation as a BDC—Asset Coverage” for a discussion of our leveraging constraints.
Ongoing Management of Investments and Portfolio Company Relationships
The Adviser’s investment professionals actively oversee each investment by continuously evaluating the portfolio company’s performance and typically working collaboratively with the portfolio company’s management to identify and incorporate best resources and practices that help us achieve our projected investment performance. Monitoring
The Adviser’s investment professionals monitor the financial performance, trends, and changing risks of each portfolio company on an ongoing basis to determine if each company is performing within expectations and to guide the portfolio company’s management in taking the appropriate courses of action. The Adviser employs various methods of evaluating and monitoring the performance of our investments in portfolio companies, which can include the following:
� Monthly analysis of financial and operating performance; � Assessment of the portfolio company’s performance against its business plan and our investment expectations;
10
� Assessment of the investment’s risks; � Participation in the portfolio company’s board of directors or management meetings; � Assessment of portfolio company management, sponsor, governance and strategic direction; � Assessment of the portfolio company’s industry and competitive environment; and
� Review and assessment of the portfolio company’s operating outlook and financial projections.
Relationship Management
The Adviser’s investment professionals interact with various parties involved with a portfolio company, or investment, by actively engaging with internal and external constituents, including:
� Management; � Boards of directors; � Financial sponsors; � Capital partners; and � Advisers and consultants.
Managerial Assistance and Services As a BDC, we make available significant managerial assistance to our portfolio companies and provide other services to such portfolio companies. Neither we, nor the Adviser, currently receive fees in connection with the managerial assistance we make available. At times, the Adviser provides other services to certain of our portfolio companies and it receives fees for these other services. We credit 50% of certain of these fees and 100% of others against the base management fee that we would otherwise be required to pay to the Adviser. In February 2011, Gladstone Securities started providing other services (such as investment banking and due diligence services) to certain of our portfolio companies. The fees the portfolio companies paid to Gladstone Securities do not impact the overall fees we pay to the Adviser or the overall fees credited against the base management fee.
Valuation Process
The following is a general description of the steps we take each quarter to determine the value of our investment portfolio. We value our investments in accordance with the requirements of the 1940 Act. We value securities for which market quotations are readily available at their market value. We value all other securities and assets at fair value as determined in good faith by our Board of Directors. In determining the value of our investments, the Adviser has established an investment valuation policy (the “Policy”). The Policy has been approved by our Board of Directors and each quarter the Board of Directors reviews whether the Adviser has applied the Policy consistently and votes whether or not to accept the recommended valuation of our investment portfolio. Due to the uncertainty inherent in the valuation process, such estimates of fair value may differ significantly from the values that would have been obtained had a ready market for the securities existed. Investments for which market quotations are readily available are recorded in our financial statements at such market quotations. With respect to any investments for which market quotations are not readily available, we perform the following valuation process each quarter:
� Quarterly, each portfolio company or investment is initially assessed by the Adviser’s investment professionals responsible for the investment, using the Policy;
� Preliminary valuation conclusions are then discussed with our management, and documented, along with any independent opinions of value provided by Standard & Poor’s Securities Evaluations, Inc. (“SPSE”), for review by our Board of Directors;
� Next, our Board of Directors reviews this documentation and discusses the information provided by our management, and the opinions of value provided by SPSE to arrive at a determination that the Policy has been followed for determining the aggregate fair value of our portfolio of investments.
11
Our valuation policies, procedures and processes are more fully described under “Management’s Discussion and Analysis of Financial Condition and Results of Operations — Critical Accounting Policies — Investment Valuation.”
Investment Advisory and Management Agreements
In 2004, we entered into an investment advisory and management agreement with the Adviser (as amended, the “Advisory Agreement”). Mr. Gladstone, our chairman and chief executive officer, controls the Adviser. In accordance with the Advisory Agreement, we pay the Adviser fees as compensation for its services, consisting of a base management fee and an incentive fee. On July 10, 2012, our Board of Directors approved the renewal of the Advisory Agreement through August 31, 2013.
Base Management Fee The base management fee is computed and payable quarterly and is assessed at an annual rate of 2.0% computed on the basis of the value of our average gross assets at the end of the two most recently completed quarters, which are total assets, including investments made with proceeds of borrowings, less any uninvested cash or cash equivalents resulting from borrowings. Overall, the base management fee cannot exceed 2.0% of total assets (as reduced by cash and cash equivalents pledged to creditors) during any given fiscal year. In addition, the following three items are potential adjustments to the base management fee calculation.
� Loan Servicing Fees The Adviser also services the loans held by our wholly-owned subsidiary, Gladstone Business Loan, LLC (“Business Loan”), in return for which the Adviser generally receives a 1.5% annual fee based on the monthly aggregate outstanding balance of loans pledged under our line of credit. Since we own these loans, all loan servicing fees paid to the Adviser are treated as reductions directly against the 2.0% base management fee under the Advisory Agreement.
� Portfolio Company Fees Under the Advisory Agreement, the Adviser has also provided and continues to provide managerial assistance and other services to our portfolio companies and may receive fees for services other than managerial assistance. We credit 50% of certain of these fees and 100% of others against the base management fee that we would otherwise be required to pay to the Adviser.
� Senior Syndicated Loan Fee Waiver
Our Board of Directors accepted an unconditional and irrevocable voluntary waiver from the Adviser to reduce the annual 2.0% base management fee on senior syndicated loan participations to 0.5%, to the extent that proceeds resulting from borrowings were used to purchase such syndicated loan participations, for the years ended September 30, 2012 and 2011.
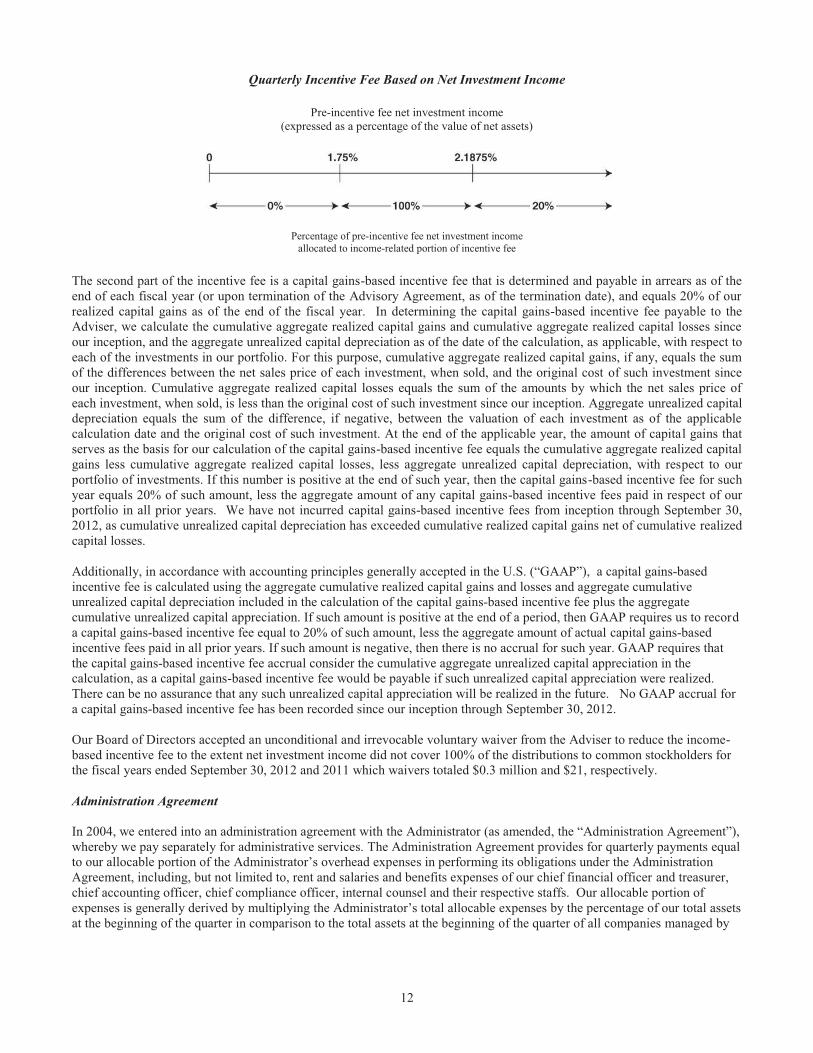
Incentive Fee The incentive fee consists of two parts: an income-based incentive fee and a capital gains-based incentive fee. The income-based incentive fee rewards the Adviser if our quarterly net investment income (before giving effect to any incentive fee) exceeds 1.75% of our net assets (the “hurdle rate”). We will pay the Adviser an income-based incentive fee with respect to our pre-incentive fee net investment income in each calendar quarter as follows:
� no incentive fee in any calendar quarter in which our pre-incentive fee net investment income does not exceed the hurdle rate (7% annualized);
� 100% of our pre-incentive fee net investment income with respect to that portion of such pre-incentive fee net investment income, if any, that exceeds the hurdle rate but is less than 2.1875% in any calendar quarter (8.75% annualized); and
� 20% of the amount of our pre-incentive fee net investment income, if any, that exceeds 2.1875% in any calendar quarter (8.75% annualized).
12
Quarterly Incentive Fee Based on Net Investment Income
Pre-incentive fee net investment income (expressed as a percentage of the value of net assets)
Percentage of pre-incentive fee net investment income allocated to income-related portion of incentive fee
The second part of the incentive fee is a capital gains-based incentive fee that is determined and payable in arrears as of the end of each fiscal year (or upon termination of the Advisory Agreement, as of the termination date), and equals 20% of our realized capital gains as of the end of the fiscal year. In determining the capital gains-based incentive fee payable to the Adviser, we calculate the cumulative aggregate realized capital gains and cumulative aggregate realized capital losses since our inception, and the aggregate unrealized capital depreciation as of the date of the calculation, as applicable, with respect to each of the investments in our portfolio. For this purpose, cumulative aggregate realized capital gains, if any, equals the sum of the differences between the net sales price of each investment, when sold, and the original cost of such investment since our inception. Cumulative aggregate realized capital losses equals the sum of the amounts by which the net sales price of each investment, when sold, is less than the original cost of such investment since our inception. Aggregate unrealized capital depreciation equals the sum of the difference, if negative, between the valuation of each investment as of the applicable calculation date and the original cost of such investment. At the end of the applicable year, the amount of capital gains that serves as the basis for our calculation of the capital gains-based incentive fee equals the cumulative aggregate realized capital gains less cumulative aggregate realized capital losses, less aggregate unrealized capital depreciation, with respect to our portfolio of investments. If this number is positive at the end of such year, then the capital gains-based incentive fee for such year equals 20% of such amount, less the aggregate amount of any capital gains-based incentive fees paid in respect of our portfolio in all prior years. We have not incurred capital gains-based incentive fees from inception through September 30, 2012, as cumulative unrealized capital depreciation has exceeded cumulative realized capital gains net of cumulative realized capital losses. Additionally, in accordance with accounting principles generally accepted in the U.S. (“GAAP”), a capital gains-based incentive fee is calculated using the aggregate cumulative realized capital gains and losses and aggregate cumulative unrealized capital depreciation included in the calculation of the capital gains-based incentive fee plus the aggregate cumulative unrealized capital appreciation. If such amount is positive at the end of a period, then GAAP requires us to record a capital gains-based incentive fee equal to 20% of such amount, less the aggregate amount of actual capital gains-based incentive fees paid in all prior years. If such amount is negative, then there is no accrual for such year. GAAP requires that the capital gains-based incentive fee accrual consider the cumulative aggregate unrealized capital appreciation in the calculation, as a capital gains-based incentive fee would be payable if such unrealized capital appreciation were realized. There can be no assurance that any such unrealized capital appreciation will be realized in the future. No GAAP accrual for a capital gains-based incentive fee has been recorded since our inception through September 30, 2012. Our Board of Directors accepted an unconditional and irrevocable voluntary waiver from the Adviser to reduce the income-based incentive fee to the extent net investment income did not cover 100% of the distributions to common stockholders for the fiscal years ended September 30, 2012 and 2011 which waivers totaled $0.3 million and $21, respectively. Administration Agreement In 2004, we entered into an administration agreement with the Administrator (as amended, the “Administration Agreement”), whereby we pay separately for administrative services. The Administration Agreement provides for quarterly payments equal to our allocable portion of the Administrator’s overhead expenses in performing its obligations under the Administration Agreement, including, but not limited to, rent and salaries and benefits expenses of our chief financial officer and treasurer, chief accounting officer, chief compliance officer, internal counsel and their respective staffs. Our allocable portion of expenses is generally derived by multiplying the Administrator’s total allocable expenses by the percentage of our total assets at the beginning of the quarter in comparison to the total assets at the beginning of the quarter of all companies managed by
13
the Adviser under similar agreements. On July 10, 2012, our Board of Directors approved the renewal of the Administration Agreement through August 31, 2013. Material U.S. Federal Income Tax Considerations
Regulated Investment Company Status
To maintain the qualification for treatment as a RIC under Subchapter M of the Code, we must distribute to our stockholders, for each taxable year, at least 90% of our investment company taxable income, which is generally our ordinary income plus short-term capital gains. We refer to this as the annual distribution requirement. We must also meet several additional requirements, including:
� Business Development Company status. At all times during the taxable year, we must maintain our status as a BDC.
� Income source requirements. At least 90% of our gross income for each taxable year must be from distributions, interest, payments with respect to securities loans, gains from sales or other dispositions of securities or other income derived with respect to our business of investing in securities, and net income derived from an interest in a qualified publicly-traded partnership.
� Asset diversification requirements. As of the close of each quarter of our taxable year: (1) at least 50% of the value of our assets must consist of cash, cash items, U.S. government securities, the securities of other regulated investment companies and other securities to the extent that (a) we do not hold more than 10% of the outstanding voting securities of an issuer of such other securities and (b) such other securities of any one issuer do not represent more than 5% of our total assets; and (2) no more than 25% of the value of our total assets may be invested in the securities of one issuer (other than U.S. government securities or the securities of other regulated investment companies), or of two or more issuers that are controlled by us and are engaged in the same or similar or related trades or businesses or in the securities of one or more qualified publicly-traded partnerships.
Failure to Qualify as a RIC. If we are unable to qualify for treatment as a RIC, we will be subject to tax on all of our taxable income at regular corporate rates. We would not be able to deduct distributions to stockholders, nor would we be required to make such distributions. Distributions would be taxable to our stockholders as dividend income to the extent of our current and accumulated earnings and profits. Subject to certain limitations under the Code, corporate distributees would be eligible for the distributions received deduction. Distributions in excess of our current and accumulated earnings and profits would be treated first as a return of capital to the extent of the stockholder’s tax basis, and then as a gain realized from the sale or exchange of property. If we fail to meet the RIC requirements for more than two consecutive years and then seek to requalify as a RIC, we would be required to recognize a gain to the extent of any unrealized appreciation on our assets unless we make a special election to pay corporate-level tax on any such unrealized appreciation recognized during the succeeding 10-year period. Absent such special election, any gain we recognized would be deemed distributed to our stockholders as a taxable distribution.
Qualification as a RIC. If we qualify as a RIC and distribute to stockholders each year in a timely manner at least 90% of our investment company taxable income, we will not be subject to federal income tax on the portion of our taxable income and gains we distribute to stockholders. We would, however, be subject to a 4% nondeductible federal excise tax if we do not distribute, actually or on a deemed basis, an amount at least equal to the sum of (1) 98% of our ordinary income for the calendar year, (2) 98.2% of our capital gains in excess of capital losses for the one-year period ending on October 31 of the calendar year and (3) any ordinary income and net capital gains for preceding years that were not distributed during such years. For the years ended December 31, 2011 and 2010, we did not incur any excise taxes.
The excise tax would apply only to the amount by which the required distributions exceed the amount of income we distribute, actually or on a deemed basis, to stockholders. We will be subject to regular corporate income tax, currently at rates up to 35%, on any undistributed income, including both ordinary income and capital gains. We intend to retain some or all of our capital gains, but to treat the retained amount as a deemed distribution. In that case, among other consequences, we will pay tax on the retained amount, each stockholder will be required to include its share of the deemed distribution in income as if it had been actually distributed to the stockholder and the stockholder will be entitled to claim a credit or refund equal to its allocable share of the tax we pay on the retained capital gain. The amount of the deemed distribution net of such tax will be added to the stockholder’s cost basis for its common stock. Since we expect to pay tax on any retained capital
14
gains at our regular corporate capital gain tax rate, and since that rate is in excess of the maximum rate currently payable by individuals on long-term capital gains, the amount of tax that individual stockholders will be treated as having paid will exceed the tax they owe on the capital gain dividend and such excess may be claimed as a credit or refund against the stockholder’s other tax obligations. A stockholder that is not subject to U.S. federal income tax or tax on long-term capital gains would be required to file a U.S. federal income tax return on the appropriate form in order to claim a refund for the taxes we paid. In order to utilize the deemed distribution approach, we must provide written notice to the stockholder after the close of the relevant tax year. We will also be subject to alternative minimum tax, but any tax preference items would be apportioned between us and our stockholders in the same proportion that distributions, other than capital gain distributions, paid to each stockholder bear to our taxable income determined without regard to the distributions paid deduction.
If we acquire debt obligations that were originally issued at a discount that bear interest at rates that are not either fixed rates or certain qualified variable rates or that are not unconditionally payable at least annually over the life of the obligation, we will be required to include in taxable income each year a portion of the original issue discount (“OID”) that accrues over the life of the obligation. Such OID will be included in our investment company taxable income even though we receive no cash corresponding to such discount amount. As a result, we may be required to make additional distributions corresponding to such OID amounts in order to satisfy the annual distribution requirement and to continue to qualify as a RIC or to avoid the 4% excise tax. In this event, we may be required to sell investments or other assets to meet the RIC distribution requirements. Our OID investments totaled $94.9 million as of September 30, 2012, at cost, due to the large number of syndicated loan investments we made during fiscal 2011. For the year ended September 30, 2012, we incurred $0.3 million of OID income and the unamortized balance of OID investments as of September 30, 2012 totaled $1.1 million.
Taxation of Our U.S. Stockholders
Distributions. For any period during which we qualify for treatment as a RIC for federal income tax purposes, distributions to our stockholders attributable to our investment company taxable income generally will be taxable as ordinary income to stockholders to the extent of our current or accumulated earnings and profits. We first allocate our earnings and profits to our preferred stockholders and then to our common stockholders based on priority in our capital structure. Any distributions in excess of our earnings and profits will first be treated as a return of capital to the extent of the stockholder’s adjusted basis in his or her shares of common stock and thereafter as gain from the sale of shares of our common stock. Distributions of our long-term capital gains, reported by us as such, will be taxable to stockholders as long-term capital gains regardless of the stockholder’s holding period for its common stock and whether the distributions are paid in cash or invested in additional common stock. Corporate stockholders are generally eligible for the 70% distributions received deduction with respect to ordinary income, but not for capital gains dividends to the extent such amount reported by us does not exceed the dividends received by us from domestic corporations. Any dividend declared by us in October, November or December of any calendar year, payable to stockholders of record on a specified date in such a month and actually paid during January of the following year, will be treated as if it were paid by us and received by the stockholders on December 31 of the previous year. In addition, we may elect (in accordance with Section 855(a) of the Code) to relate a dividend back to the prior taxable year if we (1) declare such dividend prior to the later of the due date for filing our return for that taxable year or the 15th day of the ninth month following the close of the taxable year, (2) make the election in that return, and (3) distribute the amount in the 12-month period following the close of the taxable year but not later than the first regular dividend payment of the same type following the declaration. Any such election will not alter the general rule that a stockholder will be treated as receiving a dividend in the taxable year in which the dividend is made, subject to the October, November, December rule described above.
If a common stockholder participates in our dividend reinvestment plan, any distributions reinvested under the plan will be taxable to the common stockholder to the same extent, and with the same character, as if the common stockholder had received the distribution in cash. The common stockholder will have an adjusted basis in the additional common shares purchased through the plan equal to the amount of the reinvested distribution. The additional shares will have a new holding period commencing on the day following the day on which the shares are credited to the common stockholder’s account. We do not have a dividend reinvestment plan for our preferred stock shareholders.
Sale of Our Shares. A U.S. stockholder generally will recognize taxable gain or loss if the U.S. stockholder sells or otherwise disposes of his, her or its shares of our common stock. Any gain arising from such sale or disposition generally will be treated as long-term capital gain or loss if the U.S. stockholder has held his, her or its shares for more than one year. Otherwise, it will be classified as short-term capital gain or loss. However, any capital loss arising from the sale or disposition of shares of our common stock held for six months or less will be treated as long-term capital loss to the extent of the amount of capital gain distributions received, or undistributed capital gain deemed received, with respect to such shares. Under the tax laws in effect as of the date of this filing, individual U.S. stockholders are subject to a maximum federal
15
income tax rate of 15% on their net capital gain (i.e. the excess of realized net long-term capital gain over realized net short-term capital loss for a taxable year) including any long-term capital gain derived from an investment in our shares. Such rate is lower than the maximum rate on ordinary income currently payable by individuals. Corporate U.S. stockholders currently are subject to federal income tax on net capital gain at the same rates applied to their ordinary income (currently up to a maximum of 35%). Capital losses are subject to limitations on use for both corporate and non-corporate stockholders. Backup Withholding. We may be required to withhold federal income tax, or backup withholding, currently at a rate of 28%, from all taxable distributions to any non-corporate U.S. stockholder (1) who fails to furnish us with a correct taxpayer identification number or a certificate that such stockholder is exempt from backup withholding, or (2) with respect to whom the Internal Revenue Service (“IRS”) notifies us that such stockholder has failed to properly report certain interest and dividend income to the IRS and to respond to notices to that effect. An individual’s taxpayer identification number is generally his or her social security number. Any amount withheld under backup withholding is allowed as a credit against the U.S. stockholder’s federal income tax liability, provided that proper information is provided to the IRS. Regulation as a BDC
We are a closed-end, non-diversified management investment company that has elected to be regulated as a BDC under Section 54 of the 1940 Act. As such, we are subject to regulation under the 1940 Act. The 1940 Act contains prohibitions and restrictions relating to transactions between BDCs and their affiliates, principal underwriters and affiliates of those affiliates or underwriters and requires that a majority of the directors be persons other than “interested persons,” as defined in the 1940 Act. In addition, the 1940 Act provides that we may not change the nature of our business so as to cease to be, or to withdraw our election as, a BDC unless approved by a majority of our outstanding “voting securities,” as defined in the 1940 Act.
We intend to conduct our business so as to retain our status as a BDC. A BDC may use capital provided by public stockholders and from other sources to invest in long-term private investments in businesses. A BDC provides stockholders the ability to retain the liquidity of a publicly-traded stock while sharing in the possible benefits, if any, of investing in primarily privately owned companies. In general, a BDC must have been organized and have its principal place of business in the U.S. and must be operated for the purpose of making investments in qualifying assets, as described in Sections 55(a)(1) through (a)(3) of the 1940 Act.
Qualifying Assets
Under the 1940 Act, a BDC may not acquire any asset other than assets of the type listed in Section 55(a) of the 1940 Act, which are referred to as qualifying assets, unless, at the time the acquisition is made, qualifying assets, other than certain interests in furniture, equipment, real estate, or leasehold improvements (“operating assets”) represent at least 70% of our total assets, exclusive of operating assets. The types of qualifying assets in which we may invest under the 1940 Act include, but are not limited to, the following:
(1) Securities purchased in transactions not involving any public offering from the issuer of such securities, which issuer is an eligible portfolio company. An eligible portfolio company is generally defined in the 1940 Act as any issuer which:
(a) is organized under the laws of, and has its principal place of business in, any State or States in the U.S.;
(b) is not an investment company (other than a small business investment company wholly owned by the BDC or otherwise excluded from the definition of investment company); and
(c) satisfies one of the following:
(i) it does not have any class of securities with respect to which a broker or dealer may extend margin credit;
(ii) it is controlled by the BDC and for which an affiliate of the BDC serves as a director;
(iii) it has total assets of not more than $4 million and capital and surplus of not less than $2 million;
(iv) it does not have any class of securities listed on a national securities exchange; or
(v) it has a class of securities listed on a national securities exchange, with an aggregate market value of outstanding voting and non-voting equity of less than $250 million.
(2) Securities received in exchange for or distributed on or with respect to securities described in (1) above, or pursuant to the exercise of options, warrants or rights relating to such securities.
16
(3) Cash, cash items, government securities or high quality debt securities maturing in one year or less from the time of investment.
Asset Coverage
Pursuant to Section 61(a)(2) of the 1940 Act, we are permitted, under specified conditions, to issue multiple classes of senior securities representing indebtedness. However, pursuant to Section 18(c) of the 1940 Act, we are permitted to issue only one class of senior securities that is stock. In either case, we may only issue such Senior Securities if such class of Senior Securities, after such issuance, has an asset coverage, as defined in Section 18(h) of the 1940 Act, of at least 200%.
In addition, our ability to pay dividends or distributions (other than dividends payable in our stock) to holders of any class of our capital stock would be restricted if our senior securities representing indebtedness fail to have an asset coverage of at least 200% (measured at the time of declaration of such distribution and accounting for such distribution). The 1940 Act does not apply this limitation to privately arranged debt that is not intended to be publicly distributed, unless this limitation is specifically negotiated by the lender. In addition, our ability to pay dividends or distributions (other than dividends payable in our common stock) to our common stockholders would be restricted if our senior securities that are stock fail to have an asset coverage of at least 200% (measured at the time of declaration of such distribution and accounting for such distribution). If the value of our assets declines, we might be unable to satisfy these asset coverage requirements. To satisfy the 200% asset coverage requirement in the event that we are seeking to pay a distribution, we might either have to (i) liquidate a portion of our loan portfolio to repay a portion of our indebtedness or (ii) issue common stock. This may occur at a time when a sale of a portfolio asset may be disadvantageous, or when we have limited access to capital markets on a agreeable terms. In addition, any amounts that we use to service our indebtedness or for offering expenses will not be available for distributions to our stockholders. If we are unable to regain asset coverage through these methods, we may be forced to suspend the payment of such dividends.
Significant Managerial Assistance
A BDC generally must make available significant managerial assistance to issuers of certain of its portfolio securities that the BDC counts as a qualifying asset for the 70% test described above. Making available significant managerial assistance means, among other things, any arrangement whereby the BDC, through its directors, officers or employees, offers to provide, and, if accepted, does so provide, significant guidance and counsel concerning the management, operations or business objectives and policies of a portfolio company. Significant managerial assistance also includes the exercise of a controlling influence over the management and policies of the portfolio company. However, with respect to certain, but not all such securities, where the BDC purchases such securities in conjunction with one or more other persons acting together, one of the other persons in the group may make available such managerial assistance, or the BDC may exercise such control jointly.
Investment Policies
We seek to achieve a high level of current income and capital gains through investments in debt securities and preferred and common stock that we acquired in connection with buyout and other recapitalizations. The following investment policies, along with these investment objectives, may not be changed without the approval of our Board of Directors:
� We will at all times conduct our business so as to retain our status as a BDC. In order to retain that status, we must be operated for the purpose of investing in certain categories of qualifying assets. In addition, we may not acquire any assets (other than non-investment assets necessary and appropriate to our operations as a BDC or qualifying assets) if, after giving effect to such acquisition, the value of our "qualifying assets" is less than 70% of the value of our total assets. We anticipate that the securities we seek to acquire will generally be qualifying assets.
� We will at all times endeavor to conduct our business so as to retain our status as a RIC under the Code. In order to do so, we must meet income source, asset diversification and annual distribution requirements. We may issue senior securities, such as debt or preferred stock, to the extent permitted by the 1940 Act for the purpose of making investments, to fund share repurchases, or for temporary emergency or other purposes.
With the exception of our policy to conduct our business as a BDC, these policies are not fundamental and may be changed without stockholder approval.
17
Code of Ethics
We and all of the Gladstone Companies (and Gladstone Securities) have adopted a code of ethics and business conduct applicable to all personnel of such companies that complies with the guidelines set forth in Item 406 of Regulation S-K of the Securities Act of 1933 (the “Securities Act”). As required by the 1940 Act, this code establishes procedures for personal investments, restricts certain transactions by such personnel and requires the reporting of certain transactions and holdings by such personnel. A copy of this code is available for review, free of charge, at our website at www.GladstoneCapital.com. We intend to provide any required disclosure of any amendments to or waivers of the provisions of this code by posting information regarding any such amendment or waiver to our website within four days of its effectiveness.
Compliance Policies and Procedures
We and the Adviser have adopted and implemented written policies and procedures reasonably designed to prevent violation of the federal securities laws, and our Board of Directors is required to review these compliance policies and procedures annually to assess their adequacy and the effectiveness of their implementation. We have designated a chief compliance officer, John Dellafiora, Jr., who also serves as chief compliance officer for all other Gladstone Companies and Gladstone Securities.
Staffing
We do not currently have any employees and do not expect to have any employees in the foreseeable future. Currently, services necessary for our business are provided by individuals who are employees of the Adviser and the Administrator pursuant to the terms of the Advisory Agreement and the Administration Agreement, respectively. No employee of the Adviser or the Administrator will dedicate all of his or her time to us. However, we expect that 25-30 full time employees of the Adviser and the Administrator will spend substantial time on our matters during the remainder of calendar year 2012 and all of calendar year 2013. To the extent we acquire more investments, we anticipate that the number of employees of the Adviser and the Administrator who devote time to our matters will increase.
As of November 9, 2012, the Adviser and the Administrator collectively had 56 full-time employees. A breakdown of these employees is summarized by functional area in the table below:
Number of Individuals Functional Area
10 Executive Management 34 Investment Management, Portfolio Management and Due Diligence 12 Administration, Accounting, Compliance, Human Resources, Legal and Treasury
Available Information
Copies of our annual report on Form 10-K, quarterly reports on Form 10-Q, current reports on Form 8-K, and amendments, if any, to those reports filed pursuant to Section 13(a) or 15(d) of the Securities Exchange Act of 1934, as amended (the “Exchange Act”) are available free of charge through our website at www.GladstoneCapital.com. A request for any of these reports may also be submitted to us by sending a written request addressed to Investor Relations, Gladstone Capital Corporation, 1521 Westbranch Drive, Suite 200, McLean, VA 22102, or by calling our toll-free investor relations line at 1-866-366-5745. The public may read and copy materials that we file with the SEC at the SEC’s Public Reference Room at 100 F Street, NE, Washington, DC 20549. Information on the operation of the Public Reference Room may be obtained by calling the SEC at 1-800-SEC-0330. The SEC also maintains a website that contains reports, proxy and information statements, and other information regarding issuers that file electronically with the SEC at www.sec.gov.

18
Item 1A. Risk Factors
An investment in our securities involves a number of significant risks and other factors relating to our structure and investment objectives. As a result, we cannot assure you that we will achieve our investment objectives. Additional risks and uncertainties not presently known to us, or not presently deemed material by us, may also impair our operations and performance. If any of the following risks actually occur, our business, financial condition or results of operations could be materially adversely affected. If that happens, the trading price of our securities could decline. You should consider carefully the following information before making an investment in our securities.
Risks Related to the Economy The uncertainty surrounding the strength of the U.S. economic recovery and the capital markets volatility in general increases the possibility of adverse effects on our financial position and results of operations. Continued economic adversity could impair our portfolio companies’ financial positions and operating results, affect the industries in which we invest, and reduce our volume of new investment activity, thereby harming our operating results. Continued adversity in the capital markets could impact our ability to raise capital and reduce our volume of new investments. The U.S. is continuing to recover from the recession that largely began in late 2007. While economic conditions generally appear to be improving, we remain cautious about a long-term economic recovery. The recession in general, and the disruptions in the capital markets in particular, have impacted our liquidity options and increased our cost of debt and equity capital. As a result, we do not know if adverse conditions will again intensify, and we are unable to gauge the full extent to which the disruptions will continue to affect us. The longer these uncertain conditions persist, the greater the probability that these factors could continue to increase our costs of, and significantly limit our access to, debt and equity capital and, thus, have an adverse effect on our operations and financial results. Many of our portfolio companies and the companies we may invest in prospectively are also susceptible to these unstable economic conditions, which may affect the ability of one or more of our portfolio companies to repay our loans or engage in a liquidity event, such as a sale, recapitalization or initial public offering. These unstable economic conditions could also disproportionately impact some of the industries in which we invest, causing us to be more vulnerable to losses in our portfolio, which could cause the number of non-performing assets to increase and the fair value of our portfolio to decrease. The unstable economic conditions may also decrease the value of collateral securing some of our loans as well as the value of our equity investments, which would decrease our ability to borrow under our line of credit or raise equity capital, thereby further reducing our ability to make new investments. In November 2011, we completed an offering of 1.5 million shares of 7.125% Series 2016 Term Preferred Stock (“Term Preferred Stock”); however, there can be no assurance that we will be able to raise additional equity capital in the near future. See “Management Discussion and Analysis of Financial Condition and Results of Operation – Equity Activity” for additional information on our Term Preferred Stock issuance.
The unstable economic conditions have affected the availability of credit generally. We do not know when market conditions will stabilize, if adverse conditions will intensify or the full extent to which the disruptions will continue to affect us. Also, it is possible that persistent instability of the financial markets could have other unforeseen material effects on our business. The downgrade of the United States credit rating and the ongoing economic crisis in Europe could negatively impact our liquidity, financial condition and earnings. Recent U.S. debt ceiling and budget deficit concerns, together with signs of deteriorating sovereign debt conditions in Europe, have increased the possibility of additional credit-rating downgrades and economic slowdowns. Although U.S. lawmakers passed legislation to raise the federal debt ceiling, Standard & Poor’s Ratings Services lowered its long-term sovereign credit rating on the U.S. from “AAA” to “AA+” in August 2011. The impact of this or any further downgrades to the U.S. government’s sovereign credit rating, or its perceived creditworthiness, and the impact of the current crisis in Europe with respect to the ability of certain European Union countries to continue to service their sovereign debt obligations is inherently unpredictable and could adversely affect the U.S. and global financial markets and economic conditions. There can be no assurance that governmental or other measures to aid economic recovery will be effective. These fairly recent developments, and the government’s credit concerns in general, could cause interest rates and borrowing costs to rise, which may negatively impact our ability to access the debt markets on favorable terms. Continued adverse economic conditions could have a material adverse effect on our business, financial condition and results of operations.

19
We may experience fluctuations in our quarterly and annual results based on the impact of inflation in the United States. The majority of our portfolio companies are in industries that are directly impacted by inflation, such as consumer goods and services and manufacturing. Our portfolio companies may not be able to pass on to customers increases in their costs of operations which could greatly affect their operating results, impacting their ability to repay our loans. In addition, any projected future decreases in our portfolio companies’ operating results due to inflation could adversely impact the fair value of those investments. Any decreases in the fair value of our investments could result in future unrealized losses and therefore reduce our net assets resulting from operations. Risks Related to Our External Management We are dependent upon our key management personnel and the key management personnel of the Adviser, particularly David Gladstone, George Stelljes III and Terry Lee Brubaker, and on the continued operations of the Adviser, for our future success.
We have no employees. Our chief executive officer, president and chief investment officer, chief operating officer, chief financial officer and treasurer, and the employees of the Adviser, do not spend all of their time managing our activities and our investment portfolio. We are particularly dependent upon David Gladstone, George Stelljes III and Terry Lee Brubaker in this regard. Our executive officers and the employees of the Adviser allocate some, and in some cases a material portion, of their time to businesses and activities that are not related to our business. We have no separate facilities and are completely reliant on the Adviser, which has significant discretion as to the implementation and execution of our business strategies and risk management practices. We are subject to the risk of discontinuation of the Adviser’s operations or termination of the Advisory Agreement and the risk that, upon such event, no suitable replacement will be found. We believe that our success depends to a significant extent upon the Adviser and that discontinuation of its operations could have a material adverse effect on our ability to achieve our investment objectives.
Our incentive fee may induce the Adviser to make certain investments, including speculative investments.
The management compensation structure that has been implemented under the Advisory Agreement may cause the Adviser to invest in high-risk investments or take other risks. In addition to its management fee, the Adviser is entitled under the Advisory Agreement to receive incentive compensation based in part upon our achievement of specified levels of income. In evaluating investments and other management strategies, the opportunity to earn incentive compensation based on net income may lead the Adviser to place undue emphasis on the maximization of net income at the expense of other criteria, such as preservation of capital, maintaining sufficient liquidity, or management of credit risk or market risk, in order to achieve higher incentive compensation. Investments with higher yield potential are generally riskier or more speculative. This could result in increased risk to the value of our investment portfolio.
We may be obligated to pay the Adviser incentive compensation even if we incur a loss.
The Advisory Agreement entitles the Adviser to incentive compensation for each fiscal quarter in an amount equal to a percentage of the excess of our investment income for that quarter (before deducting incentive compensation, net operating losses and certain other items) above a threshold return for that quarter. When calculating our incentive compensation, our pre-incentive fee net investment income excludes realized and unrealized capital losses that we may incur in the fiscal quarter, even if such capital losses result in a net loss on our statement of operations for that quarter. Thus, we may be required to pay the Adviser incentive compensation for a fiscal quarter even if there is a decline in the value of our portfolio or we incur a net loss for that quarter. For additional information on incentive compensation under the Advisory Agreement with the Adviser, see “Business — Investment Advisory and Management Agreements.”
The Adviser’s failure to identify and invest in securities that meet our investment criteria or perform its responsibilities under the Advisory Agreement may adversely affect our ability for future growth.
Our ability to achieve our investment objectives will depend on our ability to grow, which in turn will depend on the Adviser’s ability to identify and invest in securities that meet our investment criteria. Accomplishing this result on a cost-effective basis will be largely a function of the Adviser’s structuring of the investment process, its ability to provide competent and efficient services to us, and our access to financing on acceptable terms. The senior management team of the Adviser has substantial responsibilities under the Advisory Agreement. In order to grow, the Adviser will need to hire, train,
20
supervise, and manage new employees successfully. Any failure to manage our future growth effectively could have a material adverse effect on our business, financial condition, and results of operations.
There are significant potential conflicts of interest which could impact our investment returns.
Our executive officers and directors, and the officers and directors of the Adviser, serve or may serve as officers, directors, or principals of entities that operate in the same or a related line of business as we do or of investment funds managed by our affiliates. Accordingly, they may have obligations to investors in those entities, the fulfillment of which might not be in the best interests of us or our stockholders. For example, Mr. Gladstone, our chairman and chief executive officer, is the chairman of the board and chief executive officer of the Adviser, Gladstone Investment and Gladstone Commercial and the chairman, chief executive officer and sole stockholder of Gladstone Land. In addition, Mr. Brubaker, our vice chairman and chief operating officer is the vice chairman and chief operating officer of the Adviser and Gladstone Land and co-vice chairman and chief operating officer of Gladstone Investment and Gladstone Commercial. Mr. Stelljes, our president and chief investment officer, is also the president and chief investment officer of the Adviser and Gladstone Land and co-vice chairman and chief investment officer of Gladstone Investment and Gladstone Commercial. Moreover, the Adviser may establish or sponsor other investment vehicles which from time to time may have potentially overlapping investment objectives with ours and accordingly may invest in, whether principally or secondarily, asset classes we target. While the Adviser generally has broad authority to make investments on behalf of the investment vehicles that it advises, the Adviser has adopted investment allocation procedures to address these potential conflicts and intends to direct investment opportunities to the Gladstone affiliate with the investment strategy that most closely fits the investment opportunity. Nevertheless, the management of the Adviser may face conflicts in the allocation of investment opportunities to other entities managed by the Adviser. As a result, it is possible that we may not be given the opportunity to participate in certain investments made by other funds managed by the Adviser. On October 10, 2012, our Board of Directors approved a revision of our investment objectives and strategies, effective on or about January 1, 2013, which may enhance the potential for conflicts in the allocation of investment opportunities to us and other entities managed by the Adviser.
In certain circumstances, we may make investments in a portfolio company in which one of our affiliates has or will have an investment, subject to satisfaction of any regulatory restrictions and, where required, to the prior approval of our Board of Directors. As of September 30, 2012, our Board of Directors has approved the following types of co-investment transactions:
� Our affiliate, Gladstone Commercial, may, under certain circumstances, lease property to portfolio companies that we do not control. We may pursue such transactions only if (i) the portfolio company is not controlled by us or any of our affiliates, (ii) the portfolio company satisfies the tenant underwriting criteria of Gladstone Commercial, and (iii) the transaction is approved by a majority of our independent directors and a majority of the independent directors of Gladstone Commercial. We expect that any such negotiations between Gladstone Commercial and our portfolio companies would result in lease terms consistent with the terms that the portfolio companies would be likely to receive were they not portfolio companies of ours.
� We may invest simultaneously with our affiliate Gladstone Investment in senior syndicated loans whereby neither we nor any affiliate has the ability to dictate the terms of the loans.
� Additionally, pursuant to an exemptive order granted by the SEC in July 2012, under certain circumstances, we may co-invest with Gladstone Investment and any future BDC or closed-end management investment company that is advised by the Adviser (or sub-advised by the Adviser if it controls the fund) or any combination of the foregoing subject to the conditions included therein.
Certain of our officers, who are also officers of the Adviser, may from time to time serve as directors of certain of our portfolio companies. If an officer serves in such capacity with one of our portfolio companies, such officer will owe fiduciary duties to all stockholders of the portfolio company, which duties may from time to time conflict with the interests of our stockholders.
In the course of our investing activities, we will pay management and incentive fees to the Adviser and will reimburse the Administrator for certain expenses it incurs. As a result, investors in our common stock will invest on a “gross” basis and receive distributions on a “net” basis after expenses, resulting in, among other things, a lower rate of return than one might achieve through our investors themselves making direct investments. As a result of this arrangement, there may be times when the management team of the Adviser has interests that differ from those of our stockholders, giving rise to a conflict. In addition, as a BDC, we make available significant managerial assistance to our portfolio companies and provide other

21
services to such portfolio companies. Although, neither we nor the Adviser currently receives fees in connection with managerial assistance, the Adviser and Gladstone Securities have, at various times, provided other services to certain of our portfolio companies and received fees for these other services.
The Adviser is not obligated to provide a waiver of the base management fee, which could negatively impact our earnings and our ability to maintain our current level of distributions to our common stockholders.
The Advisory Agreement provides for a base management fee based on our gross assets. Since our 2007 fiscal year, our Board of Directors has accepted on a quarterly basis voluntary, unconditional and irrevocable waivers to reduce the annual 2.0% base management fee on senior syndicated loan participations to 0.5% to the extent that proceeds resulting from borrowings were used to purchase such syndicated loan participations, and any waived fees may not be recouped by the Adviser in the future. However, the Adviser is not required to issue these or other waivers of fees under the Advisory Agreement, and to the extent our investment portfolio grows in the future, we expect these fees will increase. If the Adviser does not issue these waivers in future quarters, it could negatively impact our earnings and may compromise our ability to maintain our current level of distributions to our common stockholders, which could have a material adverse impact on the price of our common stock.
Our business model is dependent upon developing and sustaining strong referral relationships with investment bankers, business brokers and other intermediaries.
We are dependent upon informal relationships with investment bankers, business brokers and traditional lending institutions to provide us with deal flow. If we fail to maintain our relationship with such funds or institutions, or if we fail to establish strong referral relationships with other funds, we will not be able to grow our portfolio of loans and fully execute our business plan.
Risks Related to Our External Financing
In addition to regulatory limitations on our ability to raise capital, our credit facility contains various covenants which, if not complied with, could accelerate our repayment obligations under the facility, thereby materially and adversely affecting our liquidity, financial condition, results of operations and ability to pay distributions. We will have a continuing need for capital to finance our loans. As of September 30, 2012, we had $58.8 million in borrowings outstanding under our fourth amended and restated credit agreement, which provides for maximum borrowings of $137.0 million (the “Credit Facility”). Our Credit Facility permits us to fund additional loans and investments as long as we are within the conditions set forth in the credit agreement. Pursuant to the terms of our Credit Facility, we are subject to certain limitations on the type of loan investments we make, including restrictions on geographic concentrations, sector concentrations, loan size, payment frequency and status, average life and lien property. The credit agreement also requires us to comply with other financial and operational covenants, which require us to, among other things, maintain certain financial ratios, including asset and interest coverage and a minimum net worth and a minimum number of obligors required in the borrowing base of the credit agreement. As of September 30, 2012, we were in compliance with these covenants; however, our continued compliance depends on many factors, some of which are beyond our control. Current market conditions have forced us to write down the value of a portion of our assets, as required by the 1940 Act and fair value accounting rules. These are not realized losses, but constitute adjustments in asset values for purposes of financial reporting and for collateral value for our Credit Facility. As assets are marked down in value, the amount we can borrow on our Credit Facility decreases. As of September 30, 2012, our net assets were $188.6 million, down from $213.7 million as of September 30, 2011, primarily a result of unrealized depreciation over the preceding twelve months. Additionally, under our Credit Facility, we are required to maintain a minimum net worth (which includes the value of our Term Preferred Stock) of $190.0 million plus 50.0% of all equity and subordinated debt raised after January 19, 2012. At September 30, 2012, we had a minimum net worth of $227.1 million. Given the continued uncertainty in the capital markets, the cumulative unrealized depreciation in our portfolio may increase in future periods and threaten our ability to comply with the minimum net worth covenant and other covenants under our Credit Facility. Under our Credit Facility, we are also required to maintain our status as a BDC under the 1940 Act and as a RIC under the Code. There are no assurances that we will continue to comply with these covenants. Our failure to satisfy these covenants could result in foreclosure by our lenders, which would accelerate our repayment obligations under the facility and thereby have a material adverse effect on our business, liquidity, financial condition, results of operations and ability to pay distributions to our stockholders.

22
Any inability to renew, extend or replace our line of credit on terms favorable to us, or at all, could adversely impact our liquidity and ability to fund new investments or maintain distributions to our stockholders.
Under certain circumstances, our Credit Facility may be expanded to a maximum of $237.0 million through the addition of other committed lenders to the facility. If additional lenders are unwilling to join the facility on its terms, we will be unable to expand the facility and may have limited availability to finance new investments under our Credit Facility in the future. If not renewed or extended by January 19, 2015 (the “Maturity Date”), all principal and interest will be due and payable on or before January 19, 2016 (one year after the Maturity Date). There can be no guarantee that we will be able to renew, extend or replace the Credit Facility upon its maturity in 2015 on terms that are favorable to us, if at all. Our ability to expand the Credit Facility, and to obtain replacement financing at the time of its maturity, will be constrained by then-current economic conditions affecting the credit markets. In the event that we are not able to expand the Credit Facility, or to renew, extend or refinance the Credit Facility at the time of its maturity, this could have a material adverse effect on our liquidity and ability to fund new investments, our ability to make distributions to our stockholders and our ability to qualify as a RIC under the Code.
If we are unable to secure replacement financing, we may be forced to sell certain assets on disadvantageous terms, which may result in realized losses, and such realized losses could materially exceed the amount of any unrealized depreciation on these assets as of our most recent balance sheet date, which would have a material adverse effect on our results of operations. Such circumstances would also increase the likelihood that we would be required to redeem some or all of our outstanding Term Preferred Stock, which would potentially require us to sell more assets. In addition to selling assets, or as an alternative, we may issue equity in order to repay amounts outstanding under our Credit Facility. Based on the recent trading prices of our stock, such an equity offering may have a substantial dilutive impact on our existing stockholders’ interest in our earnings, assets and voting percentage. If we are able to renew, extend or refinance our Credit Facility prior to maturity, any renewal, extension or refinancing of the Credit Facility may potentially result in significantly higher interest rates and related charges and may impose significant restrictions on the use of borrowed funds to fund investments or maintain distributions to stockholders. Our business plan is dependent upon external financing, which is constrained by the limitations of the 1940 Act.
Although we completed an offering of Term Preferred Stock in November 2011, there can be no assurance that we will be able to raise capital through issuing equity in the near future. Our business requires a substantial amount of cash to operate and grow. We may acquire such additional capital from the following sources:
• Senior Securities. We may issue debt securities, other evidences of indebtedness (including borrowings under our Credit Facility), senior securities representing indebtedness and senior securities that are stock up to the maximum amount permitted by the 1940 Act. The 1940 Act currently permits us, as a BDC, to issue senior securities representing indebtedness and senior securities which are stock (such as our Term Preferred Stock), which we refer to collectively as Senior Securities, in amounts such that our asset coverage, as defined in Section 18(h) of the 1940 Act, is at least 200% immediately after each issuance of Senior Securities. As a result of incurring indebtedness (in whatever form), we will be exposed to the risks associated with leverage. Although borrowing money for investments increases the potential for gain, it also increases the risk of a loss. A decrease in the value of our investments will have a greater impact on the value of our common stock to the extent that we have borrowed money to make investments. There is a possibility that the costs of borrowing could exceed the income we receive on the investments we make with such borrowed funds. In addition, our ability to pay distributions, issue Senior Securities or repurchase shares of our common stock would be restricted if the asset coverage on our Senior Securities is not at least 200%. If the aggregate value of our assets declines, we might be unable to satisfy that 200% requirement. To satisfy the 200% asset coverage requirement in the event that we are seeking to pay a distribution, we might either have to (i) liquidate a portion of our loan portfolio to repay a portion of our indebtedness or (ii) issue common stock. This may occur at a time when a sale of a portfolio asset may be disadvantageous, or when we have limited access to capital markets on agreeable terms. In addition, any amounts that we use to service our indebtedness or for offering expenses will not be available for distributions to stockholders. Furthermore, if we have to issue common stock at below net asset value (“NAV”) per common share, any non-participating shareholders will be subject to dilution, as described below. Pursuant to Section 61(a)(2) of the 1940 Act, we are permitted, under specified conditions, to issue multiple classes of senior securities representing indebtedness. However, pursuant to Section 18(c) of the 1940 Act, we are permitted to issue only one class of senior securities that is stock.
• Common and Convertible Preferred Stock. Because we are constrained in our ability to issue debt or senior securities for the reasons given above, we are dependent on the issuance of equity as a financing source. If we raise additional funds
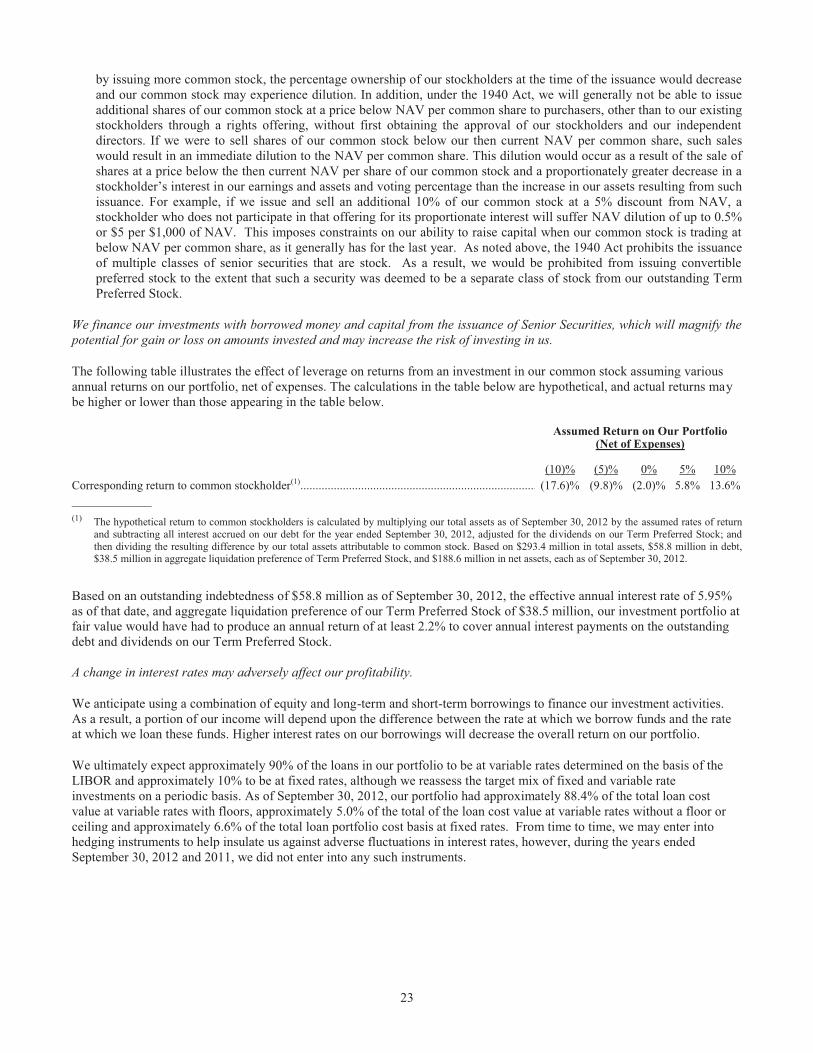
23
by issuing more common stock, the percentage ownership of our stockholders at the time of the issuance would decrease and our common stock may experience dilution. In addition, under the 1940 Act, we will generally not be able to issue additional shares of our common stock at a price below NAV per common share to purchasers, other than to our existing stockholders through a rights offering, without first obtaining the approval of our stockholders and our independent directors. If we were to sell shares of our common stock below our then current NAV per common share, such sales would result in an immediate dilution to the NAV per common share. This dilution would occur as a result of the sale of shares at a price below the then current NAV per share of our common stock and a proportionately greater decrease in a stockholder’s interest in our earnings and assets and voting percentage than the increase in our assets resulting from such issuance. For example, if we issue and sell an additional 10% of our common stock at a 5% discount from NAV, a stockholder who does not participate in that offering for its proportionate interest will suffer NAV dilution of up to 0.5% or $5 per $1,000 of NAV. This imposes constraints on our ability to raise capital when our common stock is trading at below NAV per common share, as it generally has for the last year. As noted above, the 1940 Act prohibits the issuance of multiple classes of senior securities that are stock. As a result, we would be prohibited from issuing convertible preferred stock to the extent that such a security was deemed to be a separate class of stock from our outstanding Term Preferred Stock.
We finance our investments with borrowed money and capital from the issuance of Senior Securities, which will magnify the potential for gain or loss on amounts invested and may increase the risk of investing in us.
The following table illustrates the effect of leverage on returns from an investment in our common stock assuming various annual returns on our portfolio, net of expenses. The calculations in the table below are hypothetical, and actual returns may be higher or lower than those appearing in the table below.
Assumed Return on Our Portfolio (Net of Expenses)
(10)%
(5)%
0%
5%
10%
Corresponding return to common stockholder(1) .............................................................................. (17.6)% (9.8)% (2.0)% 5.8% 13.6% ____________ (1) The hypothetical return to common stockholders is calculated by multiplying our total assets as of September 30, 2012 by the assumed rates of return
and subtracting all interest accrued on our debt for the year ended September 30, 2012, adjusted for the dividends on our Term Preferred Stock; and then dividing the resulting difference by our total assets attributable to common stock. Based on $293.4 million in total assets, $58.8 million in debt, $38.5 million in aggregate liquidation preference of Term Preferred Stock, and $188.6 million in net assets, each as of September 30, 2012.
Based on an outstanding indebtedness of $58.8 million as of September 30, 2012, the effective annual interest rate of 5.95% as of that date, and aggregate liquidation preference of our Term Preferred Stock of $38.5 million, our investment portfolio at fair value would have had to produce an annual return of at least 2.2% to cover annual interest payments on the outstanding debt and dividends on our Term Preferred Stock. A change in interest rates may adversely affect our profitability.
We anticipate using a combination of equity and long-term and short-term borrowings to finance our investment activities. As a result, a portion of our income will depend upon the difference between the rate at which we borrow funds and the rate at which we loan these funds. Higher interest rates on our borrowings will decrease the overall return on our portfolio.
We ultimately expect approximately 90% of the loans in our portfolio to be at variable rates determined on the basis of the LIBOR and approximately 10% to be at fixed rates, although we reassess the target mix of fixed and variable rate investments on a periodic basis. As of September 30, 2012, our portfolio had approximately 88.4% of the total loan cost value at variable rates with floors, approximately 5.0% of the total of the loan cost value at variable rates without a floor or ceiling and approximately 6.6% of the total loan portfolio cost basis at fixed rates. From time to time, we may enter into hedging instruments to help insulate us against adverse fluctuations in interest rates, however, during the years ended September 30, 2012 and 2011, we did not enter into any such instruments.
24
Risks Related to Our Investments We operate in a highly competitive market for investment opportunities.
A large number of entities compete with us and make the types of investments that we seek to make in small and mid-sized companies. We compete with public and private buyout funds, commercial and investment banks, commercial financing companies, and, to the extent that they provide an alternative form of financing, hedge funds. Many of our competitors are substantially larger and have considerably greater financial, technical and marketing resources than we do. For example, some competitors may have a lower cost of funds and access to funding sources that are not available to us. In addition, some of our competitors may have higher risk tolerances or different risk assessments, which would allow them to consider a wider variety of investments and establish more relationships than us. Furthermore, many of our competitors are not subject to the regulatory restrictions that the 1940 Act imposes on us as a BDC. The competitive pressures we face could have a material adverse effect on our business, financial condition and results of operations. Also, as a result of this competition, we may not be able to take advantage of attractive investment opportunities from time to time and we can offer no assurance that we will be able to identify and make investments that are consistent with our investment objective. We do not seek to compete based on the interest rates we offer, and we believe that some of our competitors may make loans with interest rates that will be comparable to or lower than the rates we offer. We may lose investment opportunities if we do not match our competitors’ pricing, terms, and structure. However, if we match our competitors’ pricing, terms, and structure, we may experience decreased net interest income and increased risk of credit loss.
Our investments in small and medium-sized portfolio companies are extremely risky and could cause you to lose all or a part of your investment.
Investments in small and medium-sized portfolio companies are subject to a number of significant risks including the following:
� Small and medium-sized businesses are likely to have greater exposure to economic downturns than larger businesses. Our portfolio companies may have fewer resources than larger businesses, and thus the recent recession, and any further economic downturns or recessions, are more likely to have a material adverse effect on them. If one of our portfolio companies is adversely impacted by a recession, its ability to repay our loan or engage in a liquidity event, such as a sale, recapitalization or initial public offering would be diminished.
� Small and medium-sized businesses may have limited financial resources and may not be able to repay the loans we make to them. Our strategy includes providing financing to portfolio companies that typically do not have readily available access to financing. While we believe that this provides an attractive opportunity for us to generate profits, this may make it difficult for the portfolio companies to repay their loans to us upon maturity. A borrower’s ability to repay its loan may be adversely affected by numerous factors, including the failure to meet its business plan, a downturn in its industry, or negative economic conditions. A deterioration in a borrower’s financial condition and prospects usually will be accompanied by a deterioration in the value of any collateral and a reduction in the likelihood of us realizing on any guaranties we may have obtained from the borrower’s management. As of September 30, 2012, six portfolio companies were either fully or partially on non-accrual status with an aggregate debt cost basis of approximately $61.1 million, or 17.3% of the cost basis of all debt investments in our portfolio. While we are working with the portfolio companies to improve their profitability and cash flows, there can be no assurance that our efforts will prove successful. Although we will sometimes seek to be the senior, secured lender to a borrower, in most of our loans we expect to be subordinated to a senior lender, and our interest in any collateral would, accordingly, likely be subordinate to another lender’s security interest.
� Small and medium-sized businesses typically have narrower product lines and smaller market shares than large businesses. Because our target portfolio companies are smaller businesses, they will tend to be more vulnerable to competitors’ actions and market conditions, as well as general economic downturns. In addition, our portfolio companies may face intense competition, including competition from companies with greater financial resources, more extensive development, manufacturing, marketing, and other capabilities and a larger number of qualified managerial, and technical personnel.
� There is generally little or no publicly available information about these businesses. Because we seek to invest in privately owned businesses, there is generally little or no publicly available operating and financial information about our potential portfolio companies. As a result, we rely on our officers, the Adviser and its employees, Gladstone Securities
25
and consultants to perform due diligence investigations of these portfolio companies, their operations, and their prospects. We may not learn all of the material information we need to know regarding these businesses through our investigations.
� Small and medium-sized businesses generally have less predictable operating results. We expect that our portfolio companies may have significant variations in their operating results, may from time to time be parties to litigation, may be engaged in rapidly changing businesses with products subject to a substantial risk of obsolescence, may require substantial additional capital to support their operations, to finance expansion or to maintain their competitive position, may otherwise have a weak financial position, or may be adversely affected by changes in the business cycle. Our portfolio companies may not meet net income, cash flow, and other coverage tests typically imposed by their senior lenders. A borrower’s failure to satisfy financial or operating covenants imposed by senior lenders could lead to defaults and, potentially, foreclosure on its senior credit facility, which could additionally trigger cross-defaults in other agreements. If this were to occur, it is possible that the borrower’s ability to repay our loan would be jeopardized.
� Small and medium-sized businesses are more likely to be dependent on one or two persons. Typically, the success of a small or medium-sized business also depends on the management talents and efforts of one or two persons or a small group of persons. The death, disability, or resignation of one or more of these persons could have a material adverse impact on our borrower and, in turn, on us.
� Small and medium-sized businesses may have limited operating histories. While we intend to target stable companies with proven track records, we may make loans to new companies that meet our other investment criteria. Portfolio companies with limited operating histories will be exposed to all of the operating risks that new businesses face and may be particularly susceptible to, among other risks, market downturns, competitive pressures and the departure of key executive officers.
� Debt securities of small and medium-sized private companies typically are not rated by a credit rating agency. Typically a small or medium-sized private business cannot or will not expend the resources to have their debt securities rated by a credit rating agency. We expect that most, if not all, of the debt securities we acquire will be unrated. Investors should assume that these loans would be at rates below what is today considered “investment grade” quality. Investments rated below investment grade are often referred to as high yield securities or junk bonds and may be considered high risk as compared to investment-grade debt instruments.
Because the loans we make and equity securities we receive when we make loans are not publicly-traded, there is uncertainty regarding the value of our privately held securities that could adversely affect our determination of our net asset value.
Our portfolio investments are, and we expect will continue to be, in the form of securities that are not publicly-traded. The fair value of securities and other investments that are not publicly-traded may not be readily determinable. Our Board of Directors has established an investment valuation policy and consistently applied valuation procedures used to determine the fair value of these securities quarterly. These procedures for the determination of value of many of our debt securities rely on the opinions of value submitted to us by SPSE or the use of internally developed discounted cash flow (“DCF”) methodologies or indicative bid prices (“IBP”) offered by the respective originating syndication agent’s trading desk, or secondary desk, specifically for our syndicated loans, or internal methodologies based on the total enterprise value (“TEV”) of the issuer used for certain of our equity investments. SPSE will only evaluate the debt portion of our investments for which we specifically request evaluation, and SPSE may decline to make requested evaluations for any reason in its sole discretion. However, to date, SPSE has accepted each of our requests for evaluation.
Our use of these fair value methods is inherently subjective and is based on estimates and assumptions of each security. In the event that we are required to sell a security, we may ultimately sell for an amount materially less than the estimated fair value calculated by SPSE, or utilizing the TEV, IBP or the DCF methodology.
Our procedures also include provisions whereby the Adviser will establish the fair value of any equity securities we may hold where SPSE or third-party agent banks are unable to provide evaluations. The types of factors that may be considered in determining the fair value of our debt and equity securities include some or all of the following:
� the nature and realizable value of any collateral; � the portfolio company’s earnings and cash flows and its ability to make payments on its obligations; � the markets in which the portfolio company does business; � the comparison to publicly-traded companies; and � discounted cash flow and other relevant factors.

26
Because such valuations, particularly valuations of private securities and private companies, are not susceptible to precise determination, may fluctuate over short periods of time, and may be based on estimates, our determinations of fair value may differ from the values that might have actually resulted had a readily available market for these securities been available.
A portion of our assets are, and will continue to be, comprised of equity securities that are valued based on internal assessment using our own valuation methods approved by our Board of Directors, without the input of SPSE or any other third-party evaluator. We believe that our equity valuation methods reflect those regularly used as standards by other professionals in our industry who value equity securities. However, determination of fair value for securities that are not publicly-traded, whether or not we use the recommendations of an independent third-party evaluator, necessarily involves the exercise of subjective judgment. Our NAV could be adversely affected if our determinations regarding the fair value of our investments were materially higher than the values that we ultimately realize upon the disposal of such securities. The lack of liquidity of our privately held investments may adversely affect our business.
We will generally make investments in private companies whose securities are not traded in any public market. Substantially all of the investments we presently hold and the investments we expect to acquire in the future are, and will be, subject to legal and other restrictions on resale and will otherwise be less liquid than publicly-traded securities. The illiquidity of our investments may make it difficult for us to quickly obtain cash equal to the value at which we record our investments if the need arises. This could cause us to miss important investment opportunities. In addition, if we are required to liquidate all or a portion of our portfolio quickly, we may record substantial realized losses upon liquidation. We may also face other restrictions on our ability to liquidate an investment in a portfolio company to the extent that we, the Adviser, or our respective officers, employees or affiliates have material non-public information regarding such portfolio company.
Due to the uncertainty inherent in valuing these securities, our determinations of fair value may differ materially from the values that could be obtained if a ready market for these securities existed. Our NAV could be materially affected if our determinations regarding the fair value of our investments are materially different from the values that we ultimately realize upon our disposal of such securities.
When we are a debt or minority equity investor in a portfolio company, which we expect will generally be the case, we may not be in a position to control the entity, and its management may make decisions that could decrease the value of our investment.
We anticipate that most of our investments will continue to be either debt or minority equity investments in our portfolio companies. Therefore, we are and will remain subject to risk that a portfolio company may make business decisions with which we disagree, and the shareholders and management of such company may take risks or otherwise act in ways that do not serve our best interests. As a result, a portfolio company may make decisions that could decrease the value of our portfolio holdings.
In addition, we will generally not be in a position to control any portfolio company by investing in its debt securities. This is particularly true when we invest in syndicated loans, which are loans made by a larger group of investors whose investment objectives of the other lenders may not be completely aligned with ours. As of September 30, 2012, syndicated loans made up approximately 21.3% of our portfolio at cost, or $77.8 million. We therefore are subject to the risk that other lenders in these investments may make decisions that could decrease the value of our portfolio holdings.
We generally invest in transactions involving acquisitions, buyouts and recapitalizations of companies, which will subject us to the risks associated with change in control transactions.
Our strategy, in part, includes making debt and equity investments in companies in connection with acquisitions, buyouts and recapitalizations, which subjects us to the risks associated with change in control transactions. Change in control transactions often present a number of uncertainties. Companies undergoing change in control transactions often face challenges retaining key employees and maintaining relationships with customers and suppliers. While we hope to avoid many of these difficulties by participating in transactions where the management team is retained and by conducting thorough due diligence in advance of our decision to invest, if our portfolio companies experience one or more of these problems, we may not realize the value that we expect in connection with our investments, which would likely harm our operating results and financial condition.
27
Our portfolio companies may incur debt that ranks equally with, or senior to, our investments in such companies. We invest primarily in debt securities issued by our portfolio companies. In some cases portfolio companies will be permitted to have other debt that ranks equally with, or senior to, the debt securities in which we invest. By their terms, such debt instruments may provide that the holders thereof are entitled to receive payment of interest and principal on or before the dates on which we are entitled to receive payments in respect of the debt securities in which we invest. Also, in the event of insolvency, liquidation, dissolution, reorganization, or bankruptcy of a portfolio company, holders of debt instruments ranking senior to our investment in that portfolio company would typically be entitled to receive payment in full before we receive any distribution in respect of our investment. After repaying such senior creditors, such portfolio company may not have any remaining assets to use for repaying its obligation to us. In the case of debt ranking equally with debt securities in which we invest, we would have to share on an equal basis any distributions with other creditors holding such debt in the event of an insolvency, liquidation, dissolution, reorganization, or bankruptcy of a portfolio company.
Prepayments of our investments by our portfolio companies could adversely impact our results of operations and reduce our return on equity.
In addition to risks associated with delays in investing our capital, we are also subject to the risk that investments we make in our portfolio companies may be repaid prior to maturity. For the year ended September 30, 2012, we received principal payments of $60.2 million, of which $47.5 million resulted from ten portfolio companies who paid off early at par. We will first use any proceeds from prepayments to repay any borrowings outstanding on our Credit Facility. In the event that funds remain after repayment of our outstanding borrowings, then we will generally reinvest these proceeds in government securities, pending their future investment in new debt and/or equity securities. These government securities will typically have substantially lower yields than the debt securities being prepaid and we could experience significant delays in reinvesting these amounts. As a result, our results of operations could be materially adversely affected if one or more of our portfolio companies elect to prepay amounts owed to us. Additionally, prepayments could negatively impact our return on equity, which could result in a decline in the market price of our common stock.
Higher taxation of our portfolio companies may impact our quarterly and annual operating results. The recession’s adverse effect on federal, state, and municipality revenues may induce these government entities to raise various taxes to make up for lost revenues. Additional taxation may have an adverse affect on our portfolio companies’ earnings and reduce their ability to repay our loans to them, thus affecting our quarterly and annual operating results. Our portfolio is concentrated in a limited number of companies and industries, which subjects us to an increased risk of significant loss if any one of these companies does not repay us or if the industries experience downturns.
As of September 30, 2012, we had investments in 50 portfolio companies, of which there were five investments that comprised approximately $91.8 million or 33.5% of our total investment portfolio, at fair value. A consequence of a concentration in a limited number of investments is that the aggregate returns we realize may be substantially adversely affected by the unfavorable performance of a small number of such investments or a substantial write-down of any one investment. Beyond our regulatory and income tax diversification requirements, we do not have fixed guidelines for industry concentration and our investments could potentially be concentrated in relatively few industries. In addition, while we do not intend to invest 25.0% or more of our total assets in a particular industry or group of industries at the time of investment, it is possible that as the values of our portfolio companies change, one industry or a group of industries may comprise in excess of 25.0% of the value of our total assets. As a result, a downturn in an industry in which we have invested a significant portion of our total assets could have a materially adverse effect on us. As of September 30, 2012, 15.4% of our total assets at fair value were invested in electronics companies, 12.0% were invested in healthcare, education and childcare companies, and 11.5% were invested in mining, steel, iron and non-precious metal companies. Therefore, we are susceptible to the economic circumstances in these industries, and a downturn in one or more of these industries could have a material adverse effect on our results of operations and financial condition.
Our investments are typically long term and will require several years to realize liquidation events.
Since we generally make five to seven year term loans and hold our loans and related warrants or other equity positions until the loans mature, you should not expect realization events, if any, to occur over the near term. In addition, we expect that any warrants or other equity positions that we receive when we make loans may require several years to appreciate in value and we cannot give any assurance that such appreciation will occur.
28
The disposition of our investments may result in contingent liabilities. Currently, all of our investments involve private securities. In connection with the disposition of an investment in private securities, we may be required to make representations about the business and financial affairs of the underlying portfolio company typical of those made in connection with the sale of a business. We may also be required to indemnify the purchasers of such investment to the extent that any such representations turn out to be inaccurate or with respect to certain potential liabilities. These arrangements may result in contingent liabilities that ultimately yield funding obligations that must be satisfied through our return of certain distributions previously made to us. There may be circumstances where our debt investments could be subordinated to claims of other creditors or we could be subject to lender liability claims. Even though we have structured some of our investments as senior loans, if one of our portfolio companies were to go bankrupt, depending on the facts and circumstances, including the extent to which we actually provided managerial assistance to that portfolio company, a bankruptcy court might re-characterize our debt investments and subordinate all, or a portion, of our claims to that of other creditors. Holders of debt instruments ranking senior to our investments typically would be entitled to receive payment in full before we receive any distributions. After repaying such senior creditors, such portfolio company may not have any remaining assets to use to repay its obligation to us. We may also be subject to lender liability claims for actions taken by us with respect to a borrower’s business or in instances in which we exercised control over the borrower. It is possible that we could become subject to a lender’s liability claim, including as a result of actions taken in rendering significant managerial assistance. Portfolio company litigation could result in additional costs and the diversion of management time and resources. In the course of providing significant managerial assistance to certain of our portfolio companies, our executive officers sometimes serve as directors on the boards of such companies. To the extent that litigation arises out of our investments in these companies, such executive officers may be named as defendants in such litigation, which could result in additional costs and the diversion of management time and resources. We may not realize gains from our equity investments and other yield enhancements.
When we make a subordinated loan, we may receive warrants to purchase stock issued by the borrower or other yield enhancements, such as success fees. Our goal is to ultimately dispose of these equity interests and realize gains upon our disposition of such interests. We expect that, over time, the gains we realize on these warrants and other yield enhancements will offset any losses we experience on loan defaults. However, any warrants we receive may not appreciate in value and, in fact, may decline in value and any other yield enhancements, such as success fees, may not be realized. Accordingly, we may not be able to realize gains from our equity interests or other yield enhancements and any gains we do recognize may not be sufficient to offset losses we experience on our loan portfolio.
Any unrealized depreciation we experience on our investment portfolio may be an indication of future realized losses, which could reduce our income available for distribution.
As a BDC we are required to carry our investments at market value or, if no market value is ascertainable, at fair value as determined in good faith by or under the direction of our Board of Directors. We will record decreases in the market values or fair values of our investments as unrealized depreciation. Since our inception, we have, at times, incurred a cumulative net unrealized depreciation of our portfolio. Any unrealized depreciation in our investment portfolio could result in realized losses in the future and ultimately in reductions of our income available for distribution to stockholders in future periods.
Risks Related to Our Regulation and Structure
We will be subject to corporate-level tax if we are unable to satisfy Code requirements for RIC qualification.
To maintain our qualification as a RIC, we must meet income source, asset diversification, and annual distribution requirements. The annual distribution requirement is satisfied if we distribute at least 90% of our ordinary income and short-term capital gains to our stockholders on an annual basis. Because we use leverage, we are subject to certain asset coverage ratio requirements under the 1940 Act and could, under certain circumstances, be restricted from making distributions necessary to qualify as a RIC. Warrants we receive with respect to debt investments will create “original issue discount,”
29
which we must recognize as ordinary income, increasing the amounts we are required to distribute to maintain RIC status. Because such warrants will not produce distributable cash for us at the same time as we are required to make distributions in respect of the related original issue discount, we will need to use cash from other sources to satisfy such distribution requirements. The asset diversification requirements must be met at the end of each calendar quarter. If we fail to meet these tests, we may need to quickly dispose of certain investments to prevent the loss of RIC status. Since most of our investments will be illiquid, such dispositions, if even possible, may not be made at prices advantageous to us and, in fact, may result in substantial losses. If we fail to qualify as a RIC for any reason and become fully subject to corporate income tax, the resulting corporate taxes could substantially reduce our net assets, the amount of income available for distribution, and the actual amount distributed. Such a failure would have a material adverse effect on us and our shares. For additional information regarding asset coverage ratio and RIC requirements, see “Business—Competitive Advantages—Leverage” and “Business—Material U.S. Federal Income Tax Considerations—Regulated Investment Company Status.”
From time to time, some of our debt investments may include success fees that would generate payments to us if the business is ultimately sold. Because the satisfaction of these success fees, and the ultimate payment of these fees, is uncertain, we do not recognize them as income until we have received payment. We sought and received approval for a change in accounting method from the IRS related to our tax treatment for success fees. As a result, we, in effect, will continue to account for the recognition of income from the success fees upon receipt, or when the amount becomes fixed. Prior to January 1, 2011, we treated the success fee amount as a capital gain for tax characterization purposes. However, beginning January 1, 2011, the success fee amounts are characterized as ordinary income for tax purposes. The approved change in accounting method does not require us to retroactively change the capital gains treatment of the success fees received prior to January 1, 2011. As a result, we will be required to distribute such amounts to our stockholders in order to maintain RIC status for success fees we receive after January 1, 2011.
Changes in laws or regulations governing our operations, or changes in the interpretation thereof, and any failure by us to comply with laws or regulations governing our operations may adversely affect our business.
We and our portfolio companies are subject to regulation by laws at the local, state and federal levels. These laws and regulations, as well as their interpretation, may be changed from time to time. Accordingly, any change in these laws or regulations, or their interpretation, or any failure by us or our portfolio companies to comply with these laws or regulations may adversely affect our business. For additional information regarding the regulations to which we are subject, see “Business—Material U.S. Federal Income Tax Considerations—Regulated Investment Company Status” and “Business— Regulation as a Business Development Company.”
We are subject to restrictions that may discourage a change of control. Certain provisions contained in our articles of incorporation and Maryland law may prohibit or restrict a change of control and adversely impact the price of our shares.
Our Board of Directors is divided into three classes, with the term of the directors in each class expiring every third year. At each annual meeting of stockholders, the successors to the class of directors whose term expires at such meeting will be elected to hold office for a term expiring at the annual meeting of stockholders held in the third year following the year of their election. After election, a director may only be removed by our stockholders for cause. Election of directors for staggered terms with limited rights to remove directors makes it more difficult for a hostile bidder to acquire control of us. The existence of this provision may negatively impact the price of our securities and may discourage third-party bids to acquire our securities. This provision may reduce any premiums paid to stockholders in a change in control transaction.
Certain provisions of Maryland law applicable to us prohibit business combinations with:
• any person who beneficially owns 10% or more of the voting power of our common stock (an “interested stockholder”);
• an affiliate of ours who at any time within the two-year period prior to the date in question was an interested stockholder; or
• an affiliate of an interested stockholder.
These prohibitions last for five years after the most recent date on which the interested stockholder became an interested stockholder. Thereafter, any business combination with the interested stockholder must be recommended by our Board of Directors and approved by the affirmative vote of at least 80% of the votes entitled to be cast by holders of our outstanding shares of common stock and two-thirds of the votes entitled to be cast by holders of our common stock other than shares held

30
by the interested stockholder. These requirements could have the effect of inhibiting a change in control even if a change in control were in our stockholders’ interest. These provisions of Maryland law do not apply, however, to business combinations that are approved or exempted by our Board of Directors prior to the time that someone becomes an interested stockholder.
Our articles of incorporation permit our Board of Directors to issue up to 50.0 million shares of capital stock. In addition, our Board of Directors, without any action by our stockholders, may amend our articles of incorporation from time to time to increase or decrease the aggregate number of shares or the number of shares of any class or series of stock that we have authority to issue. Our Board of Directors may classify or reclassify any unissued common stock or preferred stock and establish the preferences, conversion or other rights, voting powers, restrictions, limitations as to distributions, qualifications and terms or conditions of redemption of any such stock. Thus, our Board of Directors could authorize the issuance of preferred stock with terms and conditions that could have a priority as to distributions and amounts payable upon liquidation over the rights of the holders of our common stock, which it did in connection with our issuance of 1.5 million shares of Term Preferred Stock. Preferred stock, including our Term Preferred Stock, could also have the effect of delaying, deferring or preventing a change in control of us, including an extraordinary transaction (such as a merger, tender offer or sale of all or substantially all of our assets) that might provide a premium price for holders of our common stock. Risks Related to an Investment in Our Common Stock and Our Preferred Stock
We may experience fluctuations in our quarterly and annual operating results.
We may experience fluctuations in our quarterly and annual operating results due to a number of factors, including, among others, variations in our investment income, the interest rates payable on the debt securities we acquire, the default rates on such securities, the level of our expenses, variations in and the timing of the recognition of realized and unrealized gains or losses, the level of our expenses, the degree to which we encounter competition in our markets, and general economic conditions, including the impacts of inflation. The majority of our portfolio companies are in industries that are directly impacted by inflation, such as manufacturing and consumer goods and services. Our portfolio companies may not be able to pass on to customers increases in their costs of production which could greatly affect their operating results, impacting their ability to repay our loans. In addition, any projected future decreases in our portfolio companies’ operating results due to inflation could adversely impact the fair value of those investments. Any decreases in the fair value of our investments could result in future realized and unrealized losses and therefore reduce our net assets resulting from operations. As a result of these factors, results for any period should not be relied upon as being indicative of performance in future periods.
There is a risk that you may not receive distributions.
Our current intention is to distribute at least 90% of our ordinary income and short-term capital gains to our stockholders on a quarterly basis by paying monthly distributions. We expect to retain some or all net realized long-term capital gains by first offsetting them with realized capital losses, and secondly through a “deemed distribution” to supplement our equity capital and support the growth of our portfolio, although our Board of Directors may determine in certain cases to distribute these gains to our common stockholders. In addition, our Credit Facility restricts the amount of distributions we are permitted to make. We cannot assure you that we will achieve investment results or maintain a tax status that will allow or require any specified level of cash distributions. Distributions by us have included and may in the future include a return of capital.
Our Board of Directors declares monthly distributions based on estimates of taxable income for each fiscal year, which may differ, and in the past have differed, from actual results. Because our distributions are based on estimates of taxable income that may differ from actual results, future distributions payable to our stockholders may also include a return of capital. Moreover, to the extent that we distribute amounts that exceed our accumulated earnings and profits, these distributions constitute a return of capital. A return of capital represents a return of a stockholder’s original investment in shares of our stock and should not be confused with a distribution from earnings and profits. Although return of capital distributions may not be taxable, such distributions may increase an investor’s tax liability for capital gains upon the sale of our shares by reducing the investor’s tax basis for such shares. Such returns of capital reduce our asset base and also adversely impact our ability to raise debt capital as a result of the leverage restrictions under the 1940 Act, which could have a material adverse impact on our ability to make new investments.
31
The market price of our shares may fluctuate significantly.
The trading price of our common stock and our preferred stock may fluctuate substantially. The extreme volatility and disruption that have affected the capital and credit markets for over a year have reached unprecedented levels in recent months. We have experienced greater than usual stock price volatility. The market price and marketability of our shares may from time to time be significantly affected by numerous factors, including many over which we have no control and that may not be directly related to us. These factors include, but are not limited to, the following: � general economic trends and other external factors; � price and volume fluctuations in the stock market from time to time, which are often unrelated to the operating
performance of particular companies; � significant volatility in the market price and trading volume of shares of RICs, BDCs or other companies in our
sector, which is not necessarily related to the operating performance of these companies; � changes in regulatory policies or tax guidelines, particularly with respect to RICs or BDCs; � loss of BDC or RIC status; � changes in our earnings or variations in our operating results; � changes in prevailing interest rates; � changes in the value of our portfolio of investments; � any shortfall in our revenue or net income or any increase in losses from levels expected by securities analysts; � departure of key personnel; � operating performance of companies comparable to us; � short-selling pressure with respect to our shares or BDCs generally; � the announcement of proposed, or completed, offerings of our securities, including a rights offering; and � loss of a major funding source. Fluctuations in the trading prices of our shares may adversely affect the liquidity of the trading market for our shares and, if we seek to raise capital through future equity financings, our ability to raise such equity capital.
The issuance of subscription rights to our existing stockholders may dilute the ownership and voting powers of existing stockholders in our common stock, dilute the net asset value of their shares and have a material adverse effect on the trading price of our common stock.
There are significant capital raising constraints applicable to us under the 1940 Act when our stock is trading below its NAV per common share. In the event that we issue subscription rights to our existing stockholders, there is a significant possibility that the rights offering will dilute the ownership interest and voting power of stockholders who do not fully exercise their subscription rights. Stockholders who do not fully exercise their subscription rights should expect that they will, upon completion of the rights offering, own a smaller proportional interest in us than would otherwise be the case if they fully exercised their subscription rights. In addition, because the subscription price of the rights offering is likely to be less than our most recently determined NAV per common share, our common stockholders are likely to experience an immediate dilution of the per common share NAV of their shares as a result of the offer. As a result of these factors, any future rights

32
offerings of our common stock, or our announcement of our intention to conduct a rights offering, could have a material adverse impact on the trading price of our common stock.
Shares of closed-end investment companies frequently trade at a discount from net asset value.
Shares of closed-end investment companies frequently trade at a discount from NAV per common share. Since our inception, our common stock has at times traded above and at times below NAV per common share. During the past year, our common stock has traded consistently, and at times significantly, below NAV per common share. Subsequent to September 30, 2012, our stock has traded at discounts of up to 6.1% of our NAV per common share, which was $8.98 as of September 30, 2012. This characteristic of shares of closed-end investment companies is separate and distinct from the risk that our NAV per common share will decline. As with any stock, the price of our shares will fluctuate with market conditions and other factors. If shares are sold, the price received may be more or less than the original investment. Whether investors will realize gains or losses upon the sale of our shares will not depend directly upon our NAV, but will depend upon the market price of the shares at the time of sale. Since the market price of our shares will be affected by such factors as the relative demand for and supply of the shares in the market, general market and economic conditions and other factors beyond our control, we cannot predict whether the shares will trade at, below or above our net asset value. Under the 1940 Act, we are generally not able to issue additional shares of our common stock at a price below NAV per common share to purchasers other than our existing stockholders through a rights offering without first obtaining the approval of our stockholders and our independent directors. Additionally, at times when our stock is trading below its NAV per common share, our dividend yield may exceed the weighted average returns that we would expect to realize on new investments that would be made with the proceeds from the sale of such stock, making it unlikely that we would determine to issue additional shares in such circumstances. Thus, for as long as our common stock trades below NAV we will be subject to significant constraints on our ability to raise capital through the issuance of common stock. Additionally, an extended period of time in which we are unable to raise capital may restrict our ability to grow and adversely impact our ability to increase or maintain our distributions.
Common stockholders may incur dilution if we sell shares of our common stock in one or more offerings at prices below the then current NAV per share of our common stock.
At our most recent annual meeting on February 16, 2012, our stockholders approved a proposal designed to allow us to sell shares of our common stock below the then current NAV per share of our common stock in one or more offerings for a period of one year, subject to certain conditions (including, but not limited to, that the number of common shares issued and sold pursuant to such authority does not exceed 25% of our then outstanding common stock immediately prior to each such sale). At the upcoming annual stockholders meeting scheduled for February 14, 2013, our stockholders will again be asked to vote in favor of renewing this proposal for another year. During the past year, our common stock has traded consistently, and at times significantly, below NAV. Any decision to sell shares of our common stock below the then current NAV per share of our common stock would be subject to the determination by our Board of Directors that such issuance is in our and our stockholders’ best interests.
If we were to sell shares of our common stock below NAV per common share, such sales would result in an immediate dilution to the NAV per common share. This dilution would occur as a result of the sale of shares at a price below the then current NAV per share of our common stock and a proportionately greater decrease in a stockholder’s interest in our earnings and assets and voting percentage than the increase in our assets resulting from such issuance. The greater the difference between the sale price and the NAV per common share at the time of the offering, the more significant the dilutive impact would be. Because the number of shares of common stock that could be so issued and the timing of any issuance is not currently known, the actual dilutive effect, if any, cannot be predicted. However, if, for example, we sold an additional 10% of our common stock at a 5% discount from NAV, a stockholder who did not participate in that offering for its proportionate interest would suffer NAV dilution of up to 0.5% or $5 per $1,000 of NAV. If we fail to pay dividends on our Term Preferred Stock for two years, the holders of our Term Preferred Stock will be entitled to elect a majority of our directors. The terms of our Term Preferred Stock provide for annual dividends in the amount of $1.7813 per outstanding share of Term Preferred Stock. In accordance with the terms of our Term Preferred Stock, if dividends on the Term Preferred Stock are unpaid in an amount equal to at least two years of dividends, the holders of Term Preferred Stock will be entitled to elect a majority of our Board of Directors.

33
Our Term Preferred Stock magnifies the potential for gain or loss for our holders of common stock and the risks of investing in our common stock in the same way as our borrowings. Preferred stock, which is another form of leverage, has the same risks to our common stockholders as borrowings because the dividends on any preferred stock we issue must be cumulative. Payment of such dividends and repayment of the liquidation preference of such preferred stock must take preference over any dividends or other payments to our common stockholders, and preferred stockholders are less subject to our expenses or losses and are not entitled to participate in any income or appreciation in excess of their stated preference. An investment in Term Preferred Stock with a fixed interest rate bears interest rate risk. Our Term Preferred Stock, in general, pays dividends at a fixed dividend rate of 7.125% per year. Prices of fixed income investments generally vary inversely with changes in market yields. The market yields on securities comparable to the Term Preferred Stock may increase, which would likely result in a decline in the secondary market price of the Term Preferred Stock prior to the term redemption date. This risk may be even more significant in light of the low nature of the currently prevailing market interest rates.
A liquid secondary trading market for our Term Preferred Stock may not develop. Although our Term Preferred Stock is listed for trading on the NASDAQ Global Select Market (“NASDAQ”), such shares are thinly traded, and the market for such shares is relatively illiquid compared to the market for other types of securities, with the spread between the bid and ask prices considerably greater than the spreads of other securities with comparable terms and features. The Term Preferred Stock is not rated. We have not had the Term Preferred Stock rated by any rating agency. Unrated securities usually trade at a discount to similar, rated securities. As a result, there is a risk that the shares of our Term Preferred Stock may trade at a price that is lower than they might otherwise trade if they were rated by a rating agency. The Term Preferred Stock bear a risk of early redemption by us. We may voluntarily redeem some or all of the Term Preferred Stock on or after December 31, 2012, and we may be forced to redeem some or all of the Term Preferred Stock to meet regulatory requirements and the asset coverage requirements of such shares. Any such redemption may occur at a time that is unfavorable to holders of the Term Preferred Stock. We may have an incentive to redeem the Term Preferred Stock voluntarily before the term redemption date if market conditions allow us to issue other preferred stock or debt securities at a rate that is lower than the fixed dividend rate on the Term Preferred Stock. Claims of holders of our Term Preferred Stock are subject to a risk of subordination relative to holders of our debt instruments. Rights of holders of our Term Preferred Stock are subordinated to the rights of holders of our indebtedness. Therefore, dividends, distributions and other payments to holders of Term Preferred Stock in liquidation or otherwise may be subject to prior payments due to the holders of our indebtedness. In addition, under some circumstances the 1940 Act may provide debt holders with voting rights that are superior to the voting rights of holders of the Term Preferred Stock. Holders of our Term Preferred Stock are subject to inflation risk. Inflation is the reduction in the purchasing power of money resulting from the increase in the price of goods and services. Inflation risk is the risk that the inflation-adjusted, or “real,” value of an investment in Term Preferred Stock or the income from that investment will be worth less in the future. As inflation occurs, the real value of the Term Preferred Stock and dividends payable on such shares declines.

34
Holders of our Term Preferred Stock bear reinvestment risk. Given the five-year term and potential for early redemption of the Term Preferred Stock, holders of such shares may face an increased reinvestment risk, which is the risk that the return on an investment purchased with proceeds from the sale or redemption of the Term Preferred Stock may be lower than the return previously obtained from the investment in such shares. Holders of our Term Preferred Stock bear dividend risk. We may be unable to pay dividends on the Term Preferred Stock under some circumstances. The terms of our indebtedness preclude the payment of dividends in respect of equity securities, including the Term Preferred Stock, under certain conditions. There is a risk of delay in our redemption of our Term Preferred Stock, and we may fail to redeem such securities as required by their terms. We will generally make investments in private companies whose securities are not traded in any public market. Substantially all of the investments we presently hold and the investments we expect to acquire in the future are, and will be, subject to legal and other restrictions on resale and will otherwise be less liquid than publicly-traded securities. The illiquidity of our investments may make it difficult for us to obtain cash equal to the value at which we record our investments quickly if a need arises. If we are unable to obtain sufficient liquidity prior to the term redemption date, we may be forced to engage in a partial redemption or to delay a required redemption. If such a partial redemption or delay were to occur, the market price of the Term Preferred Stock might be adversely affected. Other Risks
We could face losses and potential liability if intrusion, viruses or similar disruptions to our technology jeopardize our confidential information, whether through breach of our network security or otherwise.
Maintaining our network security is of critical importance because our systems store highly confidential financial models and portfolio company information. Although we have implemented, and will continue to implement, security measures, our technology platform is and will continue to be vulnerable to intrusion, computer viruses or similar disruptive problems caused by transmission from unauthorized users. The misappropriation of proprietary information could expose us to a risk of loss or litigation.
Terrorist attacks, acts of war, or national disasters may affect any market for our common stock, impact the businesses in which we invest, and harm our business, operating results, and financial conditions.
Terrorist acts, acts of war, or national disasters have created, and continue to create, economic and political uncertainties and have contributed to global economic instability. Future terrorist activities, military or security operations, or national disasters could further weaken the domestic/global economies and create additional uncertainties, which may negatively impact the businesses in which we invest directly or indirectly and, in turn, could have a material adverse impact on our business, operating results, and financial condition. Losses from terrorist attacks and national disasters are generally uninsurable.
ITEM 1B. UNRESOLVED STAFF COMMENTS
None. ITEM 2. PROPERTIES
We do not own any real estate or other physical properties material to our operations. The Adviser is the current leaseholder of all properties in which we operate. We occupy these premises pursuant to our Advisory and Administration Agreements with the Adviser and Administrator, respectively. The Adviser and Administrator are both headquartered in McLean, Virginia, a suburb of Washington, D.C., and the Adviser also has offices in several other states.
35
ITEM 3. LEGAL PROCEEDINGS
We are not currently subject to any material legal proceedings, nor, to our knowledge, is any material legal proceeding threatened against us.
ITEM 4. MINE SAFETY DISCLOSURES
Not applicable.
PART II
ITEM 5. MARKET FOR REGISTRANT’S COMMON EQUITY, RELATED STOCKHOLDER MATTERS AND ISSUER PURCHASES OF EQUITY SECURITIES
Our common stock is traded on the NASDAQ Global Select Market (“NASDAQ”) under the symbol “GLAD.” The following table reflects, by quarter, the high and low sales prices per share of our common stock on the NASDAQ, the high and low sales prices as a percentage of net asset value (“NAV”) per common share and quarterly distributions declared per share for each fiscal quarter during the last two fiscal years. Amounts presented for each fiscal quarter of 2012 and 2011 represent the cumulative amount of the distributions declared per common share for the months composing such quarter.
Quarter Ended
NAV (A)
Sales Price
(Discount) Premium of High
to NAV(B)
Discount of Low to
NAV(B) Declared
Distributions High Low FY 2012 09/30/12 $ 8.98 $ 9.19 $ 7.86 2.3% (12.5)% $ 0.210 06/30/12 8.91 8.46 7.30 (5.1) (18.1) 0.210 03/31/12 9.62 9.33 7.69 (3.0) (20.1) 0.210 12/31/11 9.90 8.74 6.46 (11.7) (34.7) 0.210 FY 2011 09/30/11 10.16 9.75 6.86 (4.0) (32.5) 0.210 06/30/11 10.34 11.66 9.22 12.8 (10.8) 0.210 03/31/11 11.18 12.12 10.46 8.4 (6.4) 0.210 12/31/10 11.74 12.17 10.83 3.7 (7.8) 0.210
(A) NAV per common share is determined as of the last day in the relevant quarter and therefore may not reflect the NAV per common share on the
date of the high and low sales prices. The NAVs shown are based on outstanding common shares at the end of each period. (B) The (discounts) premiums set forth in these columns represent the high or low, as applicable, sales price per share for the relevant quarter minus
the NAV per common share as of the end of such quarter, and therefore may not reflect the (discount) premium to NAV per common share on the date of the high and low sales prices.
As of November 8, 2012, there were approximately 57 record owners of our common stock. This number does not include stockholders for whom shares are held in “street name.”
Distributions We currently intend to distribute in the form of cash distributions a minimum of 90% of our ordinary income and short-term capital gains, if any, on a quarterly basis to our stockholders in the form of monthly distributions. We intend to retain some or all of our long-term capital gains, but to designate the retained amount as a deemed distribution, after giving effect to any prior year realized losses that are carried forward, to supplement our equity capital and support the growth of our portfolio. However, in certain cases, our Board of Directors may choose to distribute our net realized long-term capital gains by paying a one-time special distribution. Additionally, our Credit Facility contains a covenant that limits payments of distributions to our aggregate net investment income for each of the twelve month periods ending September 30, 2012, 2013, 2014 and 2015. Recent Sales of Unregistered Securities and Purchases of Equity Securities We did not sell any unregistered shares of stock or repurchase any shares of our stock during the fiscal year ended September 30, 2012.
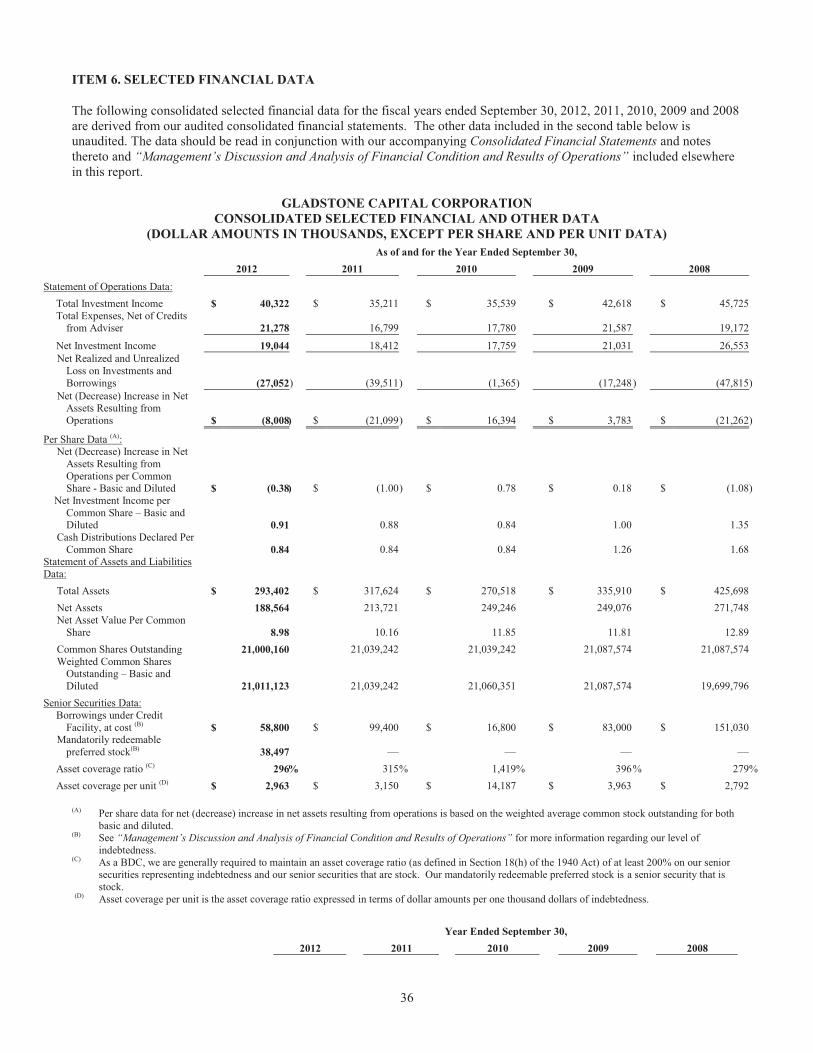
36
ITEM 6. SELECTED FINANCIAL DATA
The following consolidated selected financial data for the fiscal years ended September 30, 2012, 2011, 2010, 2009 and 2008 are derived from our audited consolidated financial statements. The other data included in the second table below is unaudited. The data should be read in conjunction with our accompanying Consolidated Financial Statements and notes thereto and “Management’s Discussion and Analysis of Financial Condition and Results of Operations” included elsewhere in this report.
GLADSTONE CAPITAL CORPORATION CONSOLIDATED SELECTED FINANCIAL AND OTHER DATA
(DOLLAR AMOUNTS IN THOUSANDS, EXCEPT PER SHARE AND PER UNIT DATA) As of and for the Year Ended September 30,
2012 2011 2010 2009 2008
Statement of Operations Data:
Total Investment Income $ 40,322 $ 35,211 $ 35,539 $ 42,618 $ 45,725 Total Expenses, Net of Credits
from Adviser 21,278 16,799 17,780 21,587 19,172
Net Investment Income 19,044 18,412 17,759 21,031 26,553
Net Realized and Unrealized Loss on Investments and Borrowings (27,052 ) (39,511 ) (1,365) (17,248 ) (47,815 )
Net (Decrease) Increase in Net Assets Resulting from Operations $ (8,008 ) $ (21,099 ) $ 16,394 $ 3,783 $ (21,262 )
Per Share Data (A): Net (Decrease) Increase in Net
Assets Resulting from Operations per Common Share - Basic and Diluted $ (0.38 ) $ (1.00 ) $ 0.78 $ 0.18 $ (1.08 )
Net Investment Income per Common Share – Basic and Diluted 0.91 0.88 0.84 1.00 1.35
Cash Distributions Declared Per Common Share 0.84 0.84 0.84 1.26 1.68
Statement of Assets and Liabilities Data: Total Assets $ 293,402 $ 317,624 $ 270,518 $ 335,910 $ 425,698 Net Assets 188,564 213,721 249,246 249,076 271,748 Net Asset Value Per Common
Share 8.98 10.16 11.85 11.81 12.89 Common Shares Outstanding 21,000,160 21,039,242 21,039,242 21,087,574 21,087,574 Weighted Common Shares
Outstanding – Basic and Diluted 21,011,123 21,039,242 21,060,351 21,087,574 19,699,796
Senior Securities Data: Borrowings under Credit
Facility, at cost (B) $ 58,800 $ 99,400 $ 16,800 $ 83,000 $ 151,030 Mandatorily redeemable
preferred stock(B) 38,497 — — — — Asset coverage ratio (C) 296 % 315 % 1,419% 396 % 279 % Asset coverage per unit (D) $ 2,963 $ 3,150 $ 14,187 $ 3,963 $ 2,792
(A) Per share data for net (decrease) increase in net assets resulting from operations is based on the weighted average common stock outstanding for both
basic and diluted. (B) See “Management’s Discussion and Analysis of Financial Condition and Results of Operations” for more information regarding our level of
indebtedness. (C) As a BDC, we are generally required to maintain an asset coverage ratio (as defined in Section 18(h) of the 1940 Act) of at least 200% on our senior
securities representing indebtedness and our senior securities that are stock. Our mandatorily redeemable preferred stock is a senior security that is stock.
(D) Asset coverage per unit is the asset coverage ratio expressed in terms of dollar amounts per one thousand dollars of indebtedness.
Year Ended September 30,
2012 2011 2010 2009 2008
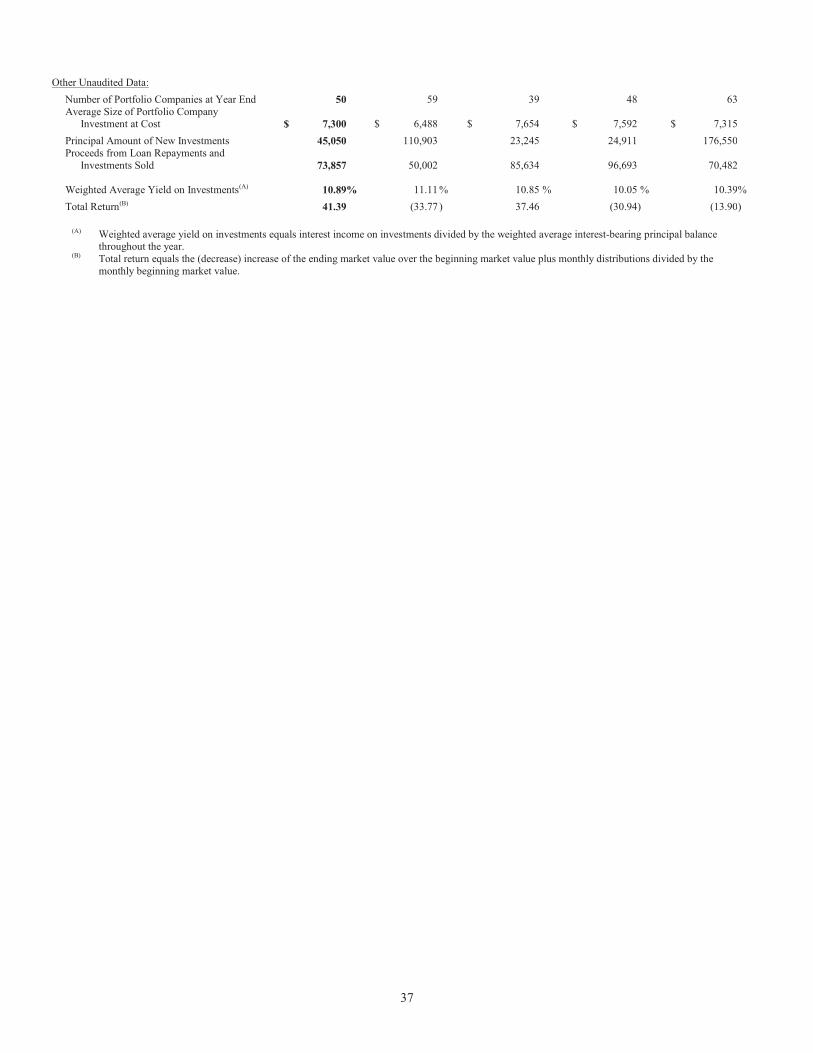
37
Other Unaudited Data:
Number of Portfolio Companies at Year End 50 59 39 48 63 Average Size of Portfolio Company
Investment at Cost $ 7,300 $ 6,488 $ 7,654 $ 7,592 $ 7,315
Principal Amount of New Investments 45,050 110,903 23,245 24,911 176,550 Proceeds from Loan Repayments and
Investments Sold 73,857 50,002 85,634 96,693 70,482
Weighted Average Yield on Investments(A) 10.89% 11.11 % 10.85 % 10.05 % 10.39 %
Total Return(B) 41.39 (33.77 ) 37.46 (30.94 ) (13.90 ) (A) Weighted average yield on investments equals interest income on investments divided by the weighted average interest-bearing principal balance
throughout the year. (B) Total return equals the (decrease) increase of the ending market value over the beginning market value plus monthly distributions divided by the
monthly beginning market value.
38
ITEM 7. MANAGEMENT’S DISCUSSION AND ANALYSIS OF FINANCIAL CONDITION AND RESULTS OF OPERATIONS
The following analysis of our financial condition and results of operations should be read in conjunction with our financial statements and the notes thereto contained elsewhere in this Form 10-K. Except per share amounts, dollar amounts are in thousands unless otherwise indicated. OVERVIEW
General
We were incorporated under the Maryland General Corporation Laws on May 30, 2001. Our Board of Directors approved revisions to our investment objectives (as noted below) and strategies, effective on or about January 1, 2013. See “Recent Developments — Board of Director Actions” for more information. Our investment objectives are to: (1) achieve and grow current income by investing in debt securities of established businesses that we believe will provide stable earnings and cash flow to pay expenses, make principal and interest payments on our outstanding indebtedness and make distributions to stockholders that grow over time; and (2) provide our stockholders with long-term capital appreciation in the value of our assets by investing in equity securities of established businesses that we believe can grow over time to permit us to sell our equity investments for capital gains. We operate as a closed-end, non-diversified management investment company, and have elected to be treated as a business development company (“BDC”) under the Investment Company Act of 1940, as amended (the “1940 Act”). In addition, for federal tax purposes we have elected to be treated as a regulated investment company (“RIC”) under the Internal Revenue Code of 1986, as amended (the “Code”). Business Environment While economic conditions generally appear to be improving, we remain cautious about a long-term economic recovery. The recent recession in general, and the disruptions in the capital markets in particular, have impacted our liquidity options and increased our cost of debt and equity capital. Many of our portfolio companies, as well as those that we evaluate for investment, are impacted by these economic conditions, and if these conditions persist, it may affect their ability to repay our loans or engage in a liquidity event, such as a sale, recapitalization or initial public offering. The economic conditions could also disproportionately impact some of the industries in which we have invested, causing us to be more vulnerable to losses in our portfolio, which could cause the number of our non-performing assets to increase and the fair market value of our portfolio to decrease. We do not know if market conditions will continue to improve or if adverse conditions will again intensify, and we do not know the full extent to which the economic downturn will affect us. If market instability persists or intensifies, we may experience difficulty in raising capital. During 2012, we experienced a net contraction in our overall portfolio, a net decrease of nine portfolio companies when compared to the year ending 2011. The primary reason was due to $60.2 million in unscheduled principal payments with ten portfolio investments paying off early, but also due to fewer new investments being made during the year. While we invested in several new proprietary and syndicate investments in 2012, there is increased competitive pressure in the BDC and investment company marketplace for senior and senior subordinated debt resulting in lower yields for increasingly riskier investments. Going into 2013, we will continue to focus on building our pipeline and making investments that meet our objectives and strategies and that provide appropriate returns given the risks. Subsequent to September 30, 2012, we have made one new investment for an aggregate total of $2.5 million. Despite the challenges during these uncertain economic times, during the year ended September 30, 2012, we completed both a preferred stock offering and a renewal of our $137.0 million line of credit (our “Credit Facility,” described more fully under “Recent Developments — Renewal of Credit Facility” below). In November 2011, we issued 1.5 million shares of term preferred stock (our “Term Preferred Stock,” defined under “Recent Developments — Term Preferred Stock Offering” below) for gross proceeds of $38.5 million and in January 2012, we closed on an amendment on our Credit Facility to extend its maturity until January 2015. In addition, in July 2012, the Securities and Exchange Commission (“SEC”) granted an exemptive order that, subject to satisfaction of certain conditions, expands our ability to co-invest in portfolio companies with certain of our affiliated investment funds, which we believe this will enhance our ability to further our investment strategy and objectives. See “Recent Developments — Co-Investment Order” for more information.
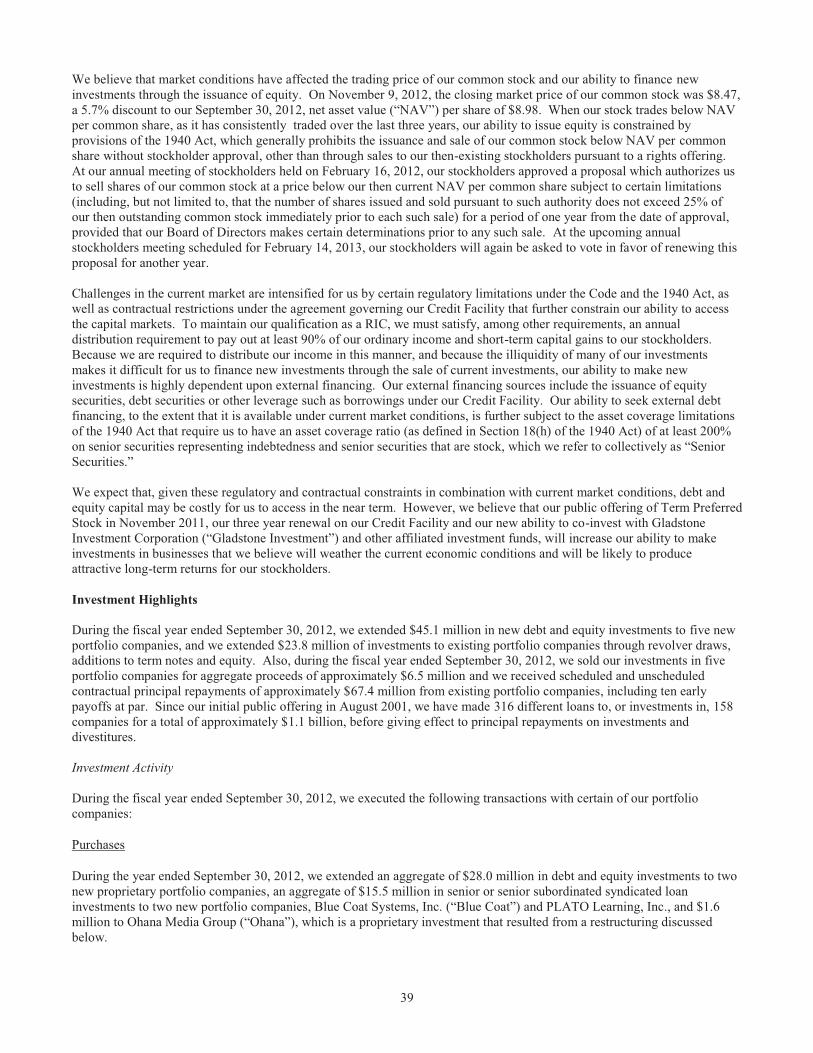
39
We believe that market conditions have affected the trading price of our common stock and our ability to finance new investments through the issuance of equity. On November 9, 2012, the closing market price of our common stock was $8.47, a 5.7% discount to our September 30, 2012, net asset value (“NAV”) per share of $8.98. When our stock trades below NAV per common share, as it has consistently traded over the last three years, our ability to issue equity is constrained by provisions of the 1940 Act, which generally prohibits the issuance and sale of our common stock below NAV per common share without stockholder approval, other than through sales to our then-existing stockholders pursuant to a rights offering. At our annual meeting of stockholders held on February 16, 2012, our stockholders approved a proposal which authorizes us to sell shares of our common stock at a price below our then current NAV per common share subject to certain limitations (including, but not limited to, that the number of shares issued and sold pursuant to such authority does not exceed 25% of our then outstanding common stock immediately prior to each such sale) for a period of one year from the date of approval, provided that our Board of Directors makes certain determinations prior to any such sale. At the upcoming annual stockholders meeting scheduled for February 14, 2013, our stockholders will again be asked to vote in favor of renewing this proposal for another year. Challenges in the current market are intensified for us by certain regulatory limitations under the Code and the 1940 Act, as well as contractual restrictions under the agreement governing our Credit Facility that further constrain our ability to access the capital markets. To maintain our qualification as a RIC, we must satisfy, among other requirements, an annual distribution requirement to pay out at least 90% of our ordinary income and short-term capital gains to our stockholders. Because we are required to distribute our income in this manner, and because the illiquidity of many of our investments makes it difficult for us to finance new investments through the sale of current investments, our ability to make new investments is highly dependent upon external financing. Our external financing sources include the issuance of equity securities, debt securities or other leverage such as borrowings under our Credit Facility. Our ability to seek external debt financing, to the extent that it is available under current market conditions, is further subject to the asset coverage limitations of the 1940 Act that require us to have an asset coverage ratio (as defined in Section 18(h) of the 1940 Act) of at least 200% on senior securities representing indebtedness and senior securities that are stock, which we refer to collectively as “Senior Securities.” We expect that, given these regulatory and contractual constraints in combination with current market conditions, debt and equity capital may be costly for us to access in the near term. However, we believe that our public offering of Term Preferred Stock in November 2011, our three year renewal on our Credit Facility and our new ability to co-invest with Gladstone Investment Corporation (“Gladstone Investment”) and other affiliated investment funds, will increase our ability to make investments in businesses that we believe will weather the current economic conditions and will be likely to produce attractive long-term returns for our stockholders. Investment Highlights During the fiscal year ended September 30, 2012, we extended $45.1 million in new debt and equity investments to five new portfolio companies, and we extended $23.8 million of investments to existing portfolio companies through revolver draws, additions to term notes and equity. Also, during the fiscal year ended September 30, 2012, we sold our investments in five portfolio companies for aggregate proceeds of approximately $6.5 million and we received scheduled and unscheduled contractual principal repayments of approximately $67.4 million from existing portfolio companies, including ten early payoffs at par. Since our initial public offering in August 2001, we have made 316 different loans to, or investments in, 158 companies for a total of approximately $1.1 billion, before giving effect to principal repayments on investments and divestitures. Investment Activity During the fiscal year ended September 30, 2012, we executed the following transactions with certain of our portfolio companies:
Purchases
During the year ended September 30, 2012, we extended an aggregate of $28.0 million in debt and equity investments to two new proprietary portfolio companies, an aggregate of $15.5 million in senior or senior subordinated syndicated loan investments to two new portfolio companies, Blue Coat Systems, Inc. (“Blue Coat”) and PLATO Learning, Inc., and $1.6 million to Ohana Media Group (“Ohana”), which is a proprietary investment that resulted from a restructuring discussed below.
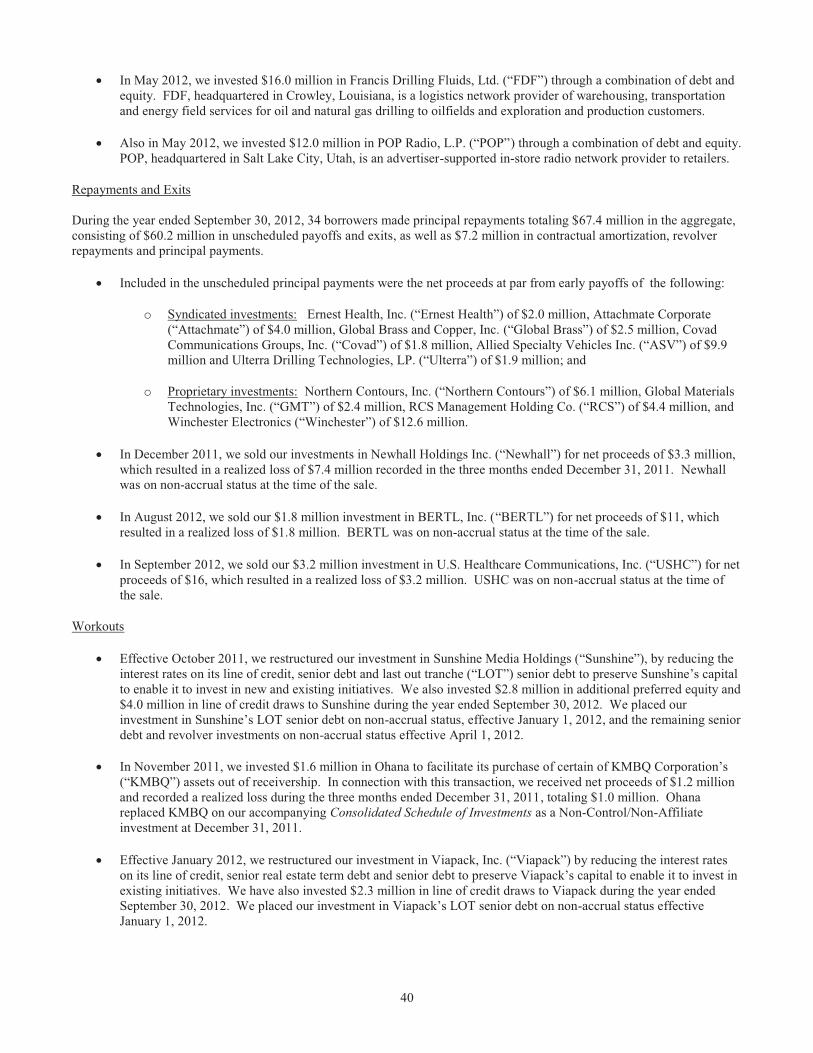
40
� In May 2012, we invested $16.0 million in Francis Drilling Fluids, Ltd. (“FDF”) through a combination of debt and equity. FDF, headquartered in Crowley, Louisiana, is a logistics network provider of warehousing, transportation and energy field services for oil and natural gas drilling to oilfields and exploration and production customers.
� Also in May 2012, we invested $12.0 million in POP Radio, L.P. (“POP”) through a combination of debt and equity. POP, headquartered in Salt Lake City, Utah, is an advertiser-supported in-store radio network provider to retailers.
Repayments and Exits During the year ended September 30, 2012, 34 borrowers made principal repayments totaling $67.4 million in the aggregate, consisting of $60.2 million in unscheduled payoffs and exits, as well as $7.2 million in contractual amortization, revolver repayments and principal payments.
� Included in the unscheduled principal payments were the net proceeds at par from early payoffs of the following:
o Syndicated investments: Ernest Health, Inc. (“Ernest Health”) of $2.0 million, Attachmate Corporate (“Attachmate”) of $4.0 million, Global Brass and Copper, Inc. (“Global Brass”) of $2.5 million, Covad Communications Groups, Inc. (“Covad”) of $1.8 million, Allied Specialty Vehicles Inc. (“ASV”) of $9.9 million and Ulterra Drilling Technologies, LP. (“Ulterra”) of $1.9 million; and
o Proprietary investments: Northern Contours, Inc. (“Northern Contours”) of $6.1 million, Global Materials Technologies, Inc. (“GMT”) of $2.4 million, RCS Management Holding Co. (“RCS”) of $4.4 million, and Winchester Electronics (“Winchester”) of $12.6 million.
� In December 2011, we sold our investments in Newhall Holdings Inc. (“Newhall”) for net proceeds of $3.3 million, which resulted in a realized loss of $7.4 million recorded in the three months ended December 31, 2011. Newhall was on non-accrual status at the time of the sale.
� In August 2012, we sold our $1.8 million investment in BERTL, Inc. (“BERTL”) for net proceeds of $11, which resulted in a realized loss of $1.8 million. BERTL was on non-accrual status at the time of the sale.
� In September 2012, we sold our $3.2 million investment in U.S. Healthcare Communications, Inc. (“USHC”) for net proceeds of $16, which resulted in a realized loss of $3.2 million. USHC was on non-accrual status at the time of the sale.
Workouts
� Effective October 2011, we restructured our investment in Sunshine Media Holdings (“Sunshine”), by reducing the interest rates on its line of credit, senior debt and last out tranche (“LOT”) senior debt to preserve Sunshine’s capital to enable it to invest in new and existing initiatives. We also invested $2.8 million in additional preferred equity and $4.0 million in line of credit draws to Sunshine during the year ended September 30, 2012. We placed our investment in Sunshine’s LOT senior debt on non-accrual status, effective January 1, 2012, and the remaining senior debt and revolver investments on non-accrual status effective April 1, 2012.
� In November 2011, we invested $1.6 million in Ohana to facilitate its purchase of certain of KMBQ Corporation’s (“KMBQ”) assets out of receivership. In connection with this transaction, we received net proceeds of $1.2 million and recorded a realized loss during the three months ended December 31, 2011, totaling $1.0 million. Ohana replaced KMBQ on our accompanying Consolidated Schedule of Investments as a Non-Control/Non-Affiliate investment at December 31, 2011.
� Effective January 2012, we restructured our investment in Viapack, Inc. (“Viapack”) by reducing the interest rates on its line of credit, senior real estate term debt and senior debt to preserve Viapack’s capital to enable it to invest in existing initiatives. We have also invested $2.3 million in line of credit draws to Viapack during the year ended September 30, 2012. We placed our investment in Viapack’s LOT senior debt on non-accrual status effective January 1, 2012.
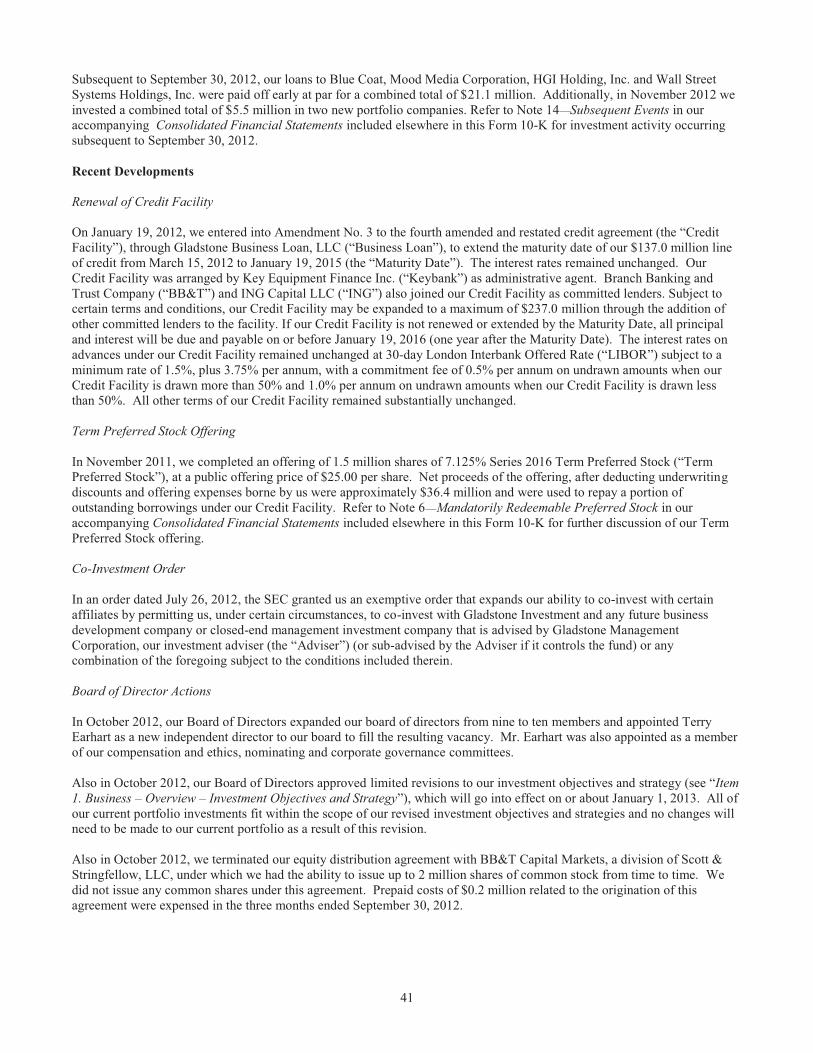
41
Subsequent to September 30, 2012, our loans to Blue Coat, Mood Media Corporation, HGI Holding, Inc. and Wall Street Systems Holdings, Inc. were paid off early at par for a combined total of $21.1 million. Additionally, in November 2012 we invested a combined total of $5.5 million in two new portfolio companies. Refer to Note 14—Subsequent Events in our accompanying Consolidated Financial Statements included elsewhere in this Form 10-K for investment activity occurring subsequent to September 30, 2012. Recent Developments Renewal of Credit Facility On January 19, 2012, we entered into Amendment No. 3 to the fourth amended and restated credit agreement (the “Credit Facility”), through Gladstone Business Loan, LLC (“Business Loan”), to extend the maturity date of our $137.0 million line of credit from March 15, 2012 to January 19, 2015 (the “Maturity Date”). The interest rates remained unchanged. Our Credit Facility was arranged by Key Equipment Finance Inc. (“Keybank”) as administrative agent. Branch Banking and Trust Company (“BB&T”) and ING Capital LLC (“ING”) also joined our Credit Facility as committed lenders. Subject to certain terms and conditions, our Credit Facility may be expanded to a maximum of $237.0 million through the addition of other committed lenders to the facility. If our Credit Facility is not renewed or extended by the Maturity Date, all principal and interest will be due and payable on or before January 19, 2016 (one year after the Maturity Date). The interest rates on advances under our Credit Facility remained unchanged at 30-day London Interbank Offered Rate (“LIBOR”) subject to a minimum rate of 1.5%, plus 3.75% per annum, with a commitment fee of 0.5% per annum on undrawn amounts when our Credit Facility is drawn more than 50% and 1.0% per annum on undrawn amounts when our Credit Facility is drawn less than 50%. All other terms of our Credit Facility remained substantially unchanged. Term Preferred Stock Offering In November 2011, we completed an offering of 1.5 million shares of 7.125% Series 2016 Term Preferred Stock (“Term Preferred Stock”), at a public offering price of $25.00 per share. Net proceeds of the offering, after deducting underwriting discounts and offering expenses borne by us were approximately $36.4 million and were used to repay a portion of outstanding borrowings under our Credit Facility. Refer to Note 6—Mandatorily Redeemable Preferred Stock in our accompanying Consolidated Financial Statements included elsewhere in this Form 10-K for further discussion of our Term Preferred Stock offering. Co-Investment Order In an order dated July 26, 2012, the SEC granted us an exemptive order that expands our ability to co-invest with certain affiliates by permitting us, under certain circumstances, to co-invest with Gladstone Investment and any future business development company or closed-end management investment company that is advised by Gladstone Management Corporation, our investment adviser (the “Adviser”) (or sub-advised by the Adviser if it controls the fund) or any combination of the foregoing subject to the conditions included therein. Board of Director Actions In October 2012, our Board of Directors expanded our board of directors from nine to ten members and appointed Terry Earhart as a new independent director to our board to fill the resulting vacancy. Mr. Earhart was also appointed as a member of our compensation and ethics, nominating and corporate governance committees. Also in October 2012, our Board of Directors approved limited revisions to our investment objectives and strategy (see “Item 1. Business – Overview – Investment Objectives and Strategy”), which will go into effect on or about January 1, 2013. All of our current portfolio investments fit within the scope of our revised investment objectives and strategies and no changes will need to be made to our current portfolio as a result of this revision. Also in October 2012, we terminated our equity distribution agreement with BB&T Capital Markets, a division of Scott & Stringfellow, LLC, under which we had the ability to issue up to 2 million shares of common stock from time to time. We did not issue any common shares under this agreement. Prepaid costs of $0.2 million related to the origination of this agreement were expensed in the three months ended September 30, 2012.
42
Investment Strategy To achieve our investment objectives, we seek to invest in several categories of debt and equity securities, with each investment generally ranging from $5 million to $30 million, although investment size may vary, depending upon our total assets or available capital at the time of investment. In general, our investments in debt securities have a term of no more than seven years, accrue interest at variable rates (based on LIBOR) and, to a lesser extent, at fixed rates. We seek debt instruments that pay interest monthly or, at a minimum, quarterly, have a success fee or deferred interest provision and are primarily interest only with all principal and any accrued but unpaid interest due at maturity. Generally, success fees accrue at a set rate and are contractually due upon a change of control in the business. Some debt securities have deferred interest whereby some portion of the interest payment is added to the principal balance so that the interest is paid, together with the principal, at maturity. This form of deferred interest is often called “paid in kind” (“PIK”). Typically, our equity investments consist of common stock, preferred stock, limited liability company interests, or warrants to purchase the foregoing. Often, these equity investments occur in connection with our original investment, recapitalizing a business, or refinancing existing debt.
The Adviser and Administrator
The Adviser is led by a management team which has extensive experience in our lines of business. The Adviser is controlled by David Gladstone, our chairman and chief executive officer. Mr. Gladstone is also the chairman and chief executive officer of the Adviser. Terry Lee Brubaker, our vice chairman, chief operating officer and director, is a member of the board of directors of the Adviser and its vice chairman and chief operating officer and has substantial experience in acquisitions and operations of companies. George Stelljes III, our president, chief investment officer and director, is a member of the board of directors of the Adviser and its president and chief investment officer and has extensive experience in leveraged finance. Gladstone Administration, LLC (the “Administrator”), an affiliate of the Adviser, employs our chief financial officer and treasurer, chief accounting officer, chief compliance officer, internal counsel and their respective staffs. The Adviser and Administrator also provide investment advisory and administrative services to our affiliates, Gladstone Commercial Corporation (“Gladstone Commercial”), a publicly-traded real estate investment trust; Gladstone Investment, a publicly-traded BDC and RIC; and Gladstone Land Corporation (“Gladstone Land”), a private agricultural real estate company that has filed a registration statement on Form S-11 with the SEC, but has not yet completed its initial public offering. Excluding our chief financial officer and treasurer and our chief accounting officer, all of our executive officers serve as directors or executive officers, or both, of the Adviser, the Administrator, Gladstone Commercial, Gladstone Investment and will likely serve as directors and executive officers of Gladstone Land (which is owned by our chief executive officer) in the future. Our chief executive officer also serves on the board of managers of our affiliate, Gladstone Securities, LLP (“Gladstone Securities”), a broker-dealer registered with the Financial Industry Regulatory Authority (“FINRA”) and insured by the Securities Investor Protection Corporation. Additionally, our chief financial officer and treasurer serves as chief financial officer and treasurer of Gladstone Investment. In the future, the Adviser and Administrator may provide investment advisory and administrative services, respectively, to other funds, both public and private. In addition, as a BDC under the 1940 Act, we are required to make available significant managerial assistance to our portfolio companies. The Adviser provides these services on our behalf through its personnel, some of whom are also our officers. Currently, neither we nor the Adviser charge a fee for managerial assistance.
The Adviser and Gladstone Securities, each an affiliate of ours, receive fees for certain services they separately provide to certain of our portfolio companies. Such fees are generally paid directly to the Adviser or Gladstone Securities, as applicable. When the Adviser receives such fees, 50% of certain of those fees and 100% of others are credited against the base management fee that we pay to the Adviser. Gladstone Securities provides certain of our portfolio companies with investment banking and due diligence services; these fees do not impact the overall fees that we pay the Adviser. The Adviser also receives fees for monitoring and reviewing portfolio company investments. These fees are recurring and are generally paid annually or quarterly in advance to the Adviser throughout the life of the investment. Fees of this nature are recorded as revenue by the Adviser when earned and are not credited against the base management fee. We may receive fees for the origination and closing services we provide to portfolio companies through the Adviser. These fees are paid directly to us and are recognized as other income upon closing of the originated investment.

43
Investment Advisory and Management Agreement Under the amended and restated investment advisory agreement (“Advisory Agreement”), we pay the Adviser an annual base management fee of 2% of our average gross assets, which is defined as total assets, including investments made with proceeds of borrowings, less any uninvested cash or cash equivalents resulting from borrowings, valued at the end of the two most recently completed calendar quarters and appropriately adjusted for any share issuances or repurchases during the current calendar quarter. We also pay the Adviser a two-part incentive fee under the Advisory Agreement. The first part of the incentive fee is an income-based incentive fee which rewards the Adviser if our quarterly net investment income (before giving effect to any incentive fee) exceeds 1.75% of our net assets (the “hurdle rate”). The second part of the incentive fee is a capital gains-based incentive fee that is determined and payable in arrears as of the end of each fiscal year (or upon termination of the Advisory Agreement, as of the termination date), and equals 20% of our realized capital gains as of the end of the fiscal year. In determining the capital gains-based incentive fee payable to the Adviser, we will calculate the cumulative aggregate realized capital gains and cumulative aggregate realized capital losses since our inception, and the aggregate unrealized capital depreciation as of the date of the calculation, as applicable, with respect to each of the investments in our portfolio. The Adviser has not earned the capital gains-based portion of the incentive fee since our inception.
We pay our direct expenses including, but not limited to, directors’ fees, legal and accounting fees, stockholder related expenses, and directors and officers insurance under the Advisory Agreement.
Beginning in April 2006, our Board of Directors has accepted from the Adviser, unconditional and irrevocable voluntarily waivers on a quarterly basis to reduce the annual 2.0% base management fee on senior syndicated loans to 0.5% to the extent that proceeds resulting from borrowings were used to purchase such syndicated loan participations. In addition to the base management and incentive fees under the Advisory Agreement, 50% of certain fees and 100% of others received by the Adviser from our portfolio companies are credited against the investment advisory fee and paid to the Adviser. The Adviser services our loan portfolio, pursuant to a loan servicing agreement with our wholly-owned subsidiary Business Loan, in return for a 1.5% annual fee, based on the monthly aggregate outstanding loan balance of the loans pledged under our Credit Facility.
In July 2012, our Board of Directors approved the renewal of the Advisory Agreement with the Adviser through August 31, 2013. We expect that our Board of Directors will approve a further one year renewal in July 2013. Administration Agreement We entered into an administration agreement with the Administrator (the “Administration Agreement”), whereby we pay separately for administrative services. The Administration Agreement provides for payments equal to our allocable portion of the Administrator’s overhead expenses in performing its obligations under the Administration Agreement including, but not limited to, rent and our allocable portion of the salaries and benefits expenses of our chief financial officer and treasurer, chief accounting officer, chief compliance officer, internal counsel and their respective staffs. Our allocable portion of expenses is derived by multiplying the Administrator’s total expenses by the percentage of our average assets (the total assets at the beginning of each quarter) in comparison to the average total assets of all companies managed by the Adviser under similar agreements. In July 2012, our Board of Directors approved the renewal of this Administration Agreement through August 31, 2013. We expect that our Board of Directors will consider a further one year renewal in July 2013.
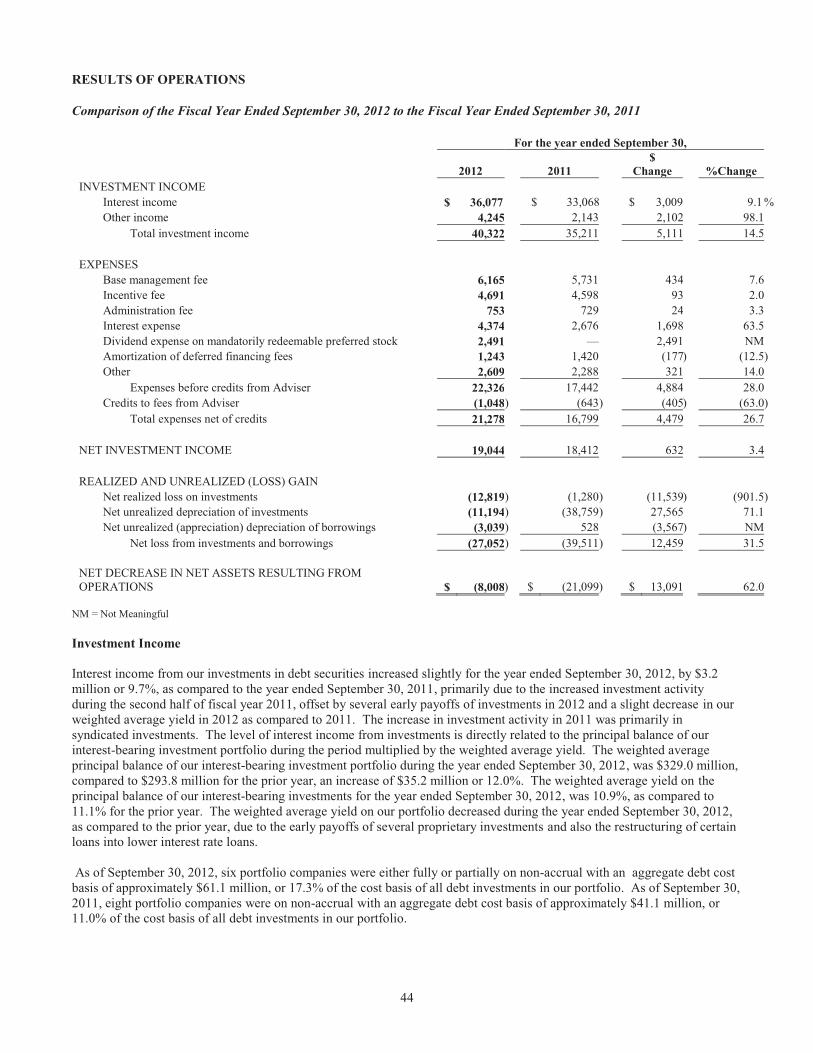
44
RESULTS OF OPERATIONS
Comparison of the Fiscal Year Ended September 30, 2012 to the Fiscal Year Ended September 30, 2011
For the year ended September 30,
2012 2011 $
Change %Change
INVESTMENT INCOME Interest income $ 36,077 $ 33,068 $ 3,009 9.1 % Other income 4,245 2,143 2,102 98.1
Total investment income 40,322 35,211 5,111 14.5 EXPENSES
Base management fee 6,165 5,731 434 7.6 Incentive fee 4,691 4,598 93 2.0 Administration fee 753 729 24 3.3 Interest expense 4,374 2,676 1,698 63.5 Dividend expense on mandatorily redeemable preferred stock 2,491 — 2,491 NM Amortization of deferred financing fees 1,243 1,420 (177) (12.5 ) Other 2,609 2,288 321 14.0
Expenses before credits from Adviser 22,326 17,442 4,884 28.0 Credits to fees from Adviser (1,048) (643 ) (405) (63.0 )
Total expenses net of credits 21,278 16,799 4,479 26.7 NET INVESTMENT INCOME 19,044 18,412 632 3.4 REALIZED AND UNREALIZED (LOSS) GAIN
Net realized loss on investments (12,819) (1,280 ) (11,539) (901.5 ) Net unrealized depreciation of investments (11,194) (38,759 ) 27,565 71.1 Net unrealized (appreciation) depreciation of borrowings (3,039) 528 (3,567) NM
Net loss from investments and borrowings (27,052) (39,511 ) 12,459 31.5 NET DECREASE IN NET ASSETS RESULTING FROM OPERATIONS $ (8,008) $ (21,099 ) $ 13,091 62.0
NM = Not Meaningful Investment Income Interest income from our investments in debt securities increased slightly for the year ended September 30, 2012, by $3.2 million or 9.7%, as compared to the year ended September 30, 2011, primarily due to the increased investment activity during the second half of fiscal year 2011, offset by several early payoffs of investments in 2012 and a slight decrease in our weighted average yield in 2012 as compared to 2011. The increase in investment activity in 2011 was primarily in syndicated investments. The level of interest income from investments is directly related to the principal balance of our interest-bearing investment portfolio during the period multiplied by the weighted average yield. The weighted average principal balance of our interest-bearing investment portfolio during the year ended September 30, 2012, was $329.0 million, compared to $293.8 million for the prior year, an increase of $35.2 million or 12.0%. The weighted average yield on the principal balance of our interest-bearing investments for the year ended September 30, 2012, was 10.9%, as compared to 11.1% for the prior year. The weighted average yield on our portfolio decreased during the year ended September 30, 2012, as compared to the prior year, due to the early payoffs of several proprietary investments and also the restructuring of certain loans into lower interest rate loans. As of September 30, 2012, six portfolio companies were either fully or partially on non-accrual with an aggregate debt cost basis of approximately $61.1 million, or 17.3% of the cost basis of all debt investments in our portfolio. As of September 30, 2011, eight portfolio companies were on non-accrual with an aggregate debt cost basis of approximately $41.1 million, or 11.0% of the cost basis of all debt investments in our portfolio.
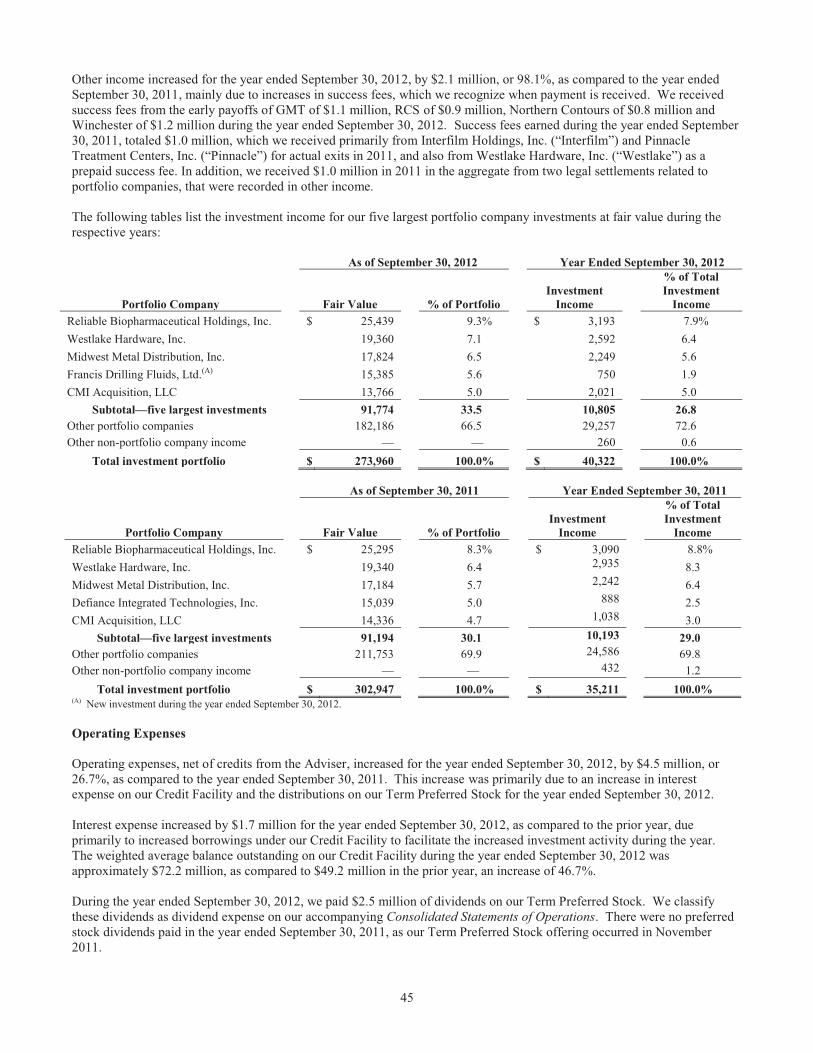
45
Other income increased for the year ended September 30, 2012, by $2.1 million, or 98.1%, as compared to the year ended September 30, 2011, mainly due to increases in success fees, which we recognize when payment is received. We received success fees from the early payoffs of GMT of $1.1 million, RCS of $0.9 million, Northern Contours of $0.8 million and Winchester of $1.2 million during the year ended September 30, 2012. Success fees earned during the year ended September 30, 2011, totaled $1.0 million, which we received primarily from Interfilm Holdings, Inc. (“Interfilm”) and Pinnacle Treatment Centers, Inc. (“Pinnacle”) for actual exits in 2011, and also from Westlake Hardware, Inc. (“Westlake”) as a prepaid success fee. In addition, we received $1.0 million in 2011 in the aggregate from two legal settlements related to portfolio companies, that were recorded in other income. The following tables list the investment income for our five largest portfolio company investments at fair value during the respective years:
As of September 30, 2012 Year Ended September 30, 2012
Portfolio Company Fair Value
% of Portfolio
Investment
Income
% of Total Investment
Income Reliable Biopharmaceutical Holdings, Inc. $ 25,439 9.3% $ 3,193 7.9% Westlake Hardware, Inc. 19,360 7.1 2,592 6.4 Midwest Metal Distribution, Inc. 17,824 6.5 2,249 5.6 Francis Drilling Fluids, Ltd.(A) 15,385 5.6 750 1.9 CMI Acquisition, LLC 13,766 5.0 2,021 5.0
Subtotal—five largest investments 91,774 33.5 10,805 26.8 Other portfolio companies 182,186 66.5 29,257 72.6 Other non-portfolio company income — — 260 0.6
Total investment portfolio $ 273,960 100.0% $ 40,322 100.0% As of September 30, 2011 Year Ended September 30, 2011
Portfolio Company Fair Value
% of Portfolio
Investment
Income
% of Total Investment
Income Reliable Biopharmaceutical Holdings, Inc. $ 25,295 8.3% $ 3,090 8.8% Westlake Hardware, Inc. 19,340 6.4 2,935 8.3 Midwest Metal Distribution, Inc. 17,184 5.7 2,242 6.4 Defiance Integrated Technologies, Inc. 15,039 5.0 888 2.5 CMI Acquisition, LLC 14,336 4.7 1,038 3.0
Subtotal—five largest investments 91,194 30.1 10,193 29.0 Other portfolio companies 211,753 69.9 24,586 69.8 Other non-portfolio company income — — 432 1.2
Total investment portfolio $ 302,947 100.0% $ 35,211 100.0% (A) New investment during the year ended September 30, 2012. Operating Expenses Operating expenses, net of credits from the Adviser, increased for the year ended September 30, 2012, by $4.5 million, or 26.7%, as compared to the year ended September 30, 2011. This increase was primarily due to an increase in interest expense on our Credit Facility and the distributions on our Term Preferred Stock for the year ended September 30, 2012. Interest expense increased by $1.7 million for the year ended September 30, 2012, as compared to the prior year, due primarily to increased borrowings under our Credit Facility to facilitate the increased investment activity during the year. The weighted average balance outstanding on our Credit Facility during the year ended September 30, 2012 was approximately $72.2 million, as compared to $49.2 million in the prior year, an increase of 46.7%. During the year ended September 30, 2012, we paid $2.5 million of dividends on our Term Preferred Stock. We classify these dividends as dividend expense on our accompanying Consolidated Statements of Operations. There were no preferred stock dividends paid in the year ended September 30, 2011, as our Term Preferred Stock offering occurred in November 2011.
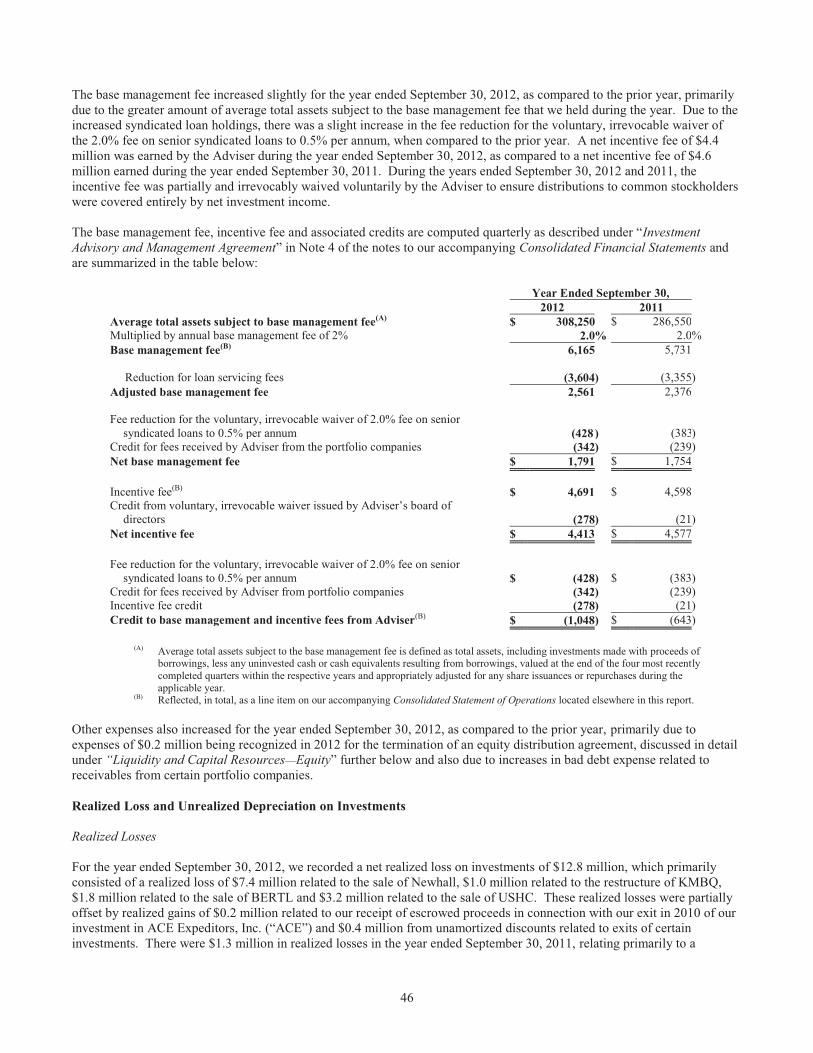
46
The base management fee increased slightly for the year ended September 30, 2012, as compared to the prior year, primarily due to the greater amount of average total assets subject to the base management fee that we held during the year. Due to the increased syndicated loan holdings, there was a slight increase in the fee reduction for the voluntary, irrevocable waiver of the 2.0% fee on senior syndicated loans to 0.5% per annum, when compared to the prior year. A net incentive fee of $4.4 million was earned by the Adviser during the year ended September 30, 2012, as compared to a net incentive fee of $4.6 million earned during the year ended September 30, 2011. During the years ended September 30, 2012 and 2011, the incentive fee was partially and irrevocably waived voluntarily by the Adviser to ensure distributions to common stockholders were covered entirely by net investment income. The base management fee, incentive fee and associated credits are computed quarterly as described under “Investment Advisory and Management Agreement” in Note 4 of the notes to our accompanying Consolidated Financial Statements and are summarized in the table below:
Year Ended September 30, 2012 2011 Average total assets subject to base management fee(A) $ 308,250 $ 286,550 Multiplied by annual base management fee of 2% 2.0% 2.0 % Base management fee(B) 6,165 5,731
Reduction for loan servicing fees (3,604) (3,355 ) Adjusted base management fee 2,561 2,376 Fee reduction for the voluntary, irrevocable waiver of 2.0% fee on senior
syndicated loans to 0.5% per annum (428 ) (383) Credit for fees received by Adviser from the portfolio companies (342) (239 ) Net base management fee $ 1,791 $ 1,754 Incentive fee(B) $ 4,691 $ 4,598 Credit from voluntary, irrevocable waiver issued by Adviser’s board of
directors (278) (21 ) Net incentive fee $ 4,413 $ 4,577 Fee reduction for the voluntary, irrevocable waiver of 2.0% fee on senior
syndicated loans to 0.5% per annum $ (428 ) $ (383 ) Credit for fees received by Adviser from portfolio companies (342) (239 ) Incentive fee credit (278) (21 ) Credit to base management and incentive fees from Adviser(B) $ (1,048 ) $ (643 )
(A) Average total assets subject to the base management fee is defined as total assets, including investments made with proceeds of borrowings, less any uninvested cash or cash equivalents resulting from borrowings, valued at the end of the four most recently completed quarters within the respective years and appropriately adjusted for any share issuances or repurchases during the applicable year.
(B) Reflected, in total, as a line item on our accompanying Consolidated Statement of Operations located elsewhere in this report. Other expenses also increased for the year ended September 30, 2012, as compared to the prior year, primarily due to expenses of $0.2 million being recognized in 2012 for the termination of an equity distribution agreement, discussed in detail under “Liquidity and Capital Resources—Equity” further below and also due to increases in bad debt expense related to receivables from certain portfolio companies. Realized Loss and Unrealized Depreciation on Investments Realized Losses For the year ended September 30, 2012, we recorded a net realized loss on investments of $12.8 million, which primarily consisted of a realized loss of $7.4 million related to the sale of Newhall, $1.0 million related to the restructure of KMBQ, $1.8 million related to the sale of BERTL and $3.2 million related to the sale of USHC. These realized losses were partially offset by realized gains of $0.2 million related to our receipt of escrowed proceeds in connection with our exit in 2010 of our investment in ACE Expeditors, Inc. (“ACE”) and $0.4 million from unamortized discounts related to exits of certain investments. There were $1.3 million in realized losses in the year ended September 30, 2011, relating primarily to a
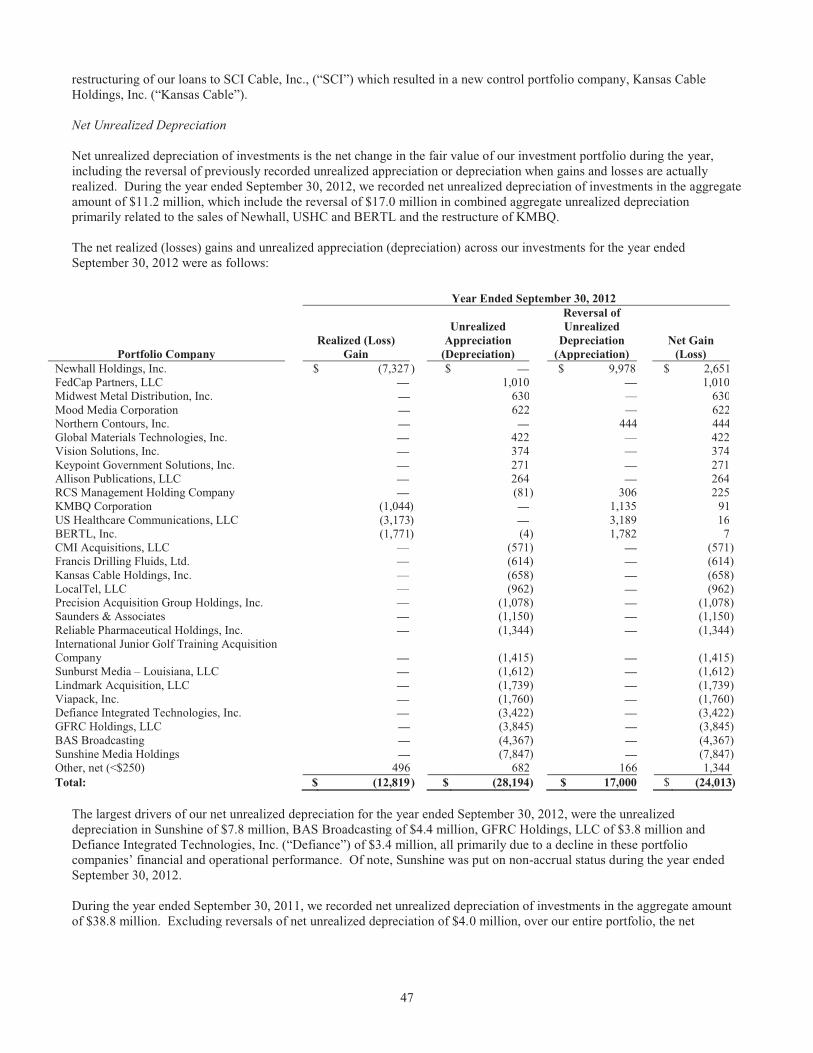
47
restructuring of our loans to SCI Cable, Inc., (“SCI”) which resulted in a new control portfolio company, Kansas Cable Holdings, Inc. (“Kansas Cable”). Net Unrealized Depreciation Net unrealized depreciation of investments is the net change in the fair value of our investment portfolio during the year, including the reversal of previously recorded unrealized appreciation or depreciation when gains and losses are actually realized. During the year ended September 30, 2012, we recorded net unrealized depreciation of investments in the aggregate amount of $11.2 million, which include the reversal of $17.0 million in combined aggregate unrealized depreciation primarily related to the sales of Newhall, USHC and BERTL and the restructure of KMBQ. The net realized (losses) gains and unrealized appreciation (depreciation) across our investments for the year ended September 30, 2012 were as follows:
The largest drivers of our net unrealized depreciation for the year ended September 30, 2012, were the unrealized depreciation in Sunshine of $7.8 million, BAS Broadcasting of $4.4 million, GFRC Holdings, LLC of $3.8 million and Defiance Integrated Technologies, Inc. (“Defiance”) of $3.4 million, all primarily due to a decline in these portfolio companies’ financial and operational performance. Of note, Sunshine was put on non-accrual status during the year ended September 30, 2012. During the year ended September 30, 2011, we recorded net unrealized depreciation of investments in the aggregate amount of $38.8 million. Excluding reversals of net unrealized depreciation of $4.0 million, over our entire portfolio, the net
Year Ended September 30, 2012
Portfolio Company Realized (Loss)
Gain
Unrealized
Appreciation (Depreciation)
Reversal of Unrealized
Depreciation (Appreciation)
Net Gain (Loss)
Newhall Holdings, Inc. $ (7,327 ) $ — $ 9,978 $ 2,651 FedCap Partners, LLC — 1,010 — 1,010 Midwest Metal Distribution, Inc. — 630 — 630 Mood Media Corporation — 622 — 622 Northern Contours, Inc. — — 444 444 Global Materials Technologies, Inc. — 422 — 422 Vision Solutions, Inc. — 374 — 374 Keypoint Government Solutions, Inc. — 271 — 271 Allison Publications, LLC — 264 — 264 RCS Management Holding Company — (81) 306 225 KMBQ Corporation (1,044) — 1,135 91 US Healthcare Communications, LLC (3,173) — 3,189 16 BERTL, Inc. (1,771) (4) 1,782 7 CMI Acquisitions, LLC — (571) — (571 ) Francis Drilling Fluids, Ltd. — (614) — (614 ) Kansas Cable Holdings, Inc. — (658) — (658 ) LocalTel, LLC — (962) — (962 ) Precision Acquisition Group Holdings, Inc. — (1,078) — (1,078 ) Saunders & Associates — (1,150) — (1,150 ) Reliable Pharmaceutical Holdings, Inc. — (1,344) — (1,344 ) International Junior Golf Training Acquisition Company — (1,415) — (1,415 ) Sunburst Media – Louisiana, LLC — (1,612) — (1,612 ) Lindmark Acquisition, LLC — (1,739) — (1,739 ) Viapack, Inc. — (1,760) — (1,760 ) Defiance Integrated Technologies, Inc. — (3,422) — (3,422 ) GFRC Holdings, LLC — (3,845) — (3,845) BAS Broadcasting — (4,367) — (4,367) Sunshine Media Holdings — (7,847) — (7,847) Other, net (<$250) 496 682 166 1,344 Total: $ (12,819 ) $ (28,194) $ 17,000 $ (24,013 )
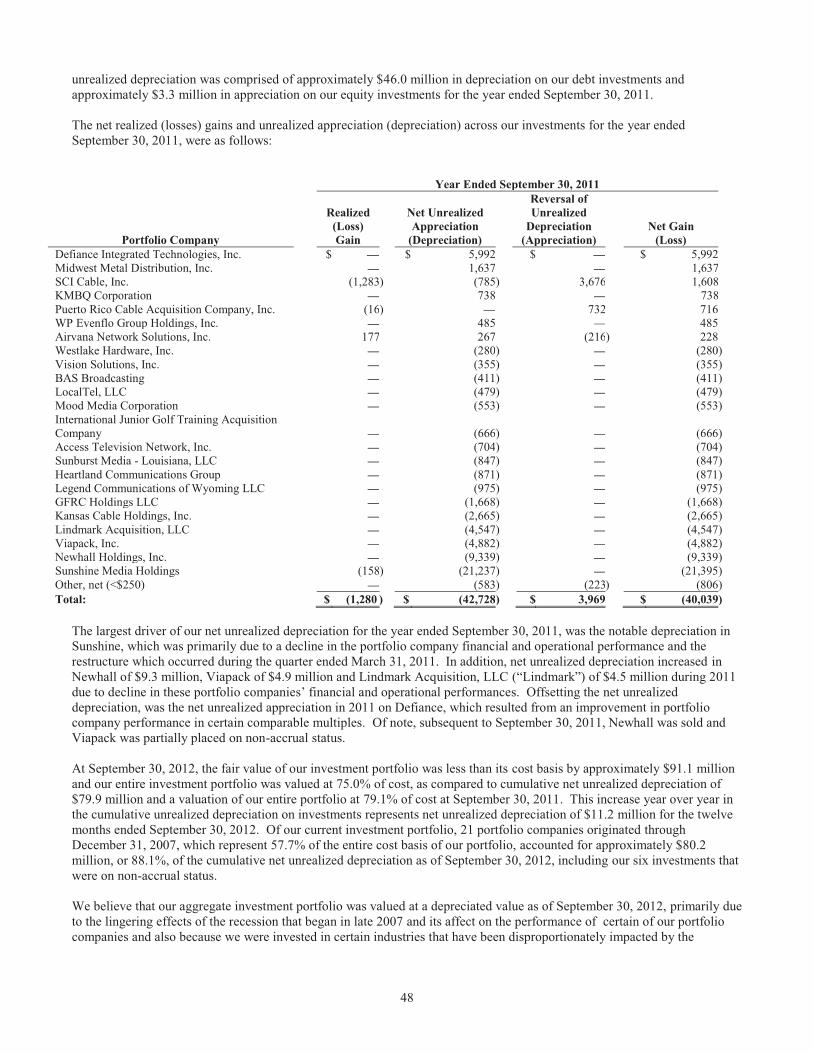
48
unrealized depreciation was comprised of approximately $46.0 million in depreciation on our debt investments and approximately $3.3 million in appreciation on our equity investments for the year ended September 30, 2011. The net realized (losses) gains and unrealized appreciation (depreciation) across our investments for the year ended September 30, 2011, were as follows:
Year Ended September 30, 2011
Portfolio Company
Realized
(Loss) Gain
Net Unrealized Appreciation
(Depreciation)
Reversal of Unrealized
Depreciation (Appreciation)
Net Gain (Loss)
Defiance Integrated Technologies, Inc. $ — $ 5,992 $ — $ 5,992 Midwest Metal Distribution, Inc. — 1,637 — 1,637SCI Cable, Inc. (1,283) (785 ) 3,676 1,608KMBQ Corporation — 738 — 738Puerto Rico Cable Acquisition Company, Inc. (16) — 732 716 WP Evenflo Group Holdings, Inc. — 485 — 485 Airvana Network Solutions, Inc. 177 267 (216) 228 Westlake Hardware, Inc. — (280 ) — (280 ) Vision Solutions, Inc. — (355 ) — (355 ) BAS Broadcasting — (411 ) — (411 ) LocalTel, LLC — (479 ) — (479 ) Mood Media Corporation — (553 ) — (553 ) International Junior Golf Training Acquisition Company
— (666 ) — (666 )
Access Television Network, Inc. — (704 ) — (704 ) Sunburst Media - Louisiana, LLC — (847 ) — (847 ) Heartland Communications Group — (871 ) — (871 ) Legend Communications of Wyoming LLC — (975 ) — (975 ) GFRC Holdings LLC — (1,668 ) — (1,668 ) Kansas Cable Holdings, Inc. — (2,665 ) — (2,665 ) Lindmark Acquisition, LLC — (4,547 ) — (4,547 ) Viapack, Inc. — (4,882 ) — (4,882 ) Newhall Holdings, Inc. — (9,339 ) — (9,339 ) Sunshine Media Holdings (158) (21,237 ) — (21,395 ) Other, net (<$250) — (583 ) (223) (806 ) Total: $ (1,280 ) $ (42,728 ) $ 3,969 $ (40,039 )
The largest driver of our net unrealized depreciation for the year ended September 30, 2011, was the notable depreciation in Sunshine, which was primarily due to a decline in the portfolio company financial and operational performance and the restructure which occurred during the quarter ended March 31, 2011. In addition, net unrealized depreciation increased in Newhall of $9.3 million, Viapack of $4.9 million and Lindmark Acquisition, LLC (“Lindmark”) of $4.5 million during 2011 due to decline in these portfolio companies’ financial and operational performances. Offsetting the net unrealized depreciation, was the net unrealized appreciation in 2011 on Defiance, which resulted from an improvement in portfolio company performance in certain comparable multiples. Of note, subsequent to September 30, 2011, Newhall was sold and Viapack was partially placed on non-accrual status. At September 30, 2012, the fair value of our investment portfolio was less than its cost basis by approximately $91.1 million and our entire investment portfolio was valued at 75.0% of cost, as compared to cumulative net unrealized depreciation of $79.9 million and a valuation of our entire portfolio at 79.1% of cost at September 30, 2011. This increase year over year in the cumulative unrealized depreciation on investments represents net unrealized depreciation of $11.2 million for the twelve months ended September 30, 2012. Of our current investment portfolio, 21 portfolio companies originated through December 31, 2007, which represent 57.7% of the entire cost basis of our portfolio, accounted for approximately $80.2 million, or 88.1%, of the cumulative net unrealized depreciation as of September 30, 2012, including our six investments that were on non-accrual status. We believe that our aggregate investment portfolio was valued at a depreciated value as of September 30, 2012, primarily due to the lingering effects of the recession that began in late 2007 and its affect on the performance of certain of our portfolio companies and also because we were invested in certain industries that have been disproportionately impacted by the
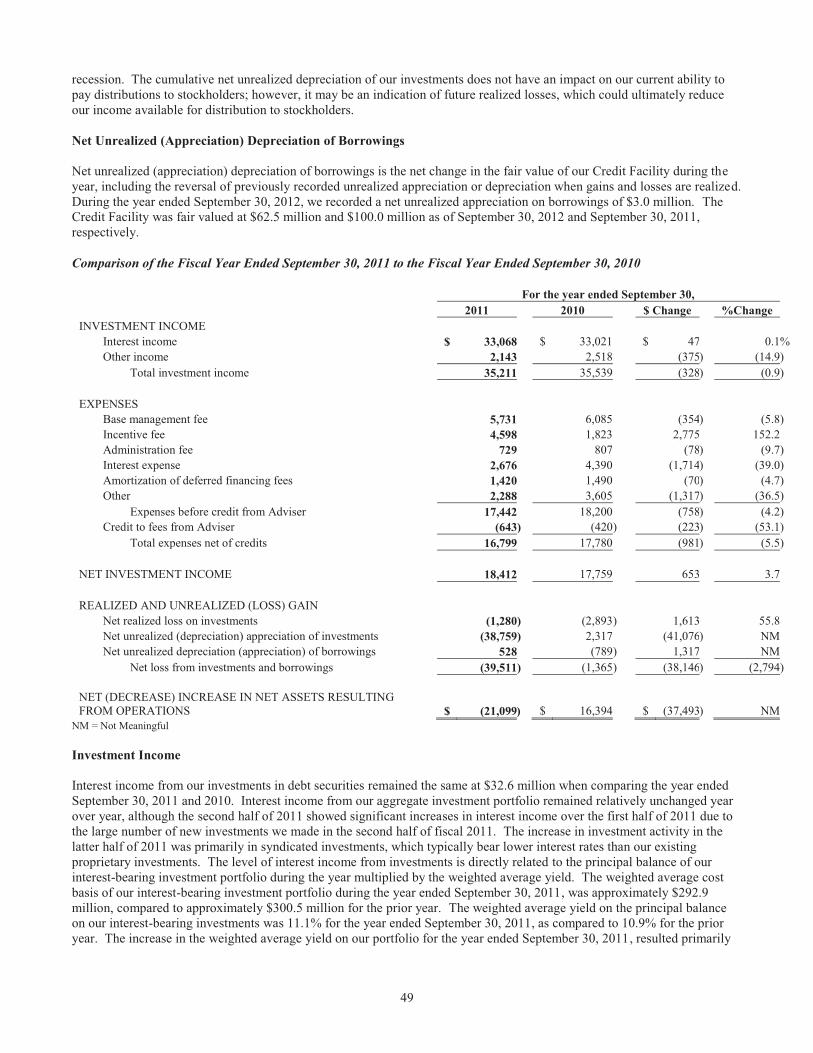
49
recession. The cumulative net unrealized depreciation of our investments does not have an impact on our current ability to pay distributions to stockholders; however, it may be an indication of future realized losses, which could ultimately reduce our income available for distribution to stockholders. Net Unrealized (Appreciation) Depreciation of Borrowings Net unrealized (appreciation) depreciation of borrowings is the net change in the fair value of our Credit Facility during the year, including the reversal of previously recorded unrealized appreciation or depreciation when gains and losses are realized. During the year ended September 30, 2012, we recorded a net unrealized appreciation on borrowings of $3.0 million. The Credit Facility was fair valued at $62.5 million and $100.0 million as of September 30, 2012 and September 30, 2011, respectively. Comparison of the Fiscal Year Ended September 30, 2011 to the Fiscal Year Ended September 30, 2010
For the year ended September 30, 2011 2010 $ Change %Change INVESTMENT INCOME
Interest income $ 33,068 $ 33,021 $ 47 0.1 % Other income 2,143 2,518 (375) (14.9 )
Total investment income 35,211 35,539 (328) (0.9 ) EXPENSES
Base management fee 5,731 6,085 (354) (5.8 ) Incentive fee 4,598 1,823 2,775 152.2 Administration fee 729 807 (78) (9.7 ) Interest expense 2,676 4,390 (1,714) (39.0 ) Amortization of deferred financing fees 1,420 1,490 (70) (4.7 ) Other 2,288 3,605 (1,317) (36.5 )
Expenses before credit from Adviser 17,442 18,200 (758) (4.2 ) Credit to fees from Adviser (643) (420 ) (223) (53.1 )
Total expenses net of credits 16,799 17,780 (981) (5.5 ) NET INVESTMENT INCOME 18,412 17,759 653 3.7 REALIZED AND UNREALIZED (LOSS) GAIN
Net realized loss on investments (1,280) (2,893 ) 1,613 55.8 Net unrealized (depreciation) appreciation of investments (38,759) 2,317 (41,076) NM Net unrealized depreciation (appreciation) of borrowings 528 (789 ) 1,317 NM
Net loss from investments and borrowings (39,511) (1,365 ) (38,146) (2,794 ) NET (DECREASE) INCREASE IN NET ASSETS RESULTING FROM OPERATIONS $ (21,099) $ 16,394 $ (37,493) NM
NM = Not Meaningful Investment Income Interest income from our investments in debt securities remained the same at $32.6 million when comparing the year ended September 30, 2011 and 2010. Interest income from our aggregate investment portfolio remained relatively unchanged year over year, although the second half of 2011 showed significant increases in interest income over the first half of 2011 due to the large number of new investments we made in the second half of fiscal 2011. The increase in investment activity in the latter half of 2011 was primarily in syndicated investments, which typically bear lower interest rates than our existing proprietary investments. The level of interest income from investments is directly related to the principal balance of our interest-bearing investment portfolio during the year multiplied by the weighted average yield. The weighted average cost basis of our interest-bearing investment portfolio during the year ended September 30, 2011, was approximately $292.9 million, compared to approximately $300.5 million for the prior year. The weighted average yield on the principal balance on our interest-bearing investments was 11.1% for the year ended September 30, 2011, as compared to 10.9% for the prior year. The increase in the weighted average yield on our portfolio for the year ended September 30, 2011, resulted primarily
50
from the repayment of loans with lower stated interest rates and the restructuring of certain loans into higher interest rate loans, partially offset by the purchase of syndicated loans, which generally bear lower interest rates than our existing proprietary debt investments. We had a net increase of two portfolio companies on non-accrual status as of September 30, 2011, as compared to September 30, 2010. As of September 30, 2011, eight portfolio companies were on non-accrual with an aggregate debt cost basis of approximately $41.1 million, or 11.0% of the cost basis of all debt investments in our portfolio. As of September 30, 2010, six portfolio companies were on non-accrual with an aggregate debt cost basis of approximately $29.9 million, or 10.2% of the cost basis of all debt investments in our portfolio. Interest income from notes to certain employees of the Adviser, in connection with the exercise of employee stock options, decreased slightly, primarily as a result of significant repayments on the principal amounts in 2011. These decreases were offset almost entirely by increases in the interest rates on the loans due to the fact that certain significant loans were in default, triggering penalty interest provisions for all of fiscal 2011. Other income decreased for the year ended September 30, 2011 as compared to the prior year, mainly due to decreases in success fees, which we recognize when payment is received. Success fees earned during the year ended September 30, 2011 totaled $1.0 million, which we received primarily from Interfilm and Pinnacle for actual exits in 2011, and also from Westlake as a prepaid success fee. In addition, we received an aggregate of $1.0 million from two legal settlements related to portfolio companies during the year ended September 30, 2011 that were recorded in other income. Success fees earned during the year ended September 30, 2010 totaled $1.9 million, which we received from ActivStyle Acquisition Co., Anitox Acquisition Co., Doe & Ingalls Management LLC, Tulsa Welding School and Visual Edge Technology, Inc. for actual exits and from Saunders & Associates and Northern Contours, Inc. as prepayments. The following table lists the investment income for our five largest portfolio company investments at fair value during the respective years:
As of September 30, 2011 Year Ended September 30, 2011
Portfolio Company Fair Value
% of Portfolio
Investment
Income
% of Total Investment
Income Reliable Biopharmaceutical Holdings, Inc. $ 25,295 8.3% $ 3,090 8.8% Westlake Hardware, Inc. 19,340 6.4 2,935 8.3 Midwest Metal Distribution, Inc. 17,184 5.7 2,242 Defiance Integrated Technologies, Inc. 15,039 5.0 888 2.5 CMI Acquisition, LLC 14,336 4.7 1,038 3.0
Subtotal—five largest investments 91,194 30.1 10,193 29.0 Other portfolio companies 211,753 69.9 24,586 69.8 Other non-portfolio company income — — 432 1.2
Total investment portfolio $ 302,947 100.0% $ 35,211 100.0%
As of September 30, 2010 Year Ended September 30, 2010
Portfolio Company Fair Value
% of Portfolio
Investment
Income
% of Total Investment
Income Sunshine Media, Inc. $ 27,286 10.6% $ 3,254 9.1% Reliable Biopharmaceutical Holdings, Inc. 26,574 10.3 3,003 8.4 Westlake Hardware, Inc. 19,620 7.6 2,940 8.3 Midwest Metal Distribution, Inc. 15,539 6.0 2,127 6.0 Winchester Electronics Co. 12,508 4.9 1,589 4.5
Subtotal—five largest investments 101,527 39.4 12,913 36.3 Other portfolio companies 155,582 60.6 22,036 62.0 Other non-portfolio company income — — 590 1.7
Total investment portfolio $ 257,109 100.0% $ 35,539 100.0%
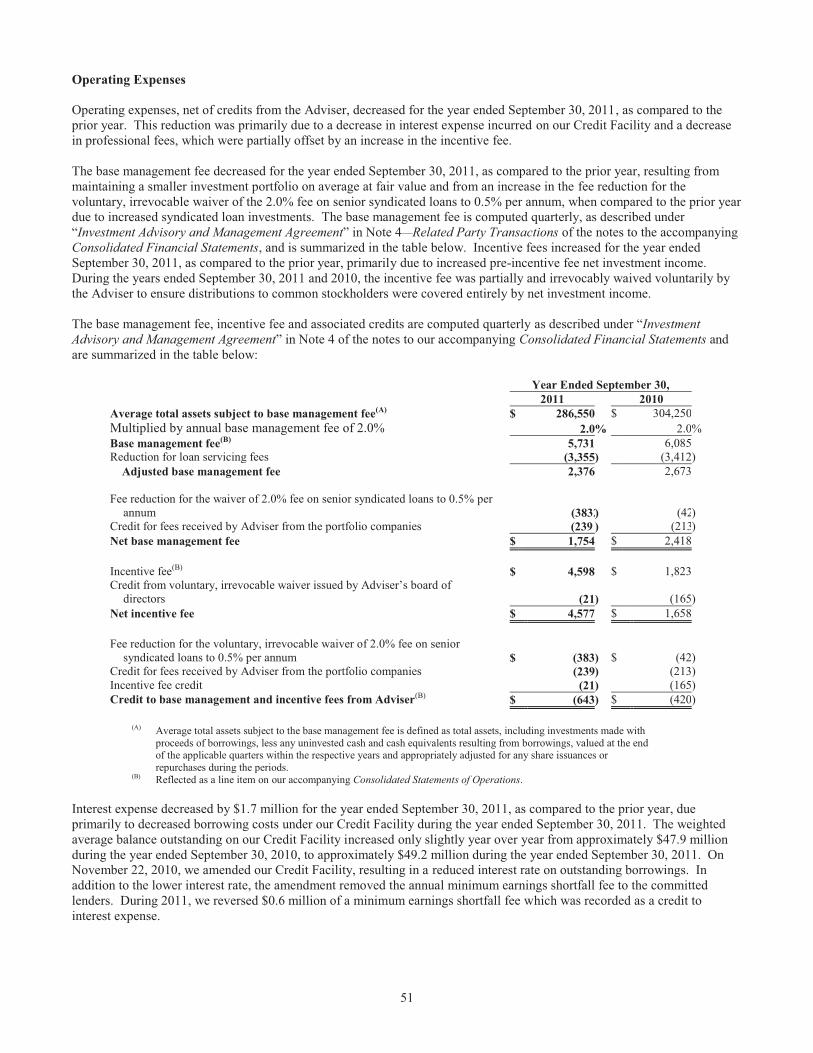
51
Operating Expenses Operating expenses, net of credits from the Adviser, decreased for the year ended September 30, 2011, as compared to the prior year. This reduction was primarily due to a decrease in interest expense incurred on our Credit Facility and a decrease in professional fees, which were partially offset by an increase in the incentive fee. The base management fee decreased for the year ended September 30, 2011, as compared to the prior year, resulting from maintaining a smaller investment portfolio on average at fair value and from an increase in the fee reduction for the voluntary, irrevocable waiver of the 2.0% fee on senior syndicated loans to 0.5% per annum, when compared to the prior year due to increased syndicated loan investments. The base management fee is computed quarterly, as described under “Investment Advisory and Management Agreement” in Note 4—Related Party Transactions of the notes to the accompanying Consolidated Financial Statements, and is summarized in the table below. Incentive fees increased for the year ended September 30, 2011, as compared to the prior year, primarily due to increased pre-incentive fee net investment income. During the years ended September 30, 2011 and 2010, the incentive fee was partially and irrevocably waived voluntarily by the Adviser to ensure distributions to common stockholders were covered entirely by net investment income. The base management fee, incentive fee and associated credits are computed quarterly as described under “Investment Advisory and Management Agreement” in Note 4 of the notes to our accompanying Consolidated Financial Statements and are summarized in the table below:
Year Ended September 30, 2011 2010 Average total assets subject to base management fee(A) $ 286,550 $ 304,250 Multiplied by annual base management fee of 2.0% 2.0% 2.0 % Base management fee(B) 5,731 6,085 Reduction for loan servicing fees (3,355) (3,412 )
Adjusted base management fee 2,376 2,673 Fee reduction for the waiver of 2.0% fee on senior syndicated loans to 0.5% per
annum (3832) (42) Credit for fees received by Adviser from the portfolio companies (239 ) (213) Net base management fee $ 1,754 $ 2,418 Incentive fee(B) $ 4,598 $ 1,823 Credit from voluntary, irrevocable waiver issued by Adviser’s board of
directors (21) (165 ) Net incentive fee $ 4,577 $ 1,658 Fee reduction for the voluntary, irrevocable waiver of 2.0% fee on senior
syndicated loans to 0.5% per annum $ (383 ) $ (42 ) Credit for fees received by Adviser from the portfolio companies (239) (213 ) Incentive fee credit (21) (165 ) Credit to base management and incentive fees from Adviser(B) $ (643 ) $ (420 )
(A) Average total assets subject to the base management fee is defined as total assets, including investments made with proceeds of borrowings, less any uninvested cash and cash equivalents resulting from borrowings, valued at the end of the applicable quarters within the respective years and appropriately adjusted for any share issuances or repurchases during the periods.
(B) Reflected as a line item on our accompanying Consolidated Statements of Operations. Interest expense decreased by $1.7 million for the year ended September 30, 2011, as compared to the prior year, due primarily to decreased borrowing costs under our Credit Facility during the year ended September 30, 2011. The weighted average balance outstanding on our Credit Facility increased only slightly year over year from approximately $47.9 million during the year ended September 30, 2010, to approximately $49.2 million during the year ended September 30, 2011. On November 22, 2010, we amended our Credit Facility, resulting in a reduced interest rate on outstanding borrowings. In addition to the lower interest rate, the amendment removed the annual minimum earnings shortfall fee to the committed lenders. During 2011, we reversed $0.6 million of a minimum earnings shortfall fee which was recorded as a credit to interest expense.
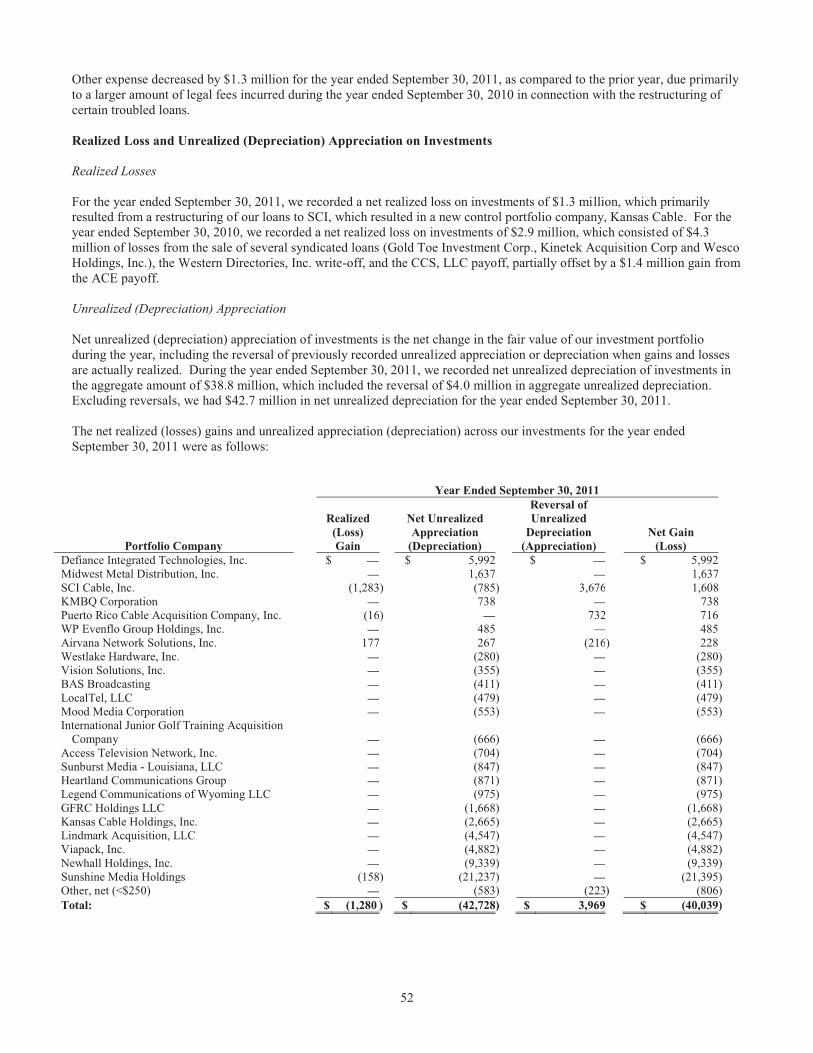
52
Other expense decreased by $1.3 million for the year ended September 30, 2011, as compared to the prior year, due primarily to a larger amount of legal fees incurred during the year ended September 30, 2010 in connection with the restructuring of certain troubled loans. Realized Loss and Unrealized (Depreciation) Appreciation on Investments Realized Losses For the year ended September 30, 2011, we recorded a net realized loss on investments of $1.3 million, which primarily resulted from a restructuring of our loans to SCI, which resulted in a new control portfolio company, Kansas Cable. For the year ended September 30, 2010, we recorded a net realized loss on investments of $2.9 million, which consisted of $4.3 million of losses from the sale of several syndicated loans (Gold Toe Investment Corp., Kinetek Acquisition Corp and Wesco Holdings, Inc.), the Western Directories, Inc. write-off, and the CCS, LLC payoff, partially offset by a $1.4 million gain from the ACE payoff. Unrealized (Depreciation) Appreciation Net unrealized (depreciation) appreciation of investments is the net change in the fair value of our investment portfolio during the year, including the reversal of previously recorded unrealized appreciation or depreciation when gains and losses are actually realized. During the year ended September 30, 2011, we recorded net unrealized depreciation of investments in the aggregate amount of $38.8 million, which included the reversal of $4.0 million in aggregate unrealized depreciation. Excluding reversals, we had $42.7 million in net unrealized depreciation for the year ended September 30, 2011. The net realized (losses) gains and unrealized appreciation (depreciation) across our investments for the year ended September 30, 2011 were as follows:
Year Ended September 30, 2011
Portfolio Company
Realized
(Loss) Gain
Net Unrealized Appreciation
(Depreciation)
Reversal of Unrealized
Depreciation (Appreciation)
Net Gain (Loss)
Defiance Integrated Technologies, Inc. $ — $ 5,992 $ — $ 5,992 Midwest Metal Distribution, Inc. — 1,637 — 1,637SCI Cable, Inc. (1,283) (785 ) 3,676 1,608KMBQ Corporation — 738 — 738Puerto Rico Cable Acquisition Company, Inc. (16) — 732 716 WP Evenflo Group Holdings, Inc. — 485 — 485 Airvana Network Solutions, Inc. 177 267 (216) 228 Westlake Hardware, Inc. — (280 ) — (280 ) Vision Solutions, Inc. — (355 ) — (355 ) BAS Broadcasting — (411 ) — (411 ) LocalTel, LLC — (479 ) — (479 ) Mood Media Corporation — (553 ) — (553 ) International Junior Golf Training Acquisition
Company
— (666 ) — (666 ) Access Television Network, Inc. — (704 ) — (704 ) Sunburst Media - Louisiana, LLC — (847 ) — (847 ) Heartland Communications Group — (871 ) — (871 ) Legend Communications of Wyoming LLC — (975 ) — (975 ) GFRC Holdings LLC — (1,668 ) — (1,668 ) Kansas Cable Holdings, Inc. — (2,665 ) — (2,665 ) Lindmark Acquisition, LLC — (4,547 ) — (4,547 ) Viapack, Inc. — (4,882 ) — (4,882 ) Newhall Holdings, Inc. — (9,339 ) — (9,339 ) Sunshine Media Holdings (158) (21,237 ) — (21,395 ) Other, net (<$250) — (583 ) (223) (806 ) Total: $ (1,280 ) $ (42,728 ) $ 3,969 $ (40,039 )
53
The largest driver of our net unrealized depreciation for the year ended September 30, 2011, was the notable unrealized depreciation in Sunshine, which was primarily due to a decline in the portfolio company financial and operational performance and the restructure which occurred during the quarter ended March 31, 2011. In addition, net unrealized depreciation increased across Newhall of $9.3 million, Viapack of $4.9 million and Lindmark of $4.5 million during 2011 due to decline in these portfolio companies’ financial and operational performances. Offsetting the net unrealized depreciation, was the net unrealized appreciation in 2011 on Defiance, which resulted from an improvement in portfolio company performance in certain comparable multiples. The net realized (losses) gains and unrealized appreciation (depreciation) across our investments for the year ended September 30, 2010 were as follows:
Year Ended September 30, 2010
Portfolio Company
Realized
Gain (Loss)
Net Unrealized Appreciation
(Depreciation)
Reversal of Unrealized
Depreciation (Appreciation)
Net Gain (Loss)
Visual Edge Technology, Inc. $ — $ 54 $ 1,662 $ 1,716Ace Expediters, Inc. 1,367 (16 ) (105) 1,246BAS Broadcasting — 639 475 1,114Westlake Hardware, Inc. — 951 — 951Clinton Holdings, LLC — 888 — 888WP Evenflo Group Holdings, Inc. — 826 — 826 Puerto Rico Cable Acquisition Company, Inc. — 729 — 729 Defiance Integrated Technologies, Inc. — 727 — 727 Northern Contours, Inc. — 613 — 613 Pinnacle Treatment Centers, Inc. — 534 — 534 Allison Publications, LLC — 425 — 425Global Materials Technologies, Inc. — 259 — 259CCS, LLC (312) 193 312 193Kinetek Acquisition Corp. (513) — 513 —Wesco Holdings, Inc. (408) — 408 —Western Directories, Inc (2,865) (46 ) 2,865 (46) Sunshine Media Holdings — (265 ) — (265) Precision Acquisitions Group Holdings, Inc. — (337 ) — (337) BERTL, Inc. — (390 ) — (390) SCI Cable, Inc. — (585 ) — (585) Sunburst Media – Louisiana, LLC — (696 ) — (696) KMBQ Corporation — (807 ) — (807) Finn Corporation — (939 ) — (939) LocalTel, LLC — (1,381 ) — (1,381) Legend Communications of Wyoming LLC — (2,632 ) 112 (2,520) Lindmark Acquisition, LLC — (4,803 ) — (4,803) Other, net (<$250) (162) 1,965 169 1,972 Total: $ (2,893 ) $ (4,094) $ 6,411 $ (576 )
The largest driver of our net unrealized depreciation for the year ended September 30, 2010, was the unrealized depreciation in Lindmark of $4.8 million and Legend Communications of Wyoming LLC of $2.6 million, both primarily due to a decline in these portfolio companies’ financial and operational performance. At September 30, 2011, the fair value of our investment portfolio was less than its cost basis by approximately $79.9 million and our entire investment portfolio was valued at 79.1% of cost, as compared to cumulative net unrealized depreciation of $41.1 million, and a valuation of our entire portfolio at 86.2% of cost at September 30, 2010. This increase year over year in the cumulative unrealized depreciation on investments represents net unrealized depreciation of $38.8 million for the twelve months ended September 30, 2011. We believe that our aggregate investment portfolio was valued at a depreciated value as of September 30, 2011, due primarily to the lingering effects of the recession that began in late 2007 and its affect on the performances of certain of our portfolio companies and also because we were invested in certain industries that have been disproportionately impacted by the recession.
54
Net Unrealized Depreciation (Appreciation) on Borrowings Net unrealized depreciation (appreciation) of borrowings is the net change in the fair value of our Credit Facility during the year, including the reversal of previously recorded unrealized appreciation or depreciation when gains and losses are realized. During the year ended September 30, 2011, we recorded a net unrealized depreciation on borrowings of $0.5 million. Our Credit Facility was fair valued at $100.0 million and $17.9 million as of September 30, 2011 and September 30, 2010, respectively. LIQUIDITY AND CAPITAL RESOURCES
Operating Activities
Net cash provided by operating activities for the year ended September 30, 2012, was $26.2 million as compared to net cash used in operating activities for the year ended September 30, 2011, of $68.4 million. The increase in cash from operating activities was primarily due to the decrease in purchases of investments and the increase in scheduled and unscheduled principal repayments on investments and proceeds from sales of investments when comparing the two years. The large increase in originations in the second half of fiscal year 2011 contributed to an increase in interest income during the year ended September 30, 2012. The majority of cash from operating activities is generated from the interest and principal payments on debt securities that we receive from our portfolio companies. We utilize this cash primarily to fund new investments, make interest payments on our Credit Facility, make distributions to our stockholders, pay management fees to the Adviser and pay for other operating expenses. For the year ended September 30, 2010, net cash provided by operating activities was $86.5 million and primarily resulted from scheduled and unscheduled principal repayments on investments, partially offset by the purchase of investments. As of September 30, 2012, we had investments in loans to, equity of, or syndicated participations in, 50 private companies, with an aggregate cost basis of approximately $365.0 million. As of September 30, 2011, we had investments in, loans to, equity of, or syndicated participations in, 59 private companies with an aggregate cost basis of approximately $382.8 million.
The following table summarizes our total portfolio investment activity during the years ended September 30, 2012 and 2011:
Year Ended September 30, 2012 2011 Beginning investment portfolio at fair value $ 302,947 $ 257,109 New investments 45,050 110,903 Disbursements to existing portfolio companies 23,891 25,351 Scheduled principal repayments (7,149 ) (7,004 ) Unscheduled principal repayments (60,221 ) (38,831 ) Proceeds from sales (6,487 ) (4,167 ) Increase in investment balance due to paid in kind interest — 12 Increase in investment balance due to rolled-over interest — 204 Loan impairment / contra-investment — 715 Net unrealized (depreciation) (28,194 ) (42,728 ) Reversal of prior period net depreciation on realization 17,000 3,969 Net realized loss (12,998 ) (1,119 ) Amortization of premiums and discounts 121 (1,467 )
Ending Investment Portfolio at Fair Value $ 273,960 $ 302,947 The following table summarizes the contractual principal repayment and maturity of our investment portfolio by fiscal year, assuming no voluntary prepayments, at September 30, 2012.
Fiscal Year Ending September 30, Amount 2013 $ 101,318 2014 56,719 2015 27,398 2016 64,628 2017 51,560 Thereafter 53,500
Total Contractual Repayments $ 355,123 Equity Investments 10,966 Adjustments to cost basis on debt investments (1,068 )
Total Cost Basis of Investments Held at September 30, 2012: $ 365,021
55
Financing Activities
Net cash used in financing activities for the fiscal year ended September 30, 2012 was $22.8 million and consisted primarily of net repayments on our Credit Facility of $40.6 million, net of distributions to common stockholders of $17.7 million. These financing activities were partially offset by proceeds from the issuance of Term Preferred Stock of $38.5 million in November 2011.
Net cash provided by financing activities for the fiscal year ended September 30, 2011 was $67.4 million and primarily consisted of net borrowings on our Credit Facility of $82.6 million, partially offset by distributions to common stockholders of $17.7 million.
Net cash used in financing activities for the fiscal year ended September 30, 2010 was $84.0 million and primarily consisted of net repayments on our Credit Facility of $66.2 million, net of distributions to common stockholders of $17.7 million.
Distributions
To qualify as a RIC and thus avoid corporate level tax on the income we distribute to our stockholders, we are required, under Subchapter M of the Code, to distribute at least 90% of our ordinary income and short-term capital gains to our stockholders on an annual basis. In accordance with these requirements, we declared and paid monthly cash distributions of $0.07 per common share for each month during the years ended September 30, 2012 and 2011. From October 2008 through March 2009 and from April 2009 through September 2009, we declared and paid monthly cash distributions of $0.14 and $0.07 per common share, respectively.
For the years ended September 30, 2012 and 2011, our distribution payments were approximately $17.7 million, respectively. We declared these distributions based on our estimates of net investment income for the fiscal year.
Section 19(a) Disclosure Our Board of Directors estimates the source of the distributions at the time of their declaration as required by Section 19(a) of the 1940 Act. On a monthly basis, if conditions dictate under Section 19(a), we post a Section 19(a) notice through the Depository Trust Company's Legal Notice System (“LENS”) and also send to our registered stockholders a written Section 19(a) notice along with the payment of distributions for any payment which includes a distribution estimated to be paid from any source other than net investment income. The estimates of the source of the distribution are interim estimates based on U.S. GAAP that are subject to revision, and the exact character of the distributions for tax purposes cannot be determined until the final books and records are finalized for the calendar year. Following the calendar year end, after definitive information has been determined by us, if we have made distributions of taxable income (or return of capital), we will deliver a Form 1099-DIV to our stockholders specifying such amount and the tax characterization of such amount. Therefore, these estimates are made solely in order to comply with the requirements of Section 19(a) of the 1940 Act and should not be relied upon for tax reporting or any other purposes and could differ significantly from the actual character of distributions for tax purposes. Equity
On October 20, 2009, we filed a registration statement (the “Registration Statement”) on Form N-2 (File No. 333-162592) that was amended on December 9, 2009, and which the SEC declared effective on January 28, 2010. Post-effective amendments dated July 13, 2011 (declared effective by the SEC on January 28, 2010) and dated June 4, 2012 (declared effective by the SEC on June 11, 2012) were also filed under this Registration Statement. The Registration Statement permits us to issue, through one or more transactions, up to an aggregate of $300.0 million in securities, consisting of common stock, preferred stock, subscription rights, debt securities and warrants to purchase common stock, including through a combined offering of such securities. On October 31, 2011, pursuant to the terms of our articles of incorporation, as amended, our Board of Directors approved reclassifying 4.0 million shares from common stock to preferred stock, in connection with our Term Preferred Stock offering. To date, under the Registration Statement, we have issued $38.5 million in Term Preferred Stock.
56
Common Stock On May 17, 2010, we and the Adviser entered into an equity distribution agreement (the “Agreement”) with BB&T Capital Markets, a division of Scott & Stringfellow, LLC (the “Agent”), under which we could, from time to time, issue and sell through the Agent, as sales agent, up to 2.0 million shares of our common stock, par value $0.001 per share. At September 30, 2012, we had not issued any shares pursuant to this Agreement and in October 2012, we terminated this agreement. Prepaid costs of $0.2 million related to the origination of this agreement were expensed in the three months ended September 30, 2012. We anticipate issuing equity securities to obtain additional capital in the future. However, we cannot determine the terms of any future equity issuances or whether we will be able to issue equity on terms favorable to us, or at all. Additionally, when our common stock is trading below NAV, as it has consistently traded over the last three years, we will have regulatory constraints under the 1940 Act on our ability to obtain additional capital in this manner. Generally, the 1940 Act provides that we may not issue and sell our common stock at a price below our then current NAV per common share, other than to our then existing common stockholders pursuant to a rights offering, without first obtaining approval from our stockholders and our independent directors. As of September 30, 2012, our NAV per common share was $8.98 and as of November 9, 2012 our closing market price was $8.47 per common share. To the extent that our common stock trades at a market price below our NAV per common share, we will generally be precluded from raising equity capital through public offerings of our common stock, other than pursuant to stockholder approval or a rights offering. At our Annual Meeting of Stockholders held on February 16, 2012, our stockholders approved a proposal that authorizes us to sell shares of our common stock at a price below our then current NAV per common share for a period of one year, provided that our Board of Directors makes certain determinations prior to any such sale. We have not issued any common stock since February 2008 and have never issued common stock below NAV per common share. At the upcoming annual stockholders meeting scheduled for February 14 2013, our stockholders will again be asked to vote in favor of renewing this proposal for another year. Term Preferred Stock Pursuant to our Registration Statement, in November 2011, we completed an offering of 1.5 million shares of Term Preferred Stock at a public offering price of $25.00 per share. Gross proceeds totaled $38.5 million and net proceeds, after deducting underwriting discounts and offering expenses borne by us were approximately $36.4 million and were used to repay a portion of outstanding borrowings under our Credit Facility. We incurred $2.1 million in total offering costs related to these transactions, which have been recorded as an asset in accordance with GAAP and amortized over the redemption period ending December 31, 2016. No preferred stock had been issued prior to this issuance. Our Term Preferred Stock provides for a fixed dividend equal to 7.125% per year, payable monthly (which equates to approximately $2.7 million per year). We are required to redeem all of the outstanding Term Preferred Stock on December 31, 2016 for cash at a redemption price equal to $25.00 per share plus an amount equal to accumulated but unpaid dividends, if any, to the date of redemption. The Term Preferred Stock has a preference over our common stock with respect to these dividends, whereby no distributions are payable on our common stock unless the stated dividends, including any accrued and unpaid dividends, on the Term Preferred Stock have been paid in full. In addition, there are two other potential redemption triggers for our Term Preferred Stock: (1) if we fail to maintain an asset coverage ratio (as calculated under Section 18(h) of the 1940 Act) of at least 200%, we are required to redeem a portion of the outstanding Term Preferred Stock or otherwise cure the ratio redemption trigger; and (2) at our sole option, at any time on or after December 31, 2012. The Term Preferred Stock has been recorded as a liability in accordance with GAAP and, as such, affects our asset coverage, exposing us to additional leverage risks. In addition, the Term Preferred Stock is not convertible into our common stock or any other security. The Term Preferred Stock is currently traded on the NASDAQ with a trading symbol of “GLADP.” Revolving Credit Facility
On January 19, 2012, we, through Business Loan, entered into Amendment No. 3 to our Credit Facility, to extend the maturity date of our $137.0 million revolving line of credit from March 15, 2012 to January 19, 2015. Our Credit Facility was arranged by Keybank as administrative agent and BB&T and ING also joined our Credit Facility as committed lenders. Subject to certain terms and conditions, our Credit Facility may be expanded to a maximum of $237.0 million through the addition of other committed lenders thereto. The interest rates remained unchanged with advances under our Credit Facility
57
generally bearing interest at a 30-day LIBOR subject to a minimum rate of 1.5%, plus 3.75% per annum, with a commitment fee of 0.5% per annum on undrawn amounts when the facility is drawn more than 50% and 1.0% per annum on undrawn amounts when the facility is drawn less than 50%. If our Credit Facility is not renewed or extended by January 19, 2015, all principal and interest will be due and payable on or before January 19, 2016. All other terms of our Credit Facility remained substantially unchanged. We incurred fees of $1.5 million in January 2012 in connection with this amendment. Interest is payable monthly during the term of our Credit Facility. Available borrowings are subject to various constraints imposed under our Credit Facility, based on the aggregate loan balance pledged by Business Loan, which varies as loans are added and repaid, regardless of whether such repayments are prepayments or made as contractually required. The administrative agent also requires that any interest or principal payments on pledged loans be remitted directly by the borrower into a lockbox account with Keybank as custodian. Keybank, who also serves as the trustee of the account, generally remits the collected funds to us once a month. Our Credit Facility contains covenants that require Business Loan to maintain its status as a separate legal entity, prohibit certain significant corporate transactions (such as mergers, consolidations, liquidations or dissolutions), and restrict material changes to our credit and collection policies. Our Credit Facility also limits payments on distributions to the aggregate net investment income for each of the twelve month periods ending September 30, 2012, 2013, 2014, and 2015. Business Loan is also subject to certain limitations on the type of loan investments it can apply toward availability credit in the borrowing base, including restrictions on geographic concentrations, sector concentrations, loan size, distribution payout, payment frequency and status, average life and lien property. Our Credit Facility further requires Business Loan to comply with other financial and operational covenants, which obligate Business Loan to, among other things, maintain certain financial ratios, including asset and interest coverage and a minimum number of obligors required in the borrowing base of the credit agreement. Additionally, we are subject to a performance guaranty that requires us to maintain (i) a minimum net worth (as defined in the Credit Facility, this includes our Term Preferred Stock) of $190.0 million plus 50.0% of all equity and subordinated debt raised after January 19, 2002, (ii) asset coverage with respect to senior securities representing indebtedness of at least 200%, in accordance with Section 18 of the 1940 Act and (iii) our status as a BDC under the 1940 Act and as a RIC under the Code. At September 30, 2012, we had a minimum net worth of $227.1 million, an asset coverage of 296.3% and an active status as a BDC and RIC, as each is defined in the performance guaranty of our Credit Facility. Our Credit Facility requires a minimum of 20 obligors in the borrowing base and as of September 30, 2012, Business Loan had 34 obligors. As of September 30, 2012, we were in compliance with all of the facility covenants. Contractual Obligations and Off-Balance Sheet Arrangements
We have lines of credit with certain of our portfolio companies that have not been fully drawn or called, respectively. Since these commitments have expiration dates and we expect many will never be fully drawn, the total commitment amounts do not necessarily represent future cash requirements. In addition to the lines of credit with our portfolio companies, we, from time to time, have also extended certain guarantees on behalf of some our portfolio companies during the normal course of business. As of September 30, 2012, we had one guarantee outstanding to Viapack up to a maximum of $0.3 million. As of September 30, 2012, we have not been required to make any payments on this guarantee and we consider the credit risks to be remote. As of September 30, 2011, we were not party to any signed guarantees. We estimate the fair value of our unused line of credit commitments and guarantee as of September 30, 2012 to be minimal; and therefore, they are not recorded on our accompanying Consolidated Statements of Assets and Liabilities.
58
The following table shows our contractual obligations as of September 30, 2012 at cost: Payments Due by Period
Contractual Obligations(A) Less than
1 Year 1-3 Years 4-5 Years
After 5 Years
Total Credit Facility(B) $ — $ 58,800 $ — $ — $ 58,800 Term Preferred Stock, $0.001 par
value, $25 liquidation preference; 4,000,000 authorized and 1,539,882 shares issued and outstanding
— — 38,497 — 38,497 Interest on debt obligations(C) 6,666 17,273 914 — 24,853 Total $ 6,666 $ 76,073 $ 39,411 $ — $ 122,150
(A) Excludes our unused line of credit commitments and guarantee to our portfolio companies in an aggregate amount of $5.2 million as of September 30, 2012.
(B) Principal balance of borrowings outstanding under our Credit Facility, based on the current contractual maturity due to the revolving nature of the facility.
(C) Includes estimated interest payments on our Credit Facility and dividend obligations on our Term Preferred Stock. The amount of interest calculated for purposes of this table was based upon rates and balances as of September 30, 2012. Dividend payments on the Term Preferred Stock assume quarterly dividend declarations and monthly dividend distributions through the date of mandatory redemption.
Critical Accounting Policies
The preparation of financial statements and related disclosures in conformity with GAAP requires management to make estimates and assumptions that affect the reported consolidated amounts of assets and liabilities, including disclosure of contingent assets and liabilities at the date of the financial statements, and revenues and expenses during the period reported. Actual results could materially differ from those estimates. We have identified our investment valuation process, as our most critical accounting policy.
Investment Valuation
The most significant estimate inherent in the preparation of our accompanying Consolidated Financial Statements is the valuation of investments and the related amounts of unrealized appreciation and depreciation of investments recorded. General Valuation Policy: We value our investments in accordance with the requirements of the 1940 Act. As discussed more fully below, we value securities for which market quotations are readily available and reliable at their market value. We value all other securities and assets at fair value as determined in good faith by our Board of Directors. ASC 820 defines fair value, establishes a framework for measuring fair value and expands disclosures about assets and liabilities measured at fair value. ASC 820 provides a consistent definition of fair value that focuses on exit price in the principal, or most advantageous, market and prioritizes, within a measurement of fair value, the use of market-based inputs over entity-specific inputs. ASC 820 also establishes the following three-level hierarchy for fair value measurements based upon the transparency of inputs to the valuation of an asset or liability as of the measurement date.
� Level 1 —inputs to the valuation methodology are quoted prices (unadjusted) for identical assets or liabilities in active markets;
� Level 2 —inputs to the valuation methodology include quoted prices for similar assets and liabilities in active or inactive markets, and inputs that are observable for the asset or liability, either directly or indirectly, for substantially the full term of the financial instrument. Level 2 inputs are in those markets for which there are few transactions, the prices are not current, little public information exists or instances where prices vary substantially over time or among brokered market makers; and
� Level 3 —inputs to the valuation methodology are unobservable and reflect assumptions that market participants would use when pricing the asset or liability. Level 3 inputs can also include our own assumptions based upon the best available information.
See Note 3—Investments in the accompanying notes to our accompanying Consolidated Financial Statements included elsewhere in this report for additional information regarding fair value measurements and our adoption of ASC 820.
59
We use generally accepted valuation techniques to value our portfolio unless we have specific information about the value of an investment to determine otherwise. From time to time we may accept an appraisal of a business in which we hold securities. These appraisals are expensive and occur infrequently but provide a third-party valuation opinion that may differ in results, techniques and scopes used to value our investments. When these specific third-party appraisals are engaged or accepted, we would use estimates of value provided by such appraisals and our own assumptions including estimated remaining life, current market yield and interest rate spreads of similar securities, as of the measurement date, to value our investments. In determining the value of our investments, the Adviser has established an investment valuation policy (the “Policy”). The Policy has been approved by our Board of Directors, and each quarter our Board of Directors reviews whether the Adviser has applied the Policy consistently and votes whether or not to accept the recommended valuation of our investment portfolio. Such determination of fair values may involve subjective judgments and estimates. The Policy, which is summarized below, applies to the following categories of securities:
� Publicly-traded securities; � Securities for which a limited market exists; and � Securities for which no market exists.
Valuation Methods: Publicly-traded securities: We determine the value of publicly-traded securities based on the closing price for the security on the exchange or securities market on which it is listed and primarily traded on the valuation date. To the extent that we own restricted securities that are not freely tradable, but for which a public market otherwise exists, we will use the market value of that security adjusted for any decrease in value resulting from the restrictive feature. As of September 30, 2012 and 2011, we did not have any investments in publicly traded securities. Securities for which a limited market exists: We value securities that are not traded on an established secondary securities market, but for which a limited market for the security exists, such as certain participations in, or assignments of, syndicated loans, at the quoted bid price, which are non-binding. In valuing these assets, we assess trading activity in an asset class, evaluate variances in prices and other market insights to determine if any available quote prices are reliable. If we conclude that quotes based on active markets or trading activity may be relied upon, firm bid prices are requested; however, if a firm bid price is unavailable, we base the value of the security upon the indicative bid price (“IBP”) offered by the respective originating syndication agent's trading desk, or secondary desk, on or near the valuation date. To the extent that we use the IBP as a basis for valuing the security, the Adviser may take further steps to consider additional information to validate that price in accordance with the Policy, including but not limited to reviewing a range of indicative bids to the extent the Adviser has ready access to such qualified information. In the event these limited markets become illiquid such that market prices are no longer readily available, we will value our syndicated loans using alternative methods, such as estimated net present values of the future cash flows or discounted cash flows (“DCF”). The use of a DCF methodology follows that prescribed by ASC 820, which provides guidance on the use of a reporting entity’s own assumptions about future cash flows and risk-adjusted discount rates when relevant observable inputs, such as quotes in active markets, are not available. When relevant observable market data does not exist, the alternative outlined in ASC 820 is the valuation of investments based on DCF. For the purposes of using DCF to provide fair value estimates, we consider multiple inputs such as a risk-adjusted discount rate that incorporates adjustments that market participants would make both for nonperformance and liquidity risks. As such, we develop a modified discount rate approach that incorporates risk premiums including, among others, increased probability of default, or higher loss given default, or increased liquidity risk. The DCF valuations applied to the syndicated loans provide an estimate of what we believe a market participant would pay to purchase a syndicated loan in an active market, thereby establishing a fair value. We apply the DCF methodology in illiquid markets until quoted prices are available or are deemed reliable based on trading activity. As of September 30, 2012 and 2011, we determined that the indicative bid prices were reliable indicators of fair value for our syndicate investments. However, because of the private nature of this marketplace (meaning actual transactions are not publicly-reported), we believe that these valuation inputs are classified as Level 3 within the fair value hierarchy as defined in ASC 820.
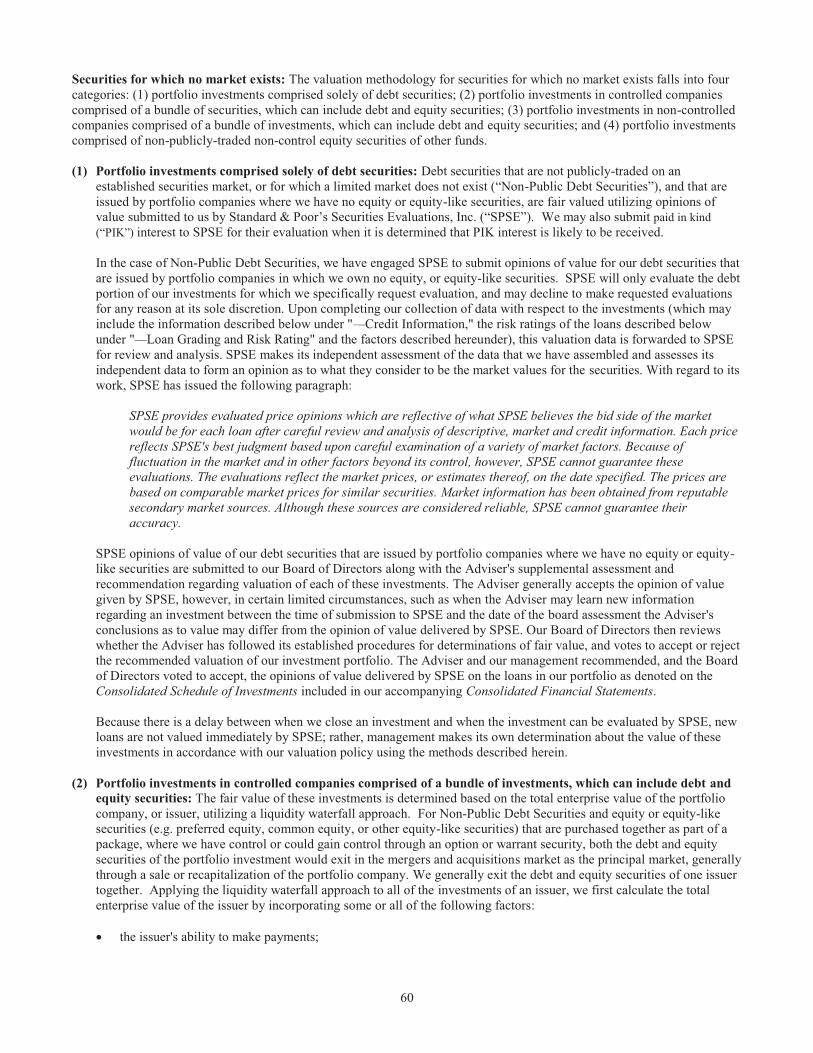
60
Securities for which no market exists: The valuation methodology for securities for which no market exists falls into four categories: (1) portfolio investments comprised solely of debt securities; (2) portfolio investments in controlled companies comprised of a bundle of securities, which can include debt and equity securities; (3) portfolio investments in non-controlled companies comprised of a bundle of investments, which can include debt and equity securities; and (4) portfolio investments comprised of non-publicly-traded non-control equity securities of other funds. (1) Portfolio investments comprised solely of debt securities: Debt securities that are not publicly-traded on an
established securities market, or for which a limited market does not exist (“Non-Public Debt Securities”), and that are issued by portfolio companies where we have no equity or equity-like securities, are fair valued utilizing opinions of value submitted to us by Standard & Poor’s Securities Evaluations, Inc. (“SPSE”). We may also submit paid in kind (“PIK”) interest to SPSE for their evaluation when it is determined that PIK interest is likely to be received. In the case of Non-Public Debt Securities, we have engaged SPSE to submit opinions of value for our debt securities that are issued by portfolio companies in which we own no equity, or equity-like securities. SPSE will only evaluate the debt portion of our investments for which we specifically request evaluation, and may decline to make requested evaluations for any reason at its sole discretion. Upon completing our collection of data with respect to the investments (which may include the information described below under "—Credit Information," the risk ratings of the loans described below under "—Loan Grading and Risk Rating" and the factors described hereunder), this valuation data is forwarded to SPSE for review and analysis. SPSE makes its independent assessment of the data that we have assembled and assesses its independent data to form an opinion as to what they consider to be the market values for the securities. With regard to its work, SPSE has issued the following paragraph:
SPSE provides evaluated price opinions which are reflective of what SPSE believes the bid side of the market would be for each loan after careful review and analysis of descriptive, market and credit information. Each price reflects SPSE's best judgment based upon careful examination of a variety of market factors. Because of fluctuation in the market and in other factors beyond its control, however, SPSE cannot guarantee these evaluations. The evaluations reflect the market prices, or estimates thereof, on the date specified. The prices are based on comparable market prices for similar securities. Market information has been obtained from reputable secondary market sources. Although these sources are considered reliable, SPSE cannot guarantee their accuracy.
SPSE opinions of value of our debt securities that are issued by portfolio companies where we have no equity or equity-like securities are submitted to our Board of Directors along with the Adviser's supplemental assessment and recommendation regarding valuation of each of these investments. The Adviser generally accepts the opinion of value given by SPSE, however, in certain limited circumstances, such as when the Adviser may learn new information regarding an investment between the time of submission to SPSE and the date of the board assessment the Adviser's conclusions as to value may differ from the opinion of value delivered by SPSE. Our Board of Directors then reviews whether the Adviser has followed its established procedures for determinations of fair value, and votes to accept or reject the recommended valuation of our investment portfolio. The Adviser and our management recommended, and the Board of Directors voted to accept, the opinions of value delivered by SPSE on the loans in our portfolio as denoted on the Consolidated Schedule of Investments included in our accompanying Consolidated Financial Statements. Because there is a delay between when we close an investment and when the investment can be evaluated by SPSE, new loans are not valued immediately by SPSE; rather, management makes its own determination about the value of these investments in accordance with our valuation policy using the methods described herein.
(2) Portfolio investments in controlled companies comprised of a bundle of investments, which can include debt and equity securities: The fair value of these investments is determined based on the total enterprise value of the portfolio company, or issuer, utilizing a liquidity waterfall approach. For Non-Public Debt Securities and equity or equity-like securities (e.g. preferred equity, common equity, or other equity-like securities) that are purchased together as part of a package, where we have control or could gain control through an option or warrant security, both the debt and equity securities of the portfolio investment would exit in the mergers and acquisitions market as the principal market, generally through a sale or recapitalization of the portfolio company. We generally exit the debt and equity securities of one issuer together. Applying the liquidity waterfall approach to all of the investments of an issuer, we first calculate the total enterprise value of the issuer by incorporating some or all of the following factors: � the issuer's ability to make payments;
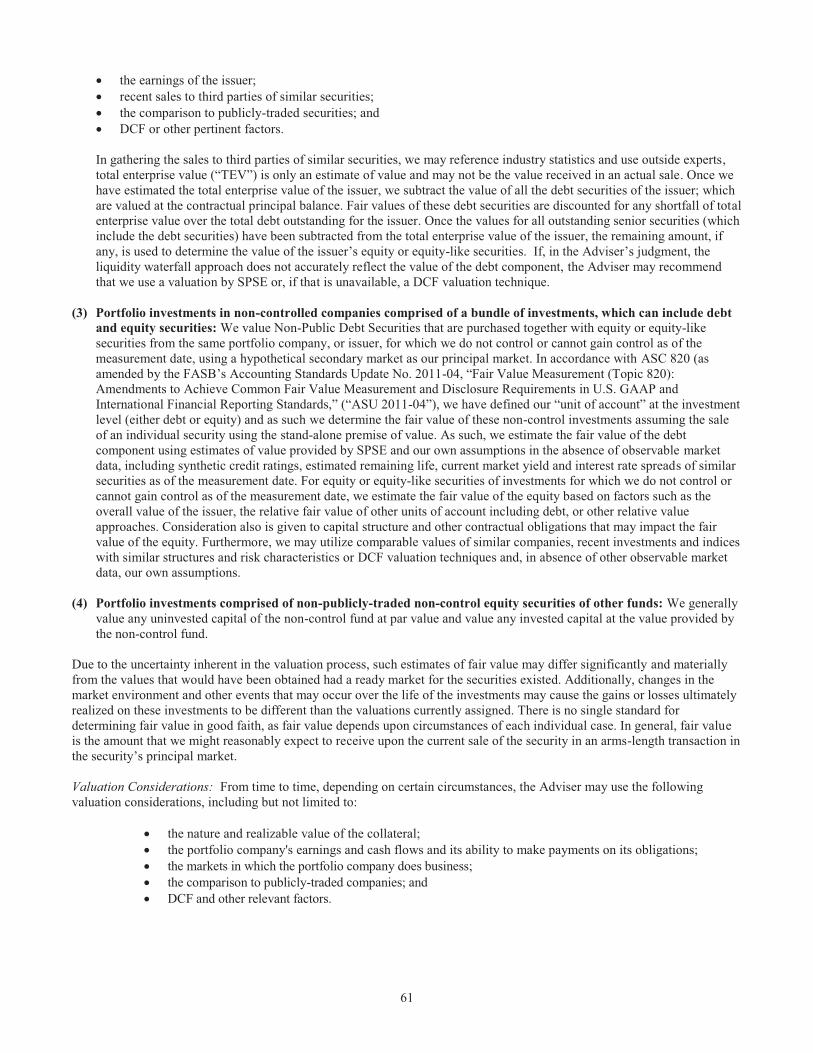
61
� the earnings of the issuer; � recent sales to third parties of similar securities; � the comparison to publicly-traded securities; and � DCF or other pertinent factors. In gathering the sales to third parties of similar securities, we may reference industry statistics and use outside experts, total enterprise value (“TEV”) is only an estimate of value and may not be the value received in an actual sale. Once we have estimated the total enterprise value of the issuer, we subtract the value of all the debt securities of the issuer; which are valued at the contractual principal balance. Fair values of these debt securities are discounted for any shortfall of total enterprise value over the total debt outstanding for the issuer. Once the values for all outstanding senior securities (which include the debt securities) have been subtracted from the total enterprise value of the issuer, the remaining amount, if any, is used to determine the value of the issuer’s equity or equity-like securities. If, in the Adviser’s judgment, the liquidity waterfall approach does not accurately reflect the value of the debt component, the Adviser may recommend that we use a valuation by SPSE or, if that is unavailable, a DCF valuation technique.
(3) Portfolio investments in non-controlled companies comprised of a bundle of investments, which can include debt and equity securities: We value Non-Public Debt Securities that are purchased together with equity or equity-like securities from the same portfolio company, or issuer, for which we do not control or cannot gain control as of the measurement date, using a hypothetical secondary market as our principal market. In accordance with ASC 820 (as amended by the FASB’s Accounting Standards Update No. 2011-04, “Fair Value Measurement (Topic 820): Amendments to Achieve Common Fair Value Measurement and Disclosure Requirements in U.S. GAAP and International Financial Reporting Standards,” (“ASU 2011-04”), we have defined our “unit of account” at the investment level (either debt or equity) and as such we determine the fair value of these non-control investments assuming the sale of an individual security using the stand-alone premise of value. As such, we estimate the fair value of the debt component using estimates of value provided by SPSE and our own assumptions in the absence of observable market data, including synthetic credit ratings, estimated remaining life, current market yield and interest rate spreads of similar securities as of the measurement date. For equity or equity-like securities of investments for which we do not control or cannot gain control as of the measurement date, we estimate the fair value of the equity based on factors such as the overall value of the issuer, the relative fair value of other units of account including debt, or other relative value approaches. Consideration also is given to capital structure and other contractual obligations that may impact the fair value of the equity. Furthermore, we may utilize comparable values of similar companies, recent investments and indices with similar structures and risk characteristics or DCF valuation techniques and, in absence of other observable market data, our own assumptions.
(4) Portfolio investments comprised of non-publicly-traded non-control equity securities of other funds: We generally
value any uninvested capital of the non-control fund at par value and value any invested capital at the value provided by the non-control fund.
Due to the uncertainty inherent in the valuation process, such estimates of fair value may differ significantly and materially from the values that would have been obtained had a ready market for the securities existed. Additionally, changes in the market environment and other events that may occur over the life of the investments may cause the gains or losses ultimately realized on these investments to be different than the valuations currently assigned. There is no single standard for determining fair value in good faith, as fair value depends upon circumstances of each individual case. In general, fair value is the amount that we might reasonably expect to receive upon the current sale of the security in an arms-length transaction in the security’s principal market. Valuation Considerations: From time to time, depending on certain circumstances, the Adviser may use the following valuation considerations, including but not limited to:
� the nature and realizable value of the collateral; � the portfolio company's earnings and cash flows and its ability to make payments on its obligations; � the markets in which the portfolio company does business; � the comparison to publicly-traded companies; and � DCF and other relevant factors.
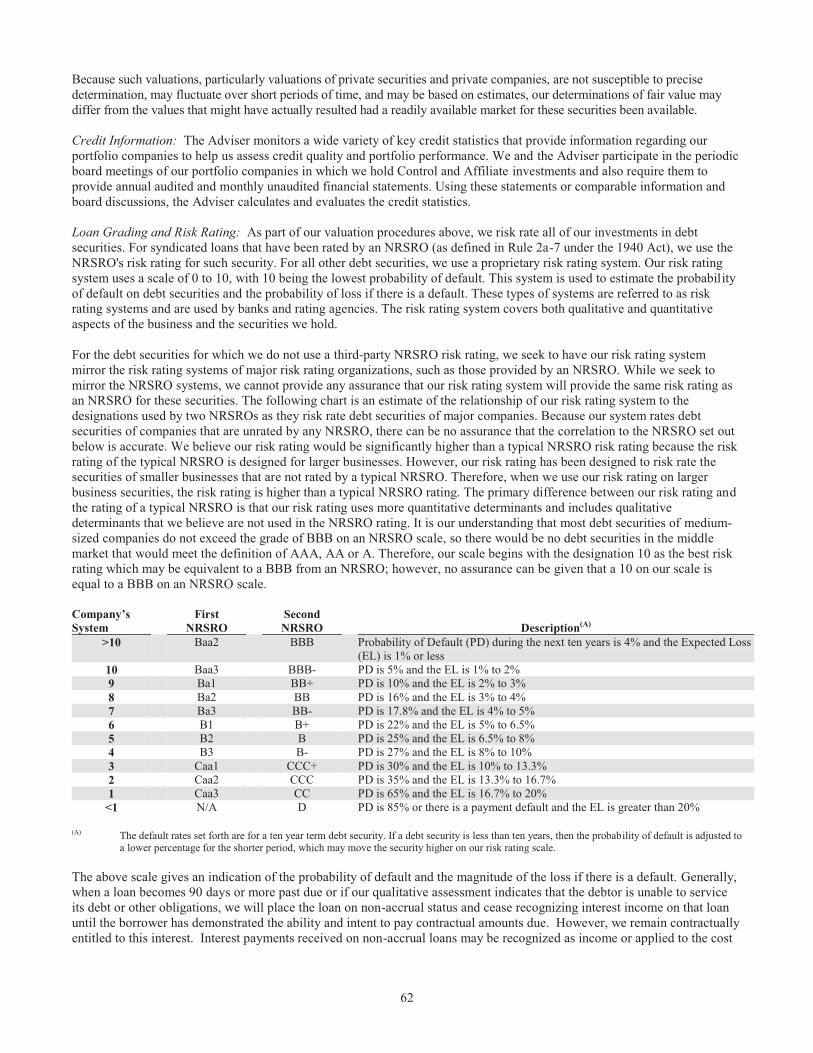
62
Because such valuations, particularly valuations of private securities and private companies, are not susceptible to precise determination, may fluctuate over short periods of time, and may be based on estimates, our determinations of fair value may differ from the values that might have actually resulted had a readily available market for these securities been available. Credit Information: The Adviser monitors a wide variety of key credit statistics that provide information regarding our portfolio companies to help us assess credit quality and portfolio performance. We and the Adviser participate in the periodic board meetings of our portfolio companies in which we hold Control and Affiliate investments and also require them to provide annual audited and monthly unaudited financial statements. Using these statements or comparable information and board discussions, the Adviser calculates and evaluates the credit statistics. Loan Grading and Risk Rating: As part of our valuation procedures above, we risk rate all of our investments in debt securities. For syndicated loans that have been rated by an NRSRO (as defined in Rule 2a-7 under the 1940 Act), we use the NRSRO's risk rating for such security. For all other debt securities, we use a proprietary risk rating system. Our risk rating system uses a scale of 0 to 10, with 10 being the lowest probability of default. This system is used to estimate the probability of default on debt securities and the probability of loss if there is a default. These types of systems are referred to as risk rating systems and are used by banks and rating agencies. The risk rating system covers both qualitative and quantitative aspects of the business and the securities we hold. For the debt securities for which we do not use a third-party NRSRO risk rating, we seek to have our risk rating system mirror the risk rating systems of major risk rating organizations, such as those provided by an NRSRO. While we seek to mirror the NRSRO systems, we cannot provide any assurance that our risk rating system will provide the same risk rating as an NRSRO for these securities. The following chart is an estimate of the relationship of our risk rating system to the designations used by two NRSROs as they risk rate debt securities of major companies. Because our system rates debt securities of companies that are unrated by any NRSRO, there can be no assurance that the correlation to the NRSRO set out below is accurate. We believe our risk rating would be significantly higher than a typical NRSRO risk rating because the risk rating of the typical NRSRO is designed for larger businesses. However, our risk rating has been designed to risk rate the securities of smaller businesses that are not rated by a typical NRSRO. Therefore, when we use our risk rating on larger business securities, the risk rating is higher than a typical NRSRO rating. The primary difference between our risk rating and the rating of a typical NRSRO is that our risk rating uses more quantitative determinants and includes qualitative determinants that we believe are not used in the NRSRO rating. It is our understanding that most debt securities of medium-sized companies do not exceed the grade of BBB on an NRSRO scale, so there would be no debt securities in the middle market that would meet the definition of AAA, AA or A. Therefore, our scale begins with the designation 10 as the best risk rating which may be equivalent to a BBB from an NRSRO; however, no assurance can be given that a 10 on our scale is equal to a BBB on an NRSRO scale. Company’s System
First NRSRO
Second NRSRO Description(A)
>10
Baa2
BBB
Probability of Default (PD) during the next ten years is 4% and the Expected Loss (EL) is 1% or less
10 Baa3 BBB- PD is 5% and the EL is 1% to 2% 9 Ba1 BB+ PD is 10% and the EL is 2% to 3% 8 Ba2 BB PD is 16% and the EL is 3% to 4% 7 Ba3 BB- PD is 17.8% and the EL is 4% to 5% 6 B1 B+ PD is 22% and the EL is 5% to 6.5% 5 B2 B PD is 25% and the EL is 6.5% to 8% 4 B3 B- PD is 27% and the EL is 8% to 10% 3 Caa1 CCC+ PD is 30% and the EL is 10% to 13.3% 2 Caa2 CCC PD is 35% and the EL is 13.3% to 16.7% 1 Caa3 CC PD is 65% and the EL is 16.7% to 20%
<1 N/A D PD is 85% or there is a payment default and the EL is greater than 20% (A) The default rates set forth are for a ten year term debt security. If a debt security is less than ten years, then the probability of default is adjusted to
a lower percentage for the shorter period, which may move the security higher on our risk rating scale. The above scale gives an indication of the probability of default and the magnitude of the loss if there is a default. Generally, when a loan becomes 90 days or more past due or if our qualitative assessment indicates that the debtor is unable to service its debt or other obligations, we will place the loan on non-accrual status and cease recognizing interest income on that loan until the borrower has demonstrated the ability and intent to pay contractual amounts due. However, we remain contractually entitled to this interest. Interest payments received on non-accrual loans may be recognized as income or applied to the cost
63
basis depending upon management’s judgment. Generally non-accrual loans are restored to accrual status when past due principal and interest are paid and in management’s judgment, are likely to remain current, or due to a restructuring such that the interest income is deemed to be collectible. At September 30, 2012, six portfolio companies were either fully or partially on non-accrual with an aggregate debt cost basis of approximately $61.1 million, or 17.3% of the cost basis of all debt investments in our portfolio, and an aggregate fair value of approximately $6.8 million, or 2.6% of the fair value of all debt investments in our portfolio. At September 30, 2011, eight portfolio companies were on non-accrual with an aggregate debt cost basis of approximately $41.1 million, or 11.0% of the cost basis of all debt investments in our portfolio, and an aggregate fair value of approximately $5.3 million, or 1.8% of the fair value of all debt investments in our portfolio. Additionally, we do not risk rate our equity securities. The following table lists the risk ratings for all non-syndicated loans in our portfolio at September 30, 2012 and 2011, representing approximately 78.5% and 70.0%, respectively, of all loans in our portfolio at fair value at the end of each year:
As of September 30, Rating 2012 2011 Highest 10.0 9.0 Average 5.8 5.5 Weighted Average 5.5 5.9 Lowest 2.0 1.0
The following table lists the risk ratings for all syndicated loans in our portfolio that were not rated by an NRSRO. At September 30, 2012 and 2011, these loans represented 6.8% and 6.3%, respectively, at fair value of all loans in our portfolio at the end of each year:
As of September 30, Rating 2012 2011 Highest 7.0 7.0 Average 5.3 5.0 Weighted Average 5.2 5.0 Lowest 4.0 4.0
For syndicated loans that are currently rated by an NRSRO, we risk rate such loans in accordance with the risk rating systems of major risk rating organizations, such as those provided by an NRSRO. The following table lists the risk ratings for all syndicated loans in our portfolio that were rated by an NRSRO at September 30, 2012 and 2011, representing approximately 14.7% and 23.7%, respectively, at fair value of all loans in our portfolio at fair value at the end of each year:
As of September 30, Rating 2012 2011 Highest B+/B1 B+/B1 Average B/B2 B/B2 Weighted Average B/B2 B/B2 Lowest NR/Caa1 NR/Caa2
Tax Status We intend to continue to qualify for treatment as a RIC under Subtitle A, Chapter 1 of Subchapter M of the Code. As a RIC, we are not subject to federal income tax on the portion of our taxable income and gains distributed to stockholders. To qualify as a RIC, we must meet certain source-of-income, asset diversification and annual distribution requirements. Under the annual distribution requirements, we are required to distribute to stockholders at least 90% of our investment company taxable income, as defined by the Code. Our policy is to pay out as distributions up to 100% of that amount.
In an effort to avoid certain excise taxes imposed on RICs, we currently intend to distribute, during each calendar year, an amount at least equal to the sum of: (1) 98% of our ordinary income for the calendar year, (2) 98.2% of our capital gains in excess of capital losses for the one-year period ending on October 31 of the calendar year, and (3) any ordinary income and net capital gains from preceding years that were not distributed during such years. Additionally, under the RIC Modernization Act (the “RIC Act”), we are permitted to carry forward capital losses incurred in taxable years beginning after September 30, 2011, for an unlimited period. However, any losses incurred during those future taxable years will be required to be utilized prior to the losses incurred in pre-enactment taxable years, which carry an expiration date. As a result of this ordering rule, pre-enactment capital loss carryforwards may be more likely to expire unused. Additionally, post-enactment
64
capital loss carryforwards will retain their character as either short-term or long-term capital losses rather than being considered all short-term as permitted under the previous regulation. We sought and received approval for a change in accounting method from the IRS related to our tax treatment for success fees. As a result, we, in effect, will continue to account for the recognition of income from the success fees upon receipt, or when the amount becomes fixed. Prior to January 1, 2011, we had treated the success fee amount as a capital gain for tax characterization purposes. However, starting January 1, 2011, the tax characterization of the success fee amount was and will be treated as ordinary income. The approved change in accounting method does not require us to retroactively change the capital gains treatment of the success fees received prior to January 1, 2011. Revenue Recognition Interest Income Recognition Interest income, adjusted for amortization of premiums and acquisition costs and for the accretion of discounts, is recorded on the accrual basis to the extent that such amounts are expected to be collected. Generally, when a loan becomes 90 days or more past due or if our qualitative assessment indicates that the debtor is unable to service its debt or other obligations, we will place the loan on non-accrual status and cease recognizing interest income on that loan until the borrower has demonstrated the ability and intent to pay contractual amounts due. However, we remain contractually entitled to this interest. Interest payments received on non-accrual loans may be recognized as income or applied to the cost basis depending upon management’s judgment. Generally, non-accrual loans are restored to accrual status when past due principal and interest are paid and, in management’s judgment, are likely to remain current, or due to a restructuring such that the interest income is deemed to be collectible. At September 30, 2012, six portfolio companies were either fully or partially on non-accrual with an aggregate debt cost basis of approximately $61.1 million, or 17.3% of the cost basis of all debt investments in our portfolio, and an aggregate fair value of approximately $6.8 million, or 2.6% of the fair value of all debt investments in our. At September 30, 2011, eight portfolio companies were on non-accrual with an aggregate debt cost basis of approximately $41.1 million, or 11.0% of the cost basis of all debt investments in our portfolio, and an aggregate fair value of approximately $5.3 million, or 1.8% of the fair value of all debt investments in our portfolio. As of September 30, 2012 and 2011, we had 24 and 27 original issue discount (“OID”) loans, respectively, primarily from the syndicated loans in our portfolio. We recorded OID income of $0.3 million for the year ended September 30, 2012, as compared to $0.2 million for the year ended September 30, 2011. The unamortized balance of OID investments as of September 30, 2012 and 2011 totaled $1.1 million and $1.5 million, respectively. As of September 30, 2012, we had one investment that bore PIK interest and as of September 30, 2011, we had no investments that bore PIK interest. PIK interest, computed at the contractual rate specified in a loan agreement, is added to the principal balance of a loan and recorded as income. To maintain our status as a RIC, this non-cash source of income must be paid out to common stockholders in the form of distributions, even though we have not yet collected the cash. We recorded PIK income of $20 for the year ended September 30, 2012, as compared to $12 for the year ended September 30, 2011. We collected no PIK income in cash for the years ended September 30, 2012 and 2011, respectively. We also transfer past due interest to the principal balance as stipulated in certain loan amendments with portfolio companies. There were no such transfers during the year ended September 30, 2012 and we transferred past due interest to the principal balance of $0.2 million for the year ended September 30, 2011. For the fiscal year ended September 30, 2010, we also rolled over past due interest to a portfolio company’s principal balance of $0.7 million, and then recorded an adjustment against that principal balance as a contra-investment since the loan was on non-accrual and the collectability of the additional principal was uncertain. As a result of a restructure, we reversed this contra-investment amount of $0.7 million during 2011. These principal balance adjustments had no net impact on our accompanying Consolidated Statements of Operations. Other Income Recognition We generally record success fees upon receipt. Success fees are contractually due upon a change of control in a portfolio company and are recorded in other income in our accompanying Consolidated Statements of Operations. We recorded $4.0 million of success fees during the year ended September 30, 2012, which resulted from the exits of GMT, RCS, Northern Contours and Winchester. During the year ended September 30, 2011, we received $1.0 million in success fees from the exits of Pinnacle and Interfilm and the prepayment of success fees from Westlake.
65
Dividend income on preferred equity securities is accrued to the extent that such amounts are expected to be collected and if we have the option to collect such amounts in cash, and it is recorded in other income in our accompanying Consolidated Statements of Operations. During the years ended September 30, 2012, 2011 and 2010 we did not record or collect any dividend income on preferred equity securities. In addition, we received $1.0 million from two legal settlements related to portfolio companies during the year ended September 30, 2011, that were recorded in other income. Recent Accounting Pronouncements
See Note 2—Summary of Significant Accounting Policies in the accompanying notes to our accompanying Consolidated Financial Statements included elsewhere in this report for a description and our application of recent accounting pronouncements. Our adoption of these recent accounting pronouncements did not have a material effect on our financial position and results of operations. ITEM 7A. QUANTITATIVE AND QUALITATIVE DISCLOSURES ABOUT MARKET RISK (DOLLAR AMOUNTS IN THOUSANDS, UNLESS OTHERWISE INDICATED) Market risk includes risks that arise from changes in interest rates, foreign currency exchange rates, commodity prices, equity prices and other market changes that affect market sensitive instruments. The prices of securities held by us may decline in response to certain events, including those directly involving the companies whose securities are owned by us; conditions affecting the general economy; overall market changes; local, regional or global political, social or economic instability; and interest rate fluctuations. The primary risk we believe we are exposed to is interest rate risk. Because we borrow money to make investments, our net investment is dependent upon the difference between the rate at which we borrow funds and the rate at which we invest those funds. As a result, there can be no assurance that a significant change in market interest rates will not have a material adverse effect on our net investment income. We use a combination of debt and equity capital to finance our investing activities. We may use interest rate risk management techniques from time to time to limit our exposure to interest rate fluctuations; however ,we did not use any for fiscal years ended 2012, 2011 or 2010. Such techniques may include various interest rate hedging activities to the extent permitted by the 1940 Act. We target to have approximately 10% of the loans in our portfolio at fixed rates, with approximately 90% made at variable rates. As of September 30, 2012, our portfolio consisted of the following:
88.4% variable rates with a floor 6.6 fixed rates 5.0 variable rates without a floor or ceiling 100.0% total
All of our variable-rate loans have rates generally associated with either the current LIBOR or prime rate. To illustrate the potential impact of changes in interest rates on our net decrease in net assets resulting from operations, we have performed the following hypothetical analysis, which assumes that our balance sheet and interest rates remain constant as of September 30, 2012 and no further actions are taken to alter our existing interest rate sensitivity.
Basis Point Change (a) Increase in
Interest Income Increase in
Interest Expense
Net Increase in Net Assets Resulting from
Operations Up 300 basis points $ 2,793 $ 1,026 $ 1,767 Up 200 basis points 904 438 466 Up 100 basis points 17 — 17 Down 23 basis points — — —
(a) As of September 30, 2012, our effective average LIBOR was 0.23%. Although management believes that this analysis is indicative of our existing interest rate sensitivity, it does not adjust for potential changes in credit quality, size and composition of our loan portfolio on the balance sheet and other business developments that could affect net (decrease) increase in net assets resulting from operations. Accordingly, actual results could differ significantly from those in the hypothetical analysis in the table above.

66
We may also experience risk associated with investing in securities of companies with foreign operations. Some of our portfolio companies have operations located outside the U.S. These risks include, but are not limited to, fluctuations in foreign currency exchange rates, imposition of foreign taxes, changes in exportation regulations and political and social instability.

67
ITEM 8. FINANCIAL STATEMENTS AND SUPPLEMENTARY DATA Index to Consolidated Financial Statements
Report of Management on Internal Controls 68 Report of Independent Registered Public Accounting Firm 69 Consolidated Statements of Assets and Liabilities as of September 30, 2012 and 2011 70 Consolidated Statements of Operations for the years ended September 30, 2012, 2011 and 2010 71 Consolidated Statements of Changes in Net Assets for the years ended September 30, 2012, 2011 and 2010 72 Consolidated Statements of Cash Flows for the years ended September 30, 2012, 2011 and 2010 73 Consolidated Schedules of Investments as of September 30, 2012 and 2011 74 Notes to Consolidated Financial Statements 81
68
Report of Management on Internal Controls
To the Stockholders and Board of Directors of Gladstone Capital Corporation: Our management is responsible for establishing and maintaining adequate internal control over financial reporting as defined in Rule 13a-15(f) under the Securities Exchange Act of 1934. Our internal control over financial reporting is designed to provide reasonable assurance regarding the reliability of financial reporting and the preparation of financial statements for external purposes in accordance with generally accepted accounting principles and include those policies and procedures that: (1) pertain to the maintenance of records that in reasonable detail accurately and fairly reflect our transactions and the dispositions of our assets; (2) provide reasonable assurance that our transactions are recorded as necessary to permit preparation of financial statements in accordance with generally accepted accounting principles, and that our receipts and expenditures are being made only in accordance with appropriate authorizations; and (3) provide reasonable assurance regarding prevention or timely detection of unauthorized acquisition, use or disposition of our assets that could have a material effect on our financial statements.
Because of its inherent limitations, internal control over financial reporting may not prevent or detect misstatements. Therefore, even those systems determined to be effective can provide only reasonable assurance with respect to financial statement preparation and presentation.
Under the supervision and with the participation of our management, we assessed the effectiveness of our internal control over financial reporting as of September 30, 2012, using the criteria set forth by the Committee of Sponsoring Organizations of the Treadway Commission (COSO) in Internal Control—Integrated Framework. Based on its assessment, management has concluded that our internal control over financial reporting was effective as of September 30, 2012.
The effectiveness of the Company’s internal control over financial reporting as of September 30, 2012 has been audited by PricewaterhouseCoopers LLP, an independent registered public accounting firm, as stated in their report which appears herein.
November 13, 2012
69
Report of Independent Registered Public Accounting Firm
To the Stockholders and Board of Directors of Gladstone Capital Corporation: In our opinion, the accompanying consolidated statements of assets and liabilities, including the consolidated schedules of investments, and the related consolidated statements of operations, changes in net assets, and cash flows and the financial highlights present fairly, in all material respects, the financial position of Gladstone Capital Corporation and its subsidiaries (the “Company”) at September 30, 2012 and 2011, the results of their operations and their cash flows for each of the three years in the period ended September 30, 2012 and the financial highlights for each of the five years in the period ended September 30, 2012, in conformity with accounting principles generally accepted in the United States of America. In addition, in our opinion, the financial statement schedule listed in the accompanying index under Item 15(a)(2) presents fairly, in all material respects, the information set forth therein when read in conjunction with the related consolidated financial statements. Also, in our opinion, the Company maintained, in all material respects, effective internal control over financial reporting as of September 30, 2012, based on criteria established in Internal Control - Integrated Framework issued by the Committee of Sponsoring Organizations of the Treadway Commission (COSO). The Company's management is responsible for these financial statements and financial statement schedule, for maintaining effective internal control over financial reporting and for its assessment of the effectiveness of internal control over financial reporting, included in the accompanying Management's Annual Report on Internal Control over Financial Reporting. Our responsibility is to express opinions on these financial statements, on the financial statement schedule, and on the Company's internal control over financial reporting based on our integrated audits. We conducted our audits in accordance with the standards of the Public Company Accounting Oversight Board (United States). Those standards require that we plan and perform the audits to obtain reasonable assurance about whether the financial statements are free of material misstatement and whether effective internal control over financial reporting was maintained in all material respects. Our audits of the financial statements included examining, on a test basis, evidence supporting the amounts and disclosures in the financial statements, assessing the accounting principles used and significant estimates made by management, and evaluating the overall financial statement presentation. Our audit of internal control over financial reporting included obtaining an understanding of internal control over financial reporting, assessing the risk that a material weakness exists, and testing and evaluating the design and operating effectiveness of internal control based on the assessed risk. Our audits also included performing such other procedures as we considered necessary in the circumstances. Our procedures included confirmation of securities at September 30, 2012, by correspondence with the custodian, and where replies were not received, we performed other auditing procedures. We believe that our audits provide a reasonable basis for our opinions. A company’s internal control over financial reporting is a process designed to provide reasonable assurance regarding the reliability of financial reporting and the preparation of financial statements for external purposes in accordance with generally accepted accounting principles. A company’s internal control over financial reporting includes those policies and procedures that (i) pertain to the maintenance of records that, in reasonable detail, accurately and fairly reflect the transactions and dispositions of the assets of the company; (ii) provide reasonable assurance that transactions are recorded as necessary to permit preparation of financial statements in accordance with generally accepted accounting principles, and that receipts and expenditures of the company are being made only in accordance with authorizations of management and directors of the company; and (iii) provide reasonable assurance regarding prevention or timely detection of unauthorized acquisition, use, or disposition of the company’s assets that could have a material effect on the financial statements. Because of its inherent limitations, internal control over financial reporting may not prevent or detect misstatements. Also, projections of any evaluation of effectiveness to future periods are subject to the risk that controls may become inadequate because of changes in conditions, or that the degree of compliance with the policies or procedures may deteriorate. /s/ PricewaterhouseCoopers LLP McLean, VA November 13, 2012
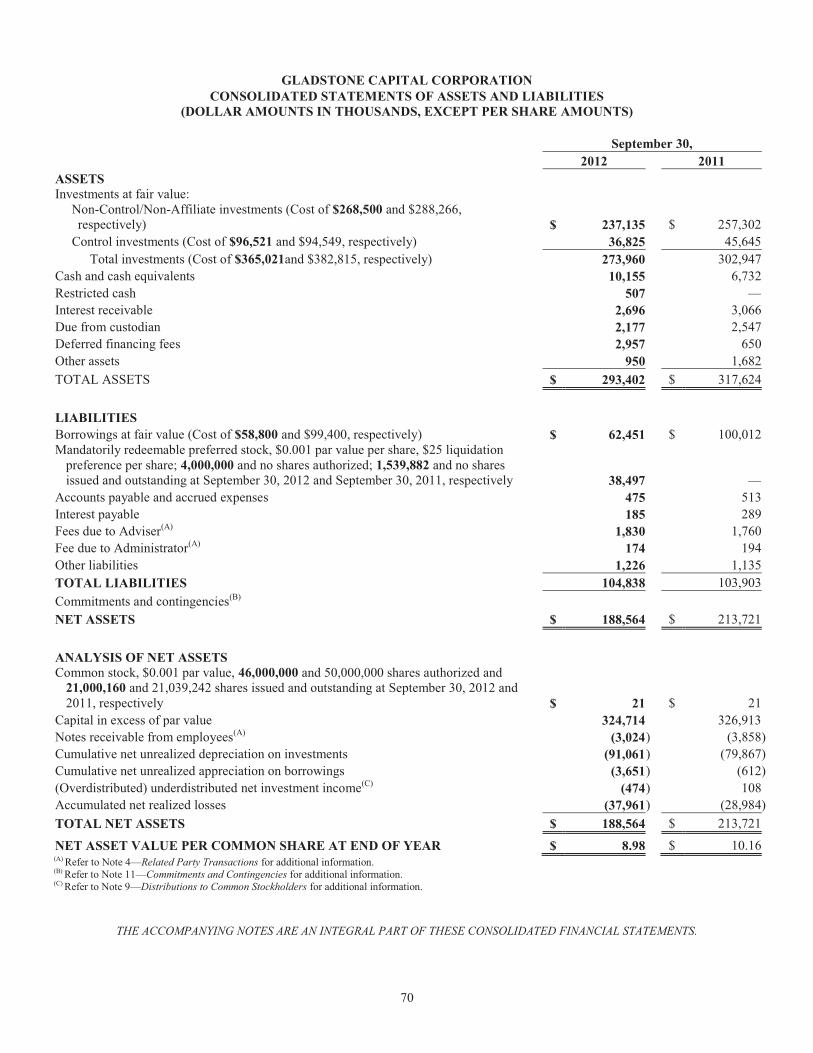
70
GLADSTONE CAPITAL CORPORATION CONSOLIDATED STATEMENTS OF ASSETS AND LIABILITIES
(DOLLAR AMOUNTS IN THOUSANDS, EXCEPT PER SHARE AMOUNTS)
September 30, 2012 2011 ASSETS Investments at fair value:
Non-Control/Non-Affiliate investments (Cost of $268,500 and $288,266, respectively) $ 237,135 $ 257,302
Control investments (Cost of $96,521 and $94,549, respectively) 36,825 45,645 Total investments (Cost of $365,021and $382,815, respectively) 273,960 302,947
Cash and cash equivalents 10,155 6,732 Restricted cash 507 — Interest receivable 2,696 3,066 Due from custodian 2,177 2,547 Deferred financing fees 2,957 650 Other assets 950 1,682 TOTAL ASSETS $ 293,402 $ 317,624
LIABILITIES Borrowings at fair value (Cost of $58,800 and $99,400, respectively) $ 62,451 $ 100,012 Mandatorily redeemable preferred stock, $0.001 par value per share, $25 liquidation
preference per share; 4,000,000 and no shares authorized; 1,539,882 and no shares issued and outstanding at September 30, 2012 and September 30, 2011, respectively 38,497 —
Accounts payable and accrued expenses 475 513 Interest payable 185 289 Fees due to Adviser(A) 1,830 1,760 Fee due to Administrator(A) 174 194 Other liabilities 1,226 1,135 TOTAL LIABILITIES 104,838 103,903 Commitments and contingencies(B) NET ASSETS $ 188,564 $ 213,721
ANALYSIS OF NET ASSETS Common stock, $0.001 par value, 46,000,000 and 50,000,000 shares authorized and
21,000,160 and 21,039,242 shares issued and outstanding at September 30, 2012 and 2011, respectively $ 21 $ 21
Capital in excess of par value 324,714 326,913 Notes receivable from employees(A) (3,024 ) (3,858 ) Cumulative net unrealized depreciation on investments (91,061 ) (79,867 ) Cumulative net unrealized appreciation on borrowings (3,651 ) (612 ) (Overdistributed) underdistributed net investment income(C) (474 ) 108 Accumulated net realized losses (37,961 ) (28,984 ) TOTAL NET ASSETS $ 188,564 $ 213,721
NET ASSET VALUE PER COMMON SHARE AT END OF YEAR $ 8.98 $ 10.16 (A) Refer to Note 4—Related Party Transactions for additional information. (B) Refer to Note 11—Commitments and Contingencies for additional information. (C) Refer to Note 9—Distributions to Common Stockholders for additional information.
THE ACCOMPANYING NOTES ARE AN INTEGRAL PART OF THESE CONSOLIDATED FINANCIAL STATEMENTS.
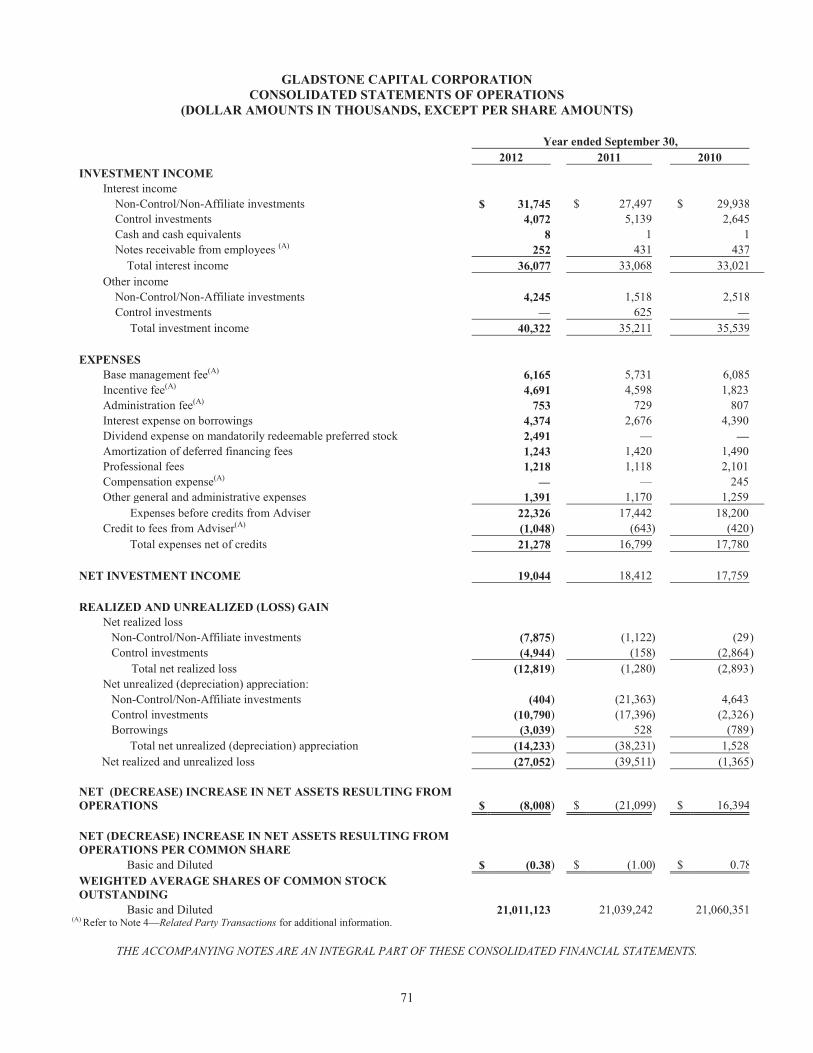
71
GLADSTONE CAPITAL CORPORATION CONSOLIDATED STATEMENTS OF OPERATIONS
(DOLLAR AMOUNTS IN THOUSANDS, EXCEPT PER SHARE AMOUNTS)
Year ended September 30, 2012 2011 2010 INVESTMENT INCOME
Interest income Non-Control/Non-Affiliate investments $ 31,745 $ 27,497 $ 29,938 Control investments 4,072 5,139 2,645 Cash and cash equivalents 8 1 1 Notes receivable from employees (A) 252 431 437 Total interest income 36,077 33,068 33,021 Other income Non-Control/Non-Affiliate investments 4,245 1,518 2,518 Control investments — 625 —
Total investment income 40,322 35,211 35,539 EXPENSES
Base management fee(A) 6,165 5,731 6,085 Incentive fee(A) 4,691 4,598 1,823 Administration fee(A) 753 729 807 Interest expense on borrowings 4,374 2,676 4,390 Dividend expense on mandatorily redeemable preferred stock 2,491 — — Amortization of deferred financing fees 1,243 1,420 1,490 Professional fees 1,218 1,118 2,101 Compensation expense(A) — — 245 Other general and administrative expenses 1,391 1,170 1,259
Expenses before credits from Adviser 22,326 17,442 18,200 Credit to fees from Adviser(A) (1,048 ) (643 ) (420 )
Total expenses net of credits 21,278 16,799 17,780 NET INVESTMENT INCOME 19,044 18,412 17,759 REALIZED AND UNREALIZED (LOSS) GAIN
Net realized loss Non-Control/Non-Affiliate investments (7,875 ) (1,122 ) (29 ) Control investments (4,944 ) (158 ) (2,864 )
Total net realized loss (12,819 ) (1,280 ) (2,893 ) Net unrealized (depreciation) appreciation:
Non-Control/Non-Affiliate investments (404 ) (21,363 ) 4,643 Control investments (10,790 ) (17,396 ) (2,326 ) Borrowings (3,039 ) 528 (789 )
Total net unrealized (depreciation) appreciation (14,233 ) (38,231 ) 1,528 Net realized and unrealized loss (27,052 ) (39,511 ) (1,365 )
NET (DECREASE) INCREASE IN NET ASSETS RESULTING FROM OPERATIONS $ (8,008 ) $ (21,099) $ 16,394
NET (DECREASE) INCREASE IN NET ASSETS RESULTING FROM OPERATIONS PER COMMON SHARE
Basic and Diluted $ (0.38 ) $ (1.00) $ 0.78 WEIGHTED AVERAGE SHARES OF COMMON STOCK OUTSTANDING
Basic and Diluted 21,011,123 21,039,242 21,060,351 (A) Refer to Note 4—Related Party Transactions for additional information.
THE ACCOMPANYING NOTES ARE AN INTEGRAL PART OF THESE CONSOLIDATED FINANCIAL STATEMENTS.
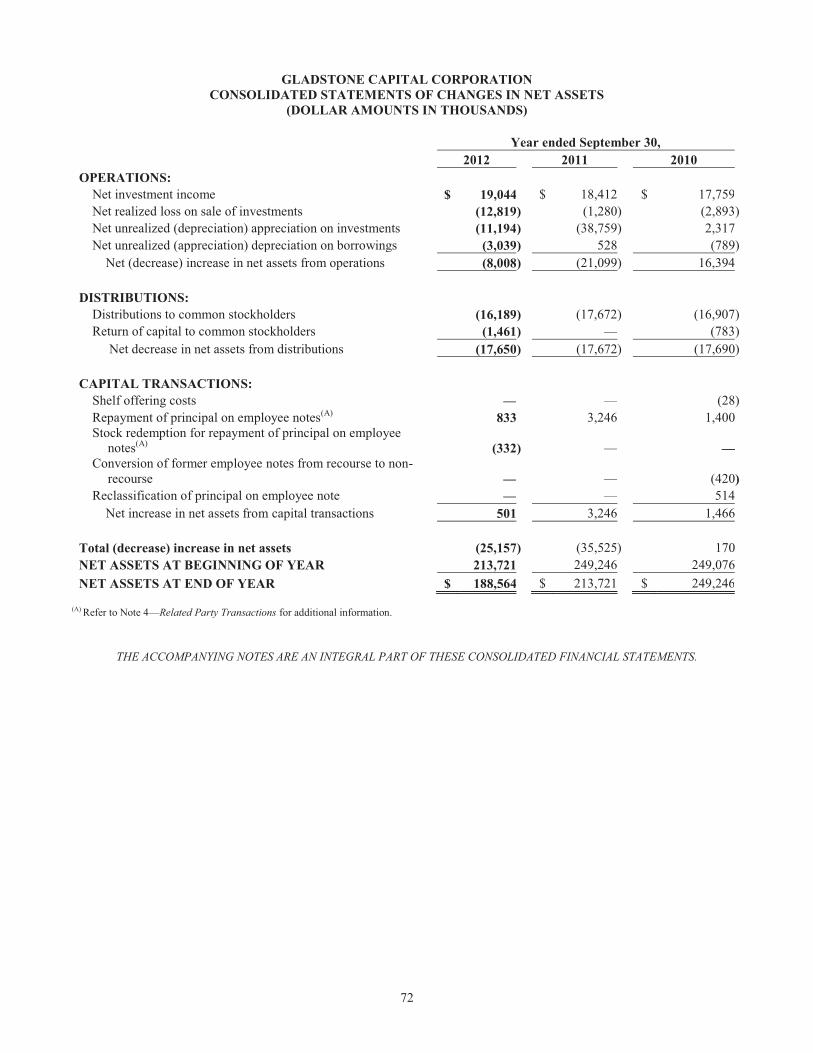
72
GLADSTONE CAPITAL CORPORATION CONSOLIDATED STATEMENTS OF CHANGES IN NET ASSETS
(DOLLAR AMOUNTS IN THOUSANDS)
Year ended September 30, 2012 2011 2010 OPERATIONS:
Net investment income $ 19,044 $ 18,412 $ 17,759 Net realized loss on sale of investments (12,819) (1,280 ) (2,893) Net unrealized (depreciation) appreciation on investments (11,194) (38,759 ) 2,317 Net unrealized (appreciation) depreciation on borrowings (3,039) 528 (789)
Net (decrease) increase in net assets from operations (8,008) (21,099 ) 16,394 DISTRIBUTIONS:
Distributions to common stockholders (16,189) (17,672 ) (16,907) Return of capital to common stockholders (1,461) — (783)
Net decrease in net assets from distributions (17,650) (17,672 ) (17,690) CAPITAL TRANSACTIONS:
Shelf offering costs — — (28) Repayment of principal on employee notes(A) 833 3,246 1,400 Stock redemption for repayment of principal on employee
notes(A) (332) — — Conversion of former employee notes from recourse to non-
recourse — — (420) Reclassification of principal on employee note — — 514
Net increase in net assets from capital transactions 501 3,246 1,466 Total (decrease) increase in net assets (25,157) (35,525 ) 170 NET ASSETS AT BEGINNING OF YEAR 213,721 249,246 249,076 NET ASSETS AT END OF YEAR $ 188,564 $ 213,721 $ 249,246
(A) Refer to Note 4—Related Party Transactions for additional information.
THE ACCOMPANYING NOTES ARE AN INTEGRAL PART OF THESE CONSOLIDATED FINANCIAL STATEMENTS.
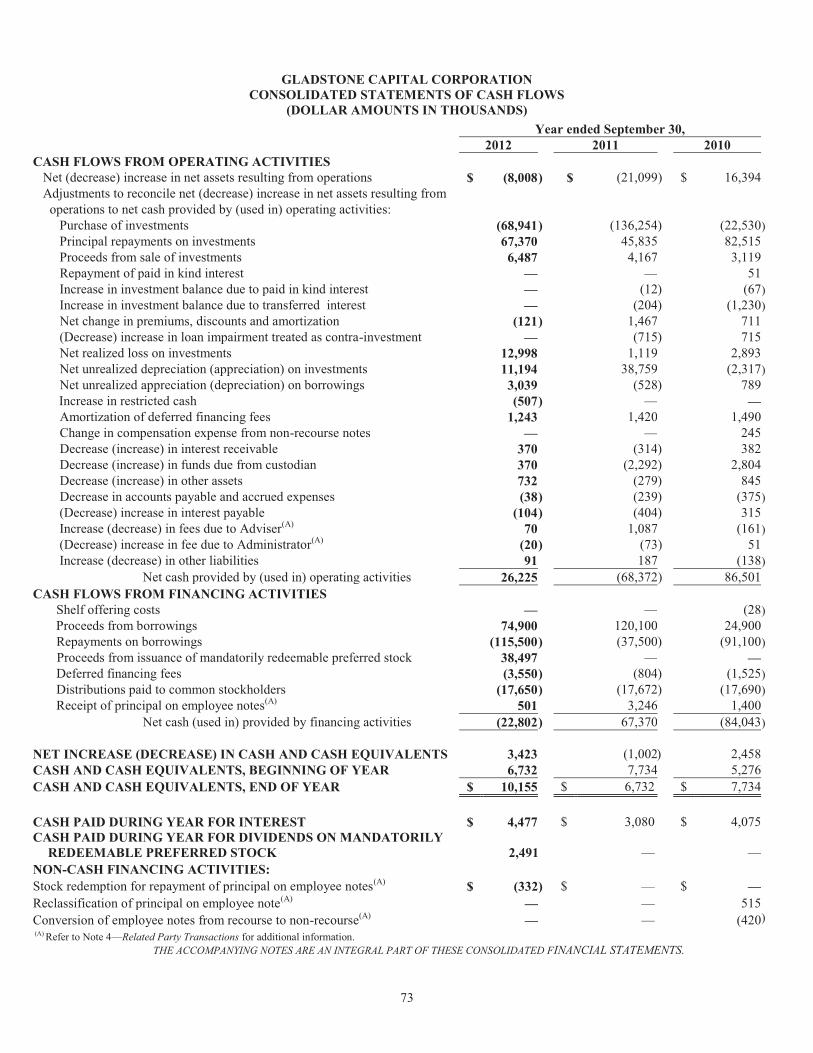
73
GLADSTONE CAPITAL CORPORATION CONSOLIDATED STATEMENTS OF CASH FLOWS
(DOLLAR AMOUNTS IN THOUSANDS)
Year ended September 30, 2012 2011 2010 CASH FLOWS FROM OPERATING ACTIVITIES Net (decrease) increase in net assets resulting from operations $ (8,008 ) $ (21,099) $ 16,394 Adjustments to reconcile net (decrease) increase in net assets resulting from operations to net cash provided by (used in) operating activities: Purchase of investments (68,941 ) (136,254) (22,530 ) Principal repayments on investments 67,370 45,835 82,515 Proceeds from sale of investments 6,487 4,167 3,119 Repayment of paid in kind interest — — 51 Increase in investment balance due to paid in kind interest — (12) (67 ) Increase in investment balance due to transferred interest — (204) (1,230 ) Net change in premiums, discounts and amortization (121 ) 1,467 711 (Decrease) increase in loan impairment treated as contra-investment — (715) 715 Net realized loss on investments 12,998 1,119 2,893 Net unrealized depreciation (appreciation) on investments 11,194 38,759 (2,317 ) Net unrealized appreciation (depreciation) on borrowings 3,039 (528) 789
Increase in restricted cash (507 ) — — Amortization of deferred financing fees 1,243 1,420 1,490 Change in compensation expense from non-recourse notes — — 245 Decrease (increase) in interest receivable 370 (314) 382 Decrease (increase) in funds due from custodian 370 (2,292) 2,804 Decrease (increase) in other assets 732 (279) 845 Decrease in accounts payable and accrued expenses (38 ) (239) (375 ) (Decrease) increase in interest payable (104 ) (404) 315 Increase (decrease) in fees due to Adviser(A) 70 1,087 (161 ) (Decrease) increase in fee due to Administrator(A) (20 ) (73) 51 Increase (decrease) in other liabilities 91 187 (138 ) Net cash provided by (used in) operating activities 26,225 (68,372) 86,501 CASH FLOWS FROM FINANCING ACTIVITIES Shelf offering costs — — (28 ) Proceeds from borrowings 74,900 120,100 24,900 Repayments on borrowings (115,500 ) (37,500) (91,100 )
Proceeds from issuance of mandatorily redeemable preferred stock 38,497 — — Deferred financing fees (3,550 ) (804) (1,525 ) Distributions paid to common stockholders (17,650 ) (17,672) (17,690 ) Receipt of principal on employee notes(A) 501 3,246 1,400 Net cash (used in) provided by financing activities (22,802 ) 67,370 (84,043 )
NET INCREASE (DECREASE) IN CASH AND CASH EQUIVALENTS 3,423 (1,002) 2,458 CASH AND CASH EQUIVALENTS, BEGINNING OF YEAR 6,732 7,734 5,276 CASH AND CASH EQUIVALENTS, END OF YEAR $ 10,155 $ 6,732 $ 7,734
CASH PAID DURING YEAR FOR INTEREST $ 4,477 $ 3,080 $ 4,075 CASH PAID DURING YEAR FOR DIVIDENDS ON MANDATORILY
REDEEMABLE PREFERRED STOCK 2,491 — —
NON-CASH FINANCING ACTIVITIES: Stock redemption for repayment of principal on employee notes(A) $ (332) $ — $ —
Reclassification of principal on employee note(A) — — 515
Conversion of employee notes from recourse to non-recourse(A) — — (420 ) (A) Refer to Note 4—Related Party Transactions for additional information.
THE ACCOMPANYING NOTES ARE AN INTEGRAL PART OF THESE CONSOLIDATED FINANCIAL STATEMENTS.
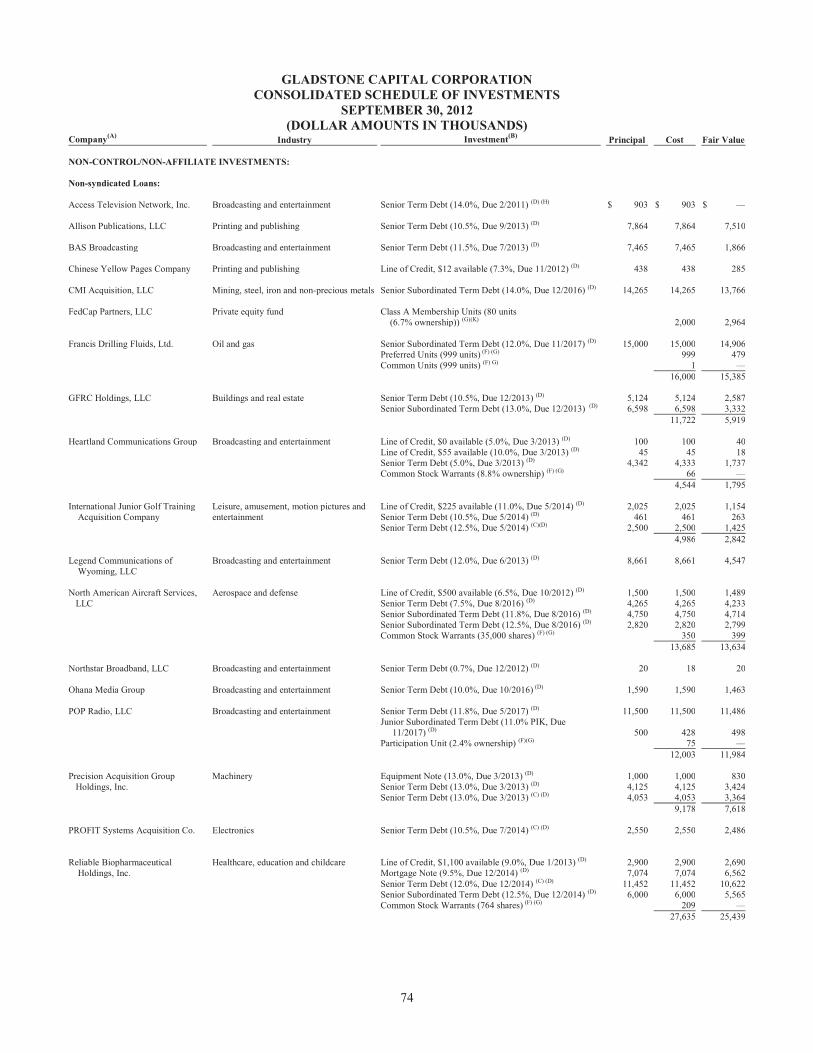
74
GLADSTONE CAPITAL CORPORATION CONSOLIDATED SCHEDULE OF INVESTMENTS
SEPTEMBER 30, 2012 (DOLLAR AMOUNTS IN THOUSANDS)
Company(A) Industry Investment(B) Principal Cost Fair Value NON-CONTROL/NON-AFFILIATE INVESTMENTS: Non-syndicated Loans: Access Television Network, Inc. Broadcasting and entertainment Senior Term Debt (14.0%, Due 2/2011) (D) (H) $ 903 $ 903 $ — Allison Publications, LLC Printing and publishing Senior Term Debt (10.5%, Due 9/2013) (D) 7,864 7,864 7,510 BAS Broadcasting Broadcasting and entertainment Senior Term Debt (11.5%, Due 7/2013) (D) 7,465 7,465 1,866 Chinese Yellow Pages Company Printing and publishing Line of Credit, $12 available (7.3%, Due 11/2012) (D) 438 438 285 CMI Acquisition, LLC Mining, steel, iron and non-precious metals Senior Subordinated Term Debt (14.0%, Due 12/2016) (D) 14,265 14,265 13,766 FedCap Partners, LLC Private equity fund Class A Membership Units (80 units (6.7% ownership)) (G)(K) 2,000 2,964 Francis Drilling Fluids, Ltd. Oil and gas Senior Subordinated Term Debt (12.0%, Due 11/2017) (D) 15,000 15,000 14,906 Preferred Units (999 units) (F) (G) 999 479 Common Units (999 units) (F) G) 1 — 16,000 15,385 GFRC Holdings, LLC Buildings and real estate Senior Term Debt (10.5%, Due 12/2013) (D) 5,124 5,124 2,587 Senior Subordinated Term Debt (13.0%, Due 12/2013) (D) 6,598 6,598 3,332 11,722 5,919 Heartland Communications Group Broadcasting and entertainment Line of Credit, $0 available (5.0%, Due 3/2013) (D) 100 100 40 Line of Credit, $55 available (10.0%, Due 3/2013) (D) 45 45 18 Senior Term Debt (5.0%, Due 3/2013) (D) 4,342 4,333 1,737 Common Stock Warrants (8.8% ownership) (F) (G) 66 — 4,544 1,795 International Junior Golf Training Leisure, amusement, motion pictures and Line of Credit, $225 available (11.0%, Due 5/2014) (D) 2,025 2,025 1,154 Acquisition Company entertainment Senior Term Debt (10.5%, Due 5/2014) (D) 461 461 263 Senior Term Debt (12.5%, Due 5/2014) (C)(D) 2,500 2,500 1,425 4,986 2,842 Legend Communications of Broadcasting and entertainment Senior Term Debt (12.0%, Due 6/2013) (D) 8,661 8,661 4,547 Wyoming, LLC North American Aircraft Services, Aerospace and defense Line of Credit, $500 available (6.5%, Due 10/2012) (D) 1,500 1,500 1,489 LLC Senior Term Debt (7.5%, Due 8/2016) (D) 4,265 4,265 4,233 Senior Subordinated Term Debt (11.8%, Due 8/2016) (D) 4,750 4,750 4,714 Senior Subordinated Term Debt (12.5%, Due 8/2016) (D) 2,820 2,820 2,799 Common Stock Warrants (35,000 shares) (F) (G) 350 399 13,685 13,634 Northstar Broadband, LLC Broadcasting and entertainment Senior Term Debt (0.7%, Due 12/2012) (D) 20 18 20 Ohana Media Group Broadcasting and entertainment Senior Term Debt (10.0%, Due 10/2016) (D) 1,590 1,590 1,463 POP Radio, LLC Broadcasting and entertainment Senior Term Debt (11.8%, Due 5/2017) (D) 11,500 11,500 11,486 Junior Subordinated Term Debt (11.0% PIK, Due 11/2017) (D) 500 428 498 Participation Unit (2.4% ownership) (F)(G) 75 — 12,003 11,984 Precision Acquisition Group Machinery Equipment Note (13.0%, Due 3/2013) (D) 1,000 1,000 830 Holdings, Inc. Senior Term Debt (13.0%, Due 3/2013) (D) 4,125 4,125 3,424 Senior Term Debt (13.0%, Due 3/2013) (C) (D) 4,053 4,053 3,364 9,178 7,618 PROFIT Systems Acquisition Co. Electronics Senior Term Debt (10.5%, Due 7/2014) (C) (D) 2,550 2,550 2,486 Reliable Biopharmaceutical Healthcare, education and childcare Line of Credit, $1,100 available (9.0%, Due 1/2013) (D) 2,900 2,900 2,690 Holdings, Inc. Mortgage Note (9.5%, Due 12/2014) (D) 7,074 7,074 6,562 Senior Term Debt (12.0%, Due 12/2014) (C) (D) 11,452 11,452 10,622 Senior Subordinated Term Debt (12.5%, Due 12/2014) (D) 6,000 6,000 5,565 Common Stock Warrants (764 shares) (F) (G) 209 — 27,635 25,439
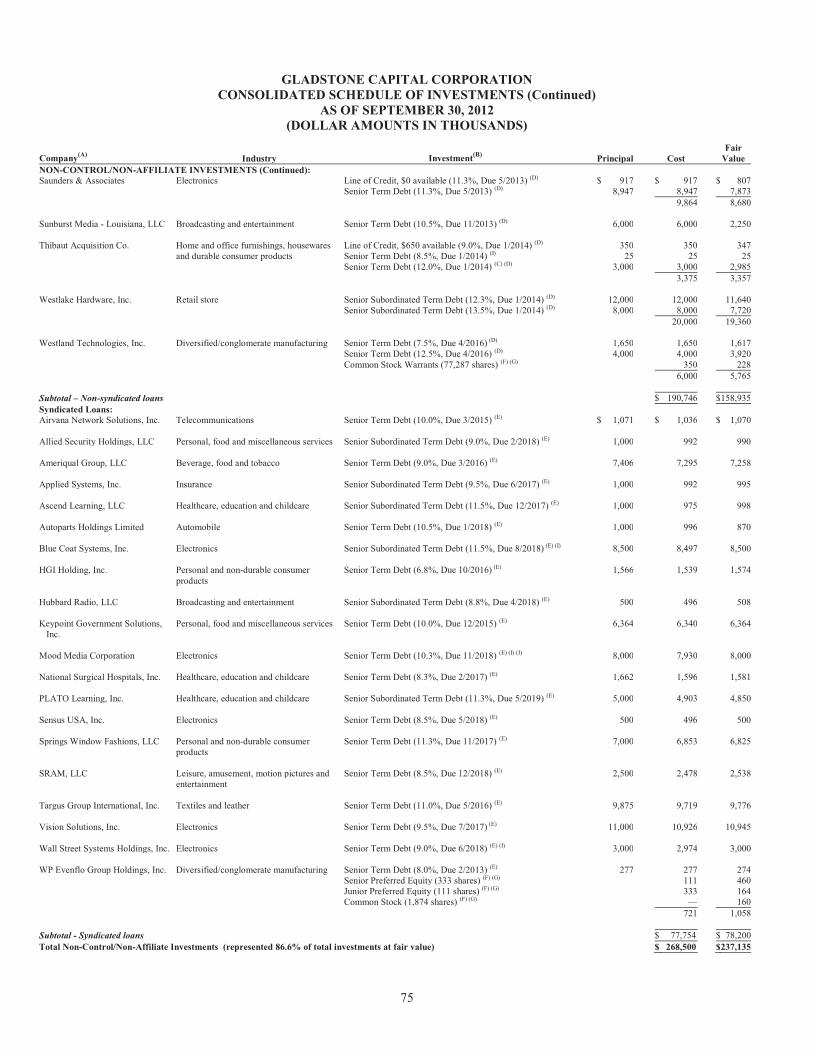
75
GLADSTONE CAPITAL CORPORATION CONSOLIDATED SCHEDULE OF INVESTMENTS (Continued)
AS OF SEPTEMBER 30, 2012 (DOLLAR AMOUNTS IN THOUSANDS)
Company(A) Industry Investment(B)
Principal
Cost Fair
Value NON-CONTROL/NON-AFFILIATE INVESTMENTS (Continued): Saunders & Associates Electronics Line of Credit, $0 available (11.3%, Due 5/2013) (D) $ 917 $ 917 $ 807 Senior Term Debt (11.3%, Due 5/2013) (D) 8,947 8,947 7,873 9,864 8,680 Sunburst Media - Louisiana, LLC Broadcasting and entertainment Senior Term Debt (10.5%, Due 11/2013) (D) 6,000 6,000 2,250 Thibaut Acquisition Co. Home and office furnishings, housewares Line of Credit, $650 available (9.0%, Due 1/2014) (D) 350 350 347 and durable consumer products Senior Term Debt (8.5%, Due 1/2014) (I) 25 25 25 Senior Term Debt (12.0%, Due 1/2014) (C) (D) 3,000 3,000 2,985 3,375 3,357 Westlake Hardware, Inc. Retail store Senior Subordinated Term Debt (12.3%, Due 1/2014) (D) 12,000 12,000 11,640 Senior Subordinated Term Debt (13.5%, Due 1/2014) (D) 8,000 8,000 7,720 20,000 19,360 Westland Technologies, Inc. Diversified/conglomerate manufacturing Senior Term Debt (7.5%, Due 4/2016) (D) 1,650 1,650 1,617 Senior Term Debt (12.5%, Due 4/2016) (D) 4,000 4,000 3,920 Common Stock Warrants (77,287 shares) (F) (G) 350 228 6,000 5,765 Subtotal – Non-syndicated loans $ 190,746 $ 158,935 Syndicated Loans: Airvana Network Solutions, Inc. Telecommunications Senior Term Debt (10.0%, Due 3/2015) (E) $ 1,071 $ 1,036 $ 1,070 Allied Security Holdings, LLC Personal, food and miscellaneous services Senior Subordinated Term Debt (9.0%, Due 2/2018) (E) 1,000 992 990 Ameriqual Group, LLC Beverage, food and tobacco Senior Term Debt (9.0%, Due 3/2016) (E) 7,406 7,295 7,258 Applied Systems, Inc. Insurance Senior Subordinated Term Debt (9.5%, Due 6/2017) (E) 1,000 992 995 Ascend Learning, LLC Healthcare, education and childcare Senior Subordinated Term Debt (11.5%, Due 12/2017) (E) 1,000 975 998 Autoparts Holdings Limited Automobile Senior Term Debt (10.5%, Due 1/2018) (E) 1,000 996 870 Blue Coat Systems, Inc. Electronics Senior Subordinated Term Debt (11.5%, Due 8/2018) (E) (I) 8,500 8,497 8,500 HGI Holding, Inc. Personal and non-durable consumer Senior Term Debt (6.8%, Due 10/2016) (E) 1,566 1,539 1,574 products Hubbard Radio, LLC Broadcasting and entertainment Senior Subordinated Term Debt (8.8%, Due 4/2018) (E) 500 496 508 Keypoint Government Solutions, Personal, food and miscellaneous services Senior Term Debt (10.0%, Due 12/2015) (E) 6,364 6,340 6,364 Inc. Mood Media Corporation Electronics Senior Term Debt (10.3%, Due 11/2018) (E) (I) (J) 8,000 7,930 8,000 National Surgical Hospitals, Inc. Healthcare, education and childcare Senior Term Debt (8.3%, Due 2/2017) (E) 1,662 1,596 1,581 PLATO Learning, Inc. Healthcare, education and childcare Senior Subordinated Term Debt (11.3%, Due 5/2019) (E) 5,000 4,903 4,850 Sensus USA, Inc. Electronics Senior Term Debt (8.5%, Due 5/2018) (E) 500 496 500 Springs Window Fashions, LLC Personal and non-durable consumer Senior Term Debt (11.3%, Due 11/2017) (E) 7,000 6,853 6,825 products SRAM, LLC Leisure, amusement, motion pictures and Senior Term Debt (8.5%, Due 12/2018) (E) 2,500 2,478 2,538 entertainment Targus Group International, Inc. Textiles and leather Senior Term Debt (11.0%, Due 5/2016) (E) 9,875 9,719 9,776 Vision Solutions, Inc. Electronics Senior Term Debt (9.5%, Due 7/2017) (E) 11,000 10,926 10,945 Wall Street Systems Holdings, Inc. Electronics Senior Term Debt (9.0%, Due 6/2018) (E) (I) 3,000 2,974 3,000 WP Evenflo Group Holdings, Inc. Diversified/conglomerate manufacturing Senior Term Debt (8.0%, Due 2/2013) (E) 277 277 274 Senior Preferred Equity (333 shares) (F) (G) 111 460 Junior Preferred Equity (111 shares) (F) (G) 333 164 Common Stock (1,874 shares) (F) (G) — 160 721 1,058 Subtotal - Syndicated loans $ 77,754 $ 78,200 Total Non-Control/Non-Affiliate Investments (represented 86.6% of total investments at fair value) $ 268,500 $ 237,135
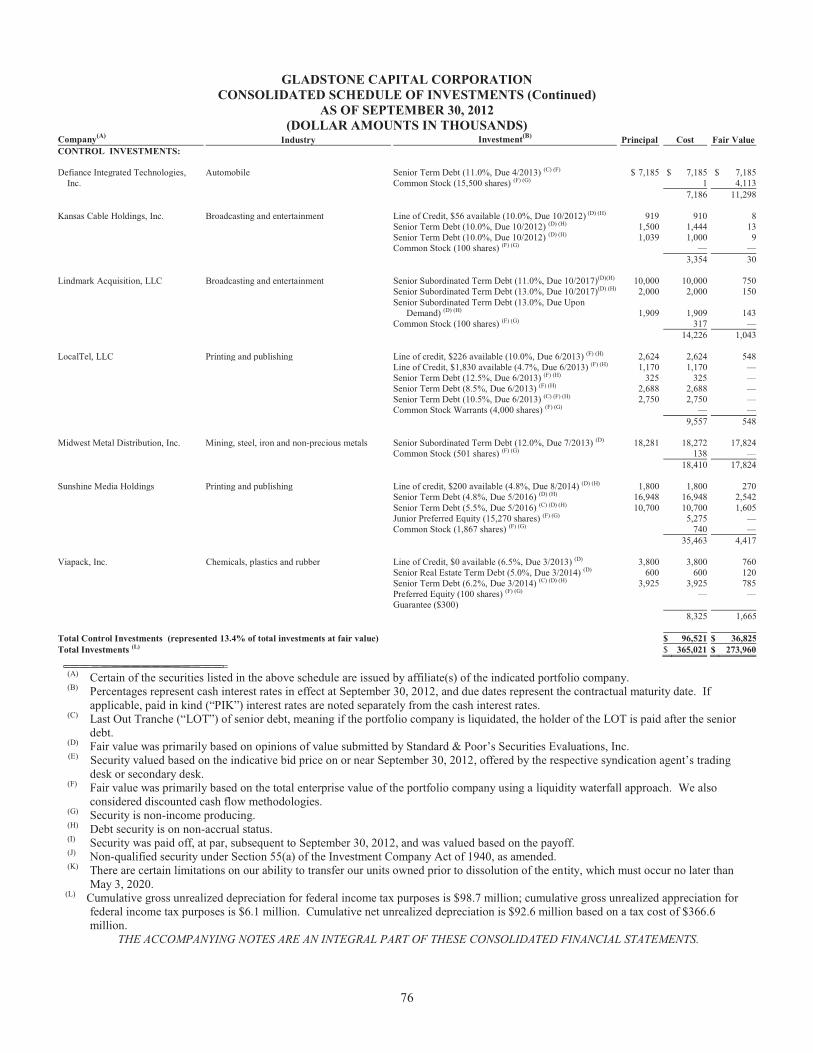
76
GLADSTONE CAPITAL CORPORATION CONSOLIDATED SCHEDULE OF INVESTMENTS (Continued)
AS OF SEPTEMBER 30, 2012 (DOLLAR AMOUNTS IN THOUSANDS)
Company(A) Industry Investment(B) Principal Cost Fair Value CONTROL INVESTMENTS: Defiance Integrated Technologies, Automobile Senior Term Debt (11.0%, Due 4/2013) (C) (F) $ 7,185 $ 7,185 $ 7,185 Inc. Common Stock (15,500 shares) (F) (G) 1 4,113 7,186 11,298 Kansas Cable Holdings, Inc. Broadcasting and entertainment Line of Credit, $56 available (10.0%, Due 10/2012) (D) (H) 919 910 8 Senior Term Debt (10.0%, Due 10/2012) (D) (H) 1,500 1,444 13 Senior Term Debt (10.0%, Due 10/2012) (D) (H) 1,039 1,000 9 Common Stock (100 shares) (F) (G) — — 3,354 30 Lindmark Acquisition, LLC Broadcasting and entertainment Senior Subordinated Term Debt (11.0%, Due 10/2017)(D)(H) 10,000 10,000 750 Senior Subordinated Term Debt (13.0%, Due 10/2017)(D) (H) 2,000 2,000 150 Senior Subordinated Term Debt (13.0%, Due Upon
Demand) (D) (H) 1,909
1,909 143 Common Stock (100 shares) (F) (G) 317 — 14,226 1,043 LocalTel, LLC Printing and publishing Line of credit, $226 available (10.0%, Due 6/2013) (F) (H) 2,624 2,624 548 Line of Credit, $1,830 available (4.7%, Due 6/2013) (F) (H) 1,170 1,170 — Senior Term Debt (12.5%, Due 6/2013) (F) (H) 325 325 — Senior Term Debt (8.5%, Due 6/2013) (F) (H) 2,688 2,688 — Senior Term Debt (10.5%, Due 6/2013) (C) (F) (H) 2,750 2,750 — Common Stock Warrants (4,000 shares) (F) (G) — — 9,557 548 Midwest Metal Distribution, Inc. Mining, steel, iron and non-precious metals Senior Subordinated Term Debt (12.0%, Due 7/2013) (D) 18,281 18,272 17,824 Common Stock (501 shares) (F) (G) 138 — 18,410 17,824 Sunshine Media Holdings Printing and publishing Line of credit, $200 available (4.8%, Due 8/2014) (D) (H) 1,800 1,800 270 Senior Term Debt (4.8%, Due 5/2016) (D) (H) 16,948 16,948 2,542 Senior Term Debt (5.5%, Due 5/2016) (C) (D) (H) 10,700 10,700 1,605 Junior Preferred Equity (15,270 shares) (F) (G) 5,275 — Common Stock (1,867 shares) (F) (G) 740 — 35,463 4,417 Viapack, Inc. Chemicals, plastics and rubber Line of Credit, $0 available (6.5%, Due 3/2013) (D) 3,800 3,800 760 Senior Real Estate Term Debt (5.0%, Due 3/2014) (D) 600 600 120 Senior Term Debt (6.2%, Due 3/2014) (C) (D) (H) 3,925 3,925 785 Preferred Equity (100 shares) (F) (G) — — Guarantee ($300) 8,325 1,665 Total Control Investments (represented 13.4% of total investments at fair value) $ 96,521 $ 36,825Total Investments (L) $ 365,021 $ 273,960
(A) Certain of the securities listed in the above schedule are issued by affiliate(s) of the indicated portfolio company. (B) Percentages represent cash interest rates in effect at September 30, 2012, and due dates represent the contractual maturity date. If
applicable, paid in kind (“PIK”) interest rates are noted separately from the cash interest rates. (C) Last Out Tranche (“LOT”) of senior debt, meaning if the portfolio company is liquidated, the holder of the LOT is paid after the senior
debt. (D) Fair value was primarily based on opinions of value submitted by Standard & Poor’s Securities Evaluations, Inc.
(E) Security valued based on the indicative bid price on or near September 30, 2012, offered by the respective syndication agent’s trading desk or secondary desk.
(F) Fair value was primarily based on the total enterprise value of the portfolio company using a liquidity waterfall approach. We also considered discounted cash flow methodologies.
(G) Security is non-income producing. (H) Debt security is on non-accrual status. (I) Security was paid off, at par, subsequent to September 30, 2012, and was valued based on the payoff. (J) Non-qualified security under Section 55(a) of the Investment Company Act of 1940, as amended. (K) There are certain limitations on our ability to transfer our units owned prior to dissolution of the entity, which must occur no later than
May 3, 2020. (L) Cumulative gross unrealized depreciation for federal income tax purposes is $98.7 million; cumulative gross unrealized appreciation for
federal income tax purposes is $6.1 million. Cumulative net unrealized depreciation is $92.6 million based on a tax cost of $366.6 million.
THE ACCOMPANYING NOTES ARE AN INTEGRAL PART OF THESE CONSOLIDATED FINANCIAL STATEMENTS.
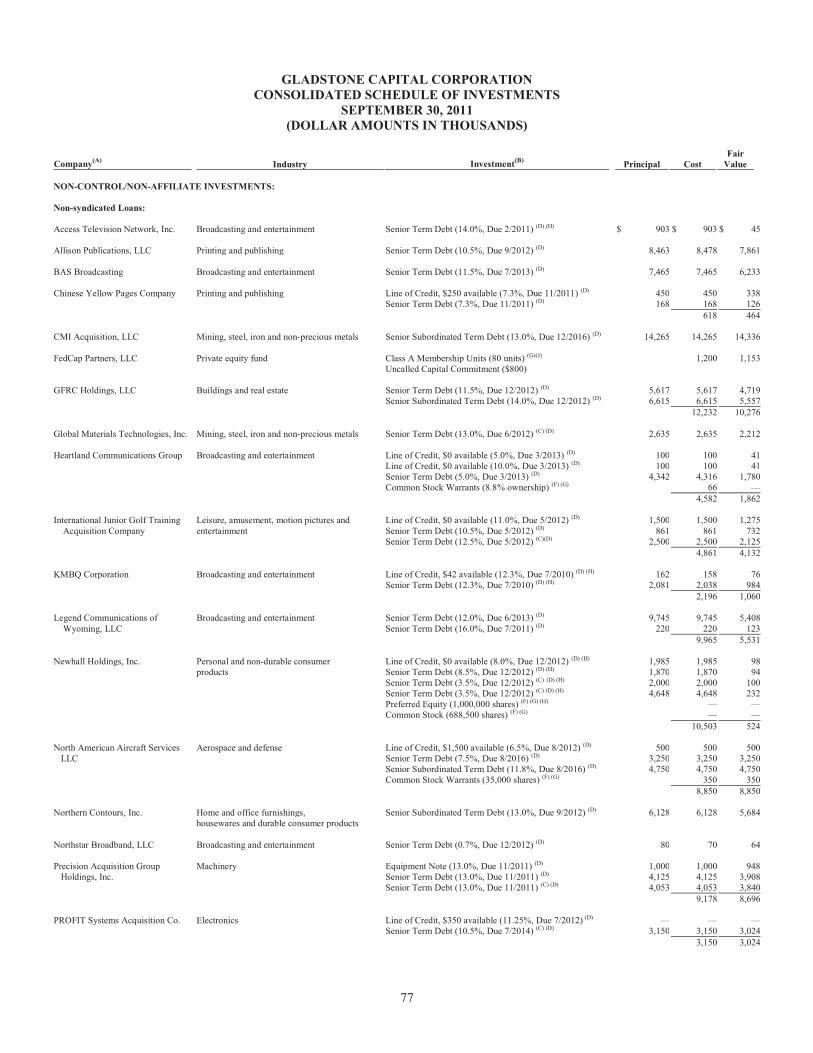
77
GLADSTONE CAPITAL CORPORATION CONSOLIDATED SCHEDULE OF INVESTMENTS
SEPTEMBER 30, 2011 (DOLLAR AMOUNTS IN THOUSANDS)
Company(A) Industry Investment(B)
Principal
Cost Fair
Value NON-CONTROL/NON-AFFILIATE INVESTMENTS: Non-syndicated Loans: Access Television Network, Inc. Broadcasting and entertainment Senior Term Debt (14.0%, Due 2/2011) (D) (H) $ 903 $ 903 $ 45 Allison Publications, LLC Printing and publishing Senior Term Debt (10.5%, Due 9/2012) (D) 8,463 8,478 7,861 BAS Broadcasting Broadcasting and entertainment Senior Term Debt (11.5%, Due 7/2013) (D) 7,465 7,465 6,233 Chinese Yellow Pages Company Printing and publishing Line of Credit, $250 available (7.3%, Due 11/2011) (D) 450 450 338 Senior Term Debt (7.3%, Due 11/2011) (D) 168 168 126 618 464 CMI Acquisition, LLC Mining, steel, iron and non-precious metals Senior Subordinated Term Debt (13.0%, Due 12/2016) (D) 14,265 14,265 14,336 FedCap Partners, LLC Private equity fund Class A Membership Units (80 units) (G)(J) 1,200 1,153 Uncalled Capital Commitment ($800) GFRC Holdings, LLC Buildings and real estate Senior Term Debt (11.5%, Due 12/2012) (D) 5,617 5,617 4,719 Senior Subordinated Term Debt (14.0%, Due 12/2012) (D) 6,615 6,615 5,557 12,232 10,276 Global Materials Technologies, Inc. Mining, steel, iron and non-precious metals Senior Term Debt (13.0%, Due 6/2012) (C) (D) 2,635 2,635 2,212 Heartland Communications Group Broadcasting and entertainment Line of Credit, $0 available (5.0%, Due 3/2013) (D) 100 100 41 Line of Credit, $0 available (10.0%, Due 3/2013) (D) 100 100 41 Senior Term Debt (5.0%, Due 3/2013) (D) 4,342 4,316 1,780 Common Stock Warrants (8.8% ownership) (F) (G) 66 — 4,582 1,862 International Junior Golf Training Leisure, amusement, motion pictures and Line of Credit, $0 available (11.0%, Due 5/2012) (D) 1,500 1,500 1,275 Acquisition Company entertainment Senior Term Debt (10.5%, Due 5/2012) (D) 861 861 732 Senior Term Debt (12.5%, Due 5/2012) (C)(D) 2,500 2,500 2,125 4,861 4,132 KMBQ Corporation Broadcasting and entertainment Line of Credit, $42 available (12.3%, Due 7/2010) (D) (H) 162 158 76 Senior Term Debt (12.3%, Due 7/2010) (D) (H) 2,081 2,038 984 2,196 1,060 Legend Communications of Broadcasting and entertainment Senior Term Debt (12.0%, Due 6/2013) (D) 9,745 9,745 5,408 Wyoming, LLC Senior Term Debt (16.0%, Due 7/2011) (D) 220 220 123 9,965 5,531 Newhall Holdings, Inc. Personal and non-durable consumer Line of Credit, $0 available (8.0%, Due 12/2012) (D) (H) 1,985 1,985 98 products Senior Term Debt (8.5%, Due 12/2012) (D) (H) 1,870 1,870 94 Senior Term Debt (3.5%, Due 12/2012) (C) (D) (H) 2,000 2,000 100 Senior Term Debt (3.5%, Due 12/2012) (C) (D) (H) 4,648 4,648 232 Preferred Equity (1,000,000 shares) (F) (G) (H) — — Common Stock (688,500 shares) (F) (G) — — 10,503 524 North American Aircraft Services Aerospace and defense Line of Credit, $1,500 available (6.5%, Due 8/2012) (D) 500 500 500 LLC Senior Term Debt (7.5%, Due 8/2016) (D) 3,250 3,250 3,250 Senior Subordinated Term Debt (11.8%, Due 8/2016) (D) 4,750 4,750 4,750 Common Stock Warrants (35,000 shares) (F) (G) 350 350 8,850 8,850 Northern Contours, Inc. Home and office furnishings, Senior Subordinated Term Debt (13.0%, Due 9/2012) (D) 6,128 6,128 5,684 housewares and durable consumer products Northstar Broadband, LLC Broadcasting and entertainment Senior Term Debt (0.7%, Due 12/2012) (D) 80 70 64 Precision Acquisition Group Machinery Equipment Note (13.0%, Due 11/2011) (D) 1,000 1,000 948 Holdings, Inc. Senior Term Debt (13.0%, Due 11/2011) (D) 4,125 4,125 3,908 Senior Term Debt (13.0%, Due 11/2011) (C) (D) 4,053 4,053 3,840 9,178 8,696 PROFIT Systems Acquisition Co. Electronics Line of Credit, $350 available (11.25%, Due 7/2012) (D) — — — Senior Term Debt (10.5%, Due 7/2014) (C) (D) 3,150 3,150 3,024 3,150 3,024
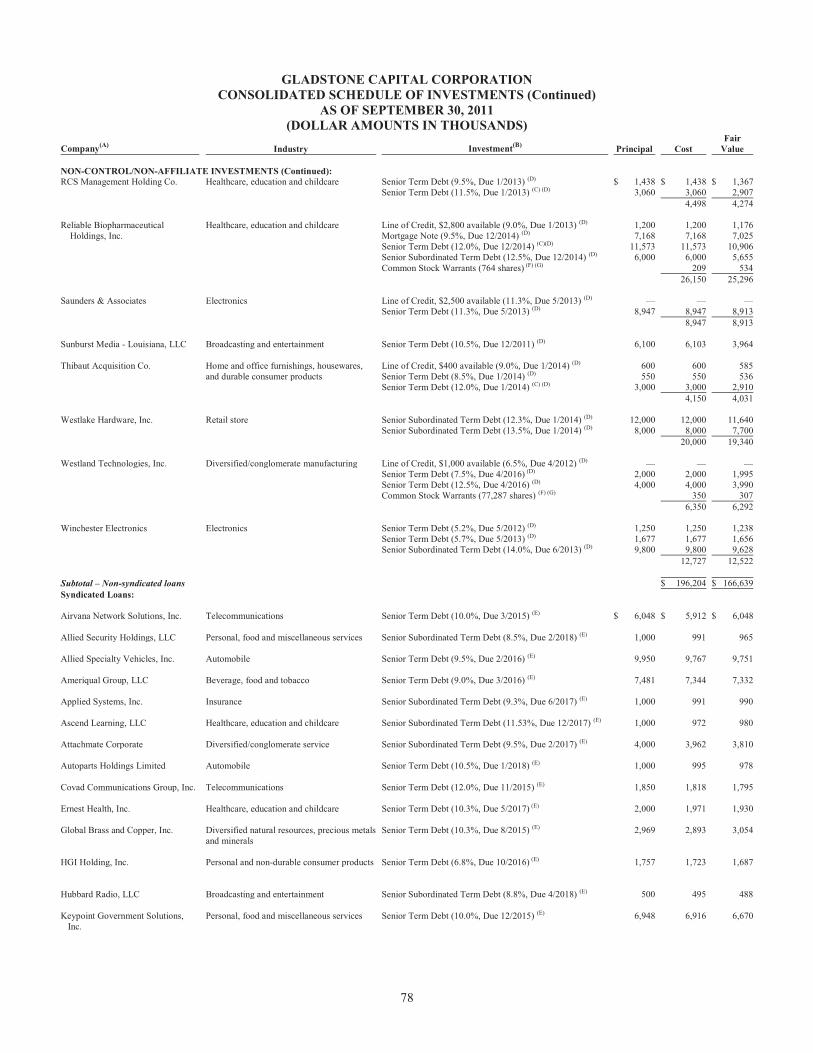
78
GLADSTONE CAPITAL CORPORATION CONSOLIDATED SCHEDULE OF INVESTMENTS (Continued)
AS OF SEPTEMBER 30, 2011 (DOLLAR AMOUNTS IN THOUSANDS)
Company(A) Industry Investment(B)
Principal
Cost Fair
Value NON-CONTROL/NON-AFFILIATE INVESTMENTS (Continued): RCS Management Holding Co. Healthcare, education and childcare Senior Term Debt (9.5%, Due 1/2013) (D) $ 1,438 $ 1,438 $ 1,367 Senior Term Debt (11.5%, Due 1/2013) (C) (D) 3,060 3,060 2,907 4,498 4,274 Reliable Biopharmaceutical Healthcare, education and childcare Line of Credit, $2,800 available (9.0%, Due 1/2013) (D) 1,200 1,200 1,176 Holdings, Inc. Mortgage Note (9.5%, Due 12/2014) (D) 7,168 7,168 7,025 Senior Term Debt (12.0%, Due 12/2014) (C)(D) 11,573 11,573 10,906 Senior Subordinated Term Debt (12.5%, Due 12/2014) (D) 6,000 6,000 5,655 Common Stock Warrants (764 shares) (F) (G) 209 534 26,150 25,296 Saunders & Associates Electronics Line of Credit, $2,500 available (11.3%, Due 5/2013) (D) — — — Senior Term Debt (11.3%, Due 5/2013) (D) 8,947 8,947 8,913 8,947 8,913 Sunburst Media - Louisiana, LLC Broadcasting and entertainment Senior Term Debt (10.5%, Due 12/2011) (D) 6,100 6,103 3,964 Thibaut Acquisition Co. Home and office furnishings, housewares, Line of Credit, $400 available (9.0%, Due 1/2014) (D) 600 600 585 and durable consumer products Senior Term Debt (8.5%, Due 1/2014) (D) 550 550 536 Senior Term Debt (12.0%, Due 1/2014) (C) (D) 3,000 3,000 2,910 4,150 4,031 Westlake Hardware, Inc. Retail store Senior Subordinated Term Debt (12.3%, Due 1/2014) (D) 12,000 12,000 11,640 Senior Subordinated Term Debt (13.5%, Due 1/2014) (D) 8,000 8,000 7,700 20,000 19,340 Westland Technologies, Inc. Diversified/conglomerate manufacturing Line of Credit, $1,000 available (6.5%, Due 4/2012) (D) — — — Senior Term Debt (7.5%, Due 4/2016) (D) 2,000 2,000 1,995 Senior Term Debt (12.5%, Due 4/2016) (D) 4,000 4,000 3,990 Common Stock Warrants (77,287 shares) (F) (G) 350 307 6,350 6,292 Winchester Electronics Electronics Senior Term Debt (5.2%, Due 5/2012) (D) 1,250 1,250 1,238 Senior Term Debt (5.7%, Due 5/2013) (D) 1,677 1,677 1,656 Senior Subordinated Term Debt (14.0%, Due 6/2013) (D) 9,800 9,800 9,628 12,727 12,522 Subtotal – Non-syndicated loans $ 196,204 $ 166,639Syndicated Loans: Airvana Network Solutions, Inc. Telecommunications Senior Term Debt (10.0%, Due 3/2015) (E) $ 6,048 $ 5,912 $ 6,048 Allied Security Holdings, LLC Personal, food and miscellaneous services Senior Subordinated Term Debt (8.5%, Due 2/2018) (E) 1,000 991 965 Allied Specialty Vehicles, Inc. Automobile Senior Term Debt (9.5%, Due 2/2016) (E) 9,950 9,767 9,751 Ameriqual Group, LLC Beverage, food and tobacco Senior Term Debt (9.0%, Due 3/2016) (E) 7,481 7,344 7,332 Applied Systems, Inc. Insurance Senior Subordinated Term Debt (9.3%, Due 6/2017) (E) 1,000 991 990 Ascend Learning, LLC Healthcare, education and childcare Senior Subordinated Term Debt (11.53%, Due 12/2017) (E) 1,000 972 980 Attachmate Corporate Diversified/conglomerate service Senior Subordinated Term Debt (9.5%, Due 2/2017) (E) 4,000 3,962 3,810 Autoparts Holdings Limited Automobile Senior Term Debt (10.5%, Due 1/2018) (E) 1,000 995 978 Covad Communications Group, Inc. Telecommunications Senior Term Debt (12.0%, Due 11/2015) (E) 1,850 1,818 1,795 Ernest Health, Inc. Healthcare, education and childcare Senior Term Debt (10.3%, Due 5/2017) (E) 2,000 1,971 1,930 Global Brass and Copper, Inc. Diversified natural resources, precious metals Senior Term Debt (10.3%, Due 8/2015) (E) 2,969 2,893 3,054 and minerals HGI Holding, Inc. Personal and non-durable consumer products Senior Term Debt (6.8%, Due 10/2016) (E) 1,757 1,723 1,687 Hubbard Radio, LLC Broadcasting and entertainment Senior Subordinated Term Debt (8.8%, Due 4/2018) (E) 500 495 488 Keypoint Government Solutions, Personal, food and miscellaneous services Senior Term Debt (10.0%, Due 12/2015) (E) 6,948 6,916 6,670 Inc.
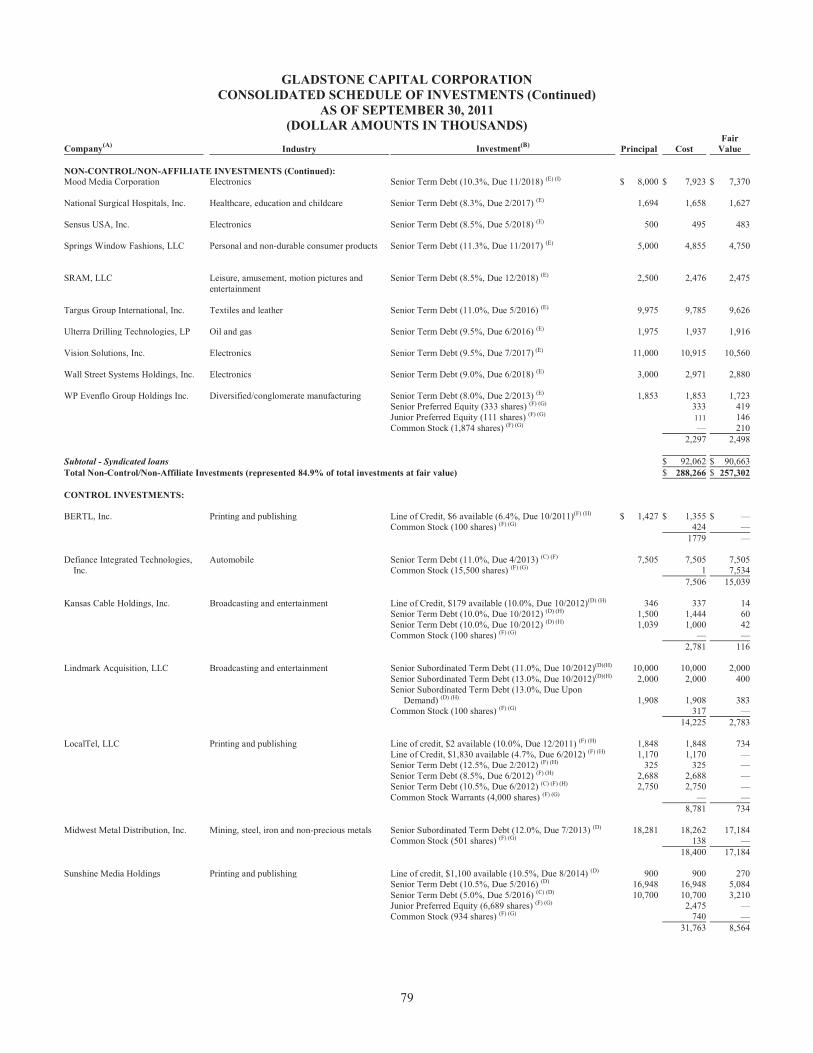
79
GLADSTONE CAPITAL CORPORATION CONSOLIDATED SCHEDULE OF INVESTMENTS (Continued)
AS OF SEPTEMBER 30, 2011 (DOLLAR AMOUNTS IN THOUSANDS)
Company(A) Industry Investment(B) Principal
Cost
Fair Value
NON-CONTROL/NON-AFFILIATE INVESTMENTS (Continued): Mood Media Corporation Electronics Senior Term Debt (10.3%, Due 11/2018) (E) (I) $ 8,000 $ 7,923 $ 7,370 National Surgical Hospitals, Inc. Healthcare, education and childcare Senior Term Debt (8.3%, Due 2/2017) (E) 1,694 1,658 1,627 Sensus USA, Inc. Electronics Senior Term Debt (8.5%, Due 5/2018) (E) 500 495 483 Springs Window Fashions, LLC Personal and non-durable consumer products Senior Term Debt (11.3%, Due 11/2017) (E) 5,000 4,855 4,750 SRAM, LLC Leisure, amusement, motion pictures and Senior Term Debt (8.5%, Due 12/2018) (E) 2,500 2,476 2,475 entertainment Targus Group International, Inc. Textiles and leather Senior Term Debt (11.0%, Due 5/2016) (E) 9,975 9,785 9,626 Ulterra Drilling Technologies, LP Oil and gas Senior Term Debt (9.5%, Due 6/2016) (E) 1,975 1,937 1,916 Vision Solutions, Inc. Electronics Senior Term Debt (9.5%, Due 7/2017) (E) 11,000 10,915 10,560 Wall Street Systems Holdings, Inc. Electronics Senior Term Debt (9.0%, Due 6/2018) (E) 3,000 2,971 2,880 WP Evenflo Group Holdings Inc. Diversified/conglomerate manufacturing Senior Term Debt (8.0%, Due 2/2013) (E) 1,853 1,853 1,723 Senior Preferred Equity (333 shares) (F) (G) 333 419 Junior Preferred Equity (111 shares) (F) (G) 111 146 Common Stock (1,874 shares) (F) (G) — 210 2,297 2,498 Subtotal - Syndicated loans $ 92,062 $ 90,663 Total Non-Control/Non-Affiliate Investments (represented 84.9% of total investments at fair value) $ 288,266 $ 257,302 CONTROL INVESTMENTS: BERTL, Inc. Printing and publishing Line of Credit, $6 available (6.4%, Due 10/2011)(F) (H) $ 1,427 $ 1,355 $ — Common Stock (100 shares) (F) (G) 424 — 1779 — Defiance Integrated Technologies, Automobile Senior Term Debt (11.0%, Due 4/2013) (C) (F) 7,505 7,505 7,505 Inc. Common Stock (15,500 shares) (F) (G) 1 7,534 7,506 15,039 Kansas Cable Holdings, Inc. Broadcasting and entertainment Line of Credit, $179 available (10.0%, Due 10/2012)(D) (H) 346 337 14 Senior Term Debt (10.0%, Due 10/2012) (D) (H) 1,500 1,444 60 Senior Term Debt (10.0%, Due 10/2012) (D) (H) 1,039 1,000 42 Common Stock (100 shares) (F) (G) — — 2,781 116 Lindmark Acquisition, LLC Broadcasting and entertainment Senior Subordinated Term Debt (11.0%, Due 10/2012)(D)(H) 10,000 10,000 2,000 Senior Subordinated Term Debt (13.0%, Due 10/2012)(D)(H) 2,000 2,000 400 Senior Subordinated Term Debt (13.0%, Due Upon
Demand) (D) (H) 1,908
1,908 383 Common Stock (100 shares) (F) (G) 317 — 14,225 2,783 LocalTel, LLC Printing and publishing Line of credit, $2 available (10.0%, Due 12/2011) (F) (H) 1,848 1,848 734 Line of Credit, $1,830 available (4.7%, Due 6/2012) (F) (H) 1,170 1,170 — Senior Term Debt (12.5%, Due 2/2012) (F) (H) 325 325 — Senior Term Debt (8.5%, Due 6/2012) (F) (H) 2,688 2,688 — Senior Term Debt (10.5%, Due 6/2012) (C) (F) (H) 2,750 2,750 — Common Stock Warrants (4,000 shares) (F) (G) — — 8,781 734 Midwest Metal Distribution, Inc. Mining, steel, iron and non-precious metals Senior Subordinated Term Debt (12.0%, Due 7/2013) (D) 18,281 18,262 17,184 Common Stock (501 shares) (F) (G) 138 — 18,400 17,184 Sunshine Media Holdings Printing and publishing Line of credit, $1,100 available (10.5%, Due 8/2014) (D) 900 900 270 Senior Term Debt (10.5%, Due 5/2016) (D) 16,948 16,948 5,084 Senior Term Debt (5.0%, Due 5/2016) (C) (D) 10,700 10,700 3,210 Junior Preferred Equity (6,689 shares) (F) (G) 2,475 — Common Stock (934 shares) (F) (G) 740 — 31,763 8,564
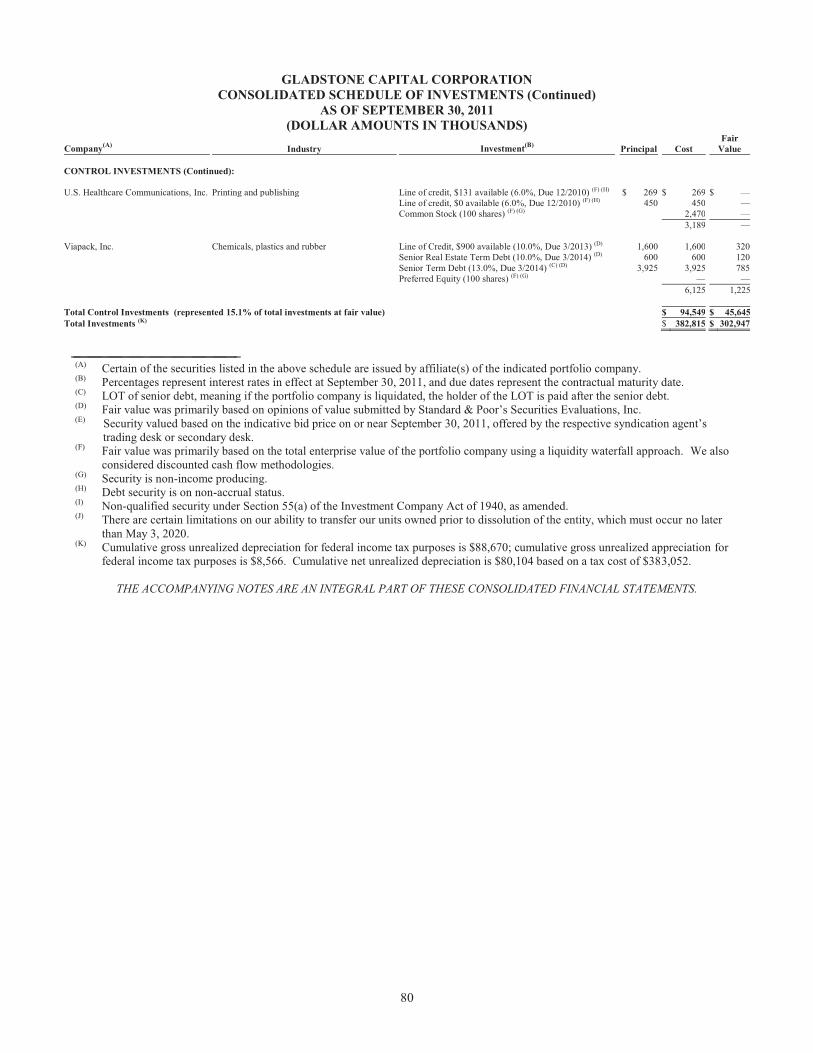
80
GLADSTONE CAPITAL CORPORATION CONSOLIDATED SCHEDULE OF INVESTMENTS (Continued)
AS OF SEPTEMBER 30, 2011 (DOLLAR AMOUNTS IN THOUSANDS)
Company(A) Industry Investment(B) Principal
Cost
Fair Value
CONTROL INVESTMENTS (Continued): U.S. Healthcare Communications, Inc. Printing and publishing Line of credit, $131 available (6.0%, Due 12/2010) (F) (H) $ 269 $ 269 $ — Line of credit, $0 available (6.0%, Due 12/2010) (F) (H) 450 450 — Common Stock (100 shares) (F) (G) 2,470 — 3,189 — Viapack, Inc. Chemicals, plastics and rubber Line of Credit, $900 available (10.0%, Due 3/2013) (D) 1,600 1,600 320 Senior Real Estate Term Debt (10.0%, Due 3/2014) (D) 600 600 120 Senior Term Debt (13.0%, Due 3/2014) (C) (D) 3,925 3,925 785 Preferred Equity (100 shares) (F) (G) — — 6,125 1,225 Total Control Investments (represented 15.1% of total investments at fair value) $ 94,549 $ 45,645Total Investments (K) $ 382,815 $ 302,947
(A) Certain of the securities listed in the above schedule are issued by affiliate(s) of the indicated portfolio company. (B) Percentages represent interest rates in effect at September 30, 2011, and due dates represent the contractual maturity date. (C) LOT of senior debt, meaning if the portfolio company is liquidated, the holder of the LOT is paid after the senior debt. (D) Fair value was primarily based on opinions of value submitted by Standard & Poor’s Securities Evaluations, Inc.
(E) Security valued based on the indicative bid price on or near September 30, 2011, offered by the respective syndication agent’s trading desk or secondary desk. (F) Fair value was primarily based on the total enterprise value of the portfolio company using a liquidity waterfall approach. We also
considered discounted cash flow methodologies. (G) Security is non-income producing. (H) Debt security is on non-accrual status. (I) Non-qualified security under Section 55(a) of the Investment Company Act of 1940, as amended. (J) There are certain limitations on our ability to transfer our units owned prior to dissolution of the entity, which must occur no later
than May 3, 2020. (K) Cumulative gross unrealized depreciation for federal income tax purposes is $88,670; cumulative gross unrealized appreciation for
federal income tax purposes is $8,566. Cumulative net unrealized depreciation is $80,104 based on a tax cost of $383,052.
THE ACCOMPANYING NOTES ARE AN INTEGRAL PART OF THESE CONSOLIDATED FINANCIAL STATEMENTS.
81
GLADSTONE CAPITAL CORPORATION NOTES TO CONSOLIDATED FINANCIAL STATEMENTS
SEPTEMBER 30, 2012 (DOLLAR AMOUNTS IN THOUSANDS, EXCEPT SHARE AND PER SHARE DATA AND AS OTHERWISE
INDICATED)
NOTE 1. ORGANIZATION
Gladstone Capital Corporation was incorporated under the Maryland General Corporation Laws on May 30, 2001, and completed an initial public offering on August 23, 2001. The terms “the Company,” “we,” “our” and “us” all refer to Gladstone Capital Corporation and its consolidated subsidiaries. We are a closed-end, non-diversified management investment company that has elected to be treated as a business development company (“BDC”) under the Investment Company Act of 1940, as amended (the “1940 Act”). In addition, we have elected to be treated for tax purposes as a regulated investment company (“RIC”) under the Internal Revenue Code of 1986, as amended (the “Code”). Our investment objectives are to: (1) achieve and grow current income by investing in debt securities of established businesses that we believe will provide stable earnings and cash flow to pay expenses, make principal and interest payments on our outstanding indebtedness and make distributions to stockholders that grow over time; and (2) provide our stockholders with long-term capital appreciation in the value of our assets by investing in equity securities of established businesses that we believe can grow over time to permit us to sell our equity investments for capital gains. Gladstone Business Loan, LLC (“Business Loan”), a wholly-owned subsidiary of ours, was established on February 3, 2003, for the sole purpose of owning a portion of our portfolio investments in connection with our line of credit. Gladstone Financial Corporation (“Gladstone Financial”), a wholly-owned subsidiary of ours, was established on November 21, 2006, for the purpose of holding a license to operate as a Specialized Small Business Investment Company. Gladstone Financial (previously known as Gladstone SSBIC Corporation) acquired this license in February 2007. The license enables us, through this subsidiary, to make investments in accordance with the United States Small Business Administration guidelines for specialized small business investment companies. The financial statements of these two subsidiaries are consolidated with those of ours. We are externally managed by Gladstone Management Corporation (the “Adviser”), an affiliate of ours. NOTE 2. SUMMARY OF SIGNIFICANT ACCOUNTING POLICIES
Basis of Presentation
These Consolidated Financial Statements and the accompanying notes are prepared in accordance with accounting principles generally accepted in the United States (“U.S.”) and conform to Regulation S-X under the Securities Exchange Act of 1934, as amended. Management believes it has made all necessary adjustments so that our accompanying Consolidated Financial Statements are presented fairly and that all such adjustments are of a normal recurring nature. Our accompanying Consolidated Financial Statements include our accounts and the accounts of our wholly-owned subsidiaries. All significant intercompany balances and transactions have been eliminated.
Consolidation Under Article 6 of Regulation S-X under the Securities Act of 1933, as amended, and the authoritative accounting guidance provided by the American Institute of Certified Public Accountants Audit and Accounting Guide for Investment Companies, we are not permitted to consolidate any subsidiary or other entity that is not an investment company (including those in which we have a controlling interest).
Use of Estimates
Preparing financial statements requires management to make estimates and assumptions that affect the amounts reported in our accompanying Consolidated Financial Statements and accompanying notes. Actual results may differ from those estimates.
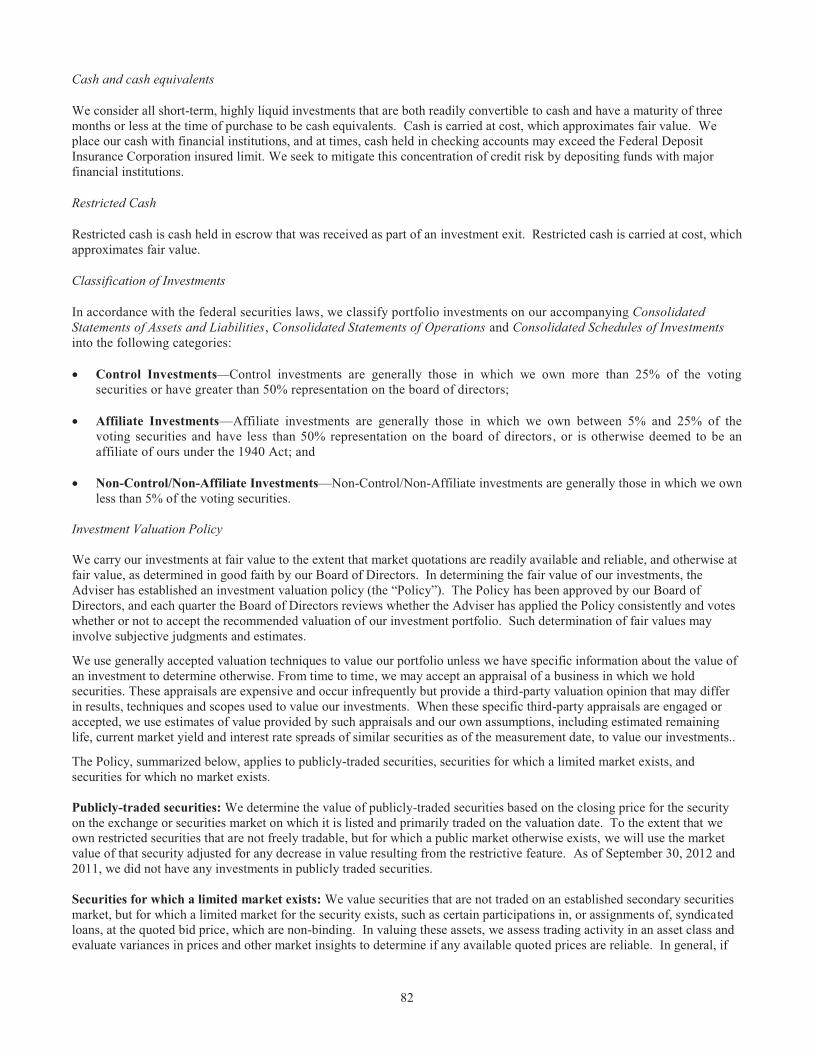
82
Cash and cash equivalents
We consider all short-term, highly liquid investments that are both readily convertible to cash and have a maturity of three months or less at the time of purchase to be cash equivalents. Cash is carried at cost, which approximates fair value. We place our cash with financial institutions, and at times, cash held in checking accounts may exceed the Federal Deposit Insurance Corporation insured limit. We seek to mitigate this concentration of credit risk by depositing funds with major financial institutions.
Restricted Cash
Restricted cash is cash held in escrow that was received as part of an investment exit. Restricted cash is carried at cost, which approximates fair value.
Classification of Investments
In accordance with the federal securities laws, we classify portfolio investments on our accompanying Consolidated Statements of Assets and Liabilities, Consolidated Statements of Operations and Consolidated Schedules of Investments into the following categories: � Control Investments—Control investments are generally those in which we own more than 25% of the voting
securities or have greater than 50% representation on the board of directors;
� Affiliate Investments—Affiliate investments are generally those in which we own between 5% and 25% of the voting securities and have less than 50% representation on the board of directors, or is otherwise deemed to be an affiliate of ours under the 1940 Act; and
� Non-Control/Non-Affiliate Investments—Non-Control/Non-Affiliate investments are generally those in which we own less than 5% of the voting securities.
Investment Valuation Policy We carry our investments at fair value to the extent that market quotations are readily available and reliable, and otherwise at fair value, as determined in good faith by our Board of Directors. In determining the fair value of our investments, the Adviser has established an investment valuation policy (the “Policy”). The Policy has been approved by our Board of Directors, and each quarter the Board of Directors reviews whether the Adviser has applied the Policy consistently and votes whether or not to accept the recommended valuation of our investment portfolio. Such determination of fair values may involve subjective judgments and estimates.
We use generally accepted valuation techniques to value our portfolio unless we have specific information about the value of an investment to determine otherwise. From time to time, we may accept an appraisal of a business in which we hold securities. These appraisals are expensive and occur infrequently but provide a third-party valuation opinion that may differ in results, techniques and scopes used to value our investments. When these specific third-party appraisals are engaged or accepted, we use estimates of value provided by such appraisals and our own assumptions, including estimated remaining life, current market yield and interest rate spreads of similar securities as of the measurement date, to value our investments..
The Policy, summarized below, applies to publicly-traded securities, securities for which a limited market exists, and securities for which no market exists. Publicly-traded securities: We determine the value of publicly-traded securities based on the closing price for the security on the exchange or securities market on which it is listed and primarily traded on the valuation date. To the extent that we own restricted securities that are not freely tradable, but for which a public market otherwise exists, we will use the market value of that security adjusted for any decrease in value resulting from the restrictive feature. As of September 30, 2012 and 2011, we did not have any investments in publicly traded securities. Securities for which a limited market exists: We value securities that are not traded on an established secondary securities market, but for which a limited market for the security exists, such as certain participations in, or assignments of, syndicated loans, at the quoted bid price, which are non-binding. In valuing these assets, we assess trading activity in an asset class and evaluate variances in prices and other market insights to determine if any available quoted prices are reliable. In general, if
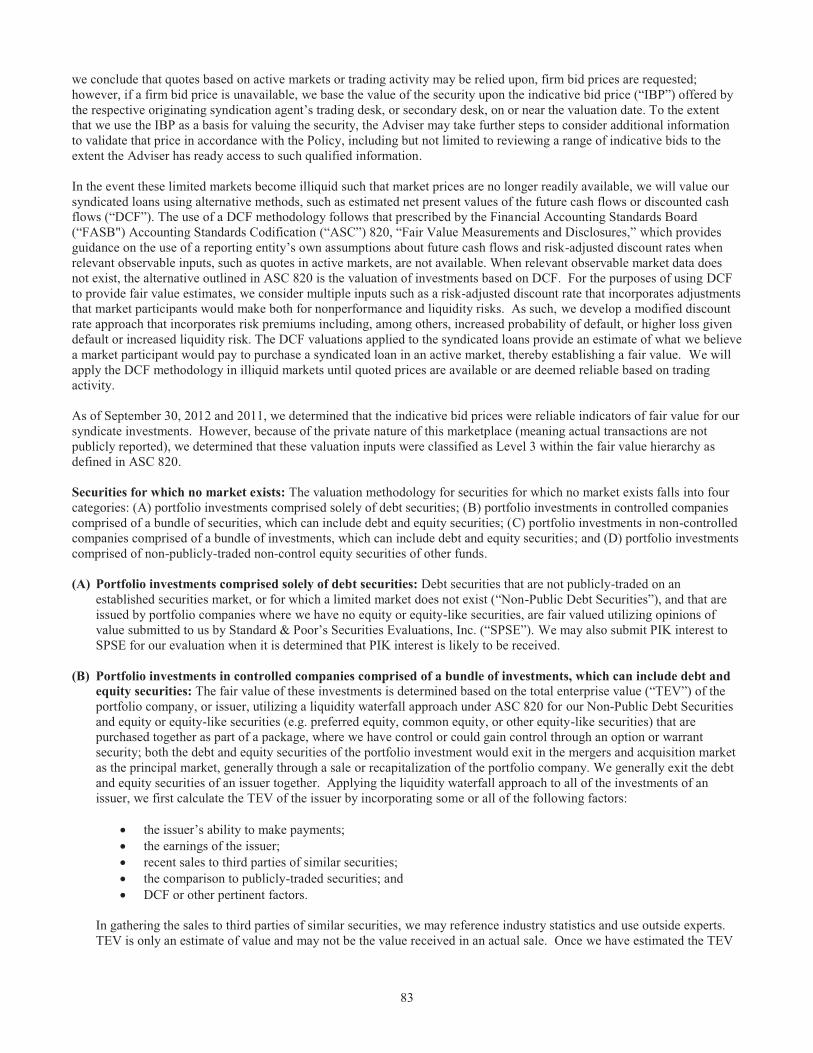
83
we conclude that quotes based on active markets or trading activity may be relied upon, firm bid prices are requested; however, if a firm bid price is unavailable, we base the value of the security upon the indicative bid price (“IBP”) offered by the respective originating syndication agent’s trading desk, or secondary desk, on or near the valuation date. To the extent that we use the IBP as a basis for valuing the security, the Adviser may take further steps to consider additional information to validate that price in accordance with the Policy, including but not limited to reviewing a range of indicative bids to the extent the Adviser has ready access to such qualified information. In the event these limited markets become illiquid such that market prices are no longer readily available, we will value our syndicated loans using alternative methods, such as estimated net present values of the future cash flows or discounted cash flows (“DCF”). The use of a DCF methodology follows that prescribed by the Financial Accounting Standards Board (“FASB") Accounting Standards Codification (“ASC”) 820, “Fair Value Measurements and Disclosures,” which provides guidance on the use of a reporting entity’s own assumptions about future cash flows and risk-adjusted discount rates when relevant observable inputs, such as quotes in active markets, are not available. When relevant observable market data does not exist, the alternative outlined in ASC 820 is the valuation of investments based on DCF. For the purposes of using DCF to provide fair value estimates, we consider multiple inputs such as a risk-adjusted discount rate that incorporates adjustments that market participants would make both for nonperformance and liquidity risks. As such, we develop a modified discount rate approach that incorporates risk premiums including, among others, increased probability of default, or higher loss given default or increased liquidity risk. The DCF valuations applied to the syndicated loans provide an estimate of what we believe a market participant would pay to purchase a syndicated loan in an active market, thereby establishing a fair value. We will apply the DCF methodology in illiquid markets until quoted prices are available or are deemed reliable based on trading activity. As of September 30, 2012 and 2011, we determined that the indicative bid prices were reliable indicators of fair value for our syndicate investments. However, because of the private nature of this marketplace (meaning actual transactions are not publicly reported), we determined that these valuation inputs were classified as Level 3 within the fair value hierarchy as defined in ASC 820. Securities for which no market exists: The valuation methodology for securities for which no market exists falls into four categories: (A) portfolio investments comprised solely of debt securities; (B) portfolio investments in controlled companies comprised of a bundle of securities, which can include debt and equity securities; (C) portfolio investments in non-controlled companies comprised of a bundle of investments, which can include debt and equity securities; and (D) portfolio investments comprised of non-publicly-traded non-control equity securities of other funds. (A) Portfolio investments comprised solely of debt securities: Debt securities that are not publicly-traded on an
established securities market, or for which a limited market does not exist (“Non-Public Debt Securities”), and that are issued by portfolio companies where we have no equity or equity-like securities, are fair valued utilizing opinions of value submitted to us by Standard & Poor’s Securities Evaluations, Inc. (“SPSE”). We may also submit PIK interest to SPSE for our evaluation when it is determined that PIK interest is likely to be received.
(B) Portfolio investments in controlled companies comprised of a bundle of investments, which can include debt and equity securities: The fair value of these investments is determined based on the total enterprise value (“TEV”) of the portfolio company, or issuer, utilizing a liquidity waterfall approach under ASC 820 for our Non-Public Debt Securities and equity or equity-like securities (e.g. preferred equity, common equity, or other equity-like securities) that are purchased together as part of a package, where we have control or could gain control through an option or warrant security; both the debt and equity securities of the portfolio investment would exit in the mergers and acquisition market as the principal market, generally through a sale or recapitalization of the portfolio company. We generally exit the debt and equity securities of an issuer together. Applying the liquidity waterfall approach to all of the investments of an issuer, we first calculate the TEV of the issuer by incorporating some or all of the following factors:
� the issuer’s ability to make payments; � the earnings of the issuer; � recent sales to third parties of similar securities; � the comparison to publicly-traded securities; and � DCF or other pertinent factors.
In gathering the sales to third parties of similar securities, we may reference industry statistics and use outside experts. TEV is only an estimate of value and may not be the value received in an actual sale. Once we have estimated the TEV
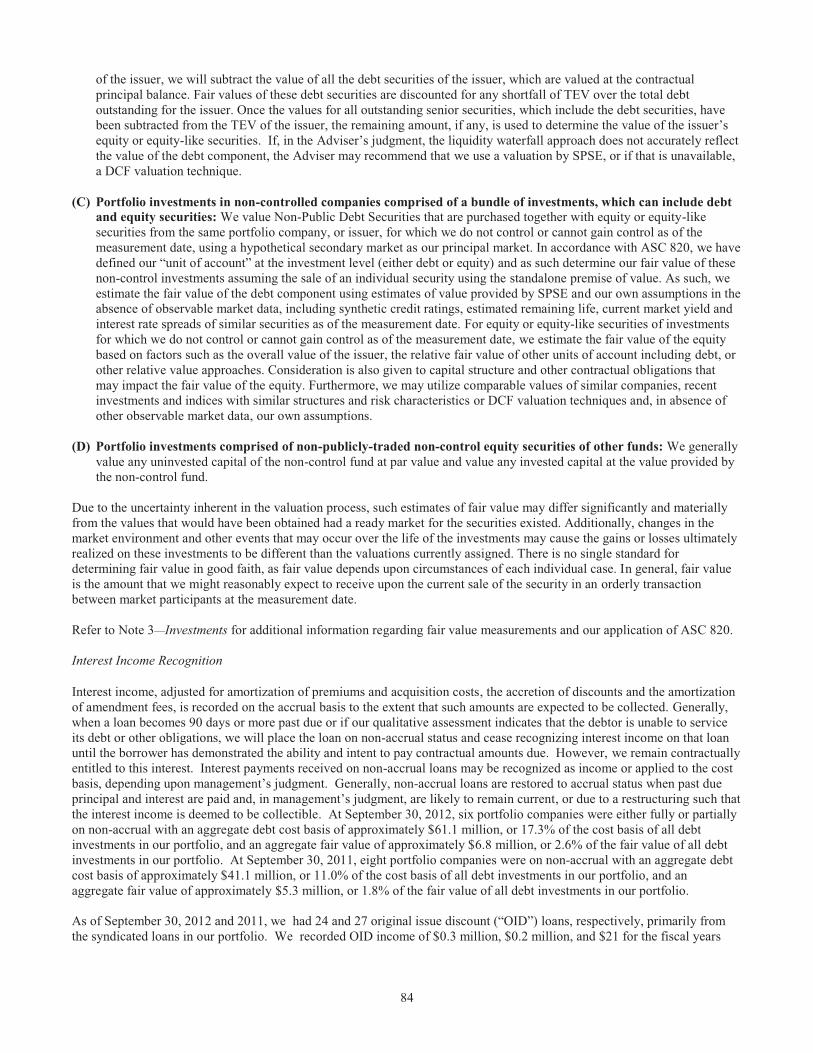
84
of the issuer, we will subtract the value of all the debt securities of the issuer, which are valued at the contractual principal balance. Fair values of these debt securities are discounted for any shortfall of TEV over the total debt outstanding for the issuer. Once the values for all outstanding senior securities, which include the debt securities, have been subtracted from the TEV of the issuer, the remaining amount, if any, is used to determine the value of the issuer’s equity or equity-like securities. If, in the Adviser’s judgment, the liquidity waterfall approach does not accurately reflect the value of the debt component, the Adviser may recommend that we use a valuation by SPSE, or if that is unavailable, a DCF valuation technique.
(C) Portfolio investments in non-controlled companies comprised of a bundle of investments, which can include debt
and equity securities: We value Non-Public Debt Securities that are purchased together with equity or equity-like securities from the same portfolio company, or issuer, for which we do not control or cannot gain control as of the measurement date, using a hypothetical secondary market as our principal market. In accordance with ASC 820, we have defined our “unit of account” at the investment level (either debt or equity) and as such determine our fair value of these non-control investments assuming the sale of an individual security using the standalone premise of value. As such, we estimate the fair value of the debt component using estimates of value provided by SPSE and our own assumptions in the absence of observable market data, including synthetic credit ratings, estimated remaining life, current market yield and interest rate spreads of similar securities as of the measurement date. For equity or equity-like securities of investments for which we do not control or cannot gain control as of the measurement date, we estimate the fair value of the equity based on factors such as the overall value of the issuer, the relative fair value of other units of account including debt, or other relative value approaches. Consideration is also given to capital structure and other contractual obligations that may impact the fair value of the equity. Furthermore, we may utilize comparable values of similar companies, recent investments and indices with similar structures and risk characteristics or DCF valuation techniques and, in absence of other observable market data, our own assumptions.
(D) Portfolio investments comprised of non-publicly-traded non-control equity securities of other funds: We generally
value any uninvested capital of the non-control fund at par value and value any invested capital at the value provided by the non-control fund.
Due to the uncertainty inherent in the valuation process, such estimates of fair value may differ significantly and materially from the values that would have been obtained had a ready market for the securities existed. Additionally, changes in the market environment and other events that may occur over the life of the investments may cause the gains or losses ultimately realized on these investments to be different than the valuations currently assigned. There is no single standard for determining fair value in good faith, as fair value depends upon circumstances of each individual case. In general, fair value is the amount that we might reasonably expect to receive upon the current sale of the security in an orderly transaction between market participants at the measurement date.
Refer to Note 3—Investments for additional information regarding fair value measurements and our application of ASC 820. Interest Income Recognition
Interest income, adjusted for amortization of premiums and acquisition costs, the accretion of discounts and the amortization of amendment fees, is recorded on the accrual basis to the extent that such amounts are expected to be collected. Generally, when a loan becomes 90 days or more past due or if our qualitative assessment indicates that the debtor is unable to service its debt or other obligations, we will place the loan on non-accrual status and cease recognizing interest income on that loan until the borrower has demonstrated the ability and intent to pay contractual amounts due. However, we remain contractually entitled to this interest. Interest payments received on non-accrual loans may be recognized as income or applied to the cost basis, depending upon management’s judgment. Generally, non-accrual loans are restored to accrual status when past due principal and interest are paid and, in management’s judgment, are likely to remain current, or due to a restructuring such that the interest income is deemed to be collectible. At September 30, 2012, six portfolio companies were either fully or partially on non-accrual with an aggregate debt cost basis of approximately $61.1 million, or 17.3% of the cost basis of all debt investments in our portfolio, and an aggregate fair value of approximately $6.8 million, or 2.6% of the fair value of all debt investments in our portfolio. At September 30, 2011, eight portfolio companies were on non-accrual with an aggregate debt cost basis of approximately $41.1 million, or 11.0% of the cost basis of all debt investments in our portfolio, and an aggregate fair value of approximately $5.3 million, or 1.8% of the fair value of all debt investments in our portfolio. As of September 30, 2012 and 2011, we had 24 and 27 original issue discount (“OID”) loans, respectively, primarily from the syndicated loans in our portfolio. We recorded OID income of $0.3 million, $0.2 million, and $21 for the fiscal years
85
ended September 30, 2012, 2011 and 2010, respectively. The unamortized balance of OID investments as of September 30, 2012 and 2011 totaled $1.1 million and $1.5 million, respectively. As of September 30, 2012, we had one investment that bore PIK interest and as of September 30, 2011, we had no investments that bore PIK interest. PIK interest, computed at the contractual rate specified in a loan agreement, is added to the principal balance of a loan and recorded as income. To maintain our status as a RIC, this non-cash source of income must be paid out to common stockholders in the form of distributions, even though we have not yet collected the cash. We recorded PIK income of $20, $12 and $67 for the fiscal years ended September 30, 2012, 2011 and 2010, respectively. We collected no PIK interest in cash for the years ended September 30, 2012, 2011 and 2010, respectively. We also transfer past due interest to the principal balance as stipulated in certain loan amendments with portfolio companies. There were no such transfers during the year ended September 30, 2012. We transferred past due interest to the principal balance of $0.2 million and $1.2 million for the fiscal years ended September 30, 2011 and 2010, respectively. For the fiscal year ended September 30, 2010, we also rolled over past due interest to a portfolio company’s principal balance of $0.7 million, and then recorded an adjustment against that principal balance as a contra-investment since the loan was on non-accrual and the collectability of the additional principal was uncertain. As a result of a restructure, we reversed this contra-investment amount of $0.7 million during 2011. These principal balance adjustments had no net impact on our accompanying Consolidated Statements of Operations. Other Income Recognition
We generally record success fees upon receipt of cash. Success fees are contractually due upon a change of control in a portfolio company and are recorded in other income in our accompanying Consolidated Statements of Operations. We recorded $4.0 million of success fees during the year ended September 30, 2012, which resulted primarily from the exits of Global Materials Technologies, Inc., Northern Contours, Inc., RCS Management Holding Co., and Winchester Electronics. During the year ended September 30, 2011, we received $1.0 million in success fees from the exits of Pinnacle Treatment Centers, Inc. and Interfilm Holdings, Inc. and the prepayment of success fees from Westlake Hardware, Inc. During the year ended September 30, 2010, we received $1.9 million in success fees from the exits of Active Style Acquisition Co., Anitox Acquisition Co., Saunders & Associates, Visual Edge Technology, Inc., Tulsa Welding School and the prepayment of success fees from Doe & Ingalls Management LLC and Northern Contours, Inc. Dividend income on preferred equity investments is accrued to the extent that such amounts are expected to be collected and if we have the option to collect such amounts in cash, and it is recorded in other income in our accompanying Consolidated Statements of Operations. During the years ended September 30, 2012, 2011 and 2010 we did not record or collect any dividend income on preferred equity securities. In addition, we received $1.0 million from two legal settlements related to portfolio companies during the year ended September 30, 2011, that were recorded in other income. Realized Gain (Loss) and Unrealized Appreciation (Depreciation) of Investments
Gains or losses on the sale of investments are calculated by using the specific identification method. A realized gain or loss is recognized at the trade date, typically when an investment is disposed of, and is computed as the difference between our cost basis in the investment at the disposition date and the net proceeds received from such disposition. Cumulative net realized appreciation or depreciation calculates the difference between the fair value of the investment and the cost basis of such investment. We must determine the fair value of each individual investment on a quarterly basis and record changes in fair value as net unrealized appreciation or depreciation in our accompanying Consolidated Statements of Operations.
Deferred Financing Fees
Deferred financing costs consist of costs incurred to obtain debt financing and other debt-like financing, including legal fees, origination fees and administration fees. Costs associated with our line of credit and our term preferred stock are deferred and amortized in our accompanying Consolidated Statements of Operations using the straight-line method, which approximates the effective interest method, over the terms of the respective financing instrument.
86
Related Party Fees
We have entered into an investment advisory and management agreement (the “Advisory Agreement”) with the Adviser, which is controlled by our chairman and chief executive officer. In accordance with the Advisory Agreement, we pay the Adviser fees as compensation for its services, consisting of a base management fee and an incentive fee. We have entered into an administration agreement (the “Administration Agreement”) with Gladstone Administration, LLC (the “Administrator) whereby we pay separately for administrative services. These fees are accrued when the services are performed and generally paid one month in arrears. Refer to Note 4—Related Party Transactions for additional information regarding these related party costs and agreements. Income Taxes
As of September 30, 2012, we continue to qualify for treatment as a RIC under subchapter M of the Code, which generally allows us to avoid paying corporate income taxes on any income or gains that we distribute to our stockholders. We have made sufficient distributions to eliminate taxable income for each of the fiscal years ended September 30, 2012, 2011 and 2010, respectively. Refer to Note10— Federal and State Income Taxes for additional information regarding our RIC requirements.
We have certain wholly-owned taxable subsidiaries (the “Taxable Subsidiaries”), each of which holds one or more of its portfolio investments that are listed on our accompanying Consolidated Schedules of Investments. The purpose of the Taxable Subsidiaries is to permit us to hold certain portfolio companies that are organized as limited liability companies (“LLCs”) (or other forms of pass-through entities) while satisfying the RIC tax requirement that at least 90% of the RIC’s gross revenue for income tax purposes must consist of qualifying investment income. Absent the Taxable Subsidiaries, a proportionate amount of any gross income of an LLC (or other pass-through entity) portfolio investment would flow through directly to the RIC. To the extent that such income did not consist of qualifying investment income, it could jeopardize our ability to qualify as a RIC and therefore cause us to incur significant amounts of federal income taxes. When LLCs (or other pass-through entities) are owned by the Taxable Subsidiaries, their income is taxed to the Taxable Subsidiaries and does not flow through to the RIC, thereby helping us preserve our RIC status. The Taxable Subsidiaries are not consolidated for income tax purposes and may generate income tax expense as a result of their ownership of the portfolio companies. This income tax expense is immaterial to our accompanying Consolidated Statements of Operations.
ASC 740, “Income Taxes” requires the evaluation of tax positions taken or expected to be taken in the course of preparing our tax returns to determine whether the tax positions are “more-likely-than-not” of being sustained by the applicable tax authorities. Tax positions not deemed to satisfy the “more-likely-than-not” threshold would be recorded as a tax benefit or expense in the current year. We have evaluated the implications of ASC 740, for all open tax years and in all major tax jurisdictions, and determined that there is no material impact on our accompanying Consolidated Financial Statements. Our federal tax returns for fiscal years 2009 - 2012 remain subject to examination by the Internal Revenue Service.
Distributions
Distributions to stockholders are recorded on the ex-dividend date. We are required to pay out at least 90% of our ordinary income and short-term capital gains for each taxable year as a distribution to our stockholders in order to maintain our status as a RIC under Subtitle A, Chapter 1 of Subchapter M of the Code. The amount to be paid out as a distribution is determined by our Board of Directors each quarter and is based on the annual earnings estimated by management. Based on that estimate, a distribution is declared each quarter and is paid out monthly over the course of the respective quarter. Refer to Note 9—Distributions to Common Stockholders for further information. We have a dividend reinvestment plan for our common stockholders. This is an “opt in” dividend reinvestment plan, meaning that common stockholders may elect to have their cash dividends automatically reinvested in additional shares of our common stock. Common stockholders who do not so elect will receive their dividends in cash. Common stockholders who receive distributions in the form of stock will be subject to the same federal, state and local tax consequences as stockholders who elect to receive their distributions in cash. We do not have a dividend reinvestment plan for our preferred stock stockholders.
87
Recent Accounting Pronouncements
In May 2011, the FASB issued Accounting Standards Update No. 2011-04 (“ASU 2011-04”), “Amendments to Achieve Common Fair Value Measurement and Disclosure Requirements in U.S. GAAP and International Financial Reporting Standards (“IFRS”)” which amends ASC 820 and results in a consistent definition of fair value and common requirements for measurement of and disclosure about fair value between GAAP and IFRS. ASU 2011-04 is effective for interim and annual periods beginning after December 15, 2011, and as such we have adopted this ASU beginning with our quarter ended March 31, 2012. We have increased our disclosures related to Level 3 fair value measurement, in addition to other required disclosures. There were no related impacts on our financial position, results of operations or cash flows. NOTE 3. INVESTMENTS
ASC 820 defines fair value, establishes a framework for measuring fair value and expands disclosures about assets and liabilities measured at fair value. ASC 820 provides a consistent definition of fair value that focuses on exit price in the principal, or most advantageous, market and prioritizes, within a measurement of fair value, the use of market-based inputs over entity-specific inputs. ASC 820 also establishes the following three-level hierarchy for fair value measurements based upon the transparency of inputs to the valuation of an asset or liability as of the measurement date. � Level 1 — inputs to the valuation methodology are quoted prices (unadjusted) for identical assets or liabilities in active
markets; � Level 2 — inputs to the valuation methodology include quoted prices for similar assets and liabilities in active or inactive
markets, and inputs that are observable for the asset or liability, either directly or indirectly, for substantially the full term of the financial instrument. Level 2 inputs are in those markets for which there are few transactions, the prices are not current, little public information exists or instances where prices vary substantially over time or among brokered market makers; and
� Level 3— inputs to the valuation methodology are unobservable and reflect assumptions that market participants would
use when pricing the asset or liability. Level 3 inputs can also include our own assumptions based upon the best available information.
As of September 30, 2012 and 2011, all of our investments were valued using Level 3 inputs. We transfer investments in and out of Level 1, 2 and 3 securities as of the beginning balance sheet date, based on changes in the use of observable and unobservable inputs utilized to perform the valuation for the period. During the years ended September 30, 2012 and 2011, there were no transfers in or out of Level 1, 2 or 3.
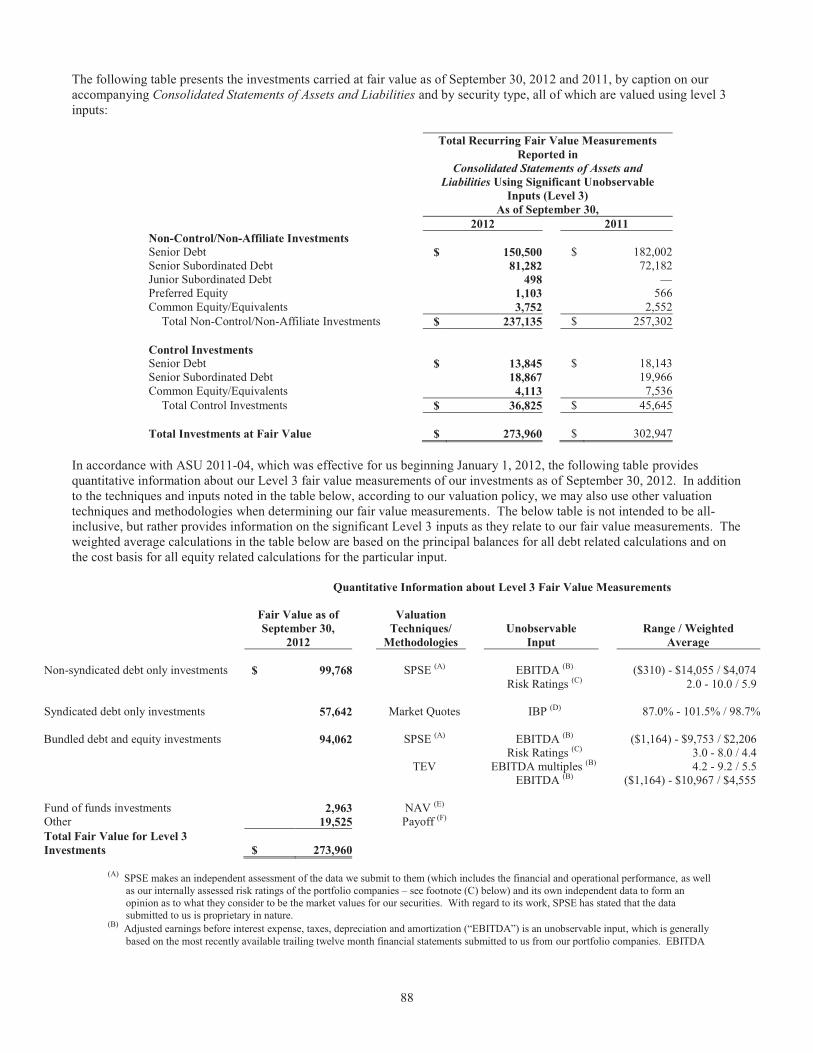
88
The following table presents the investments carried at fair value as of September 30, 2012 and 2011, by caption on our accompanying Consolidated Statements of Assets and Liabilities and by security type, all of which are valued using level 3 inputs:
Total Recurring Fair Value Measurements
Reported in
Consolidated Statements of Assets and Liabilities Using Significant Unobservable
Inputs (Level 3) As of September 30, 2012 2011 Non-Control/Non-Affiliate Investments Senior Debt $ 150,500 $ 182,002 Senior Subordinated Debt 81,282 72,182 Junior Subordinated Debt 498 — Preferred Equity 1,103 566 Common Equity/Equivalents 3,752 2,552
Total Non-Control/Non-Affiliate Investments $ 237,135 $ 257,302 Control Investments Senior Debt $ 13,845 $ 18,143 Senior Subordinated Debt 18,867 19,966 Common Equity/Equivalents 4,113 7,536
Total Control Investments $ 36,825 $ 45,645 Total Investments at Fair Value $ 273,960 $ 302,947
In accordance with ASU 2011-04, which was effective for us beginning January 1, 2012, the following table provides quantitative information about our Level 3 fair value measurements of our investments as of September 30, 2012. In addition to the techniques and inputs noted in the table below, according to our valuation policy, we may also use other valuation techniques and methodologies when determining our fair value measurements. The below table is not intended to be all-inclusive, but rather provides information on the significant Level 3 inputs as they relate to our fair value measurements. The weighted average calculations in the table below are based on the principal balances for all debt related calculations and on the cost basis for all equity related calculations for the particular input.
Quantitative Information about Level 3 Fair Value Measurements
Fair Value as of September 30,
2012
Valuation Techniques/
Methodologies
Unobservable
Input
Range / Weighted
Average
Non-syndicated debt only investments $ 99,768 SPSE (A) EBITDA (B) ($310) - $14,055 / $4,074 Risk Ratings (C) 2.0 - 10.0 / 5.9 Syndicated debt only investments 57,642 Market Quotes IBP (D) 87.0% - 101.5% / 98.7%
Bundled debt and equity investments 94,062 SPSE (A) EBITDA (B) ($1,164) - $9,753 / $2,206 Risk Ratings (C) 3.0 - 8.0 / 4.4 TEV EBITDA multiples (B) 4.2 - 9.2 / 5.5 EBITDA (B) ($1,164) - $10,967 / $4,555
Fund of funds investments 2,963 NAV (E) Other 19,525 Payoff (F) Total Fair Value for Level 3 Investments $ 273,960
(A) SPSE makes an independent assessment of the data we submit to them (which includes the financial and operational performance, as well
as our internally assessed risk ratings of the portfolio companies – see footnote (C) below) and its own independent data to form an opinion as to what they consider to be the market values for our securities. With regard to its work, SPSE has stated that the data submitted to us is proprietary in nature.
(B) Adjusted earnings before interest expense, taxes, depreciation and amortization (“EBITDA”) is an unobservable input, which is generally based on the most recently available trailing twelve month financial statements submitted to us from our portfolio companies. EBITDA
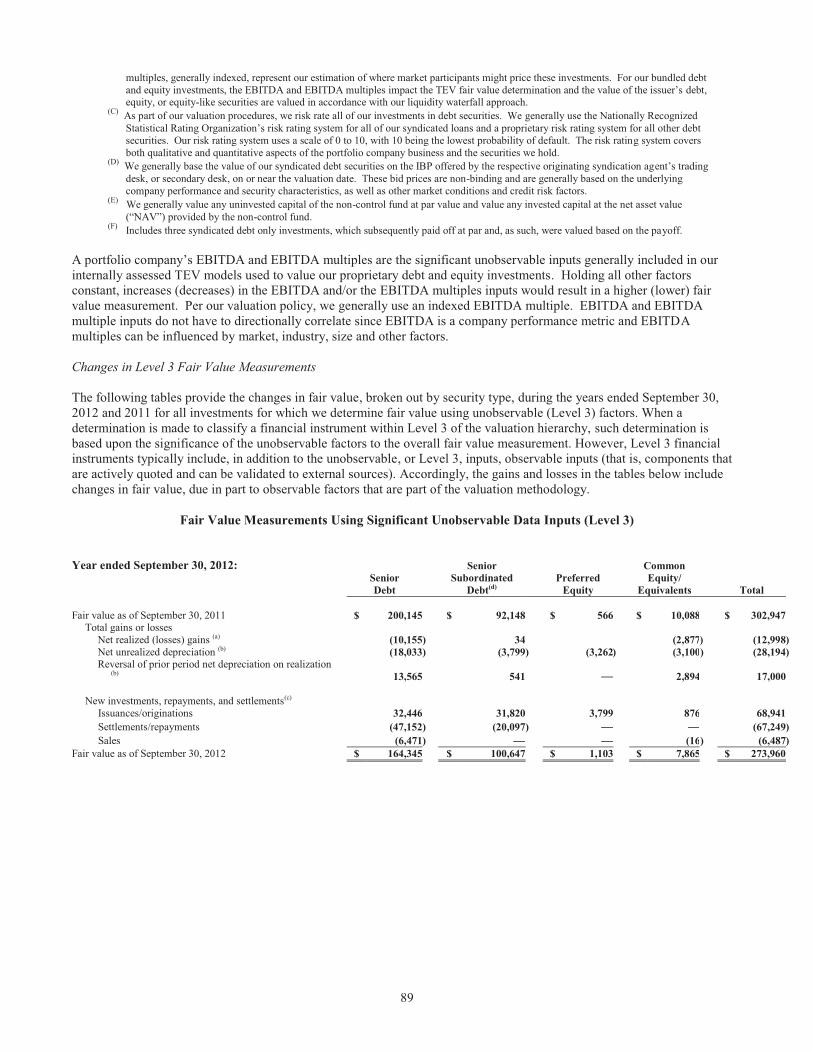
89
multiples, generally indexed, represent our estimation of where market participants might price these investments. For our bundled debt and equity investments, the EBITDA and EBITDA multiples impact the TEV fair value determination and the value of the issuer’s debt, equity, or equity-like securities are valued in accordance with our liquidity waterfall approach.
(C) As part of our valuation procedures, we risk rate all of our investments in debt securities. We generally use the Nationally Recognized Statistical Rating Organization’s risk rating system for all of our syndicated loans and a proprietary risk rating system for all other debt securities. Our risk rating system uses a scale of 0 to 10, with 10 being the lowest probability of default. The risk rating system covers both qualitative and quantitative aspects of the portfolio company business and the securities we hold.
(D) We generally base the value of our syndicated debt securities on the IBP offered by the respective originating syndication agent’s trading desk, or secondary desk, on or near the valuation date. These bid prices are non-binding and are generally based on the underlying company performance and security characteristics, as well as other market conditions and credit risk factors.
(E) We generally value any uninvested capital of the non-control fund at par value and value any invested capital at the net asset value (“NAV”) provided by the non-control fund.
(F) Includes three syndicated debt only investments, which subsequently paid off at par and, as such, were valued based on the payoff. A portfolio company’s EBITDA and EBITDA multiples are the significant unobservable inputs generally included in our internally assessed TEV models used to value our proprietary debt and equity investments. Holding all other factors constant, increases (decreases) in the EBITDA and/or the EBITDA multiples inputs would result in a higher (lower) fair value measurement. Per our valuation policy, we generally use an indexed EBITDA multiple. EBITDA and EBITDA multiple inputs do not have to directionally correlate since EBITDA is a company performance metric and EBITDA multiples can be influenced by market, industry, size and other factors. Changes in Level 3 Fair Value Measurements The following tables provide the changes in fair value, broken out by security type, during the years ended September 30, 2012 and 2011 for all investments for which we determine fair value using unobservable (Level 3) factors. When a determination is made to classify a financial instrument within Level 3 of the valuation hierarchy, such determination is based upon the significance of the unobservable factors to the overall fair value measurement. However, Level 3 financial instruments typically include, in addition to the unobservable, or Level 3, inputs, observable inputs (that is, components that are actively quoted and can be validated to external sources). Accordingly, the gains and losses in the tables below include changes in fair value, due in part to observable factors that are part of the valuation methodology.
Fair Value Measurements Using Significant Unobservable Data Inputs (Level 3)
Year ended September 30, 2012: Senior Common Senior Subordinated Preferred Equity/ Debt Debt(d) Equity Equivalents Total Fair value as of September 30, 2011 $ 200,145 $ 92,148 $ 566 $ 10,088 $ 302,947
Total gains or losses Net realized (losses) gains (a) (10,155 ) 34 (2,877) (12,998 ) Net unrealized depreciation (b) (18,033 ) (3,799 ) (3,262 ) (3,100) (28,194 ) Reversal of prior period net depreciation on realization
(b) 13,565 541 —
2,894 17,000
New investments, repayments, and settlements(c) Issuances/originations 32,446 31,820 3,799 876 68,941 Settlements/repayments (47,152 ) (20,097 ) — — (67,249 ) Sales (6,471 ) — — (16) (6,487 )
Fair value as of September 30, 2012 $ 164,345 $ 100,647 $ 1,103 $ 7,865 $ 273,960
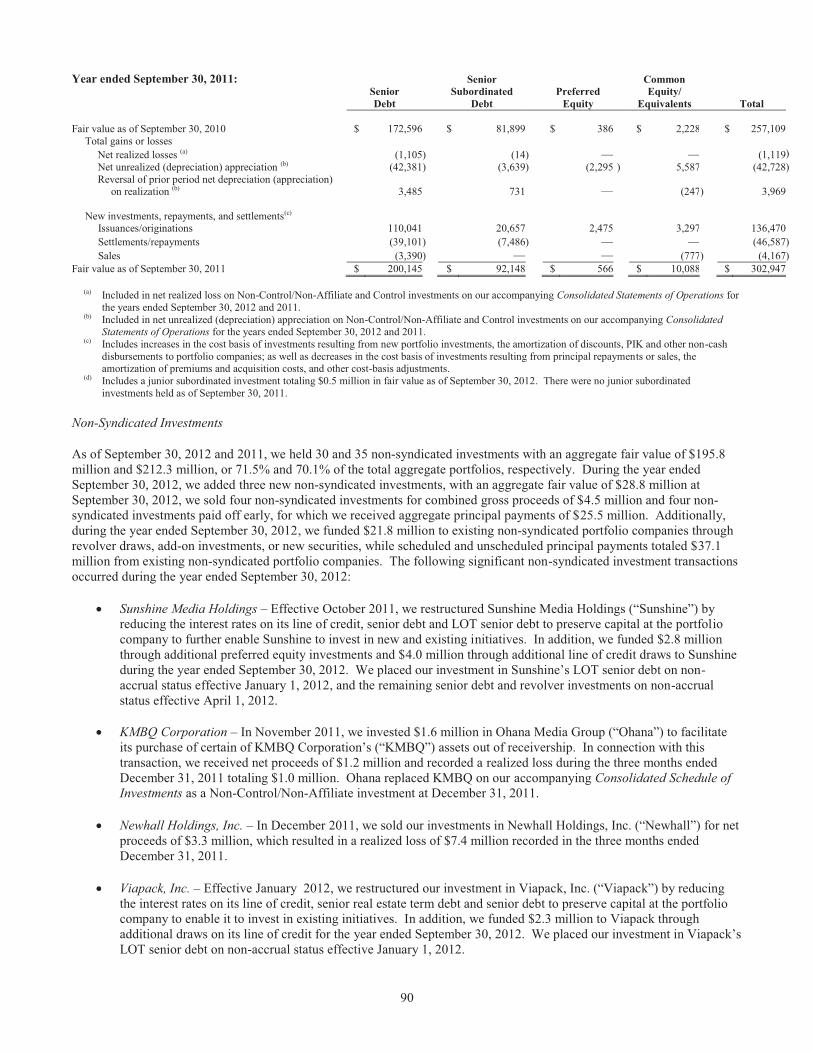
90
Year ended September 30, 2011: Senior Common Senior Subordinated Preferred Equity/ Debt Debt Equity Equivalents Total Fair value as of September 30, 2010 $ 172,596 $ 81,899 $ 386 $ 2,228 $ 257,109
Total gains or losses Net realized losses (a) (1,105 ) (14 ) — — (1,119 ) Net unrealized (depreciation) appreciation (b) (42,381 ) (3,639 ) (2,295 ) 5,587 (42,728 ) Reversal of prior period net depreciation (appreciation)
on realization (b) 3,485 731 —
(247) 3,969
New investments, repayments, and settlements(c) Issuances/originations 110,041 20,657 2,475 3,297 136,470 Settlements/repayments (39,101 ) (7,486 ) — — (46,587 ) Sales (3,390 ) — — (777) (4,167 )
Fair value as of September 30, 2011 $ 200,145 $ 92,148 $ 566 $ 10,088 $ 302,947
(a) Included in net realized loss on Non-Control/Non-Affiliate and Control investments on our accompanying Consolidated Statements of Operations for the years ended September 30, 2012 and 2011.
(b) Included in net unrealized (depreciation) appreciation on Non-Control/Non-Affiliate and Control investments on our accompanying Consolidated Statements of Operations for the years ended September 30, 2012 and 2011.
(c) Includes increases in the cost basis of investments resulting from new portfolio investments, the amortization of discounts, PIK and other non-cash disbursements to portfolio companies; as well as decreases in the cost basis of investments resulting from principal repayments or sales, the amortization of premiums and acquisition costs, and other cost-basis adjustments.
(d) Includes a junior subordinated investment totaling $0.5 million in fair value as of September 30, 2012. There were no junior subordinated investments held as of September 30, 2011.
Non-Syndicated Investments
As of September 30, 2012 and 2011, we held 30 and 35 non-syndicated investments with an aggregate fair value of $195.8 million and $212.3 million, or 71.5% and 70.1% of the total aggregate portfolios, respectively. During the year ended September 30, 2012, we added three new non-syndicated investments, with an aggregate fair value of $28.8 million at September 30, 2012, we sold four non-syndicated investments for combined gross proceeds of $4.5 million and four non-syndicated investments paid off early, for which we received aggregate principal payments of $25.5 million. Additionally, during the year ended September 30, 2012, we funded $21.8 million to existing non-syndicated portfolio companies through revolver draws, add-on investments, or new securities, while scheduled and unscheduled principal payments totaled $37.1 million from existing non-syndicated portfolio companies. The following significant non-syndicated investment transactions occurred during the year ended September 30, 2012:
� Sunshine Media Holdings – Effective October 2011, we restructured Sunshine Media Holdings (“Sunshine”) by reducing the interest rates on its line of credit, senior debt and LOT senior debt to preserve capital at the portfolio company to further enable Sunshine to invest in new and existing initiatives. In addition, we funded $2.8 million through additional preferred equity investments and $4.0 million through additional line of credit draws to Sunshine during the year ended September 30, 2012. We placed our investment in Sunshine’s LOT senior debt on non-accrual status effective January 1, 2012, and the remaining senior debt and revolver investments on non-accrual status effective April 1, 2012.
� KMBQ Corporation – In November 2011, we invested $1.6 million in Ohana Media Group (“Ohana”) to facilitate
its purchase of certain of KMBQ Corporation’s (“KMBQ”) assets out of receivership. In connection with this transaction, we received net proceeds of $1.2 million and recorded a realized loss during the three months ended December 31, 2011 totaling $1.0 million. Ohana replaced KMBQ on our accompanying Consolidated Schedule of Investments as a Non-Control/Non-Affiliate investment at December 31, 2011.
� Newhall Holdings, Inc. – In December 2011, we sold our investments in Newhall Holdings, Inc. (“Newhall”) for net proceeds of $3.3 million, which resulted in a realized loss of $7.4 million recorded in the three months ended December 31, 2011.
� Viapack, Inc. – Effective January 2012, we restructured our investment in Viapack, Inc. (“Viapack”) by reducing the interest rates on its line of credit, senior real estate term debt and senior debt to preserve capital at the portfolio company to enable it to invest in existing initiatives. In addition, we funded $2.3 million to Viapack through additional draws on its line of credit for the year ended September 30, 2012. We placed our investment in Viapack’s LOT senior debt on non-accrual status effective January 1, 2012.
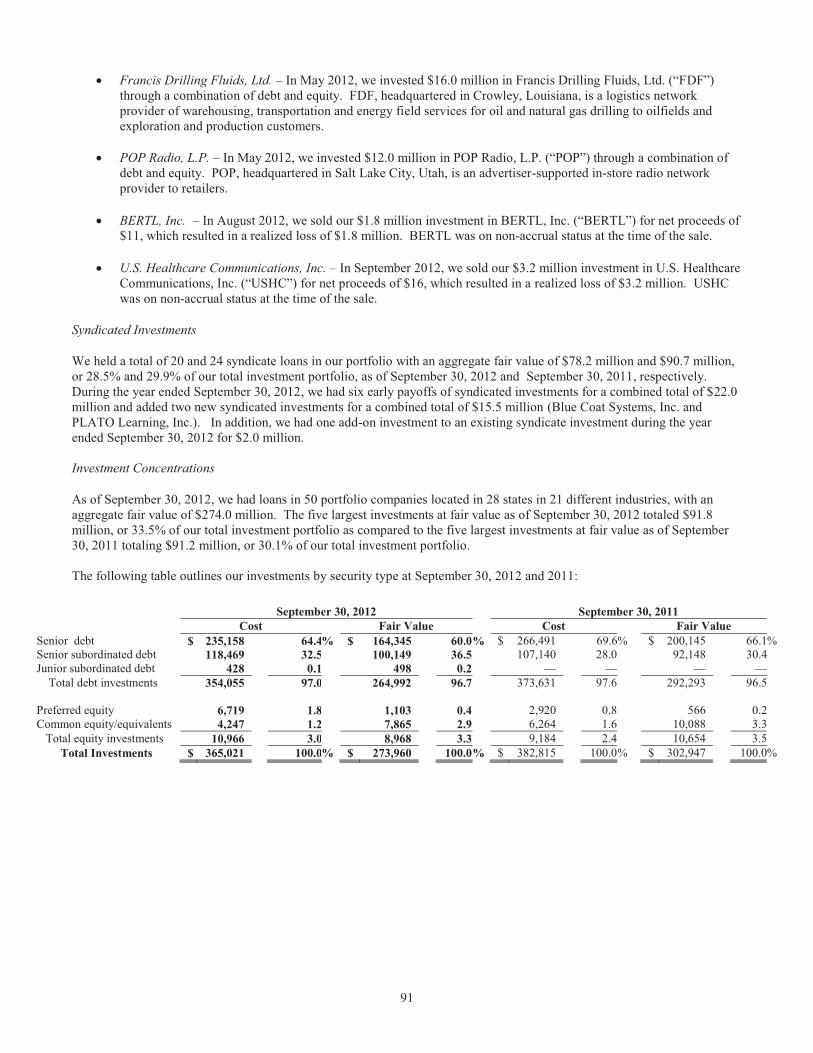
91
� Francis Drilling Fluids, Ltd. – In May 2012, we invested $16.0 million in Francis Drilling Fluids, Ltd. (“FDF”) through a combination of debt and equity. FDF, headquartered in Crowley, Louisiana, is a logistics network provider of warehousing, transportation and energy field services for oil and natural gas drilling to oilfields and exploration and production customers.
� POP Radio, L.P. – In May 2012, we invested $12.0 million in POP Radio, L.P. (“POP”) through a combination of
debt and equity. POP, headquartered in Salt Lake City, Utah, is an advertiser-supported in-store radio network provider to retailers.
� BERTL, Inc. – In August 2012, we sold our $1.8 million investment in BERTL, Inc. (“BERTL”) for net proceeds of $11, which resulted in a realized loss of $1.8 million. BERTL was on non-accrual status at the time of the sale.
� U.S. Healthcare Communications, Inc. – In September 2012, we sold our $3.2 million investment in U.S. Healthcare Communications, Inc. (“USHC”) for net proceeds of $16, which resulted in a realized loss of $3.2 million. USHC was on non-accrual status at the time of the sale.
Syndicated Investments
We held a total of 20 and 24 syndicate loans in our portfolio with an aggregate fair value of $78.2 million and $90.7 million, or 28.5% and 29.9% of our total investment portfolio, as of September 30, 2012 and September 30, 2011, respectively. During the year ended September 30, 2012, we had six early payoffs of syndicated investments for a combined total of $22.0 million and added two new syndicated investments for a combined total of $15.5 million (Blue Coat Systems, Inc. and PLATO Learning, Inc.). In addition, we had one add-on investment to an existing syndicate investment during the year ended September 30, 2012 for $2.0 million. Investment Concentrations
As of September 30, 2012, we had loans in 50 portfolio companies located in 28 states in 21 different industries, with an aggregate fair value of $274.0 million. The five largest investments at fair value as of September 30, 2012 totaled $91.8 million, or 33.5% of our total investment portfolio as compared to the five largest investments at fair value as of September 30, 2011 totaling $91.2 million, or 30.1% of our total investment portfolio. The following table outlines our investments by security type at September 30, 2012 and 2011:
September 30, 2012 September 30, 2011 Cost Fair Value Cost Fair Value
Senior debt $ 235,158 64.4% $ 164,345 60.0 % $ 266,491 69.6% $ 200,145 66.1% Senior subordinated debt 118,469 32.5 100,149 36.5 107,140 28.0 92,148 30.4 Junior subordinated debt 428 0.1 498 0.2 — — — — Total debt investments 354,055 97.0 264,992 96.7 373,631 97.6 292,293 96.5
Preferred equity 6,719 1.8 1,103 0.4 2,920 0.8 566 0.2 Common equity/equivalents 4,247 1.2 7,865 2.9 6,264 1.6 10,088 3.3 Total equity investments 10,966 3.0 8,968 3.3 9,184 2.4 10,654 3.5
Total Investments $ 365,021 100.0% $ 273,960 100.0 % $ 382,815 100.0 % $ 302,947 100.0%
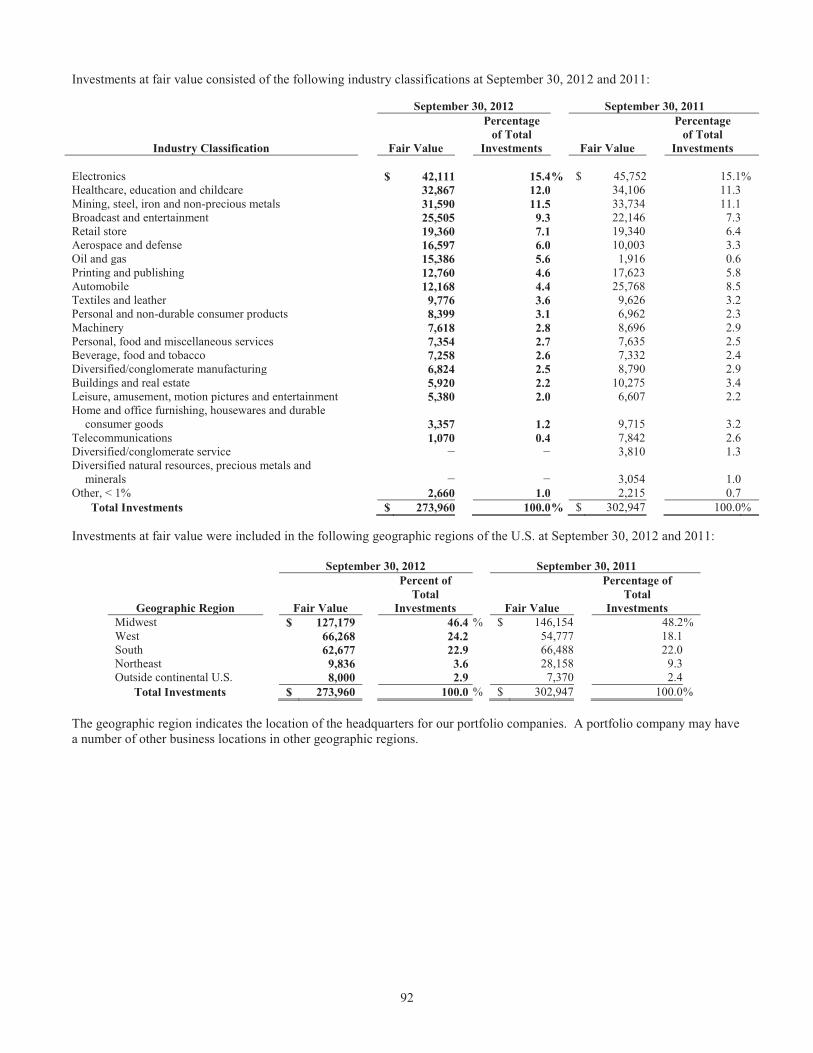
92
Investments at fair value consisted of the following industry classifications at September 30, 2012 and 2011:
September 30, 2012 September 30, 2011
Industry Classification Fair Value
Percentage of Total
Investments Fair Value
Percentage of Total
Investments
Electronics $ 42,111 15.4 % $ 45,752 15.1 % Healthcare, education and childcare 32,867 12.0 34,106 11.3 Mining, steel, iron and non-precious metals 31,590 11.5 33,734 11.1 Broadcast and entertainment 25,505 9.3 22,146 7.3 Retail store 19,360 7.1 19,340 6.4 Aerospace and defense 16,597 6.0 10,003 3.3 Oil and gas 15,386 5.6 1,916 0.6 Printing and publishing 12,760 4.6 17,623 5.8 Automobile 12,168 4.4 25,768 8.5 Textiles and leather 9,776 3.6 9,626 3.2 Personal and non-durable consumer products 8,399 3.1 6,962 2.3 Machinery 7,618 2.8 8,696 2.9 Personal, food and miscellaneous services 7,354 2.7 7,635 2.5 Beverage, food and tobacco 7,258 2.6 7,332 2.4 Diversified/conglomerate manufacturing 6,824 2.5 8,790 2.9 Buildings and real estate 5,920 2.2 10,275 3.4 Leisure, amusement, motion pictures and entertainment 5,380 2.0 6,607 2.2 Home and office furnishing, housewares and durable
consumer goods 3,357 1.2 9,715 3.2
Telecommunications 1,070 0.4 7,842 2.6 Diversified/conglomerate service — — 3,810 1.3 Diversified natural resources, precious metals and
minerals — — 3,054 1.0
Other, < 1% 2,660 1.0 2,215 0.7 Total Investments $ 273,960 100.0 % $ 302,947 100.0 %
Investments at fair value were included in the following geographic regions of the U.S. at September 30, 2012 and 2011:
September 30, 2012 September 30, 2011
Geographic Region
Fair Value
Percent of Total
Investments
Fair Value
Percentage of Total
Investments
Midwest $ 127,179 46.4 % $ 146,154 48.2% West 66,268 24.2 54,777 18.1 South 62,677 22.9 66,488 22.0 Northeast 9,836 3.6 28,158 9.3 Outside continental U.S. 8,000 2.9 7,370 2.4
Total Investments $ 273,960 100.0 % $ 302,947 100.0 % The geographic region indicates the location of the headquarters for our portfolio companies. A portfolio company may have a number of other business locations in other geographic regions.
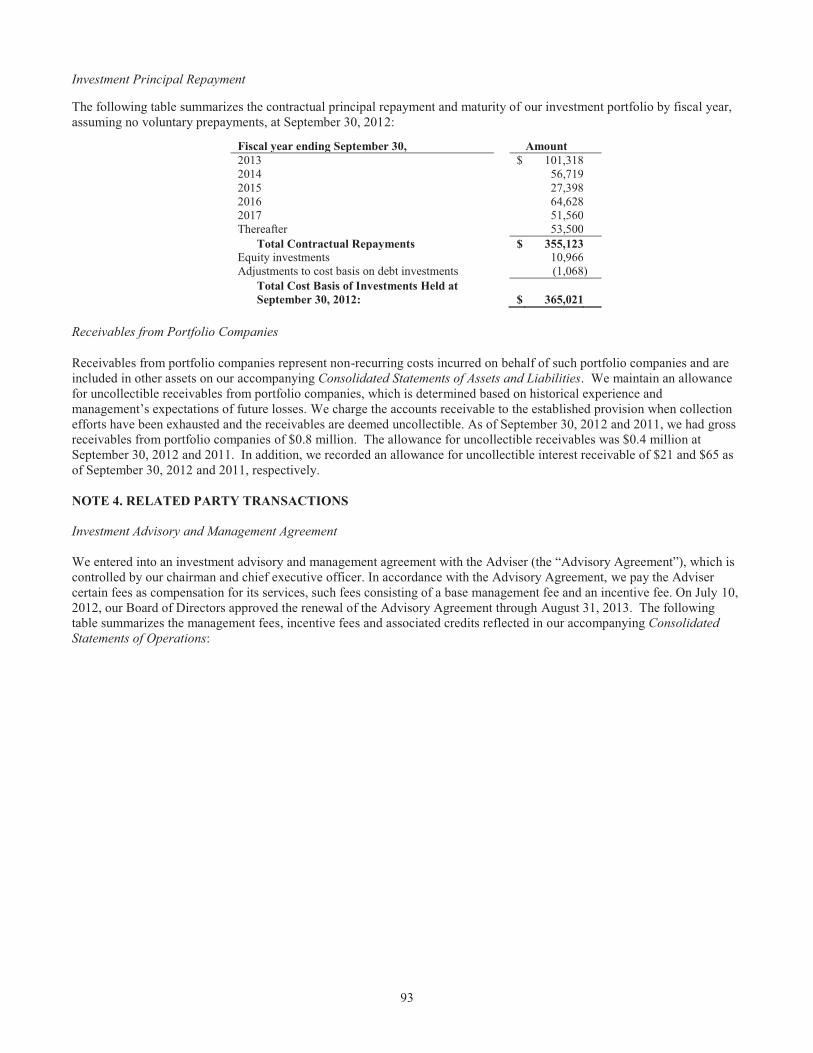
93
Investment Principal Repayment The following table summarizes the contractual principal repayment and maturity of our investment portfolio by fiscal year, assuming no voluntary prepayments, at September 30, 2012:
Fiscal year ending September 30, Amount 2013 $ 101,318 2014 56,719 2015 27,398 2016 64,628 2017 51,560 Thereafter 53,500 Total Contractual Repayments $ 355,123 Equity investments 10,966 Adjustments to cost basis on debt investments (1,068 ) Total Cost Basis of Investments Held at
September 30, 2012:
$ 365,021
Receivables from Portfolio Companies
Receivables from portfolio companies represent non-recurring costs incurred on behalf of such portfolio companies and are included in other assets on our accompanying Consolidated Statements of Assets and Liabilities. We maintain an allowance for uncollectible receivables from portfolio companies, which is determined based on historical experience and management’s expectations of future losses. We charge the accounts receivable to the established provision when collection efforts have been exhausted and the receivables are deemed uncollectible. As of September 30, 2012 and 2011, we had gross receivables from portfolio companies of $0.8 million. The allowance for uncollectible receivables was $0.4 million at September 30, 2012 and 2011. In addition, we recorded an allowance for uncollectible interest receivable of $21 and $65 as of September 30, 2012 and 2011, respectively. NOTE 4. RELATED PARTY TRANSACTIONS Investment Advisory and Management Agreement We entered into an investment advisory and management agreement with the Adviser (the “Advisory Agreement”), which is controlled by our chairman and chief executive officer. In accordance with the Advisory Agreement, we pay the Adviser certain fees as compensation for its services, such fees consisting of a base management fee and an incentive fee. On July 10, 2012, our Board of Directors approved the renewal of the Advisory Agreement through August 31, 2013. The following table summarizes the management fees, incentive fees and associated credits reflected in our accompanying Consolidated Statements of Operations:
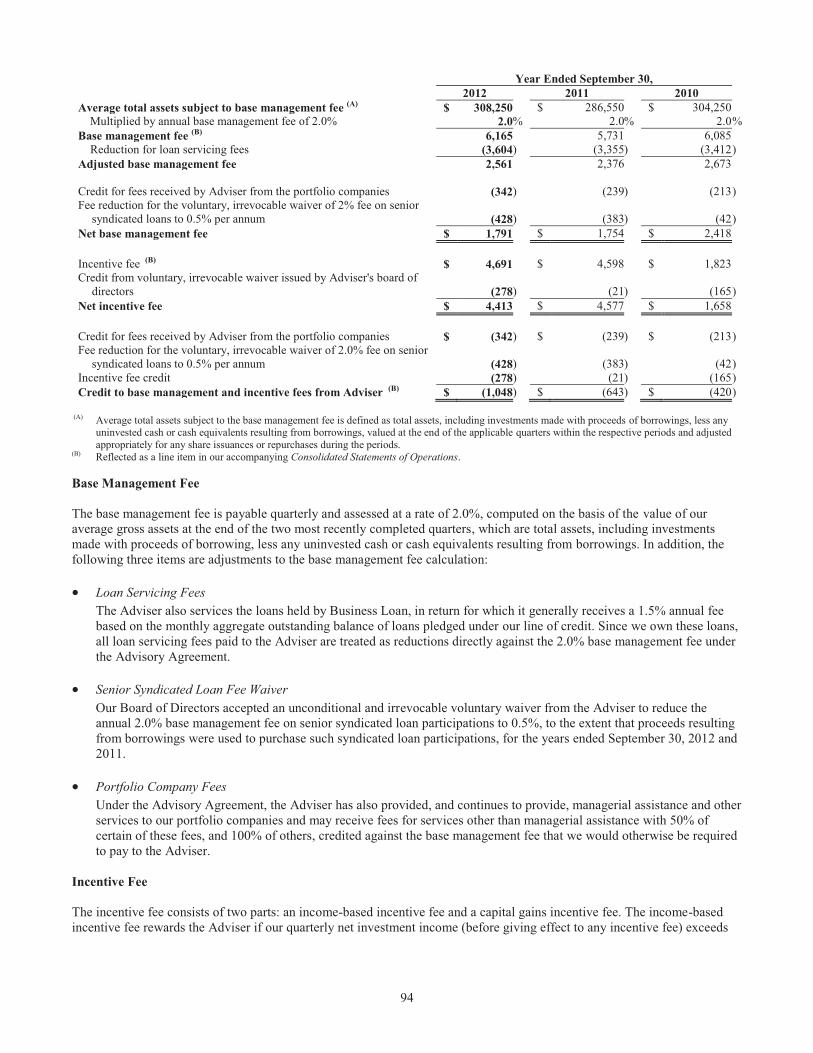
94
Year Ended September 30, 2012 2011 2010
Average total assets subject to base management fee (A) $ 308,250 $ 286,550 $ 304,250 Multiplied by annual base management fee of 2.0% 2.0 % 2.0% 2.0 % Base management fee (B) 6,165 5,731 6,085 Reduction for loan servicing fees (3,604 ) (3,355) (3,412 ) Adjusted base management fee 2,561 2,376 2,673 Credit for fees received by Adviser from the portfolio companies (342 ) (239) (213 ) Fee reduction for the voluntary, irrevocable waiver of 2% fee on senior
syndicated loans to 0.5% per annum (428 ) (383) (42 ) Net base management fee $ 1,791 $ 1,754 $ 2,418 Incentive fee (B) $ 4,691 $ 4,598 $ 1,823 Credit from voluntary, irrevocable waiver issued by Adviser's board of
directors (278 ) (21) (165 ) Net incentive fee $ 4,413 $ 4,577 $ 1,658 Credit for fees received by Adviser from the portfolio companies $ (342 ) $ (239 ) $ (213 ) Fee reduction for the voluntary, irrevocable waiver of 2.0% fee on senior
syndicated loans to 0.5% per annum (428 ) (383) (42 ) Incentive fee credit (278 ) (21) (165 ) Credit to base management and incentive fees from Adviser (B) $ (1,048 ) $ (643 ) $ (420 )
(A) Average total assets subject to the base management fee is defined as total assets, including investments made with proceeds of borrowings, less any
uninvested cash or cash equivalents resulting from borrowings, valued at the end of the applicable quarters within the respective periods and adjusted appropriately for any share issuances or repurchases during the periods.
(B) Reflected as a line item in our accompanying Consolidated Statements of Operations. Base Management Fee The base management fee is payable quarterly and assessed at a rate of 2.0%, computed on the basis of the value of our average gross assets at the end of the two most recently completed quarters, which are total assets, including investments made with proceeds of borrowing, less any uninvested cash or cash equivalents resulting from borrowings. In addition, the following three items are adjustments to the base management fee calculation: � Loan Servicing Fees
The Adviser also services the loans held by Business Loan, in return for which it generally receives a 1.5% annual fee based on the monthly aggregate outstanding balance of loans pledged under our line of credit. Since we own these loans, all loan servicing fees paid to the Adviser are treated as reductions directly against the 2.0% base management fee under the Advisory Agreement.
� Senior Syndicated Loan Fee Waiver
Our Board of Directors accepted an unconditional and irrevocable voluntary waiver from the Adviser to reduce the annual 2.0% base management fee on senior syndicated loan participations to 0.5%, to the extent that proceeds resulting from borrowings were used to purchase such syndicated loan participations, for the years ended September 30, 2012 and 2011.
� Portfolio Company Fees
Under the Advisory Agreement, the Adviser has also provided, and continues to provide, managerial assistance and other services to our portfolio companies and may receive fees for services other than managerial assistance with 50% of certain of these fees, and 100% of others, credited against the base management fee that we would otherwise be required to pay to the Adviser.
Incentive Fee The incentive fee consists of two parts: an income-based incentive fee and a capital gains incentive fee. The income-based incentive fee rewards the Adviser if our quarterly net investment income (before giving effect to any incentive fee) exceeds
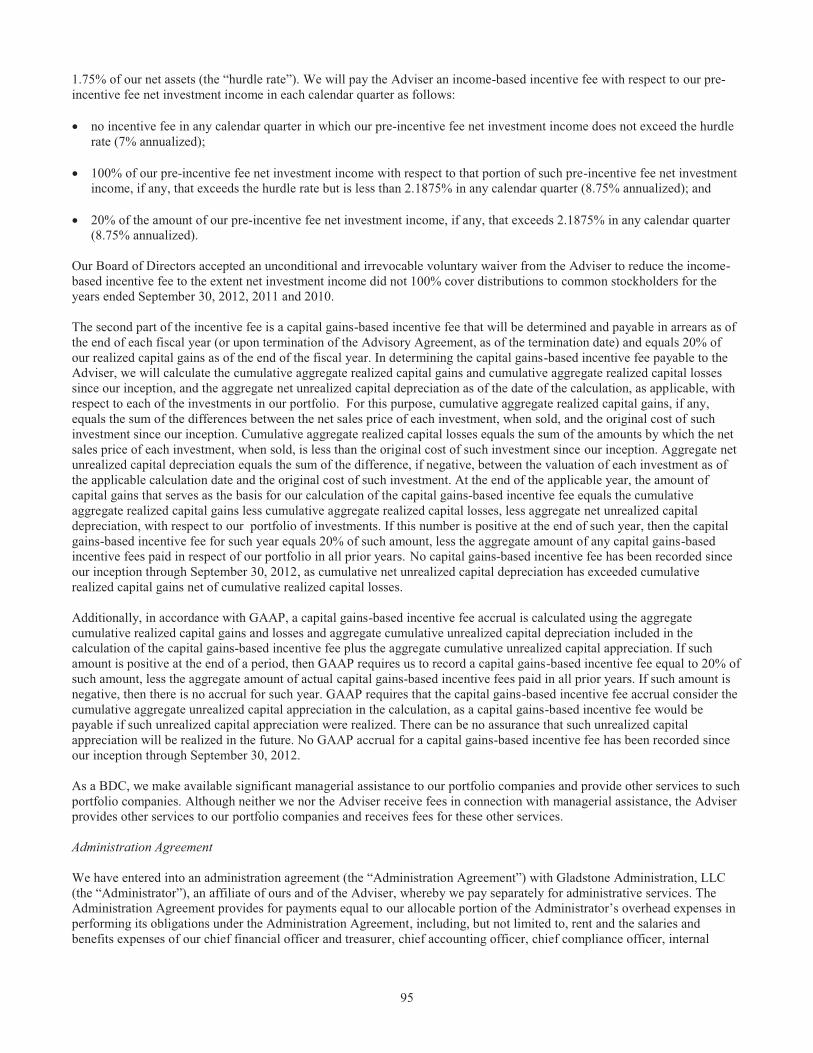
95
1.75% of our net assets (the “hurdle rate”). We will pay the Adviser an income-based incentive fee with respect to our pre-incentive fee net investment income in each calendar quarter as follows: � no incentive fee in any calendar quarter in which our pre-incentive fee net investment income does not exceed the hurdle
rate (7% annualized); � 100% of our pre-incentive fee net investment income with respect to that portion of such pre-incentive fee net investment
income, if any, that exceeds the hurdle rate but is less than 2.1875% in any calendar quarter (8.75% annualized); and � 20% of the amount of our pre-incentive fee net investment income, if any, that exceeds 2.1875% in any calendar quarter
(8.75% annualized). Our Board of Directors accepted an unconditional and irrevocable voluntary waiver from the Adviser to reduce the income-based incentive fee to the extent net investment income did not 100% cover distributions to common stockholders for the years ended September 30, 2012, 2011 and 2010. The second part of the incentive fee is a capital gains-based incentive fee that will be determined and payable in arrears as of the end of each fiscal year (or upon termination of the Advisory Agreement, as of the termination date) and equals 20% of our realized capital gains as of the end of the fiscal year. In determining the capital gains-based incentive fee payable to the Adviser, we will calculate the cumulative aggregate realized capital gains and cumulative aggregate realized capital losses since our inception, and the aggregate net unrealized capital depreciation as of the date of the calculation, as applicable, with respect to each of the investments in our portfolio. For this purpose, cumulative aggregate realized capital gains, if any, equals the sum of the differences between the net sales price of each investment, when sold, and the original cost of such investment since our inception. Cumulative aggregate realized capital losses equals the sum of the amounts by which the net sales price of each investment, when sold, is less than the original cost of such investment since our inception. Aggregate net unrealized capital depreciation equals the sum of the difference, if negative, between the valuation of each investment as of the applicable calculation date and the original cost of such investment. At the end of the applicable year, the amount of capital gains that serves as the basis for our calculation of the capital gains-based incentive fee equals the cumulative aggregate realized capital gains less cumulative aggregate realized capital losses, less aggregate net unrealized capital depreciation, with respect to our portfolio of investments. If this number is positive at the end of such year, then the capital gains-based incentive fee for such year equals 20% of such amount, less the aggregate amount of any capital gains-based incentive fees paid in respect of our portfolio in all prior years. No capital gains-based incentive fee has been recorded since our inception through September 30, 2012, as cumulative net unrealized capital depreciation has exceeded cumulative realized capital gains net of cumulative realized capital losses. Additionally, in accordance with GAAP, a capital gains-based incentive fee accrual is calculated using the aggregate cumulative realized capital gains and losses and aggregate cumulative unrealized capital depreciation included in the calculation of the capital gains-based incentive fee plus the aggregate cumulative unrealized capital appreciation. If such amount is positive at the end of a period, then GAAP requires us to record a capital gains-based incentive fee equal to 20% of such amount, less the aggregate amount of actual capital gains-based incentive fees paid in all prior years. If such amount is negative, then there is no accrual for such year. GAAP requires that the capital gains-based incentive fee accrual consider the cumulative aggregate unrealized capital appreciation in the calculation, as a capital gains-based incentive fee would be payable if such unrealized capital appreciation were realized. There can be no assurance that such unrealized capital appreciation will be realized in the future. No GAAP accrual for a capital gains-based incentive fee has been recorded since our inception through September 30, 2012. As a BDC, we make available significant managerial assistance to our portfolio companies and provide other services to such portfolio companies. Although neither we nor the Adviser receive fees in connection with managerial assistance, the Adviser provides other services to our portfolio companies and receives fees for these other services. Administration Agreement We have entered into an administration agreement (the “Administration Agreement”) with Gladstone Administration, LLC (the “Administrator”), an affiliate of ours and of the Adviser, whereby we pay separately for administrative services. The Administration Agreement provides for payments equal to our allocable portion of the Administrator’s overhead expenses in performing its obligations under the Administration Agreement, including, but not limited to, rent and the salaries and benefits expenses of our chief financial officer and treasurer, chief accounting officer, chief compliance officer, internal
96
counsel and their respective staffs. Our allocable portion of administrative expenses is generally derived by multiplying the Administrator’s total allocable expenses by the percentage of our total assets at the beginning of the quarter in comparison to the total assets at the beginning of the quarter of all companies managed by the Adviser under similar agreements. On July 10, 2012, our Board of Directors approved the renewal of the Administration Agreement for another year through August 31, 2013. Related Party Fees Due Amounts due to related parties on our accompanying Consolidated Statements of Assets and Liabilities were as follows:
As of September 30, 2012 2011
Base management fee due to Adviser $ 504 $ 330 Incentive fee due to Adviser 1,135 1,203 Loan servicing fee due to Adviser 191 227 Total fees due to Adviser 1,830 1,760 Fee due to Administrator 174 194 Total related party fees due $ 2,004 $ 1,954
Notes to Former Employees We have outstanding notes to certain of our former employees, who are now employees of the Adviser. The notes were for the exercise of options granted under our Amended and Restated 2001 Equity Incentive Plan, which has since been terminated. The notes require the quarterly payment of interest at the market rate in effect at the date of issuance, have varying terms not exceeding ten years and have been recorded as a reduction of net assets. The notes are evidenced by full recourse notes that are due upon maturity or 60 days following termination of employment with the Adviser, and the shares of common stock purchased with the proceeds of the notes were posted as collateral. We received $0.8 million and $3.2 million in aggregated principal repayments during the years ended September 30, 2012 and 2011, respectively. As part of the 2012 payment, one employee redeemed 39,082 shares of common stock and liquidated additional collateral to pay off an aggregate of $0.3 million of principal on his outstanding notes. We recognized interest income from all employee notes of an aggregated $0.3 million, $0.4 million and $0.4 million for the years ended September 30, 2012, 2011 and 2010, respectively. The following table is a summary of all outstanding notes issued to employees of the Adviser for the exercise of stock options:
Outstanding Outstanding Original Original Amount of Balance of Balance of Interest
Issue Promissory Note Employee Notes Employee Notes Maturity Rate Date Issued to Employees at September 30, 2012 at September 30, 2011 Date on Note
Aug-01 $ 5,900(A) $ 2,749 $ 2,749 Aug-10 (B) 4.90%
Aug-01 275(A) — 200 Aug-10 (B) 4.90
Aug-01 275(C) — 236 Aug-11 4.90 Sep-04 200(C) — 198 Sep-13 5.00 Jul-06 200(A) — 200 Jul-15 8.26 Jul-06 275(A) 275 275 Jul-15 8.26
$ 7,125 $ 3,024 $ 3,858 (A) On September 7, 2010, we entered into redemption agreements (the “Redemption Agreements”) with David Gladstone, our Chairman and Chief
Executive Officer, and Laura Gladstone, a Managing Director of the Adviser and the daughter of Mr. Gladstone, in connection with the maturity of secured promissory notes executed by Mr. Gladstone and Ms. Gladstone in favor of us on August 23, 2001, in the principal amounts of $5.9 million and $0.3 million, respectively, and two additional notes executed by Ms. Gladstone, in the principal amounts of $0.2 and $0.3, each scheduled to mature on July 13, 2015 (collectively, the “Notes”). Mr. and Ms. Gladstone originally executed the Notes to facilitate their payment of the exercise price of certain stock options (the “Options”) to acquire shares of our common stock. Concurrently with the execution of the Notes, we, together with Mr. and Ms. Gladstone entered into stock pledge agreements (collectively, the “Pledge Agreements”), pursuant to which Mr. and Ms. Gladstone granted to us a first priority security interest in the Pledged Collateral (as defined in the respective Pledge Agreements), which included 393,334 and 18,334 shares, respectively, of our common stock that Mr. and Ms. Gladstone acquired pursuant to the exercise of the Options (collectively, the “Pledged Shares”). In addition, a sufficient amount of Mr. Gladstone’s common shares of Gladstone Land Corporation (“Gladstone Land”) were pledged by Mr. Gladstone to fully collateralize both Notes. The Redemption Agreements provide that, pursuant to the terms and conditions thereof, we will automatically accept and retire the Pledged Shares in partial or full satisfaction, as applicable, of Mr. and Ms. Gladstone’s obligations to us under the Notes at such time, if ever, that the trading price of our common stock reaches $15 per share. In entering into the Redemption Agreements, we reserved all of our existing rights
97
under the Notes and the Pledge Agreements, including, but not limited to, the ability to foreclose on the Pledged Collateral at any time. On March 30, 2011, June 27, 2011 and September 26, 2011, Mr. Gladstone paid down an aggregate amount of $3.2 million of the principal balance of his Note, leaving a principal balance of $2.7 million outstanding as of September 30, 2011 and 2012. In connection with these payments, we released our first priority security interest on 210,000 common shares of Mr. Gladstone’s Pledged Shares, leaving a balance of 183,334 common shares of the Company in Pledged Collateral from Mr. Gladstone as of September 30, 2011 and 2012. On September 28, 2011 and September 17, 2012, Ms. Gladstone paid $0.1 million and $0.2 million, respectively, of the principal balance of her note the defaulted in August 2010, repaying this Note in full. Additionally, on September 17, 2012, Ms. Gladstone also made an early pay off of the $0.2 million principal balance on one of her two Notes scheduled to mature on July 13, 2015N, repaying this Note in full.
(B) An event of default was triggered under each of these Notes by virtue of Mr. and Ms. Gladstone’s failure to repay the amounts outstanding within five business days of August 23, 2010. As such, we charged a default rate of an additional 2% per annum under these Notes for all periods following default.
(C) On December 20, 2011, we entered into an amended and restated redemption agreement with an employee of the Adviser in connection with the maturity of a secured promissory note executed by the employee in favor of us on August 23, 2001, in the principal amount of $0.3 million. Pursuant to the redemption agreement, on December 29, 2011, we redeemed 20,000 shares of our common stock that had been pledged as collateral on the employee note, resulting in a reduction of $0.2 million on the employee note, leaving a principal balance of $0.1 million as of December 31, 2011. On January 26, 2012, we redeemed an additional 19,082 shares of our common stock that had been pledged as collateral on the employee note, resulting in the employee’s defaulted note being fully paid off and a reduction of $0.1 million on the employee’s other note, leaving a remaining principal balance thereon of $0.1 million as of June 30, 2012. On September 25, 2012, the employee liquidated his pledged collateral and paid off his remaining note balance of $0.1 million. As of September 30, 2012, this employee does not have any balances outstanding on any notes with us.
During the year ended September 30, 2010, the employee stock option notes of two of our former employees of were converted from recourse to non-recourse notes. In connection with these conversions, we repurchased and retired the shares of common stock pledged as collateral for the notes, which shares had previously been acquired upon the exercise of the stock options in consideration for the issuance of the notes. The repurchases were accounted for as treasury stock transactions at the fair value of the shares, based on the trading price of our common stock on the date of the transactions, totaling $0.4 million. Since the value of the stock option notes totaled $0.6 million, we recorded non-cash compensation expense of $0.2 million during the year ended September 30, 2010. In accordance with ASC 505, “Equity,” our receivables from employees for the issuance of capital stock to employees prior to the receipt of cash payment should be reflected in the balance sheet as a reduction to stockholders’ equity. Therefore, our recourse notes totaling in aggregate $3.0 million as of September 30, 2012 were recorded as notes to employees and are included in the net assets section of our accompanying Consolidated Statements of Assets and Liabilities. As of September 30, 2012, we determined that these notes were still recourse. NOTE 5. BORROWINGS
Line of Credit On January 19, 2012, we, through our wholly-owned subsidiary, Business Loan, entered into Amendment No. 3 to the fourth amended and restated credit agreement (the “Credit Facility”) to extend the maturity date of our $137.0 million revolving line of credit from March 15, 2012 to January 19, 2015 (the “Maturity Date”). Our Credit Facility was arranged by Key Equipment Finance Inc. (“Keybank”) as administrative agent. Branch Banking and Trust Company (“BB&T”) and ING Capital LLC (“ING”) also joined our Credit Facility as committed lenders. Subject to certain terms and conditions, our Credit Facility may be expanded to a maximum of $237.0 million through the addition of other committed lenders to the facility. If our Credit Facility is not renewed or extended by the Maturity Date, all principal and interest will be due and payable on or before January 19, 2016 (one year after the Maturity Date). The interest rates on advances under our Credit Facility remain unchanged and generally bear interest at a 30-day London Interbank Offered Rate (“LIBOR”) (subject to a minimum rate of 1.5%), plus 3.75% per annum, with a commitment fee of 0.5% per annum on undrawn amounts when our facility is drawn more than 50% and 1.0% per annum on undrawn amounts when our facility is drawn less than 50%. We incurred fees of $1.5 million in January 2012 in connection with this amendment. The following tables summarize noteworthy information related to our Credit Facility (at cost):
September 30, 2012 September 30, 2011 Commitment amount $ 137,000 $ 137,000 Borrowings outstanding 58,800 99,400 Availability 54,700 24,700
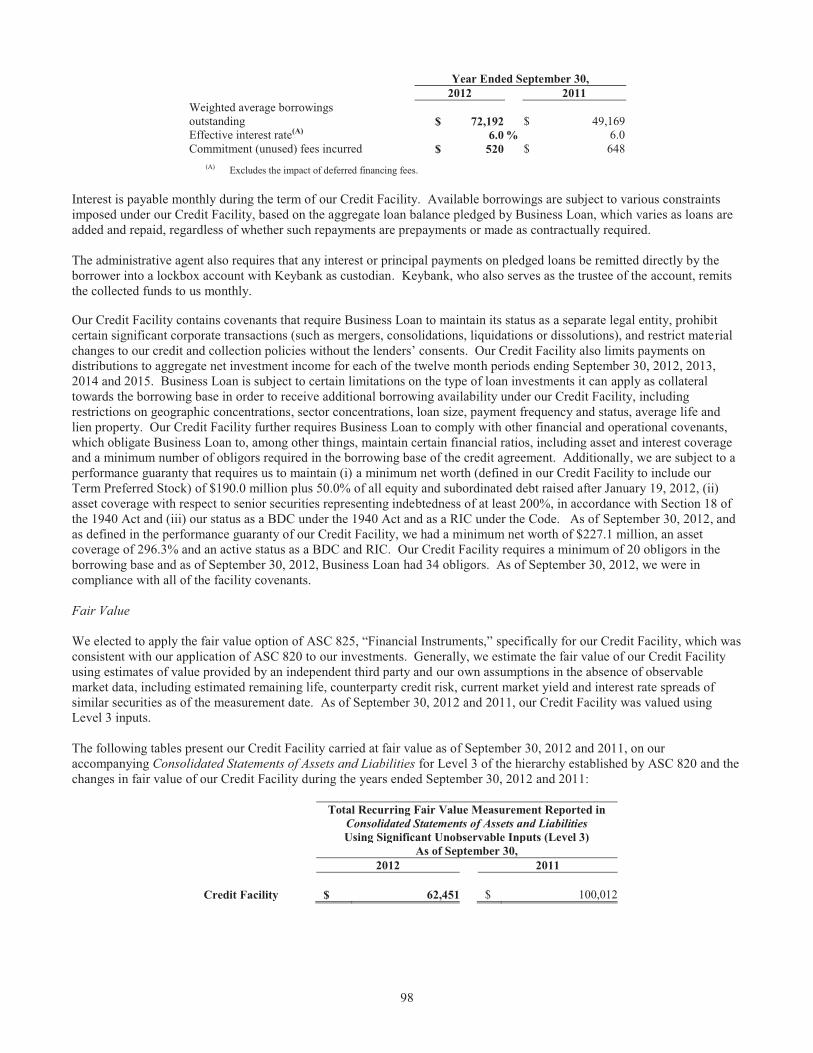
98
Year Ended September 30, 2012 2011 Weighted average borrowings outstanding
$ 72,192
$ 49,169
Effective interest rate(A) 6.0 % 6.0 Commitment (unused) fees incurred $ 520 $ 648
(A) Excludes the impact of deferred financing fees.
Interest is payable monthly during the term of our Credit Facility. Available borrowings are subject to various constraints imposed under our Credit Facility, based on the aggregate loan balance pledged by Business Loan, which varies as loans are added and repaid, regardless of whether such repayments are prepayments or made as contractually required. The administrative agent also requires that any interest or principal payments on pledged loans be remitted directly by the borrower into a lockbox account with Keybank as custodian. Keybank, who also serves as the trustee of the account, remits the collected funds to us monthly. Our Credit Facility contains covenants that require Business Loan to maintain its status as a separate legal entity, prohibit certain significant corporate transactions (such as mergers, consolidations, liquidations or dissolutions), and restrict material changes to our credit and collection policies without the lenders’ consents. Our Credit Facility also limits payments on distributions to aggregate net investment income for each of the twelve month periods ending September 30, 2012, 2013, 2014 and 2015. Business Loan is subject to certain limitations on the type of loan investments it can apply as collateral towards the borrowing base in order to receive additional borrowing availability under our Credit Facility, including restrictions on geographic concentrations, sector concentrations, loan size, payment frequency and status, average life and lien property. Our Credit Facility further requires Business Loan to comply with other financial and operational covenants, which obligate Business Loan to, among other things, maintain certain financial ratios, including asset and interest coverage and a minimum number of obligors required in the borrowing base of the credit agreement. Additionally, we are subject to a performance guaranty that requires us to maintain (i) a minimum net worth (defined in our Credit Facility to include our Term Preferred Stock) of $190.0 million plus 50.0% of all equity and subordinated debt raised after January 19, 2012, (ii) asset coverage with respect to senior securities representing indebtedness of at least 200%, in accordance with Section 18 of the 1940 Act and (iii) our status as a BDC under the 1940 Act and as a RIC under the Code. As of September 30, 2012, and as defined in the performance guaranty of our Credit Facility, we had a minimum net worth of $227.1 million, an asset coverage of 296.3% and an active status as a BDC and RIC. Our Credit Facility requires a minimum of 20 obligors in the borrowing base and as of September 30, 2012, Business Loan had 34 obligors. As of September 30, 2012, we were in compliance with all of the facility covenants. Fair Value We elected to apply the fair value option of ASC 825, “Financial Instruments,” specifically for our Credit Facility, which was consistent with our application of ASC 820 to our investments. Generally, we estimate the fair value of our Credit Facility using estimates of value provided by an independent third party and our own assumptions in the absence of observable market data, including estimated remaining life, counterparty credit risk, current market yield and interest rate spreads of similar securities as of the measurement date. As of September 30, 2012 and 2011, our Credit Facility was valued using Level 3 inputs. The following tables present our Credit Facility carried at fair value as of September 30, 2012 and 2011, on our accompanying Consolidated Statements of Assets and Liabilities for Level 3 of the hierarchy established by ASC 820 and the changes in fair value of our Credit Facility during the years ended September 30, 2012 and 2011:
Total Recurring Fair Value Measurement Reported in Consolidated Statements of Assets and Liabilities Using Significant Unobservable Inputs (Level 3) As of September 30, 2012 2011 Credit Facility $ 62,451 $ 100,012
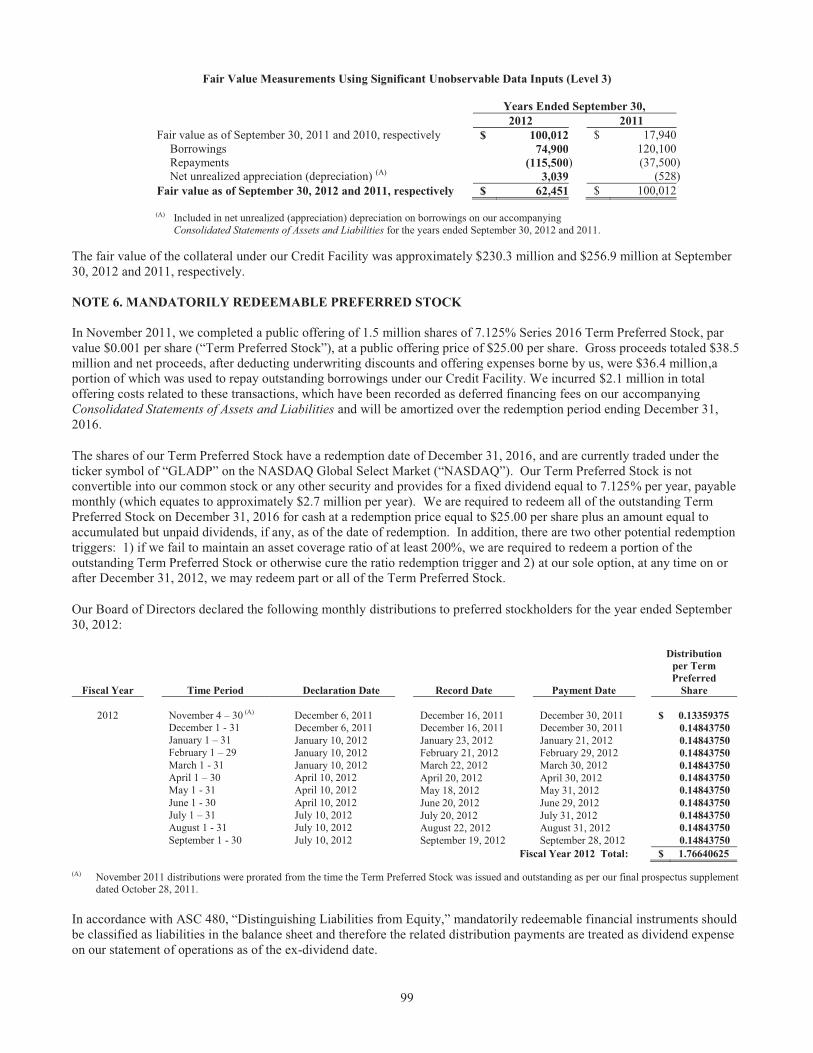
99
Fair Value Measurements Using Significant Unobservable Data Inputs (Level 3)
Years Ended September 30, 2012 2011 Fair value as of September 30, 2011 and 2010, respectively $ 100,012 $ 17,940
Borrowings 74,900 120,100 Repayments (115,500 ) (37,500 ) Net unrealized appreciation (depreciation) (A) 3,039 (528 )
Fair value as of September 30, 2012 and 2011, respectively $ 62,451 $ 100,012
(A) Included in net unrealized (appreciation) depreciation on borrowings on our accompanying Consolidated Statements of Assets and Liabilities for the years ended September 30, 2012 and 2011.
The fair value of the collateral under our Credit Facility was approximately $230.3 million and $256.9 million at September 30, 2012 and 2011, respectively. NOTE 6. MANDATORILY REDEEMABLE PREFERRED STOCK In November 2011, we completed a public offering of 1.5 million shares of 7.125% Series 2016 Term Preferred Stock, par value $0.001 per share (“Term Preferred Stock”), at a public offering price of $25.00 per share. Gross proceeds totaled $38.5 million and net proceeds, after deducting underwriting discounts and offering expenses borne by us, were $36.4 million,a portion of which was used to repay outstanding borrowings under our Credit Facility. We incurred $2.1 million in total offering costs related to these transactions, which have been recorded as deferred financing fees on our accompanying Consolidated Statements of Assets and Liabilities and will be amortized over the redemption period ending December 31, 2016.
The shares of our Term Preferred Stock have a redemption date of December 31, 2016, and are currently traded under the ticker symbol of “GLADP” on the NASDAQ Global Select Market (“NASDAQ”). Our Term Preferred Stock is not convertible into our common stock or any other security and provides for a fixed dividend equal to 7.125% per year, payable monthly (which equates to approximately $2.7 million per year). We are required to redeem all of the outstanding Term Preferred Stock on December 31, 2016 for cash at a redemption price equal to $25.00 per share plus an amount equal to accumulated but unpaid dividends, if any, as of the date of redemption. In addition, there are two other potential redemption triggers: 1) if we fail to maintain an asset coverage ratio of at least 200%, we are required to redeem a portion of the outstanding Term Preferred Stock or otherwise cure the ratio redemption trigger and 2) at our sole option, at any time on or after December 31, 2012, we may redeem part or all of the Term Preferred Stock.
Our Board of Directors declared the following monthly distributions to preferred stockholders for the year ended September 30, 2012:
Fiscal Year
Time Period
Declaration Date
Record Date
Payment Date
Distribution per Term Preferred
Share
2012
November 4 – 30 (A)
December 6, 2011
December 16, 2011
December 30, 2011
$ 0.13359375 December 1 - 31 December 6, 2011 December 16, 2011 December 30, 2011 0.14843750 January 1 – 31 January 10, 2012 January 23, 2012 January 21, 2012 0.14843750 February 1 – 29 January 10, 2012 February 21, 2012 February 29, 2012 0.14843750 March 1 - 31 January 10, 2012 March 22, 2012 March 30, 2012 0.14843750 April 1 – 30 April 10, 2012 April 20, 2012 April 30, 2012 0.14843750 May 1 - 31 April 10, 2012 May 18, 2012 May 31, 2012 0.14843750 June 1 - 30 April 10, 2012 June 20, 2012 June 29, 2012 0.14843750 July 1 – 31 July 10, 2012 July 20, 2012 July 31, 2012 0.14843750 August 1 - 31 July 10, 2012 August 22, 2012 August 31, 2012 0.14843750 September 1 - 30 July 10, 2012 September 19, 2012 September 28, 2012 0.14843750 Fiscal Year 2012 Total: $ 1.76640625
(A) November 2011 distributions were prorated from the time the Term Preferred Stock was issued and outstanding as per our final prospectus supplement dated October 28, 2011.
In accordance with ASC 480, “Distinguishing Liabilities from Equity,” mandatorily redeemable financial instruments should be classified as liabilities in the balance sheet and therefore the related distribution payments are treated as dividend expense on our statement of operations as of the ex-dividend date.
100
Aggregate preferred distributions declared and paid for the year ended September 30, 2012 were approximately $2.5 million, respectively. There were no preferred distributions declared or paid for the year ended September 30, 2011. NOTE 7. COMMON STOCK TRANSACTIONS
On October 20, 2009, we filed a registration statement (the “Registration Statement”) on Form N-2 (File No. 333-162592) that was amended on December 9, 2009 and which the Securities and Exchange Commission (“SEC”) declared effective on January 28, 2010. Post-effective amendments dated July 13, 2011 (declared effective by the SEC on July 15, 2011) and dated June 4, 2012 (declared effective by the SEC on June 11, 2012) were also filed under this Registration Statement. The Registration Statement permits us to issue, through one or more transactions, up to an aggregate of $300.0 million in securities, consisting of common stock, preferred stock, subscription rights, debt securities and warrants to purchase common stock, including through a combined offering of such securities. To date, under the Registration Statement, we have issued $38.5 million in Term Preferred Stock, leaving us with the availability to raise up to $261.5 million of additional equity capital through the sale of securities that are registered under the Registration Statement in one or more future public offerings and have entered into an agreement, described below, to potentially issue up to 2.0 million shares of common stock from time to time in the future. In addition, on May 17, 2010, together with the Advisor, we entered into an equity distribution agreement (the “Agreement”) with BB&T Capital Markets, a division of Scott & Stringfellow, LLC (the “Agent”), under which we could have, from time to time, issued and sold through the Agent, as sales agent, up to 2.0 million shares of our common stock, par value $0.001 per share, based upon instructions from us. To date, we have not issued any shares pursuant to this Agreement and in October 2012, we terminated the Agreement effective October 11, 2012. See Note 12—Subsequent Events for further discussion. During the quarter ended December 31, 2011, pursuant to the terms of our articles of incorporation, as amended, our Board of Directors approved reclassifying 4.0 million shares of common stock to shares of preferred stock in connection with our November 2011 Term Preferred Stock offering. NOTE 8. NET (DECREASE) INCREASE IN NET ASSETS RESULTING FROM OPERATIONS PER COMMON SHARE The following table sets forth the computation of basic and diluted net (decrease) increase in net assets resulting from operations per weighted average common share for the fiscal years ended September 30, 2012, 2011 and 2010:
Year Ended September 30, 2012 2011 2010 Numerator for basic and diluted net (decrease) increase in net
assets resulting from operations per common share $ (8,008) $ (21,099) $ 16,394 Denominator for basic and diluted weighted average common
shares 21,011,123 21,039,242 21,060,351 Basic and diluted net (decrease) increase in net assets resulting
from operations per weighted average common share $ (0.38) $ (1.00) $ 0.78
NOTE 9. DISTRIBUTIONS TO COMMON STOCKHOLDERS
Distributions
We are required to pay out as distributions 90% of our ordinary income and short-term capital gains for each taxable year in order to maintain our status as a RIC under Subtitle A, Chapter 1 of Subchapter M of the Code. It is our policy to pay out as a distribution up to 100% of those amounts. The amount to be paid out as a distribution is determined by our Board of Directors each quarter and is based on the annual earnings estimated by management. Based on that estimate, three monthly distributions are declared each quarter. At year-end we may pay a bonus distribution, in addition to the monthly distributions, to ensure that we have paid out at least 90% of our ordinary income and realized net short-term capital gains for the year. Long-term capital gains are composed of prepayment fees and gains from the sale of securities held for one year or more. Additionally, prior to January 1, 2011, success fees were treated as long-term capital gains. However, beginning January 1, 2011, success fees are characterized as ordinary income for tax purposes. The approved change in accounting method does not require us to retroactively change the capital gains treatment of the success fees received prior to January 1,
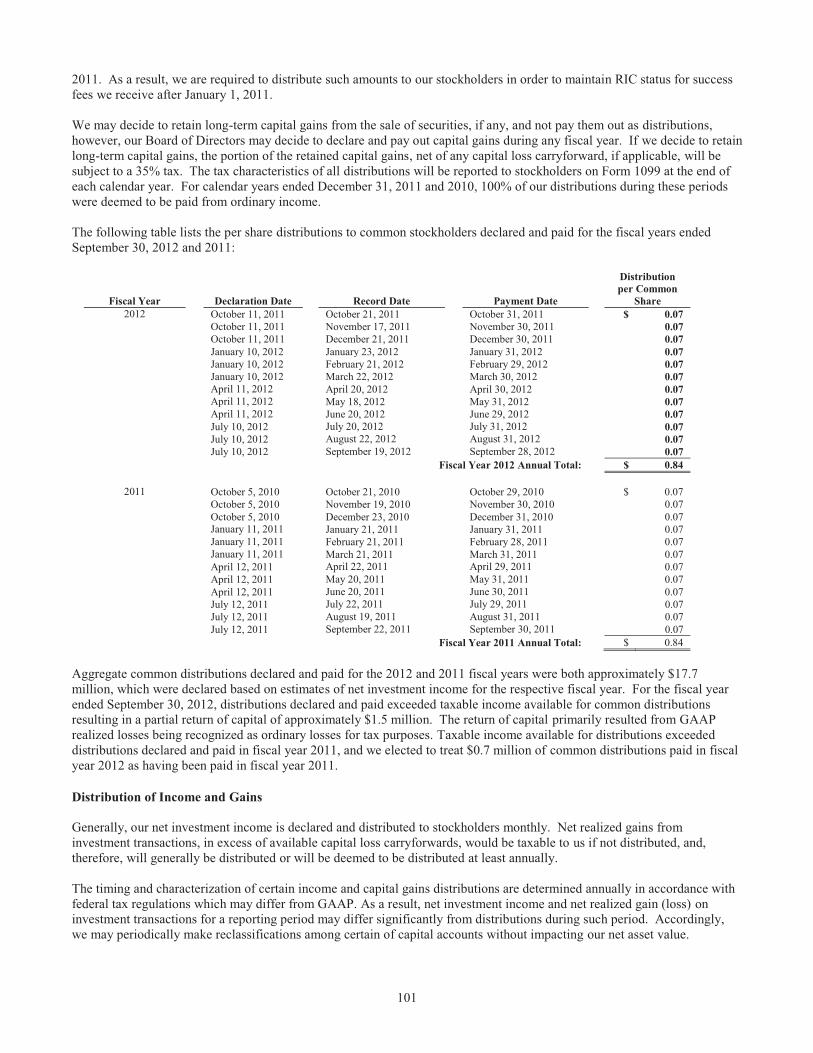
101
2011. As a result, we are required to distribute such amounts to our stockholders in order to maintain RIC status for success fees we receive after January 1, 2011. We may decide to retain long-term capital gains from the sale of securities, if any, and not pay them out as distributions, however, our Board of Directors may decide to declare and pay out capital gains during any fiscal year. If we decide to retain long-term capital gains, the portion of the retained capital gains, net of any capital loss carryforward, if applicable, will be subject to a 35% tax. The tax characteristics of all distributions will be reported to stockholders on Form 1099 at the end of each calendar year. For calendar years ended December 31, 2011 and 2010, 100% of our distributions during these periods were deemed to be paid from ordinary income. The following table lists the per share distributions to common stockholders declared and paid for the fiscal years ended September 30, 2012 and 2011:
Fiscal Year
Declaration Date
Record Date
Payment Date
Distribution per Common
Share 2012 October 11, 2011 October 21, 2011 October 31, 2011 $ 0.07
October 11, 2011 November 17, 2011 November 30, 2011 0.07 October 11, 2011 December 21, 2011 December 30, 2011 0.07 January 10, 2012 January 23, 2012 January 31, 2012 0.07 January 10, 2012 February 21, 2012 February 29, 2012 0.07 January 10, 2012 March 22, 2012 March 30, 2012 0.07 April 11, 2012 April 20, 2012 April 30, 2012 0.07 April 11, 2012 May 18, 2012 May 31, 2012 0.07 April 11, 2012 June 20, 2012 June 29, 2012 0.07 July 10, 2012 July 20, 2012 July 31, 2012 0.07 July 10, 2012 August 22, 2012 August 31, 2012 0.07 July 10, 2012 September 19, 2012 September 28, 2012 0.07 Fiscal Year 2012 Annual Total: $ 0.84
2011 October 5, 2010 October 21, 2010 October 29, 2010 $ 0.07 October 5, 2010 November 19, 2010 November 30, 2010 0.07 October 5, 2010 December 23, 2010 December 31, 2010 0.07 January 11, 2011 January 21, 2011 January 31, 2011 0.07 January 11, 2011 February 21, 2011 February 28, 2011 0.07 January 11, 2011 March 21, 2011 March 31, 2011 0.07 April 12, 2011 April 22, 2011 April 29, 2011 0.07 April 12, 2011 May 20, 2011 May 31, 2011 0.07 April 12, 2011 June 20, 2011 June 30, 2011 0.07 July 12, 2011 July 22, 2011 July 29, 2011 0.07 July 12, 2011 August 19, 2011 August 31, 2011 0.07 July 12, 2011 September 22, 2011 September 30, 2011 0.07 Fiscal Year 2011 Annual Total: $ 0.84
Aggregate common distributions declared and paid for the 2012 and 2011 fiscal years were both approximately $17.7 million, which were declared based on estimates of net investment income for the respective fiscal year. For the fiscal year ended September 30, 2012, distributions declared and paid exceeded taxable income available for common distributions resulting in a partial return of capital of approximately $1.5 million. The return of capital primarily resulted from GAAP realized losses being recognized as ordinary losses for tax purposes. Taxable income available for distributions exceeded distributions declared and paid in fiscal year 2011, and we elected to treat $0.7 million of common distributions paid in fiscal year 2012 as having been paid in fiscal year 2011.
Distribution of Income and Gains Generally, our net investment income is declared and distributed to stockholders monthly. Net realized gains from investment transactions, in excess of available capital loss carryforwards, would be taxable to us if not distributed, and, therefore, will generally be distributed or will be deemed to be distributed at least annually. The timing and characterization of certain income and capital gains distributions are determined annually in accordance with federal tax regulations which may differ from GAAP. As a result, net investment income and net realized gain (loss) on investment transactions for a reporting period may differ significantly from distributions during such period. Accordingly, we may periodically make reclassifications among certain of capital accounts without impacting our net asset value.
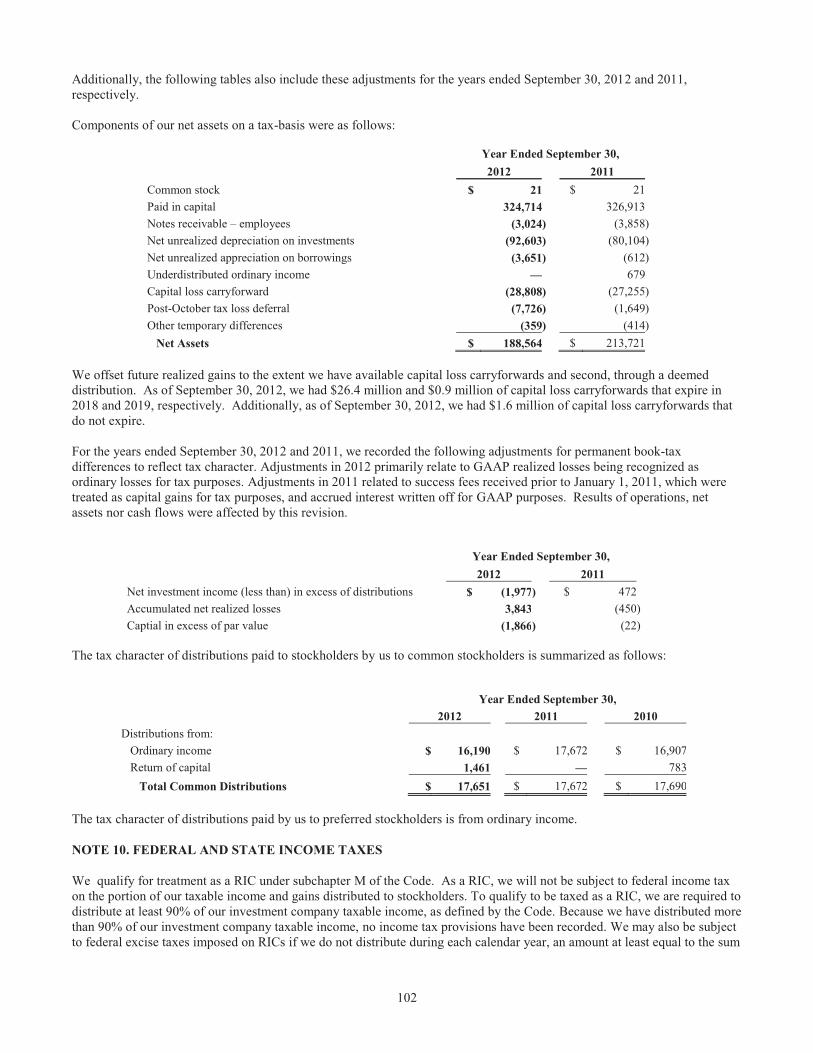
102
Additionally, the following tables also include these adjustments for the years ended September 30, 2012 and 2011, respectively. Components of our net assets on a tax-basis were as follows:
Year Ended September 30,
2012 2011
Common stock $ 21 $ 21
Paid in capital 324,714 326,913
Notes receivable – employees (3,024) (3,858) Net unrealized depreciation on investments (92,603) (80,104) Net unrealized appreciation on borrowings (3,651) (612) Underdistributed ordinary income — 679 Capital loss carryforward (28,808) (27,255) Post-October tax loss deferral (7,726) (1,649) Other temporary differences (359) (414) Net Assets $ 188,564 $ 213,721
We offset future realized gains to the extent we have available capital loss carryforwards and second, through a deemed distribution. As of September 30, 2012, we had $26.4 million and $0.9 million of capital loss carryforwards that expire in 2018 and 2019, respectively. Additionally, as of September 30, 2012, we had $1.6 million of capital loss carryforwards that do not expire. For the years ended September 30, 2012 and 2011, we recorded the following adjustments for permanent book-tax differences to reflect tax character. Adjustments in 2012 primarily relate to GAAP realized losses being recognized as ordinary losses for tax purposes. Adjustments in 2011 related to success fees received prior to January 1, 2011, which were treated as capital gains for tax purposes, and accrued interest written off for GAAP purposes. Results of operations, net assets nor cash flows were affected by this revision.
Year Ended September 30,
2012 2011
Net investment income (less than) in excess of distributions $ (1,977) $ 472 Accumulated net realized losses 3,843 (450) Captial in excess of par value (1,866) (22)
The tax character of distributions paid to stockholders by us to common stockholders is summarized as follows:
Year Ended September 30, 2012 2011 2010 Distributions from: Ordinary income $ 16,190 $ 17,672 $ 16,907 Return of capital 1,461 — 783 Total Common Distributions $ 17,651 $ 17,672 $ 17,690
The tax character of distributions paid by us to preferred stockholders is from ordinary income. NOTE 10. FEDERAL AND STATE INCOME TAXES
We qualify for treatment as a RIC under subchapter M of the Code. As a RIC, we will not be subject to federal income tax on the portion of our taxable income and gains distributed to stockholders. To qualify to be taxed as a RIC, we are required to distribute at least 90% of our investment company taxable income, as defined by the Code. Because we have distributed more than 90% of our investment company taxable income, no income tax provisions have been recorded. We may also be subject to federal excise taxes imposed on RICs if we do not distribute during each calendar year, an amount at least equal to the sum
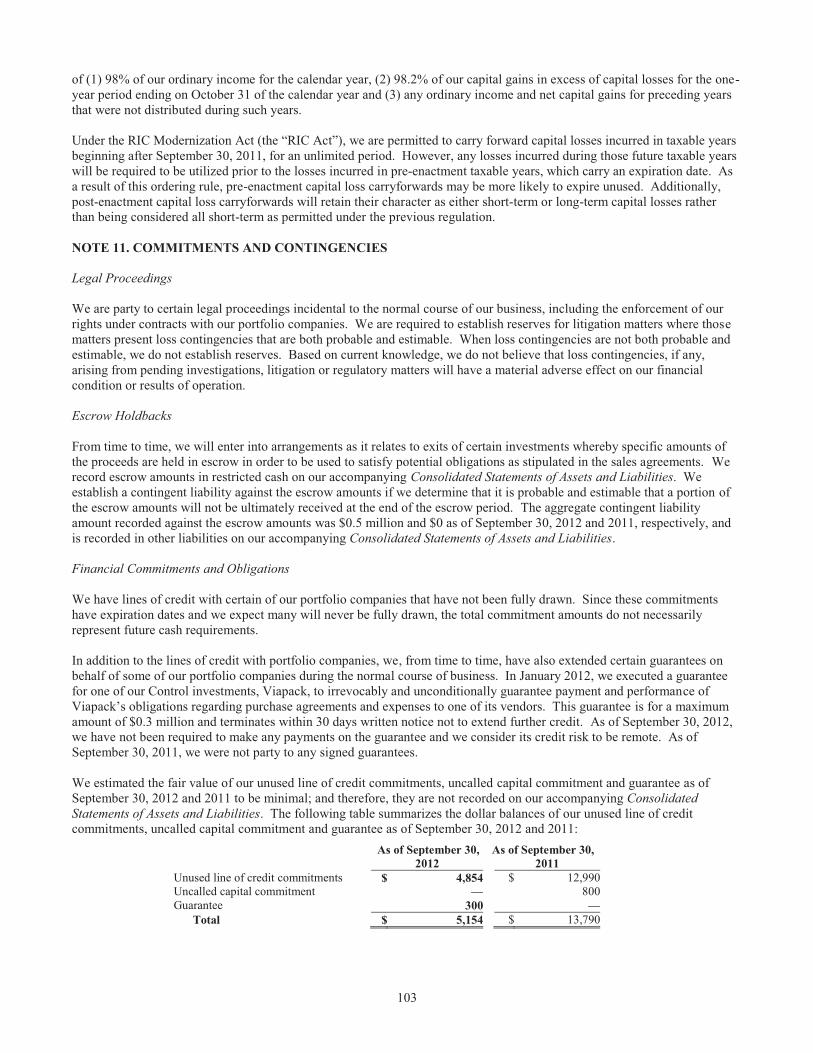
103
of (1) 98% of our ordinary income for the calendar year, (2) 98.2% of our capital gains in excess of capital losses for the one-year period ending on October 31 of the calendar year and (3) any ordinary income and net capital gains for preceding years that were not distributed during such years. Under the RIC Modernization Act (the “RIC Act”), we are permitted to carry forward capital losses incurred in taxable years beginning after September 30, 2011, for an unlimited period. However, any losses incurred during those future taxable years will be required to be utilized prior to the losses incurred in pre-enactment taxable years, which carry an expiration date. As a result of this ordering rule, pre-enactment capital loss carryforwards may be more likely to expire unused. Additionally, post-enactment capital loss carryforwards will retain their character as either short-term or long-term capital losses rather than being considered all short-term as permitted under the previous regulation. NOTE 11. COMMITMENTS AND CONTINGENCIES Legal Proceedings We are party to certain legal proceedings incidental to the normal course of our business, including the enforcement of our rights under contracts with our portfolio companies. We are required to establish reserves for litigation matters where those matters present loss contingencies that are both probable and estimable. When loss contingencies are not both probable and estimable, we do not establish reserves. Based on current knowledge, we do not believe that loss contingencies, if any, arising from pending investigations, litigation or regulatory matters will have a material adverse effect on our financial condition or results of operation. Escrow Holdbacks From time to time, we will enter into arrangements as it relates to exits of certain investments whereby specific amounts of the proceeds are held in escrow in order to be used to satisfy potential obligations as stipulated in the sales agreements. We record escrow amounts in restricted cash on our accompanying Consolidated Statements of Assets and Liabilities. We establish a contingent liability against the escrow amounts if we determine that it is probable and estimable that a portion of the escrow amounts will not be ultimately received at the end of the escrow period. The aggregate contingent liability amount recorded against the escrow amounts was $0.5 million and $0 as of September 30, 2012 and 2011, respectively, and is recorded in other liabilities on our accompanying Consolidated Statements of Assets and Liabilities. Financial Commitments and Obligations We have lines of credit with certain of our portfolio companies that have not been fully drawn. Since these commitments have expiration dates and we expect many will never be fully drawn, the total commitment amounts do not necessarily represent future cash requirements. In addition to the lines of credit with portfolio companies, we, from time to time, have also extended certain guarantees on behalf of some of our portfolio companies during the normal course of business. In January 2012, we executed a guarantee for one of our Control investments, Viapack, to irrevocably and unconditionally guarantee payment and performance of Viapack’s obligations regarding purchase agreements and expenses to one of its vendors. This guarantee is for a maximum amount of $0.3 million and terminates within 30 days written notice not to extend further credit. As of September 30, 2012, we have not been required to make any payments on the guarantee and we consider its credit risk to be remote. As of September 30, 2011, we were not party to any signed guarantees. We estimated the fair value of our unused line of credit commitments, uncalled capital commitment and guarantee as of September 30, 2012 and 2011 to be minimal; and therefore, they are not recorded on our accompanying Consolidated Statements of Assets and Liabilities. The following table summarizes the dollar balances of our unused line of credit commitments, uncalled capital commitment and guarantee as of September 30, 2012 and 2011:
As of September 30, As of September 30, 2012 2011 Unused line of credit commitments $ 4,854 $ 12,990 Uncalled capital commitment — 800 Guarantee 300 —
Total $ 5,154 $ 13,790
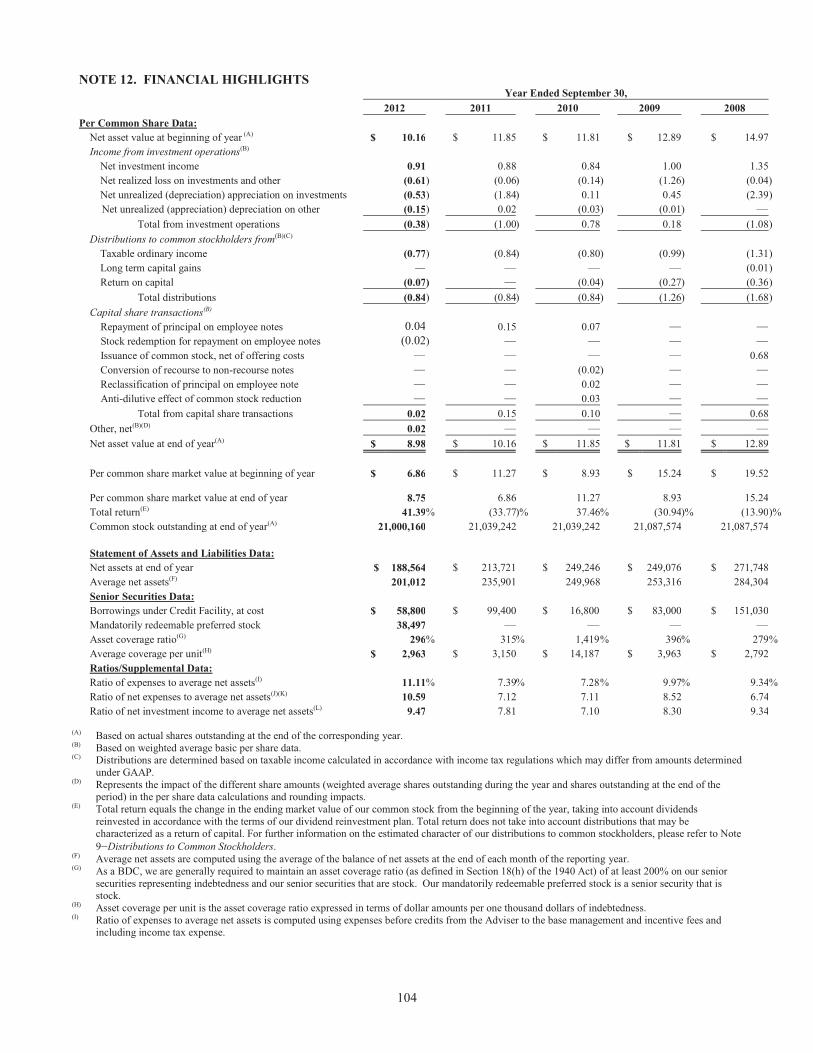
104
NOTE 12. FINANCIAL HIGHLIGHTS Year Ended September 30,
2012 2011 2010 2009 2008 Per Common Share Data:
Net asset value at beginning of year (A) $ 10.16 $ 11.85 $ 11.81 $ 12.89 $ 14.97 Income from investment operations(B)
Net investment income 0.91 0.88 0.84 1.00 1.35 Net realized loss on investments and other (0.61) (0.06) (0.14) (1.26 ) (0.04 ) Net unrealized (depreciation) appreciation on investments (0.53) (1.84) 0.11 0.45 (2.39 ) Net unrealized (appreciation) depreciation on other (0.15) 0.02 (0.03) (0.01 ) —
Total from investment operations (0.38) (1.00) 0.78 0.18 (1.08 ) Distributions to common stockholders from(B)(C)
Taxable ordinary income (0.77) (0.84) (0.80) (0.99 ) (1.31 ) Long term capital gains — — — — (0.01 ) Return on capital (0.07) — (0.04) (0.27 ) (0.36 )
Total distributions (0.84) (0.84) (0.84) (1.26 ) (1.68 ) Capital share transactions(B) Repayment of principal on employee notes 0.04 0.15 0.07 — — Stock redemption for repayment on employee notes (0.02) — — — — Issuance of common stock, net of offering costs — — — — 0.68 Conversion of recourse to non-recourse notes — — (0.02) — — Reclassification of principal on employee note — — 0.02 — — Anti-dilutive effect of common stock reduction — — 0.03 — —
Total from capital share transactions 0.02 0.15 0.10 — 0.68 Other, net(B)(D) 0.02 — — — — Net asset value at end of year(A) $ 8.98 $ 10.16 $ 11.85 $ 11.81 $ 12.89 Per common share market value at beginning of year $ 6.86 $ 11.27 $ 8.93 $ 15.24 $ 19.52
Per common share market value at end of year 8.75 6.86 11.27 8.93
15.24 Total return(E) 41.39% (33.77)% 37.46% (30.94)% (13.90 )% Common stock outstanding at end of year(A) 21,000,160 21,039,242 21,039,242 21,087,574 21,087,574 Statement of Assets and Liabilities Data: Net assets at end of year $ 188,564 $ 213,721 $ 249,246 $ 249,076 $ 271,748 Average net assets(F) 201,012 235,901 249,968 253,316 284,304 Senior Securities Data: Borrowings under Credit Facility, at cost $ 58,800 $ 99,400 $ 16,800 $ 83,000 $ 151,030 Mandatorily redeemable preferred stock 38,497 — — — — Asset coverage ratio(G) 296% 315% 1,419 % 396% 279 % Average coverage per unit(H) $ 2,963 $ 3,150 $ 14,187 $ 3,963 $ 2,792 Ratios/Supplemental Data: Ratio of expenses to average net assets(I) 11.11% 7.39% 7.28 % 9.97% 9.34% Ratio of net expenses to average net assets(J)(K) 10.59 7.12 7.11 8.52 6.74 Ratio of net investment income to average net assets(L) 9.47 7.81 7.10 8.30 9.34
(A) Based on actual shares outstanding at the end of the corresponding year. (B) Based on weighted average basic per share data. (C) Distributions are determined based on taxable income calculated in accordance with income tax regulations which may differ from amounts determined
under GAAP. (D) Represents the impact of the different share amounts (weighted average shares outstanding during the year and shares outstanding at the end of the
period) in the per share data calculations and rounding impacts. (E) Total return equals the change in the ending market value of our common stock from the beginning of the year, taking into account dividends
reinvested in accordance with the terms of our dividend reinvestment plan. Total return does not take into account distributions that may be characterized as a return of capital. For further information on the estimated character of our distributions to common stockholders, please refer to Note 9—Distributions to Common Stockholders.
(F) Average net assets are computed using the average of the balance of net assets at the end of each month of the reporting year. (G) As a BDC, we are generally required to maintain an asset coverage ratio (as defined in Section 18(h) of the 1940 Act) of at least 200% on our senior
securities representing indebtedness and our senior securities that are stock. Our mandatorily redeemable preferred stock is a senior security that is stock.
(H) Asset coverage per unit is the asset coverage ratio expressed in terms of dollar amounts per one thousand dollars of indebtedness. (I) Ratio of expenses to average net assets is computed using expenses before credits from the Adviser to the base management and incentive fees and
including income tax expense.
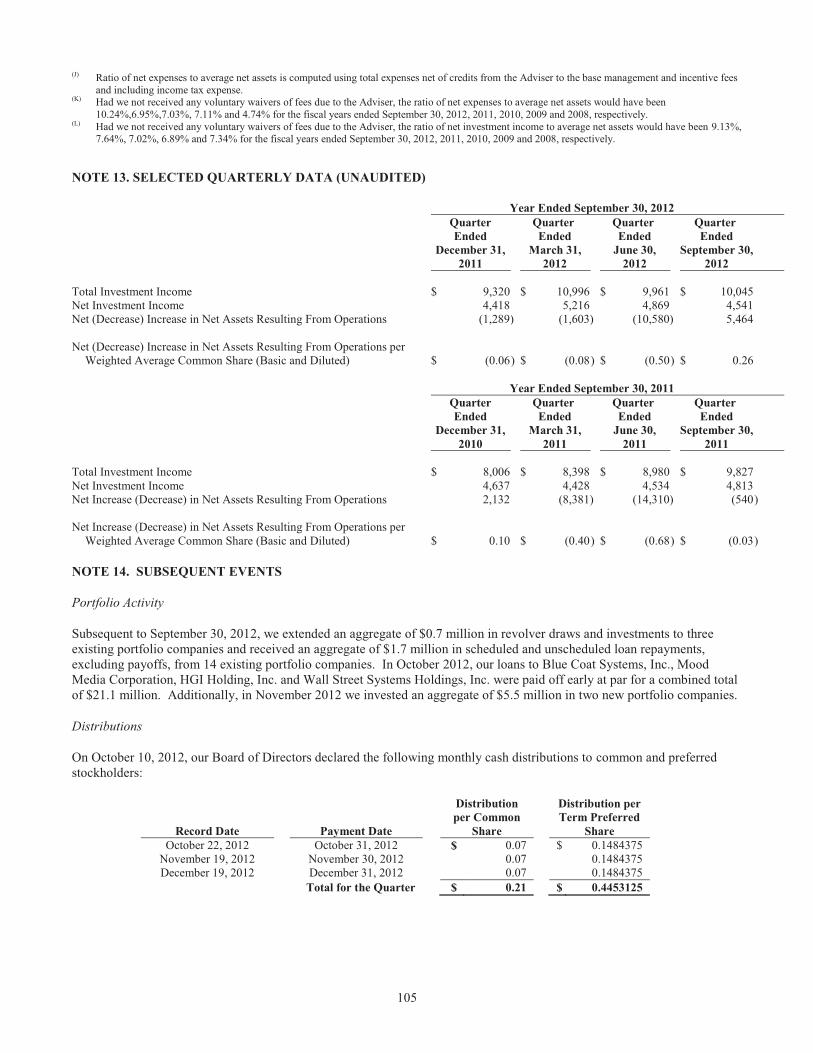
105
(J) Ratio of net expenses to average net assets is computed using total expenses net of credits from the Adviser to the base management and incentive fees and including income tax expense.
(K) Had we not received any voluntary waivers of fees due to the Adviser, the ratio of net expenses to average net assets would have been 10.24%,6.95%,7.03%, 7.11% and 4.74% for the fiscal years ended September 30, 2012, 2011, 2010, 2009 and 2008, respectively.
(L) Had we not received any voluntary waivers of fees due to the Adviser, the ratio of net investment income to average net assets would have been 9.13%, 7.64%, 7.02%, 6.89% and 7.34% for the fiscal years ended September 30, 2012, 2011, 2010, 2009 and 2008, respectively.
NOTE 13. SELECTED QUARTERLY DATA (UNAUDITED)
Year Ended September 30, 2012 Quarter
Ended December 31,
2011
Quarter Ended
March 31, 2012
Quarter Ended
June 30, 2012
Quarter Ended
September 30, 2012
Total Investment Income $ 9,320 $ 10,996 $ 9,961 $ 10,045 Net Investment Income 4,418 5,216 4,869 4,541 Net (Decrease) Increase in Net Assets Resulting From Operations (1,289 ) (1,603 ) (10,580 ) 5,464 Net (Decrease) Increase in Net Assets Resulting From Operations per
Weighted Average Common Share (Basic and Diluted) $ (0.06 ) $ (0.08 ) $ (0.50 ) $ 0.26 Year Ended September 30, 2011
Quarter Ended
December 31, 2010
Quarter Ended
March 31, 2011
Quarter Ended
June 30, 2011
Quarter Ended
September 30, 2011
Total Investment Income $ 8,006 $ 8,398 $ 8,980 $ 9,827 Net Investment Income 4,637 4,428 4,534 4,813 Net Increase (Decrease) in Net Assets Resulting From Operations 2,132 (8,381 ) (14,310 ) (540 ) Net Increase (Decrease) in Net Assets Resulting From Operations per
Weighted Average Common Share (Basic and Diluted) $ 0.10 $ (0.40 ) $ (0.68 ) $ (0.03 )
NOTE 14. SUBSEQUENT EVENTS
Portfolio Activity
Subsequent to September 30, 2012, we extended an aggregate of $0.7 million in revolver draws and investments to three existing portfolio companies and received an aggregate of $1.7 million in scheduled and unscheduled loan repayments, excluding payoffs, from 14 existing portfolio companies. In October 2012, our loans to Blue Coat Systems, Inc., Mood Media Corporation, HGI Holding, Inc. and Wall Street Systems Holdings, Inc. were paid off early at par for a combined total of $21.1 million. Additionally, in November 2012 we invested an aggregate of $5.5 million in two new portfolio companies.
Distributions
On October 10, 2012, our Board of Directors declared the following monthly cash distributions to common and preferred stockholders:
Record Date
Payment Date
Distribution per Common
Share
Distribution per Term Preferred
Share October 22, 2012 October 31, 2012 $ 0.07 $ 0.1484375
November 19, 2012 November 30, 2012 0.07 0.1484375 December 19, 2012 December 31, 2012 0.07 0.1484375
Total for the Quarter $ 0.21 $ 0.4453125
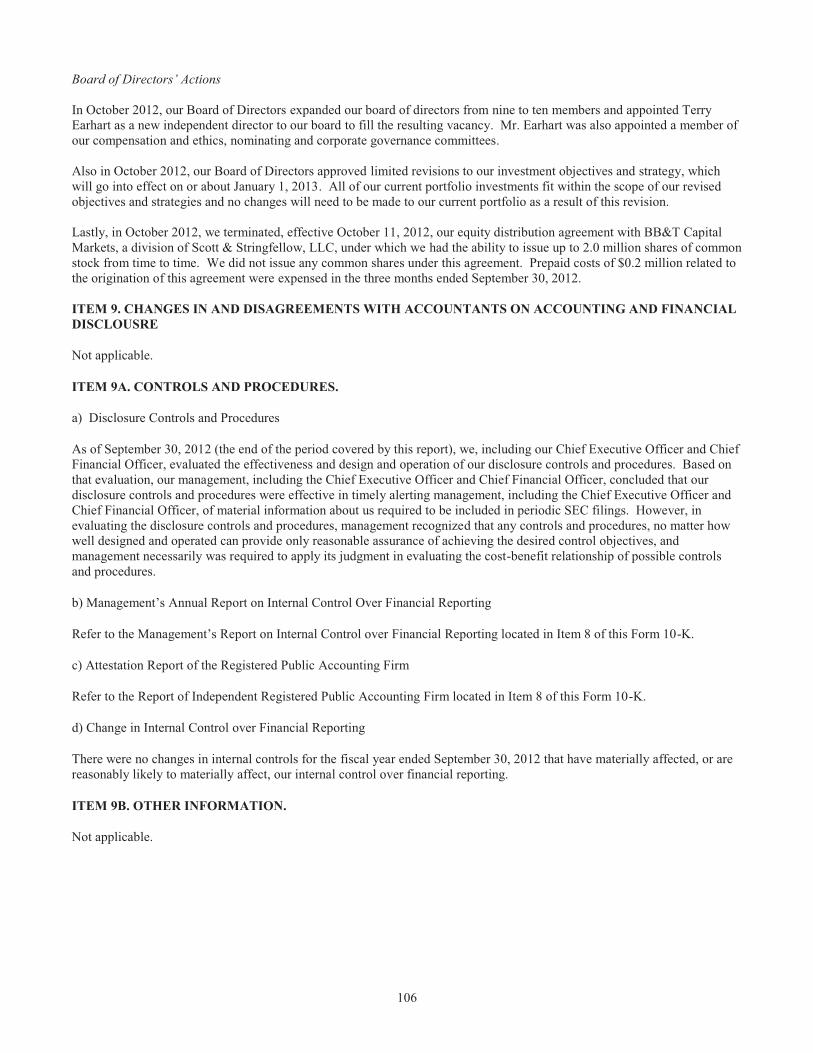
106
Board of Directors’ Actions In October 2012, our Board of Directors expanded our board of directors from nine to ten members and appointed Terry Earhart as a new independent director to our board to fill the resulting vacancy. Mr. Earhart was also appointed a member of our compensation and ethics, nominating and corporate governance committees. Also in October 2012, our Board of Directors approved limited revisions to our investment objectives and strategy, which will go into effect on or about January 1, 2013. All of our current portfolio investments fit within the scope of our revised objectives and strategies and no changes will need to be made to our current portfolio as a result of this revision. Lastly, in October 2012, we terminated, effective October 11, 2012, our equity distribution agreement with BB&T Capital Markets, a division of Scott & Stringfellow, LLC, under which we had the ability to issue up to 2.0 million shares of common stock from time to time. We did not issue any common shares under this agreement. Prepaid costs of $0.2 million related to the origination of this agreement were expensed in the three months ended September 30, 2012. ITEM 9. CHANGES IN AND DISAGREEMENTS WITH ACCOUNTANTS ON ACCOUNTING AND FINANCIAL DISCLOUSRE
Not applicable.
ITEM 9A. CONTROLS AND PROCEDURES.
a) Disclosure Controls and Procedures
As of September 30, 2012 (the end of the period covered by this report), we, including our Chief Executive Officer and Chief Financial Officer, evaluated the effectiveness and design and operation of our disclosure controls and procedures. Based on that evaluation, our management, including the Chief Executive Officer and Chief Financial Officer, concluded that our disclosure controls and procedures were effective in timely alerting management, including the Chief Executive Officer and Chief Financial Officer, of material information about us required to be included in periodic SEC filings. However, in evaluating the disclosure controls and procedures, management recognized that any controls and procedures, no matter how well designed and operated can provide only reasonable assurance of achieving the desired control objectives, and management necessarily was required to apply its judgment in evaluating the cost-benefit relationship of possible controls and procedures.
b) Management’s Annual Report on Internal Control Over Financial Reporting
Refer to the Management’s Report on Internal Control over Financial Reporting located in Item 8 of this Form 10-K.
c) Attestation Report of the Registered Public Accounting Firm
Refer to the Report of Independent Registered Public Accounting Firm located in Item 8 of this Form 10-K.
d) Change in Internal Control over Financial Reporting
There were no changes in internal controls for the fiscal year ended September 30, 2012 that have materially affected, or are reasonably likely to materially affect, our internal control over financial reporting.
ITEM 9B. OTHER INFORMATION.
Not applicable.

107
PART III
We will file a definitive Proxy Statement for our 2013 Annual Meeting of Stockholders (the “2013 Proxy Statement”) with the SEC, pursuant to Regulation 14A, not later than 120 days after the end of our fiscal year. Accordingly, certain information required by Part III has been omitted under General Instruction G(3) to Form 10-K. Only those sections of the 2013 Proxy Statement that specifically address the items set forth herein are incorporated by reference.
ITEM 10. DIRECTORS, EXECUTIVE OFFICERS AND CORPORATE GOVERNANCE
The information required by Item 10 is hereby incorporated by reference from our 2013 Proxy Statement under the captions “Election of Directors” and “Section 16(a) Beneficial Ownership Reporting Compliance.”
ITEM 11. EXECUTIVE COMPENSATION
The information required by Item 11 is hereby incorporated by reference from our 2013 Proxy Statement under the captions “Executive Compensation” and “Director Compensation.”
ITEM 12. SECURITY OWNERSHIP OF CERTAIN BENEFICIAL OWNERS AND MANAGEMENT AND RELATED STOCKHOLDER MATTERS
The information required by Item 12 is hereby incorporated by reference from our 2013 Proxy Statement under the caption “Security Ownership of Certain Beneficial Owners and Management.”
ITEM 13. CERTAIN RELATIONSHIPS AND RELATED TRANSACTION AND DIRECTOR INDEPENDENCE
The information required by Item 13 is hereby incorporated by reference from our 2013 Proxy Statement under the captions “Certain Transactions” and “Director Independence.”
ITEM 14. PRINCIPAL ACCOUNTANT FEES AND SERVICES.
The information required by Item 14 is hereby incorporated by reference from our 2013 Proxy Statement under the caption “Independent Registered Public Accounting Firm Fees.”
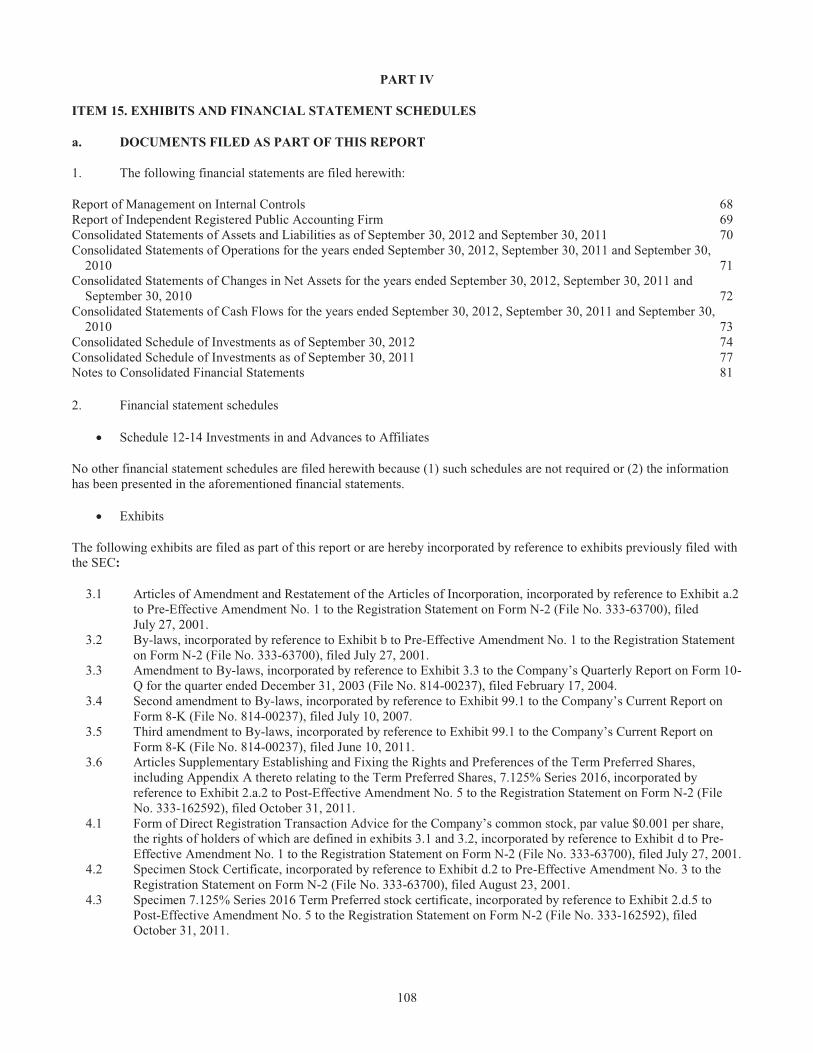
108
PART IV
ITEM 15. EXHIBITS AND FINANCIAL STATEMENT SCHEDULES
a. DOCUMENTS FILED AS PART OF THIS REPORT
1. The following financial statements are filed herewith:
Report of Management on Internal Controls 68 Report of Independent Registered Public Accounting Firm 69 Consolidated Statements of Assets and Liabilities as of September 30, 2012 and September 30, 2011 70 Consolidated Statements of Operations for the years ended September 30, 2012, September 30, 2011 and September 30,
2010 71 Consolidated Statements of Changes in Net Assets for the years ended September 30, 2012, September 30, 2011 and
September 30, 2010 72 Consolidated Statements of Cash Flows for the years ended September 30, 2012, September 30, 2011 and September 30,
2010 73 Consolidated Schedule of Investments as of September 30, 2012 74 Consolidated Schedule of Investments as of September 30, 2011 77 Notes to Consolidated Financial Statements 81
2. Financial statement schedules
� Schedule 12-14 Investments in and Advances to Affiliates
No other financial statement schedules are filed herewith because (1) such schedules are not required or (2) the information has been presented in the aforementioned financial statements.
� Exhibits
The following exhibits are filed as part of this report or are hereby incorporated by reference to exhibits previously filed with the SEC:
3.1 Articles of Amendment and Restatement of the Articles of Incorporation, incorporated by reference to Exhibit a.2 to Pre-Effective Amendment No. 1 to the Registration Statement on Form N-2 (File No. 333-63700), filed July 27, 2001.
3.2 By-laws, incorporated by reference to Exhibit b to Pre-Effective Amendment No. 1 to the Registration Statement on Form N-2 (File No. 333-63700), filed July 27, 2001.
3.3 Amendment to By-laws, incorporated by reference to Exhibit 3.3 to the Company’s Quarterly Report on Form 10-Q for the quarter ended December 31, 2003 (File No. 814-00237), filed February 17, 2004.
3.4 Second amendment to By-laws, incorporated by reference to Exhibit 99.1 to the Company’s Current Report on Form 8-K (File No. 814-00237), filed July 10, 2007.
3.5 Third amendment to By-laws, incorporated by reference to Exhibit 99.1 to the Company’s Current Report on Form 8-K (File No. 814-00237), filed June 10, 2011.
3.6 Articles Supplementary Establishing and Fixing the Rights and Preferences of the Term Preferred Shares, including Appendix A thereto relating to the Term Preferred Shares, 7.125% Series 2016, incorporated by reference to Exhibit 2.a.2 to Post-Effective Amendment No. 5 to the Registration Statement on Form N-2 (File No. 333-162592), filed October 31, 2011.
4.1 Form of Direct Registration Transaction Advice for the Company’s common stock, par value $0.001 per share, the rights of holders of which are defined in exhibits 3.1 and 3.2, incorporated by reference to Exhibit d to Pre-Effective Amendment No. 1 to the Registration Statement on Form N-2 (File No. 333-63700), filed July 27, 2001.
4.2 Specimen Stock Certificate, incorporated by reference to Exhibit d.2 to Pre-Effective Amendment No. 3 to the Registration Statement on Form N-2 (File No. 333-63700), filed August 23, 2001.
4.3 Specimen 7.125% Series 2016 Term Preferred stock certificate, incorporated by reference to Exhibit 2.d.5 to Post-Effective Amendment No. 5 to the Registration Statement on Form N-2 (File No. 333-162592), filed October 31, 2011.
109
10.1 Promissory Note of David Gladstone in favor of the Company, dated August 23, 2001, incorporated by reference to Exhibit 10.4 to the Company’s Quarterly Report on Form 10-Q for the period ended June 30, 2001, filed October 4, 2001.
10.2 Custodian Agreement between Gladstone Capital Corporation and The Bank of New York, dated as of May 5, 2006, incorporated by reference to Exhibit 10.3 to the Company’s Quarterly Report on Form 10-Q for the quarter ended June 30, 2006 (File No. 814-00237), filed August 1, 2006.
10.3* Amended and Restated Investment Advisory and Management Agreement between Gladstone Capital Corporation and Gladstone Management Corporation, dated as of October 1, 2006 incorporated by reference to Exhibit 99.1 to the Company’s Current Report on Form 8-K (File No. 814-00237), filed on October 5, 2006 (renewed on July 10, 2012).
10.4* Administration Agreement between Gladstone Capital Corporation and Gladstone Administration, LLC, dated as of October 1, 2006 incorporated by reference to Exhibit 99.1 to the Company’s Current Report on Form 8-K (File No. 814-00237), filed on October 5, 2006 (renewed on July 10, 2012).
10.5 Fourth Amended and Restated Credit Agreement dated as of March 15, 2010 by and among Gladstone Business Loan, LLC as Borrower, Gladstone Management Corporation as Servicer, the Committed Lenders named therein, the Managing Agents named therein, and Key Equipment Finance Inc. as Administrative Agent, incorporated by reference to Exhibit 10.1 to the Company’s Current Report on Form 8-K (File No. 814-00237), filed March 16, 2010.
10.6 Amendment No. 1 to Fourth Amended and Restated Credit Agreement dated as of November 22, 2010 by and among Gladstone Business Loan, LLC as Borrower, Gladstone Management Corporation as Servicer, the Committed Lenders named therein, the Managing Agents named therein, and Key Equipment Finance Inc. as Administrative Agent, incorporated by reference to Exhibit 10.8 to the Company’s Annual Report on Form 10-K for the year ended September 30, 2010 (File No. 814-00237), filed November 22, 2010.
10.7 Consent and Acknowledgement to Increase No. 1 under Fourth Amended and Restated Credit Agreement, dated as of August 9, 2011 by and among Gladstone Business Loan, LLC as Borrower, Gladstone Management Corporation as Servicer, the Committed Lenders named therein, the Managing Agents named therein, and Key Equipment Finance Inc. as Administrative Agent, incorporated by reference to Exhibit 10.1 to the Company’s current Report on Form 8-K (File No. 814-00237), filed August 20, 2011.
10.8 Amendment No. 3 to Fourth Amended and Restated Credit Agreement, dated as of January 19, 2012 by and among Gladstone Business Loan, LLC as Borrower, Gladstone Management Corporation as Servicer, the Committed Lenders named therein, the Managing Agents named therein, and Key Equipment Finance Inc. as Administrative Agent, incorporated by reference to Exhibit 10.1 to the Company’s Current Report on Form 8-K (file No. 814-00237), filed January 24, 2012.
10.9 Equity Distribution Agreement, dated as of May 17, 2010, by and among Gladstone Capital Corporation, Gladstone Management Corporation and BB&T Capital Markets, a division of Scott & Stringfellow, LLC, incorporated by reference to Exhibit 2.h.1 to Post-Effective Amendment No. 1 to the Registration Statement on Form N-2 (File No. 333-162592), filed on May 17, 2010.
10.10 Redemption Agreement, dated as of September 7, 2010, between Gladstone Capital Corporation and David Gladstone, incorporated by reference to Exhibit 10.10 to the Company’s Annual Report on Form 10-K for the year ended September 30, 2010 (File No. 814-00237), filed November 22, 2010.
11 Computation of Per Share Earnings (included in the notes to the audited financial statements contained in this report).
21 Subsidiaries of the Registrant. 23 Consent of PricewaterhouseCoopers LLP.
31.1 Certification of Chief Executive Officer pursuant to section 302 of The Sarbanes-Oxley Act of 2002. 31.2 Certification of Chief Financial Officer pursuant to section 302 of The Sarbanes-Oxley Act of 2002. 32.1 Certification of Chief Executive Officer pursuant to section 906 of The Sarbanes-Oxley Act of 2002. 32.2 Certification of Chief Financial Officer pursuant to section 906 of The Sarbanes-Oxley Act of 2002.
* Denotes management contract or compensatory plan or arrangement.
110
SIGNATURES Pursuant to the requirements of Section 13 or 15(d) of the Securities Exchange Act of 1934, the registrant has duly caused this report to be signed on its behalf by the undersigned, thereunto duly authorized.
GLADSTONE CAPITAL CORPORATION Date: November 13, 2012 By: /s/ DAVID WATSON David Watson Chief Financial Officer and Treasurer
Pursuant to the requirements of the Securities Exchange Act of 1934, this report has been signed below by the following persons on behalf of the registrant and in the capacity and on the dates indicated.
Date: November 13, 2012 By: /s/ DAVID GLADSTONE David Gladstone Chief Executive Officer and Chairman of the Board of Directors
(principal executive officer) Date: November 13, 2012 By: /s/ TERRY LEE BRUBAKER Terry Lee Brubaker Vice Chairman, Chief Operating Officer and Director Date: November 13, 2012 By: /s/ GEORGE STELLJES III George Stelljes III President, Chief Investment Officer and Director Date: November 13, 2012 By: /s/ DAVID A.R. DULLUM David A.R. Dullum Executive Vice President and Director Date: November 13, 2012 By: /s/ DAVID WATSON David Watson Chief Financial Officer and Treasurer (principal financial and
accounting officer) Date: November 13, 2012 By: /s/ ANTHONY W. PARKER Anthony W. Parker Director Date: November 13, 2012 By: /s/ MICHELA A. ENGLISH Michela A. English Director Date: November 13, 2012 By: /s/ PAUL ADELGREN Paul Adelgren Director Date: November 13, 2012 By: /s/ JOHN OUTLAND John Outland Director Date: November 13, 2012 By: /s/ JACK REILLY Jack Reilly Director Date: November 13, 2012 By: /s/ TERRY EARHART Terry Earhart Director
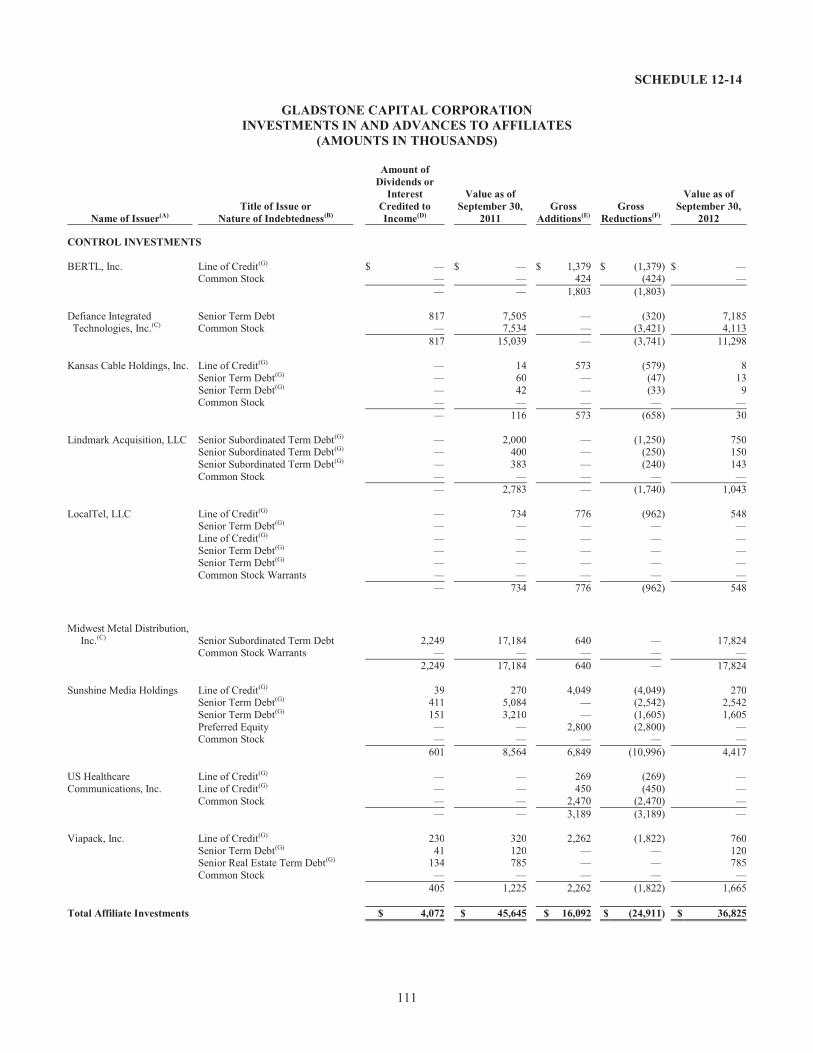
111
SCHEDULE 12-14
GLADSTONE CAPITAL CORPORATION INVESTMENTS IN AND ADVANCES TO AFFILIATES
(AMOUNTS IN THOUSANDS)
Name of Issuer(A) Title of Issue or
Nature of Indebtedness(B)
Amount of Dividends or
Interest Credited to Income(D)
Value as of September 30,
2011 Gross
Additions(E) Gross
Reductions(F)
Value as of September 30,
2012 CONTROL INVESTMENTS BERTL, Inc. Line of Credit(G) $ — $ — $ 1,379 $ (1,379 ) $ — Common Stock — — 424 (424 ) — — — 1,803 (1,803 ) Defiance Integrated Senior Term Debt 817 7,505 — (320 ) 7,185 Technologies, Inc.(C) Common Stock — 7,534 — (3,421 ) 4,113 817 15,039 — (3,741 ) 11,298 Kansas Cable Holdings, Inc. Line of Credit(G) — 14 573 (579 ) 8 Senior Term Debt(G) — 60 — (47 ) 13 Senior Term Debt(G) — 42 — (33 ) 9 Common Stock — — — — — — 116 573 (658 ) 30 Lindmark Acquisition, LLC Senior Subordinated Term Debt(G) — 2,000 — (1,250 ) 750 Senior Subordinated Term Debt(G) — 400 — (250 ) 150 Senior Subordinated Term Debt(G) — 383 — (240 ) 143 Common Stock — — — — — — 2,783 — (1,740 ) 1,043 LocalTel, LLC Line of Credit(G) — 734 776 (962 ) 548 Senior Term Debt(G) — — — — — Line of Credit(G) — — — — —
Senior Term Debt(G) — — — — — Senior Term Debt(G) — — — — —
Common Stock Warrants — — — — —
—
734
776
(962 ) 548
Midwest Metal Distribution,
Inc.(C) Senior Subordinated Term Debt
2,249 17,184 640 — 17,824 Common Stock Warrants — — — — — 2,249 17,184 640 — 17,824 Sunshine Media Holdings Line of Credit(G) 39 270 4,049 (4,049 ) 270 Senior Term Debt(G) 411 5,084 — (2,542 ) 2,542 Senior Term Debt(G) 151 3,210 — (1,605 ) 1,605 Preferred Equity — — 2,800 (2,800 ) — Common Stock — — — — — 601 8,564 6,849 (10,996 ) 4,417 US Healthcare Line of Credit(G) — — 269 (269 ) — Communications, Inc. Line of Credit(G) — — 450 (450 ) — Common Stock — — 2,470 (2,470 ) — — — 3,189 (3,189 ) — Viapack, Inc. Line of Credit(G) 230 320 2,262 (1,822 ) 760 Senior Term Debt(G) 41 120 — — 120 Senior Real Estate Term Debt(G) 134 785 — — 785 Common Stock — — — — — 405 1,225 2,262 (1,822 ) 1,665 Total Affiliate Investments $ 4,072 $ 45,645 $ 16,092 $ (24,911 ) $ 36,825

112
(A) Certain of the listed securities are issued by affiliates(s) of the indicated portfolio company. (B) Common stock, warrants, options and, in some cases, preferred stock are generally non-income producing and restricted. The principal amount
of debt and the number of shares of common stock and preferred stock are shown in the Consolidated Schedules of Investments as of September 30, 2012 and 2011.
(C) Some of the securities in this portfolio company are pledged as collateral to our Credit Facility. (D) Represents the total amount of interest or dividends credited to income for the portion of the year an investment was a control investment. (E) Gross additions include increases in investments resulting from new portfolio investments, paid-in-kind interest or dividends, the amortization of
discounts and fees and the exchange of one or more existing securities for one or more new securities. Gross additions also include net increases in unrealized appreciation or decreases in unrealized depreciation.
(F) Gross reductions include decreases in investments resulting from principal collections related to investment repayments or sales, the amortization of premiums and acquisition costs and the exchange of one or more existing securities for one or more new securities. Gross reductions also include net increases in unrealized depreciation or decreases in unrealized appreciation.
(G) Debt security is on non-accrual status and, therefore, is considered non-income producing. ** Information related to the amount of equity in the net profit and loss for the period for the investments listed has not been included in this
schedule. This information is not considered to be meaningful due to the complex capital structures of the portfolio companies, with different classes of equity securities outstanding with different preferences in liquidation. These investments are not consolidated, nor are they accounted for under the equity method of accounting.

113
Exhibit 21
SUBSIDIARIES OF THE REGISTRANT
Gladstone Capital Advisers, Inc. (incorporated in Delaware) Gladstone Business Loan, LLC (organized in Delaware) Gladstone Financial Corporation (incorporated in Delaware) Defiance Integrated Technologies, Inc. (incorporated in Delaware) Georgia Film Holdings, LLC (organized in Delaware) Gladstone Metal, LLC (organized in Delaware) Kansas Cable Holdings, Inc. (incorporated in Delaware) Lindmark Holdings Corp. (incorporated in Delaware) LYP Holdings Corp. (incorporated in Delaware) Sunshine Media Group, Inc. (incorporated in Delaware)

114
Exhibit 23
CONSENT OF INDEPENDENT REGISTERED PUBLIC ACCOUNTING FIRM
We hereby consent to the incorporation by reference in the Registration Statement on Form S-8 (File No. 333-104447) of Gladstone Capital Corporation of our report dated November 12, 2012 relating to the financial statements, financial statement schedule, and the effectiveness of internal control over financial reporting, which appears in this Form 10-K. /s/ PricewaterhouseCoopers LLP Philadelphia, PA November 13, 2012

115
Exhibit 31.1 CERTIFICATION
Pursuant to Section 302 of The Sarbanes-Oxley Act of 2002 I, David Gladstone, certify that: 1. I have reviewed this annual report on Form 10-K of Gladstone Capital Corporation; 2. Based on my knowledge, this report does not contain any untrue statement of a material fact or omit to state a
material fact necessary to make the statements made, in light of the circumstances under which such statements were made, not misleading with respect to the period covered by this report;
3. Based on my knowledge, the financial statements, and other financial information included in this report, fairly
present in all material respects the financial condition, results of operations and cash flows of the registrant as of, and for, the periods presented in this report;
4. The registrant’s other certifying officer(s) and I are responsible for establishing and maintaining disclosure
controls and procedures (as defined in Exchange Act Rules 13a-15(e) and 15d-15(e)) and internal control over financial reporting (as defined in Exchange Act Rules 13a–15(f) and 15d–15(f)) for the registrant and have:
a) Designed such disclosure controls and procedures, or caused such disclosure controls and procedures to be
designed under our supervision, to ensure that material information relating to the registrant, including its consolidated subsidiaries, is made known to us by others within those entities, particularly during the period in which this report is being prepared;
b) Designed such internal control over financial reporting, or caused such internal control over financial reporting to
be designed under our supervision, to provide reasonable assurance regarding the reliability of financial reporting and the preparation of financial statements for external purposes in accordance with generally accepted accounting principles;
c) Evaluated the effectiveness of the registrant’s disclosure controls and procedures and presented in this report our conclusions about the effectiveness of the disclosure controls and procedures, as of the end of the period covered by this report based on such evaluation; and
d) Disclosed in this report any changes in the registrant’s internal control over financial reporting that occurred
during the registrant’s most recent fiscal quarter (the registrant’s fourth fiscal quarter in the case of an annual report) that has materially affected, or is reasonably likely to materially affect, the registrant’s internal control over financial reporting; and
5. The registrant’s other certifying officer(s) and I have disclosed, based on our most recent evaluation of internal
control over financial reporting, to the registrant’s auditors and the audit committee of registrant’s board of directors (or persons performing the equivalent functions):
a) All significant deficiencies and material weaknesses in the design or operation of internal control over financial
reporting which are reasonably likely to adversely affect the registrant’s ability to record, process, summarize and report financial information; and
b) Any fraud, whether or not material, that involves management or other employees who have a significant role in
the registrant’s internal control over financial reporting.
Date: November 13, 2012
/s/ DAVID GLADSTONE David Gladstone Chief Executive Officer

116
Exhibit 31.2 CERTIFICATION
Pursuant to Section 302 of The Sarbanes-Oxley Act of 2002 I, David Watson, certify that: 1. I have reviewed this annual report on Form 10-K of Gladstone Capital Corporation; 2. Based on my knowledge, this report does not contain any untrue statement of a material fact or omit to state a
material fact necessary to make the statements made, in light of the circumstances under which such statements were made, not misleading with respect to the period covered by this report;
3. Based on my knowledge, the financial statements, and other financial information included in this report, fairly
present in all material respects the financial condition, results of operations and cash flows of the registrant as of, and for, the periods presented in this report;
4. The registrant’s other certifying officer(s) and I are responsible for establishing and maintaining disclosure
controls and procedures (as defined in Exchange Act Rules 13a-15(e) and 15d-15(e)) and internal control over financial reporting (as defined in Exchange Act Rules 13a–15(f) and 15d–15(f)) for the registrant and have:
a) Designed such disclosure controls and procedures, or caused such disclosure controls and procedures to be
designed under our supervision, to ensure that material information relating to the registrant, including its consolidated subsidiaries, is made known to us by others within those entities, particularly during the period in which this report is being prepared;
b) Designed such internal control over financial reporting, or caused such internal control over financial reporting to
be designed under our supervision, to provide reasonable assurance regarding the reliability of financial reporting and the preparation of financial statements for external purposes in accordance with generally accepted accounting principles;
c) Evaluated the effectiveness of the registrant’s disclosure controls and procedures and presented in this report our conclusions about the effectiveness of the disclosure controls and procedures, as of the end of the period covered by this report based on such evaluation; and
d) Disclosed in this report any changes in the registrant’s internal control over financial reporting that occurred
during the registrant’s most recent fiscal quarter (the registrant’s fourth fiscal quarter in the case of an annual report) that has materially affected, or is reasonably likely to materially affect, the registrant’s internal control over financial reporting; and
5. The registrant’s other certifying officer(s) and I have disclosed, based on our most recent evaluation of internal
control over financial reporting, to the registrant’s auditors and the audit committee of registrant’s board of directors (or persons performing the equivalent functions):
a) All significant deficiencies and material weaknesses in the design or operation of internal control over financial
reporting which are reasonably likely to adversely affect the registrant’s ability to record, process, summarize and report financial information; and
b) Any fraud, whether or not material, that involves management or other employees who have a significant role in
the registrant’s internal control over financial reporting.
Date: November 13, 2012
/s/ DAVID WATSON David Watson Chief Financial Officer and Treasurer

117
Exhibit 32.1
CERTIFICATION PURSUANT TO 18 U.S.C. SECTION 1350, AS ADOPTED PURSUANT TO
SECTION 906 OF THE SARBANES-OXLEY ACT OF 2002 The undersigned, the Chief Executive Officer and Chairman of the Board of Gladstone Capital Corporation (the “Company”), hereby certifies on the date hereof, pursuant to 18 U.S.C. §1350(a), as adopted pursuant to Section 906 of The Sarbanes-Oxley Act of 2002, that the Annual Report on Form 10-K for the fiscal year ended September 30, 2012 (the “Form 10-K”), filed concurrently herewith by the Company, fully complies with the requirements of Section 13(a) or Section 15(d) of the Securities Exchange Act of 1934, as amended, and that the information contained in the Form 10-K fairly presents, in all material respects, the financial condition and results of operations of the Company. Dated: November 13, 2012 /s/ DAVID GLADSTONE David Gladstone Chief Executive Officer
118
Exhibit 32.2
CERTIFICATION PURSUANT TO 18 U.S.C. SECTION 1350, AS ADOPTED PURSUANT TO
SECTION 906 OF THE SARBANES-OXLEY ACT OF 2002 The undersigned, the Chief Financial Officer and Treasurer of Gladstone Capital Corporation (the “Company”), hereby certifies on the date hereof, pursuant to 18 U.S.C. §1350(a), as adopted pursuant to Section 906 of The Sarbanes-Oxley Act of 2002, that the Annual Report on Form 10-K for the fiscal year ended September 30, 2012 (the “Form 10-K”), filed concurrently herewith by the Company, fully complies with the requirements of Section 13(a) or Section 15(d) of the Securities Exchange Act of 1934, as amended, and that the information contained in the Form 10-K fairly presents, in all material respects, the financial condition and results of operations of the Company. Dated: November 13, 2012
/s/ DAVID WATSON David Watson Chief Financial Officer and Treasurer

Corporate Information
Board of Directors
David GladstoneChairman of the Board and Chief Executive Officer
Terry L. BrubakerVice Chairman of the Board and Chief Operating Officer
George “Chip” Stelljes IIIPresident and Chief Investment Officer
David A. R. DullumExecutive Vice President
Paul AdelgrenPastor of Missionary Alliance Church
Michela A. EnglishPresident and CEO of Fight for Children
John H. OutlandPrivate Investor
Anthony W. ParkerFounder and Chairman of Parker Tide Corp.
Jack ReillyPresident of Reilly Investment Corporation
Terry EarhartExecutive Vice President of Strategic Global Services Network
Other Officers
David WatsonChief Financial Officer and Treasurer
Melissa MorrisonChief Accounting Officer
Jack DellafioraChief Compliance Officer
Michael LiCalsiInternal Counsel and Secretary
Management Team MembersArthur S. “Buzz” CooperManaging Director
Chris DanielManaging Director
John FrealManaging Director
Laura GladstoneManaging Director
Lud KimbroughManaging Director
Chris MasseyManaging Director
David MeierManaging Director
Robert PierceManaging Director
John SateriManaging Director
Jennifer SimpsonManaging Director
Stock Exchange ListingThe common stock of the company trades on the Nasdaq Global select Market under the symbol GLad. The preferred stock of the company trades on the Nasdaq Global select Market under the symbol GLadP.
Transfer AgentComputershare shareowner services LLC480 Washington Boulevard Jersey City, NJ 07310-2053
Stockholder InquiriesWebsite: www.bnymellon.com/ shareowner/equityaccessToll Free dedicated Number: 1-866-214-7543Foreign stockholders: 1-201-680-6578Tdd Hearing Impaired: 1-800-231-5469Tdd Foreign stockholders: 1-201-680-6610
Financial Informationstockholders may receive a copy of the company’s annual Report on Form 10-K and quarterly Reports on Form 10-q by contacting the company or going to the company’s website at www.GladstoneCapital.com, the sEC’s website at www.sEC.gov or by visiting the sEC at 100 F street NE, Washington, dC 20549.
Independent Registered Public Accounting FirmPricewaterhouseCoopers LLP
Legal CounselCooley LLP K&L Gates LLP
Company Websitewww.GladstoneCapital.com
This 2012 annual Report contains forward-looking statements. such forward-looking statements can generally be identified by our use of forward-looking terminology such as “may,” “will,” “expect,” “intend,” “anticipate,” “estimate,” “believe,” “continue,” “goal,” or other similar words. Readers of this 2012 annual Report should be aware that there are various factors that could cause actual results to differ materially from any forward-looking statements made in this report. Factors that could cause or contribute to such differences include, but are not limited to, changes in gen-eral economic and business conditions, industry trends, changes in government rules and regulations (including changes in tax laws) and environmental rules and regulations. accordingly, readers are cautioned not to place undue reliance on these forward-looking statements, which speak only as of the date of this 2012 annual Report.
Ann
ual R
epor
t Des
ign
by C
urra
n &
Con
nors
, Inc
. / w
ww
.cur
ran-
conn
ors.
com
GLADSTONE
GLADSTONE CAPITAL
GLADSTONE COMMERCIAL
GLADSTONE INVESTMENT
GLADSTONE MANAGEMENTTHE GLADSTONE COMPANIES
GLADSTONE ADMINISTRATION
JacobyOffice mascot and official greeter at the McLean, VA headquarters.

GLADSTONE
GLADSTONE CAPITAL
GLADSTONE COMMERCIAL
GLADSTONE INVESTMENT
GLADSTONE MANAGEMENTTHE GLADSTONE COMPANIES
GLADSTONE ADMINISTRATION
Gladstone Capital Corporation1521 Westbranch driveMclean, Va 22102
telephone: 703-287-5800Fax: 703-287-5801eMail: [email protected]: www.GladstoneCapital.com