glaxosmithkline pakistan limited first quarter report 2014 · standard chartered bank (pakistan)...
TRANSCRIPT

First Quarter Report 2014GlaxoSmithKline Pakistan Limited

CorporateInformation

Management CommitteeMr. M. Salman BurneyChairman / Chief Executive
Mr. Shahid Mustafa QureshiExecutive Director / Company Secretary
Mr. Yahya ZakariaDirector Finance
Mr. Sohail MatinCountry Manager - ConsumerHealthcare
Ms. Pouruchisty SidhwaDirector Human Resources
Dr. Khawar Saeed KhanDirector Medical Affairs
Dr. Naved Masoom AliBusiness Unit Head
Mr. Khalid Mehmood SethiBusiness Unit Head
Company SecretaryMr. Shahid Mustafa Qureshi
Chief Financial Offi cerMr. Yahya Zakaria
Chief Internal AuditorMs. Ayesha Muharram
BankersCitibank NA
Standard Chartered Bank(Pakistan) Limited
HSBC Bank Middle East Limited
Habib Bank Limited
Deutsche Bank A.G.
Barclays Bank PLC Pakistan
Auditors
A. F. Ferguson & Co.Chartered Accountants
Legal AdvisorsRizvi, Isa, Afridi & AngellMandviwalla & ZafarOrr, Dignam & Co.Surridge & BeechenoVellani & Vellani
Registered Offi ce35 - Dockyard Road, West Wharf,Karachi - 74000.Tel: 92-21-111-475-725 (111-GSK-PAK)Fax: 92-21-32314898, 32311122Website: www.gsk.com.pk
Board of Directors Mr. M. Salman BurneyChairman / Chief Executive
Mr. Rafi que DawoodNon-Executive Director
Mr. Husain LawaiNon-Executive Director
Mr. Mehmood MandviwallaNon-Executive Director
Mr. Dave CooperNon-Executive Director
Ms. Fariha SalahuddinNon-Executive Director
Ms. Erum S. RahimNon-Executive Director
Mr. Maqbool ur RehmanNon-Executive Director
Mr. Shahid Mustafa QureshiExecutive Director / Company Secretary
Mr. Yahya ZakariaDirector Finance
Audit Committee
Mr. Rafi que DawoodChairman
Mr. Husain LawaiMember
Mr. Mehmood MandviwallaMember
Human Resource & Remuneration CommitteeMr. Husain LawaiChairman
Mr. Rafi que DawoodMember
Mr. Mehmood MandviwallaMember
Mr. M. Salman BurneyMember
Ms. Fariha SalahuddinMember
1First Quarter Report 2014

Chairman/ChiefExecutive Review
I am pleased to present the un-audited financial information of your Company for the period ended March 31, 2014. This financial information is submitted in accordance with Section 245 of the Companies Ordinance, 1984.
Review of Operating ResultsYour Company continued to deliver strong performance in the period under review despite challenging regulatory, economic and security environment for businesses operating in the country. Net sales for the quarter were recorded at Rs 7,143 million, an increase of Rs 791 million (12.5%) over the corresponding period last year. The pharma business grew by 13.2% driven mainly by portfolios such as Antibiotics, Dermatologicals, Anthelmentics, Anti Virals, Anti-Diarrhoeals, Cardio-Vasculars, Eye/Ear, Haematinics, and Vitamins. Despite supply constraints and an ongoing delay in the allocation of pseudoephedrine quota by the Narcotics Board, the Consumer Health Care segment achieved overall sales of Rs 1,147 million, which was 8.9 % higher than the corresponding quarter last year. Key brands such as Horlicks and Sensodyne witnessed strong double digit growth. The business continued to focus and
invest for growth with a view to further increasing market share and establishing a strong base for the future. Certain brands were realigned within business segments based on the nature of the brands in line with global strategy which will help these products achieved better market penetration.
Export sales of your Company also performed well and the Company achieved net sales of Rs 246 million in the quarter, verses Rs 169 million over the same period last year.
Gross Margins reduced further to 26.2% from 27.7% in Q1 2013. Gross margins have undergone constant attrition over the last many years mainly due to inflation, increasing raw and packing material prices, escalating costs of utilities, fuel and power coupled with volatility of Pak rupee against other currencies. These adverse factors have not been compensated by way of an adequate price increase.
Selling, marketing and distribution expenses were recorded at Rs 968 million, increasing by Rs 101 million (11.7%) over the corresponding period last year. The increase mainly represents inflation as well as higher freight costs due to rising sales volume.
The Company continued to invest on promotion in the Nutrition and Oral categories in the Consumer HealthCare business. Administrative expenses rose by 9.9% over the corresponding quarter to Rs 236 million in the current period reflecting inflationary pressures.
Other operating income increased by Rs 130 million over the same period last year mainly due to favorable movement in exchange rate as compared to the previous year.
Net profit after tax for the period was recorded at Rs 485 million, which was higher by 19.9% on account of factors highlighted in preceding paragraphs.
Capital expenditure was recorded at Rs 87 million (March 31, 2013: Rs 71 million) which was higher than that of first quarter last year. During 2014 the Company invested mainly on plant up-gradations, capacity enhancement initiatives, IT equipments and purchase of vehicles. The surplus funds of the Company increased by Rs 127 million in the quarter as compared to year end balance at December 31, 2013, to Rs 2,224 million due to improvement in cash generated from operations.
2 GSK

Future outlook and Challenges
The Pharmaceutical industry has suffered from an irrational pricing policy and a price freeze over the last decade, forcing it to internalize negative cost pressures without an offsetting adjustment whilst all other parts of the health sector have been allowed to operate under a market mechanism. Faced with this difficult situation, having to balance the requirement of providing affordable quality medicines to the public and at the same time sustain itself commercially, your company has endeavored to deliver its best through optimizing the portfolio mix, simplifying operational processes and introducing new, innovative and improved products. The Company also continues to invest in our leading Consumer brands in line with this growth diversification strategy.
The pharmaceutical industry has great potential for generating economic value to the country in terms of domestic value add, growth and exports, as well as generating revenue for the exchequer. The industry has however, as detailed earlier, for the past decade suffered from a regulatory framework which is not aligned with other countries in the region and which retards its
economic potential and value for the country.
It is hoped that the Government will take necessary steps to approve a pricing policy and a regulatory regime that safeguards the interest of the industry, supports the continuity of supplies of affordable and quality medicines and ensure the ongoing availability of numerous research based drugs which are now at risk.
AcknowledgmentThroughout the period the industrial relations climate has remained congenial and all employees showed great dedication towards achievement of Company’s objectives. On behalf of the Board, I would take this opportunity to record our appreciation for the passion and commitment shown by all the staff and our stakeholders for their continuing support.
M. Salman BurneyChairman / Chief ExecutiveKarachiApril 28, 2014
M. Salman Burney
3First Quarter Report 2014

Condensed Interim Balance Sheetas at March 31, 2014
(Un-audited) (Audited) March 31, December 31,Rupees ‘000 Note 2014 2013
NON-CURRENT ASSETS Fixed assets 5 5,905,651 5,973,404 Intangible - goodwill 955,742 955,742 Long-term loans to employees 65,777 70,079 Long-term deposits 16,892 16,865
6,944,062 7,016,090
CURRENT ASSETS Stores and spares 170,544 156,548 Stock-in-trade 6 5,854,974 6,271,405 Trade debts 432,781 349,950 Loans and advances 355,209 248,463 Trade deposits and prepayments 304,573 118,592 Interest accrued 30,781 9,753 Refunds due from government 13,847 46,951 Other receivables 425,432 392,202 Taxation - payments less provision 1,100,171 1,231,588 Investments 224,601 224,269 Cash and bank balances 1,999,433 1,872,999
10,912,346 10,922,720
17,856,408 17,938,810 SHARE CAPITAL AND RESERVES Share capital 2,895,156 2,895,156 Reserves 8,939,005 8,454,157
11,834,161 11,349,313
NON-CURRENT LIABILITIES Staff retirement benefits 274,875 250,977 Deferred taxation 609,112 612,012
883,987 862,989 CURRENT LIABILITIES Trade and other payables 4,965,713 5,561,429 Provisions 172,547 165,079
5,138,260 5,726,508
6,022,247 6,589,497 CONTINGENCIES AND COMMITMENTS 7 17,856,408 17,938,810 The annexed notes 1 to 15 form an integral part of this condensed interim financial information.
M. Salman Burney Yahya Zakaria Chairman / Chief Executive Chief Financial Officer
4 GSK

Condensed Interim Profi t and Loss AccountFor the quarter ended March 31, 2014 (Un-audited)
March 31, March 31,Rupees ‘000 Note 2014 2013
Net sales 7,142,948 6,351,931
Cost of sales (5,272,875) (4,591,379)
Gross profit 1,870,073 1,760,552
Selling, marketing and distribution expenses (967,512) (866,974)
Administrative expenses (236,089) (214,689)
Other operating expenses (67,000) (56,393)
Other income (including exchange gain) 8 202,126 71,830
Operating profit 801,598 694,326
Financial charges (3,650) (9,852)
Profit before taxation 797,948 684,474
Taxation (313,100) (280,282)
Profit after taxation 484,848 404,192
Other comprehensive income - -
Total comprehensive income 484,848 404,192
Earnings per share 9 Rs. 1.67 Rs. 1.40
The annexed notes 1 to 15 form an integral part of this condensed interim financial information.
M. Salman Burney Yahya Zakaria Chairman / Chief Executive Chief Financial Officer
5First Quarter Report 2014

Condensed Interim Cash Flows StatementFor the quarter ended March 31, 2014 (Un-audited)
March 31, March 31,Rupees ‘000 Note 2014 2013
CASH FLOWS FROM OPERATING ACTIVITIES
Cash generated from operations 10 364,604 837,053
Income taxes paid (184,583) (212,415)
Decrease in long-term loans to employees 4,302 2,409
(Increase) / Decrease in long-term deposits (27) 5,062
Net cash generated from operating activities 184,296 632,109
CASH FLOWS FROM INVESTING ACTIVITIES
Fixed capital expenditure (86,588) (70,667)
Proceeds from sale of operating assets 29,156 14,468
Net cash used in investing activities (57,432) (56,199)
CASH FLOWS FROM FINANCING ACTIVITIES
Dividend paid (98) (60)
Net increase in cash and cash equivalents 126,766 575,850
Cash and cash equivalents at beginning of the year 2,097,268 2,315,744
Cash and cash equivalents at end of the period 11 2,224,034 2,891,594
The annexed notes 1 to 15 form an integral part of this condensed interim financial information.
M. Salman Burney Yahya Zakaria Chairman / Chief Executive Chief Financial Officer
6 GSK

Share Capital reserves General Unappropriated Total capital Reserve Issue of reserve profi t arising on bonus Rupees ‘000 amalgamation shares
Balance as at January 1, 2013 -
as restated 2,631,960 2,184,238 - 3,999,970 2,577,270 11,393,438
Total comprehensive income for the
quarter ended March 31, 2013 - - - - 404,192 404,192
Balance as at March 31, 2013 2,631,960 2,184,238 - 3,999,970 2,981,462 11,797,630
Balance as at January 01, 2014 2,895,156 2,184,238 - 3,999,970 2,269,949 11,349,313
Total comprehensive income for the
quarter ended March 31, 2014 - - - - 484,848 484,848
Balance as at March 31, 2014 2,895,156 2,184,238 - 3,999,970 2,754,797 11,834,161
The annexed notes 1 to 15 form an integral part of this condensed interim financial information.
Condensed Interim Statement of Changes in EquityFor the quarter ended March 31, 2014 (Un-audited)
M. Salman Burney Yahya Zakaria Chairman / Chief Executive Chief Financial Officer
7First Quarter Report 2014

Selected notes to and forming part of the CondensedInterim Financial InformationFor the quarter ended March 31, 2014 (Un-audited)
1. THE COMPANY AND ITS OPERATIONS
The Company is incorporated in Pakistan as a limited liability company and is listed on the Karachi and Lahore Stock Exchanges. It is engaged in manufacturing and marketing of research based pharmaceutical and consumer products.
The Company is a subsidiary of S.R. One International B.V., Netherlands, whereas its ultimate parent company is
GlaxoSmithKline plc, UK. 2 BASIS OF PREPARATION
This condensed interim financial information has been prepared in accordance with the requirements of the International Accounting Standard (IAS) 34, Interim Financial Reporting and provisions of and directives issued under the Companies Ordinance, 1984. In case where requirements differ, the provisions of or directives issued under the Companies Ordinance, 1984 have been followed.
The condensed interim financial information should be read in conjunction with the annual financial statements for the year ended December 31, 2013.
3 ACCOUNTING POLICIES
The accounting policies and the methods of computation adopted in the preparation of this condensed interim financial information are the same as those applied in the preparation of the financial statements for the year ended December 31, 2013.
4 ACCOUNTING ESTIMATES, JUDGEMENTS AND FINANCIAL RISK MANAGEMENT
The preparation of condensed interim financial information in conformity with approved accounting standards requires management to make estimates, assumptions and use judgements that affect the application of policies and reported amounts of assets and liabilities and income and expenses. Estimates, assumptions and judgements are continually evaluated and are based on historical experience and other factors, including reasonable expectations of future events. Revisions to accounting estimates are recognised prospectively commencing from the period of revision.
Judgements and estimates made by the management in the preparation of this condensed interim financial information are the same as those that were applied to financial statements as at and for the year ended December 31, 2013, except for change in accounting estimate explained in note 5.2.
The company’s financial risk management objectives and policies are consistent with those disclosed in the financial statements as at and for the year ended December 31, 2013.
Un-audited Audited March 31, December 31,Rupees ‘000 2014 2013
5. FIXED ASSETS Operating assets note 5.1 5,013,004 5,075,833 Capital work-in-progress 856,893 854,849 Major spare parts and stand-by equipments 35,754 42,722
5,905,651 5,973,404
8 GSK

Additions (at cost) Disposals (at net book value) March, March, March, March,Rupees ‘000 2014 2013 2014 2012
5.1 Details of additions and disposals to operating fi xed assets are as follows:
Buildings 2,117 3,388 - 572
Plant and machinery 17,249 33,291 7,258 548
Furniture and fixture 1,553 2,395 - 53
Vehicles 41,035 20,881 15,134 9,549
Office equipments 9,629 3,797 498 156
71,583 63,752 22,890 10,878
5.2 Change in accounting estimates
During the period, management has changed the useful life of certain plant and machinary from 10 years to 15 years, which was resulted in revision of depreciation rates. Management believes that the said changes in estimate reflects more accurately the useful life and pattern of consumption of economic benefits of the respective assets. These changes have been accounted for prospectively in accordance with the requirements of International Accounting Standards (IAS)-8 “Accounting Policies, Changes in Accounting Estimates and Errors”.
Had the Company not made the above referred changes in accounting estmates, profit for the period and reserves as at the quarter ended March 31, 2014 would have been lower by Rs. 10.91 million, and earnings per share would have been lower by Re. 0.04 per share.
6. STOCK-IN-TRADE
During the period ended March 31, 2014 stock in trade has been written-down to net realisable value by Rs. 16.87 million (March 31, 2013: Rs. 0.13 million)
7. CONTINGENCIES AND COMMITMENTS
7.1 There has been no significant change in the status of contingencies as reported in the financial statements for the year ended December 31, 2013
7.2 Commitments for capital expenditure outstanding as at March 31, 2014 amounted to Rs 191.47 million (December 31, 2013: Rs 232.34 million).
8. OTHER INCOME
This includes exchange gain of Rs. 95 million arising on settlement and revaluation of foreign currency import bills.
9First Quarter Report 2014
Selected notes to and forming part of the CondensedInterim Financial InformationFor the quarter ended March 31, 2014 (Un-audited)
March 31, March 31,Rupees ‘000 2014 2013
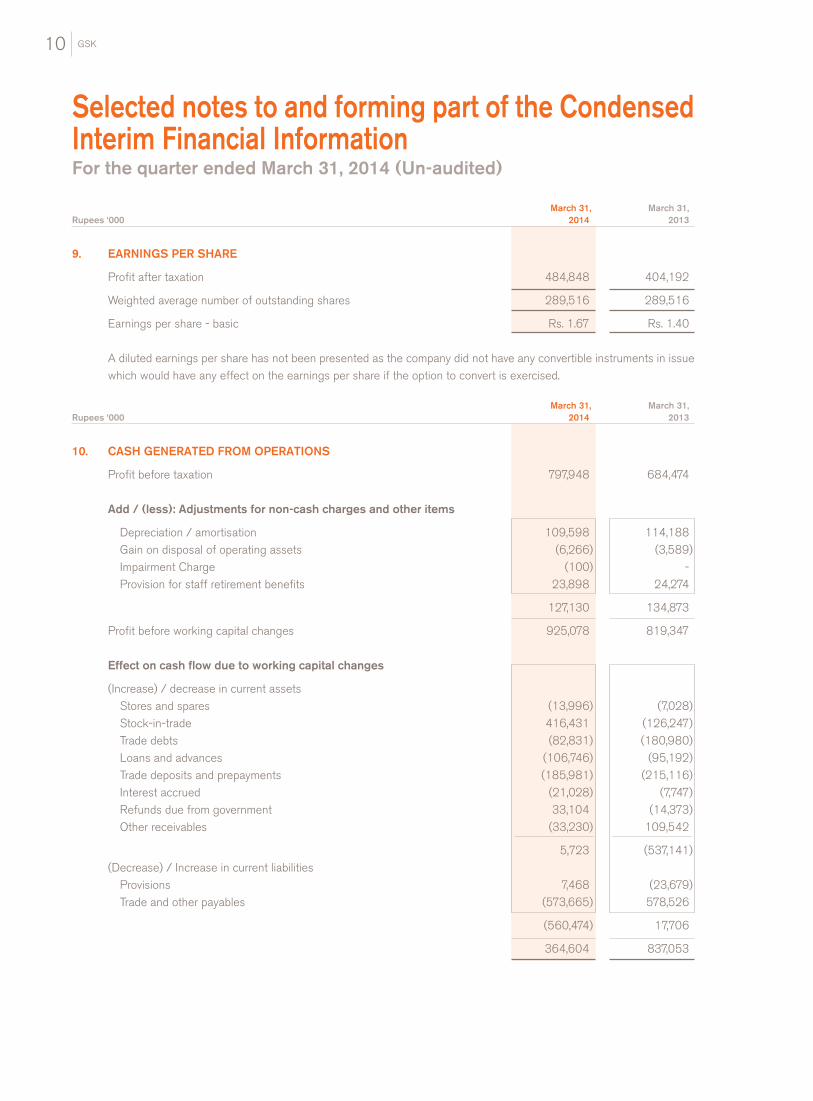
9. EARNINGS PER SHARE
Profit after taxation 484,848 404,192
Weighted average number of outstanding shares 289,516 289,516
Earnings per share - basic Rs. 1.67 Rs. 1.40
A diluted earnings per share has not been presented as the company did not have any convertible instruments in issue which would have any effect on the earnings per share if the option to convert is exercised.
March 31, March 31,Rupees ‘000 2014 2013
10. CASH GENERATED FROM OPERATIONS
Profit before taxation 797,948 684,474
Add / (less): Adjustments for non-cash charges and other items
Depreciation / amortisation 109,598 114,188 Gain on disposal of operating assets (6,266) (3,589) Impairment Charge (100) - Provision for staff retirement benefits 23,898 24,274
127,130 134,873
Profit before working capital changes 925,078 819,347
Effect on cash fl ow due to working capital changes
(Increase) / decrease in current assets Stores and spares (13,996) (7,028) Stock-in-trade 416,431 (126,247) Trade debts (82,831) (180,980) Loans and advances (106,746) (95,192) Trade deposits and prepayments (185,981) (215,116) Interest accrued (21,028) (7,747) Refunds due from government 33,104 (14,373) Other receivables (33,230) 109,542
5,723 (537,141) (Decrease) / Increase in current liabilities Provisions 7,468 (23,679) Trade and other payables (573,665) 578,526
(560,474) 17,706
364,604 837,053
10 GSK

March 31, March 31,Rupees ‘000 2014 2013
11. CASH AND CASH EQUIVALENTS
Cash and bank balances 1,999,433 2,693,107
Short term investments - Treasury bills 224,601 198,487
2,224,034 2,891,594
12. TRANSACTIONS WITH RELATED PARTIES
Relationship Nature of transactions
Associated companies: a. Purchase of goods 1,159,139 1,108,637 b. Sale of goods 30,862 15,256 c. Royalty expense charged 68,959 61,348 d. Recovery of expenes 4,164 3,483 e. Service fee on clinical trial studies 364 280 f. Donations paid - 83 g. Payment on behalf of associated company - 575 h. Payment against services 73 662
Staff retirement funds: a. Expense charged for retirement benefit plans 44,704 43,524 b. Payments to retirement benefit plans 20,806 19,250
Key management personnel: a. Salaries and other employee benefits 43,498 44,845 b. Post employment benefits 2,991 3,814 c. Proceeds from sale of fixed assets - 416
13. SEGMENT INFORMATION
Management has determined the operating segments based on the information that is presented to the chief operating decision-maker of the company for allocation of resources and assessment of performance. Based on internal management reporting structure the company is organised into two operating segments being (i) pharmaceuticals and (ii) consumer healthcare.
Management monitors the operating results of above mentioned segments separately for the purpose of making decisions about resources to be allocated and for assessing performance.
Segment results and assets include items directly attributable to a segment as well as those that can be allocated on a reasonable basis.
11First Quarter Report 2014
Selected notes to and forming part of the CondensedInterim Financial InformationFor the quarter ended March 31, 2014 (Un-audited)
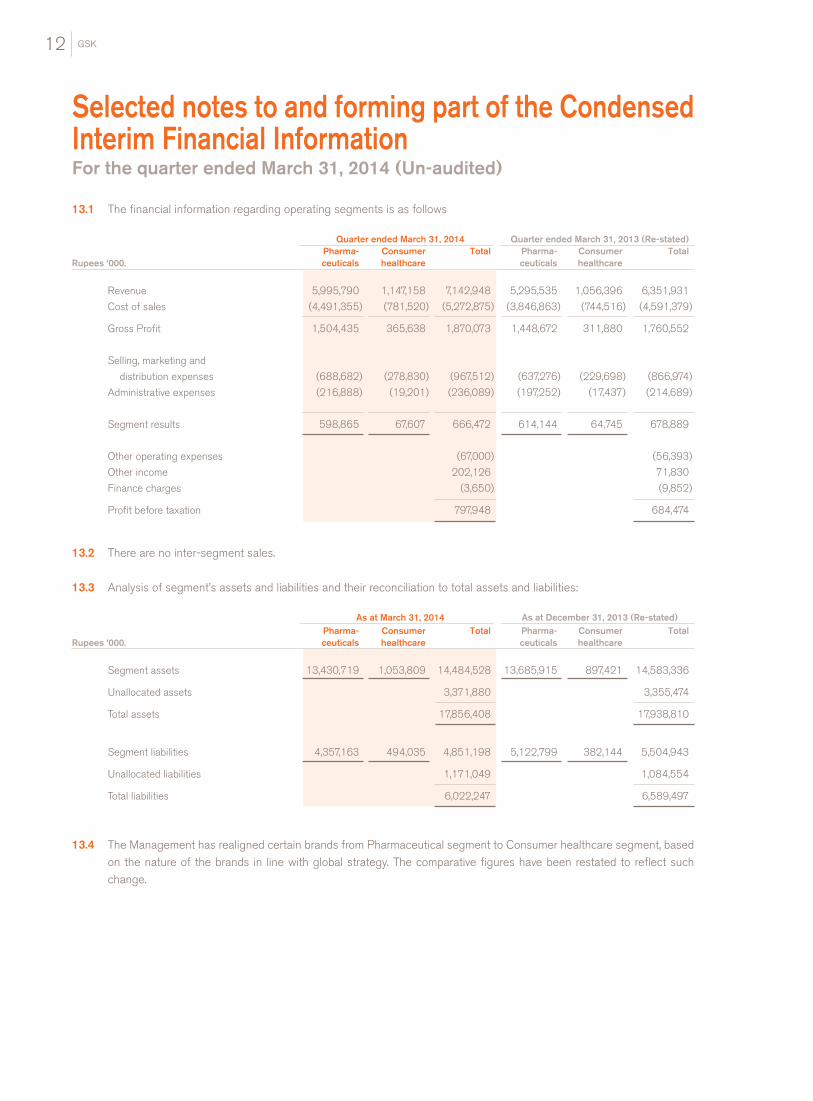
13.1 The financial information regarding operating segments is as follows
Quarter ended March 31, 2014 Quarter ended March 31, 2013 (Re-stated) Pharma- Consumer Total Pharma- Consumer TotalRupees ‘000. ceuticals healthcare ceuticals healthcare
Revenue 5,995,790 1,147,158 7,142,948 5,295,535 1,056,396 6,351,931
Cost of sales (4,491,355) (781,520) (5,272,875) (3,846,863) (744,516) (4,591,379)
Gross Profit 1,504,435 365,638 1,870,073 1,448,672 311,880 1,760,552
Selling, marketing and
distribution expenses (688,682) (278,830) (967,512) (637,276) (229,698) (866,974)
Administrative expenses (216,888) (19,201) (236,089) (197,252) (17,437) (214,689)
Segment results 598,865 67,607 666,472 614,144 64,745 678,889
Other operating expenses (67,000) (56,393)
Other income 202,126 71,830
Finance charges (3,650) (9,852)
Profit before taxation 797,948 684,474
13.2 There are no inter-segment sales.
13.3 Analysis of segment’s assets and liabilities and their reconciliation to total assets and liabilities:
As at March 31, 2014 As at December 31, 2013 (Re-stated) Pharma- Consumer Total Pharma- Consumer TotalRupees ‘000. ceuticals healthcare ceuticals healthcare
Segment assets 13,430,719 1,053,809 14,484,528 13,685,915 897,421 14,583,336
Unallocated assets 3,371,880 3,355,474
Total assets 17,856,408 17,938,810
Segment liabilities 4,357,163 494,035 4,851,198 5,122,799 382,144 5,504,943
Unallocated liabilities 1,171,049 1,084,554
Total liabilities 6,022,247 6,589,497
13.4 The Management has realigned certain brands from Pharmaceutical segment to Consumer healthcare segment, based on the nature of the brands in line with global strategy. The comparative figures have been restated to reflect such change.
12 GSK

14 The Board of Directors in its meeting held on February 07, 2014 proposed a cash dividend of Rs. 3.50 per share amounting to Rs. 1.01 billion and proposed a transfer of Rs. 289.52 million from “unappropriated profit” to “reserve for issue of bonus shares” for issuance of 10 bonus shares for every 100 shares held subject to approval by the members of the company in the annual general meeting to be held on April 28, 2014.
15. DATE OF AUTHORISATION FOR ISSUE
This condensed interim financial information was approved and authorised for issue by the Board of Directors of the Company on April 28, 2014.
M. Salman Burney Yahya Zakaria Chairman / Chief Executive Chief Financial Officer
13First Quarter Report 2014

GlaxoSmithKline Pakistan Limited35 - Dockyard Road, West Wharf, Karachi - 74000GlaxoSmithKline Pakistan Limited is a member of GlaxoSmithKline group of Companies.
© GlaxoSmithKline Pakistan Limited