glen canyon monthly operations call
TRANSCRIPT

Glen Canyon Monthly Operations Call
Basin Hydrology and OperationsFebruary 25, 2021

This briefing is being provided consistent with the provision in Section 1.1 of the LTEMP ROD which states:“Annually, Reclamation will develop a hydrograph based on the characteristics above. Reclamation will seek consensus on the annual hydrograph through monthly operational coordination calls with governmental entities, and regular meetings of the GCDAMP Technical Working Group (TWG) and AMWG. Reclamation will conduct monthly Glen Canyon Dam operational coordination meetings or calls with the DOI bureaus (USGS, NPS, FWS, and BIA), WAPA, and representatives from the Basin States and UCRC. The purpose of these meetings orcalls is for the participants to share and seek information on Glen Canyon Dam operations. One liaison from each Basin State and from the UCRC may participate in the monthly operational coordination meetings or calls.”
Background
2

3
Reservoir
Percent Current
Live Storage
Current Live
Storage(maf)
Live Storage Capacity
(maf)
Elevation(feet)
Fontenelle 41 .135 .334 6475.31
Flaming Gorge 84 3.15 3.75 6,024.61
Blue Mesa 49 0.402 .828 7,465.58
Navajo 62 1.05 1.70 6,034.48
Lake Powell 38 9.32 24.32 3,572.43
UC System Storage 46 14.16 31.09
Upper Basin Storage (as of February 23, 2021)

4
Seasonal and Monthly Precipitation
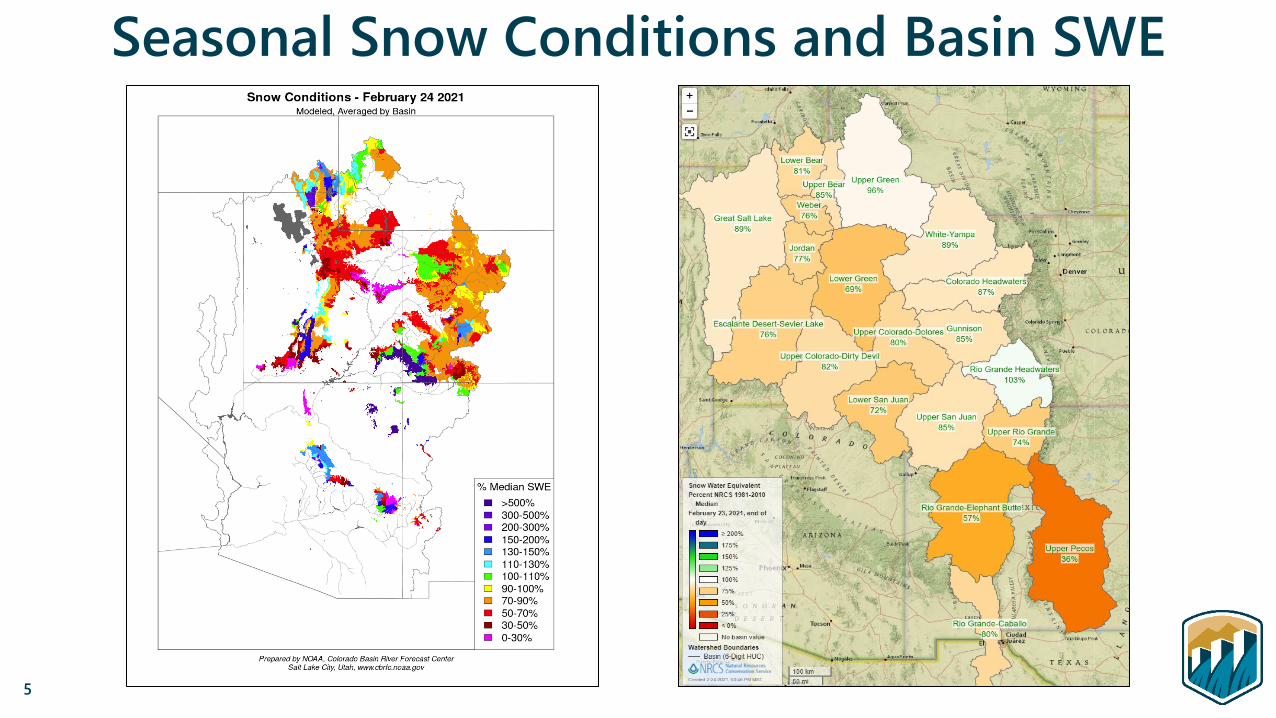
Seasonal Snow Conditions and Basin SWE
5

Upper Colorado Basin
Projected Operations for Water Year 2021
Based on February 2021 Modeling
6

7
1 Percent of average based on the period of record from 1981-2010.
ReservoirUnregulated
Inflow(kaf)
Percent of Average1
Fontenelle 659 64
Flaming Gorge 814 56
Blue Mesa 674 71
Navajo 605 56
Powell 5,149 48
as of February 1, 2021
Water Year 2021Forecasted Unregulated Inflow
Current SWE and WY2021 Forecast

8
Feb Midmonth: 5.42 maf (50%) Feb Midmonth: 3.6 maf (50%)

• The January and February 2021 Minimum Probable 24 Month Study (24-MS) runs project Powell to fall below 3525 feet in 2022.
• The Basin States, UCRC, WAPA, NPS & FWS were notified of these projections. • Model results do not initiate immediate operational changes to Reclamation facilities. • Model results do initiate enhanced monitoring and coordination under the DROA. • Model results do initiate monthly analysis of min/most/max with the parties specified in
the DROA. • The DROA enhanced monitoring and coordination will continue until either:
• (i) The minimum probable projected elevation remains above 3525' for 24 months; or• (ii) the process moves to the next step when the Most Probable 24-MS projects Powell elevations
below 3,525 feet and a specific Drought Response Operations Plan is developed. (Section II.A.4.b)
Drought Operations
9

Powell Release Scenario
10

11

12
Most Probable End of WY 2022 Projection: 3,575.23 feet (39% full)
Min/Max Range: 3,519.72 to 3,619.35 feet
Most Probable End of CY 2021 Projection: 3,551.18 feet (32% full)
Min/Max Range: 3,538.49 to 3,581.28 feet

Lake Mead End of Month Elevations Projections from the February 2021 24-Month Study Inflow Scenarios
Most Probable End of CY 2021 Projection: 1,069.71 feet (35% full)
Min/Max Range: 1,067.58 to 1,080.07 feet
Most Probable End of CY 2022 Projection: 1,057.11 feet (31% full)
Min/Max Range: 1,054.28 to 1,083.35 feet
13

14
1 Projected release, based on January 2021 Most Probable Inflow Projections and 24-Month Study model runs.2 Projected release, based on January 2021 Min and Max Probable Inflow Projections and 24-Month Study model runs.3 Dependent upon availability to shift contingency reserves, which will increase capacity by 30-40MW (3%) at current efficiency. 4 Increased capacity available from shifting contingency reserves for Spring Disturbance Flow.
Unit Number Oct 2020
Nov 2020
Dec 2020
Jan 2021
Feb 2021
Mar 2021
Apr 2021
May 2021
Jun 2021
Jul 2021
Aug 2021
Sep 2021
12345678
Units Available 5 5/4 6 6 6 6 6 5 6 6 6/8 8/6
Capacity (cfs)16,400 16,400/
12,200 19,800 19,600 19,500 19,400(20,150)4 19,300 15,800 19,500 19,400 19,200 19,100
Capacity (kaf/month) 1,040 1,140 1,250 1,220 1,080 1,190 1,190 1,050 1,160 1,190 1,330 1,400
Max (kaf) 2 640 640 720 763 675 700 628 628 651 765 800 620
Most (kaf) 1 640 640 720 763 675 700 628 628 651 765 800 620
Min (kaf) 2 640 640 720 760 680 710 640 630 660 750 800 600
8.23
8.23
8.23
(updated 02-24-2021)
FEB MOST3
FEB MOST
Glen Canyon Power Plant Planned Unit Outage Schedule for Water Year 2021

15
1 Projected release, based on January 2021 Most Probable Inflow Projections and 24-Month Study model runs.2 Projected release, based on January 2021 Min and Max Probable Inflow Projections and 24-Month Study model runs.3 Dependent upon availability to shift contingency reserves, which will increase capacity by 30-40MW (3%) at current efficiency.
Unit Number Oct 2021
Nov 2021
Dec 2021
Jan 2022
Feb 2022
Mar 2022
Apr 2022
May 2022
Jun 2022
Jul 2022
Aug 2022
Sep 2022
1
2
3
4
5
6
7
8
Units Available 6 6/5 5/6 6 4 6 8 7 6 6 6 4
Capacity (cfs)19,100 19,000/
15,50015,400/18,900 18,900 11,800/
18,600 18,600 25,500 22,700 19,700 19,700 19,600 12,400
Capacity (kaf/month) 1,160 1,020 1,090 1,140 720 1,220 1,520 1,430 1,240 1,210 1,210 790
Max (kaf) 2 643 642 715 857 758 801 713 710 745 842 900 674
Most (kaf) 1 480 500 600 723 639 675 601 599 628 709 758 568
Min (kaf) 2 480 500 600 723 639 675 601 599 628 709 758 5487.487.48
9.0
(updated 02-24-2021)
FEB MOST3
FEB MOST
Glen Canyon Power Plant Planned Unit Outage Schedule for Water Year 2022

16

17

18

Water Quality
19
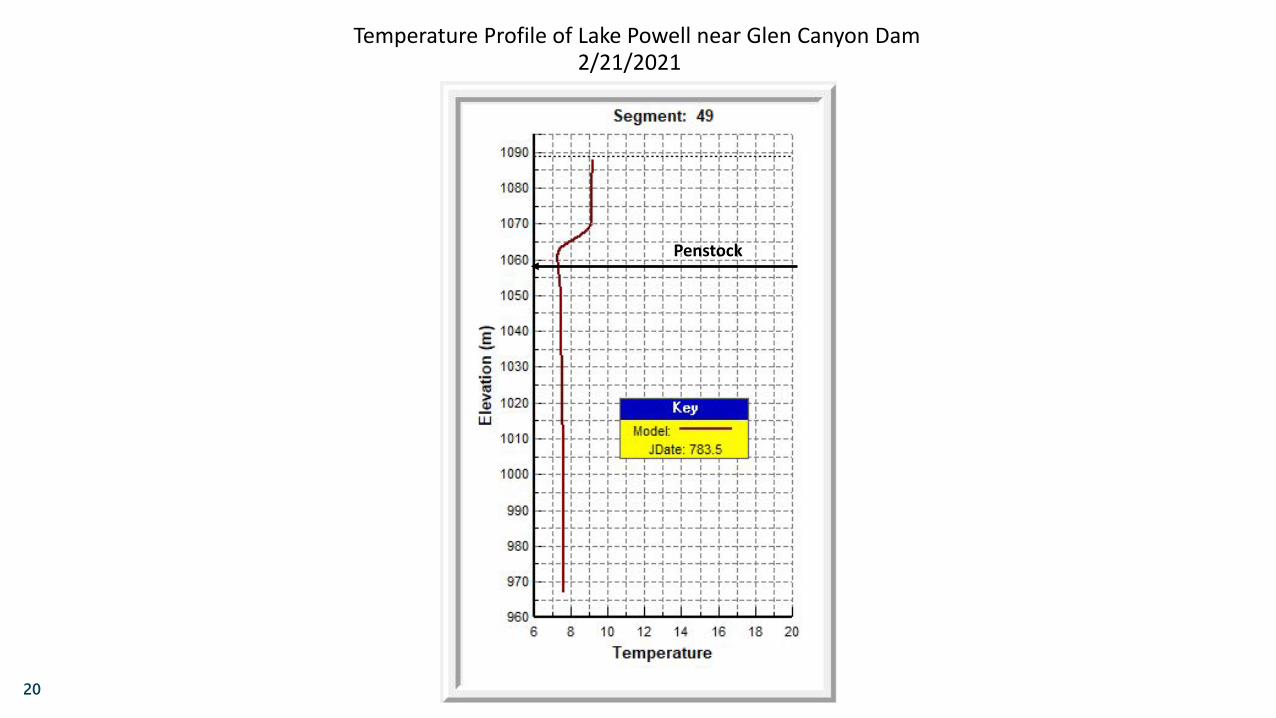
Penstock
Temperature Profile of Lake Powell near Glen Canyon Dam2/21/2021
20

Penstock
Cross Sectional Temperature Profile of Lake Powell2/21/2021
21

22

Historic Projected
23
>12°C HBC Growth
>16°C HBC Spawn

24

Questions/Discussion
25