glen helen water quality: a 5-year exploration, 2011-2015
TRANSCRIPT
Wright State University Wright State University
CORE Scholar CORE Scholar
Chemistry Faculty Publications Chemistry
5-25-2016
Glen Helen Water Quality: A 5-Year Exploration, 2011-2015 (ACS) Glen Helen Water Quality: A 5-Year Exploration, 2011-2015 (ACS)
Audrey E. McGowin Ph.D. Wright State University - Main Campus, [email protected]
Follow this and additional works at: https://corescholar.libraries.wright.edu/chemistry
Part of the Chemistry Commons
Repository Citation Repository Citation McGowin, A. E. (2016). Glen Helen Water Quality: A 5-Year Exploration, 2011-2015 (ACS). . https://corescholar.libraries.wright.edu/chemistry/215
This Presentation is brought to you for free and open access by the Chemistry at CORE Scholar. It has been accepted for inclusion in Chemistry Faculty Publications by an authorized administrator of CORE Scholar. For more information, please contact [email protected].
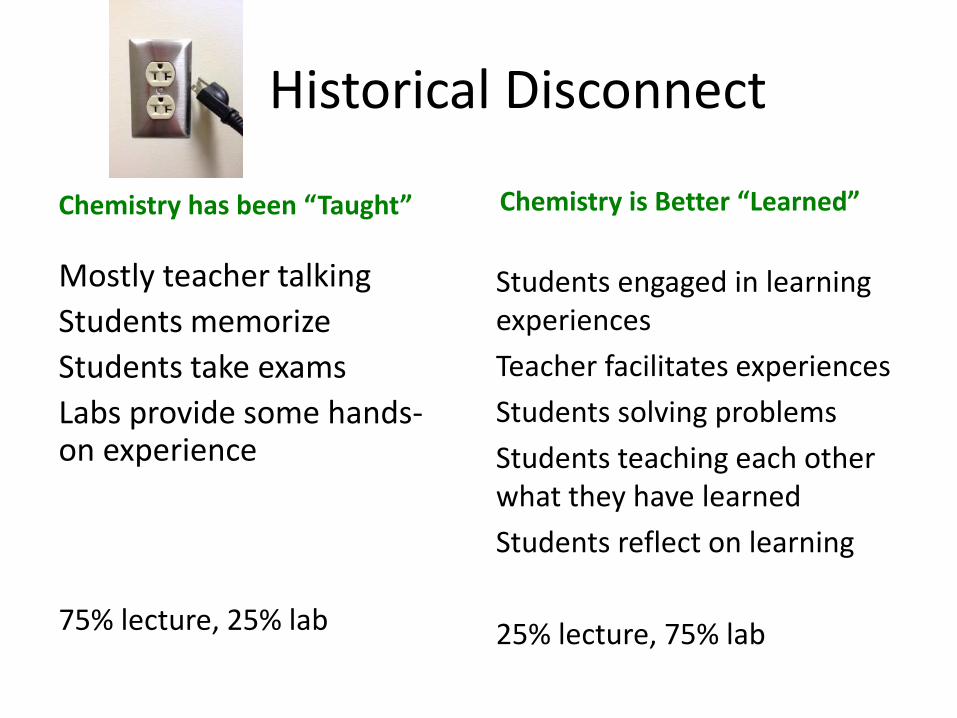
Historical Disconnect
Chemistry has been “Taught”
Mostly teacher talking Students memorize Students take exams Labs provide some hands-on experience
75% lecture, 25% lab
Chemistry is Better “Learned”
Students engaged in learning experiences Teacher facilitates experiences Students solving problems Students teaching each other what they have learned Students reflect on learning
25% lecture, 75% lab
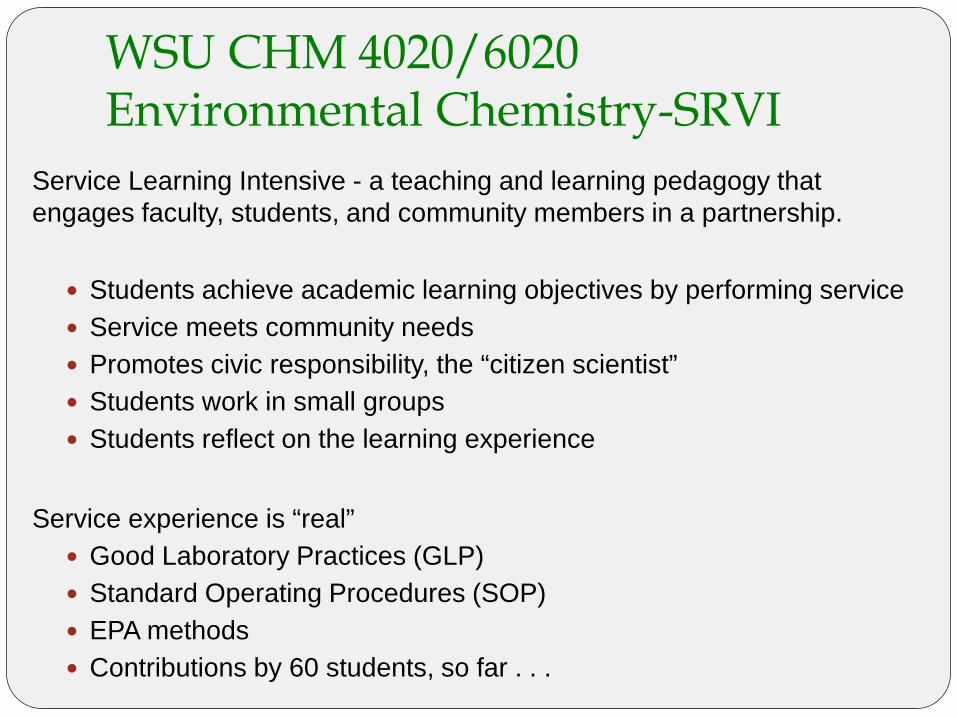
WSU CHM 4020/6020 Environmental Chemistry-SRVI
Service Learning Intensive - a teaching and learning pedagogy that engages faculty, students, and community members in a partnership.
Students achieve academic learning objectives by performing service Service meets community needs Promotes civic responsibility, the “citizen scientist” Students work in small groups Students reflect on the learning experience
Service experience is “real” Good Laboratory Practices (GLP) Standard Operating Procedures (SOP) EPA methods Contributions by 60 students, so far . . .
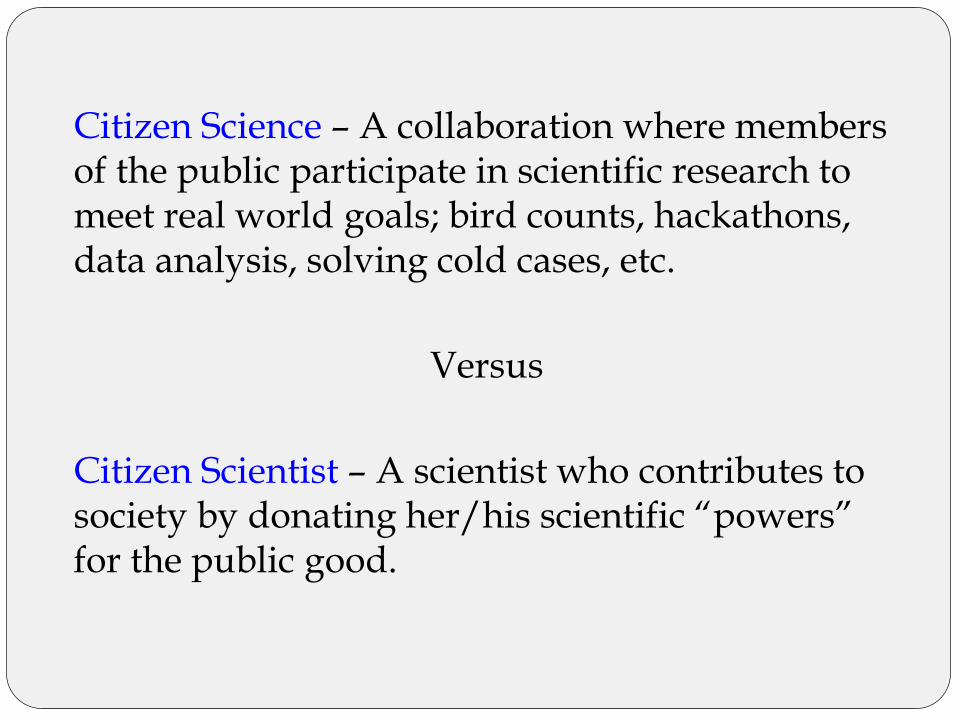
Citizen Science – A collaboration where members of the public participate in scientific research to meet real world goals; bird counts, hackathons, data analysis, solving cold cases, etc.
Versus
Citizen Scientist – A scientist who contributes to society by donating her/his scientific “powers” for the public good.

4 3 2 I 0 CRITERIA EXCELLENT VERY GOOD SATISFACTORY NEEDS WORK UNSATISF ACTORY
Writing Quality - Do you Writing style clearly Writing style clearly Writing style is clear and Writing style mostly Writing style is poor. convey your ideas expresses meaning and expresses meaning and conveys meaning. A clear. Grammar and Ideas are not clearly intelligently and correctly? viewpoints. Excellent viewpoints. Proper use few grammar and syntax syntax need attention. articulated. Improper
grammar and syntax. No of grammar and syntax. errors. No or few Spelling errors. use of grammar and spelling errors. No spelling errors. soelling errors. svntax. Spelling errors.
Desc1i ption of Servic~ Complete description of Complete description of Adequate description of S-L activity reported as a Inadequate description of Lur ning Acti"ity - What activities. Demonstrated the S-L activities. S-L activity and personal sequence of events. activity and personal role measurements were taken clear knowledge of Demonstrates adequate role in collecting and Description of personal in collecting and and how was this techniques used. Able to knowledge of techniques eval uating data and role in collecting and evaluating data and accomplished? critically evaluate data used and some insight presenting results. evaluating data and presenting results.
and results. into the imitations of Demonstrates adequate presenting results. techniques and knowledge of techniques Limited knowledge or intemretation of data. used. techniques used.
Insights and Understanding Explains how course Some insights into Explains significance of Report of work done No evidence of - What did you learn in the content is integrated into significance of project. results and how they are with limited insight understanding how course that related to your S- the project. Explains how course rela:ted to course content. about how fieldwork is course content relates to L activity? What did you Demonstrates awareness content is related. Some Sonne sense of related to learning of work. No evaluation or learn doing the activity that of complexity of the sense of complexity of complexity but most course content. interpretation of results. reinforced course content? issues. the issues. insi<>hts are simplistic. Commitment to Pr oje-ct and Demonstrated Description of personal Description of personal Description of personal No evidence of a Gr oup - Has your commitment to the participation in the participation in the participation in the commitment to the experience affected your activity and group. activities of the project. activities of the project. activities of the project. project.. Lack of thinking about the issues and Finds solutions to Demonstration of a Reli ance on others to Reliance on others to participation in group 's possible solutions? Did you problems. Generates commitment to the resolve problems or resolve problems or work or class discussion. overcome any problems? ideas for future work. activity and finding interpret results. interpret results.
solutions to problems. Personal Ac.hievement and Evaluation of the Expresses satisfaction Explanation of a Participant reports Negative attitude Development - Did any of implications of results with activities and personal increase in efforts but is unaffected reported about work on the activities give you a sense for self, S-L partner, and results. Aware of impact sensitivity of the issues, by the project and the project.. Excessive of personal accomplishment? public. Evidence of on career goals or or a change of attitude, outcomes. boredom and frustration Have your goals or views impact on career goals or feelings of personal and awareness. with little effort to find changed? feelings of personal accomplishment resolution.
accomplishment •Adapted from, "A Sernre Lurnmg Rubnc," by Dand Burton, VCU Teaching, ~farch 1999. Developed with guidance from AAC&U Value Rubrics by Francisco Acoba, Assistant Professor, English, Sen-ice-Leaming Faculty Coordinator, in collaboration with Kristine Korey-Smith, Assistant Professor, Developmental Education, and Coordinator, Faculty Senate's Learning Outcomes Assessment Committee, and other engaged faculty at Kapi' olani Commwlity College, University of Hawai'i.
Reflection Rubric

Think of Glen Helen as a Living System
People and things goin
Glen Helen transforms them
People and thingsleave
Glen Helen Association – Partner Concern: What are the chemical threats to this system?
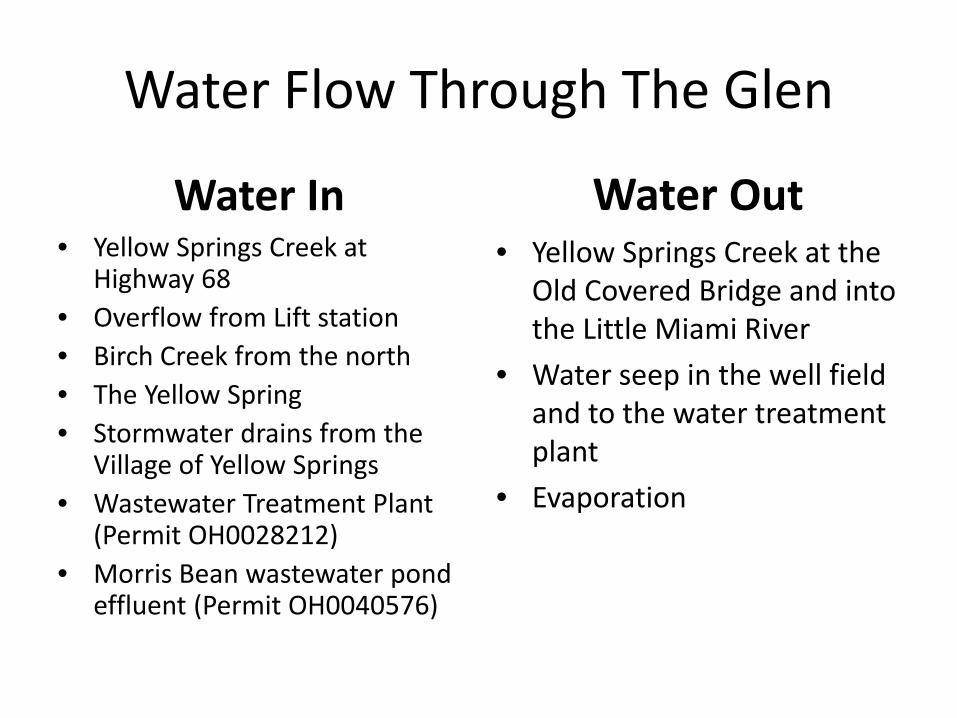
Water Flow Through The Glen
Water In • Yellow Springs Creek at
Highway 68 • Overflow from Lift station • Birch Creek from the north • The Yellow Spring • Stormwater drains from the
Village of Yellow Springs • Wastewater Treatment Plant
(Permit OH0028212) • Morris Bean wastewater pond
effluent (Permit OH0040576)
Water Out • Yellow Springs Creek at the
Old Covered Bridge and into the Little Miami River
• Water seep in the well field and to the water treatment plant
• Evaporation

Sample Sites
HWY68 Yellow Springs Creek north entry intoGlen Helen
YSLS Yellow Springs Creek at Yellow SpringsLift Station
YS The Yellow Spring YSTMB Yellow Springs Creek at Glen Helen
Trailside Museum BCSC Birch Creek Stone Crossing YSCUP Yellow Springs Creek after Birch Creek
input before TS input TS Traveler’s Spring WWTP Yellow Springs Wastewater Treatment
plant effluent YSCVB Yellow Springs Creek at Covered
Bridge, includes inputs from BCSC, TS, and WWTP
LMRG Little Miami River at Grinnell Road Bridge, prior to input from YellowSprings Creek
MOR Morris Bean effluent JRS Jacoby Rd Spring near Birch Manor
House LMR Little Miami River at Jacoby Rd Canoe
Access, includes inputs from YSCVB, LMRG, MOR, and JRS

Parameters Studied
• Anions
–Nitrate, nitrite, phosphate (nutrients)
– Fluoride, chloride, bromide, sulfate
– EPA Method 300.1
• Turbidity
• E. coli – 3M Petri Plates
• Standard parameters – Dissolved oxygen – Temperature – Conductivity – Ammonia – YSI Multimeter
• Metals
– As, Cd, Cr, Cu, Fe, Mn, Ni, Pb, Sr, Zn
– EPA Method 200

EPA Method 300.1 Determination of inorganic anions in
drinking water by ion chromatography

Nitrate-Nitrogen Concentrations Nitrate-Nitrogen concentrations at all sampling sites (mg/L)
Nitr
ate-
Nitr
ogen
Con
cent
ratio
n (m
g/L)
14
12
10
8
6
4
2
0
JRS HWY68 YS** LMR *No effluent to sample **YS was below detection limit
EPA Drinking Water Limit (10 mg/L)
YSTMB YSLS YSCVB LMRG WWTP BCSC YSCUP TS MOR* Site
Sept. 28 Oct. 26 Nov. 16
2015

Contaminated Well Sample
25
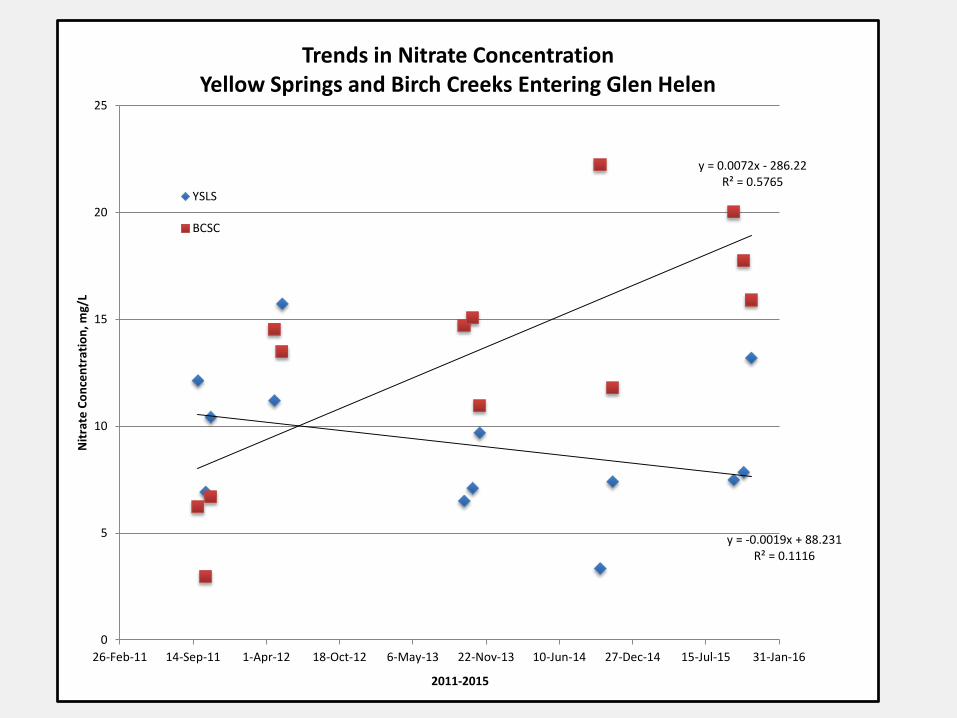
Trends in Nitrate Concentration Yellow Springs and Birch Creeks Entering Glen Helen
Nitr
ate
Conc
entr
atio
n, m
g/L
20
15
10
5
y = 0.0072x - 286.22 R² = 0.5765
YSLS
BCSC
y = -0.0019x + 88.231 R² = 0.1116
26-Feb-11 14-Sep-11 1-Apr-12 18-Oct-12 6-May-13 22-Nov-13 10-Jun-14 27-Dec-14 15-Jul-15 31-Jan-16
2011-2015
0

40
50
60
Trend in Nitrate Concentration Entering Glen Helen from WastewaterTreatment Plant
Nit
rate
Con
cent
rati
on, m
g/L
30 WWTP
20
y = -0.0092x + 407.12 R² = 0.1489
10
0 26-Feb-11 14-Sep-11 1-Apr-12 18-Oct-12 6-May-13 22-Nov-13 10-Jun-14 27-Dec-14 15-Jul-15 31-Jan-16
2011-2015

Trend in Nitrate Concentration at the Covered Bridge Leaving Glen Helen
Nit
rate
Con
cent
rati
on, m
g/L
40
35
30
25
20
15
10
5
0
YSCVB
Linear (YSCVB)
y = -0.0049x + 217.38 R² = 0.1844
26-Feb-11 14-Sep-11 1-Apr-12 18-Oct-12 6-May-13 22-Nov-13 10-Jun-14 27-Dec-14 15-Jul-15 31-Jan-16
2011-2015
18
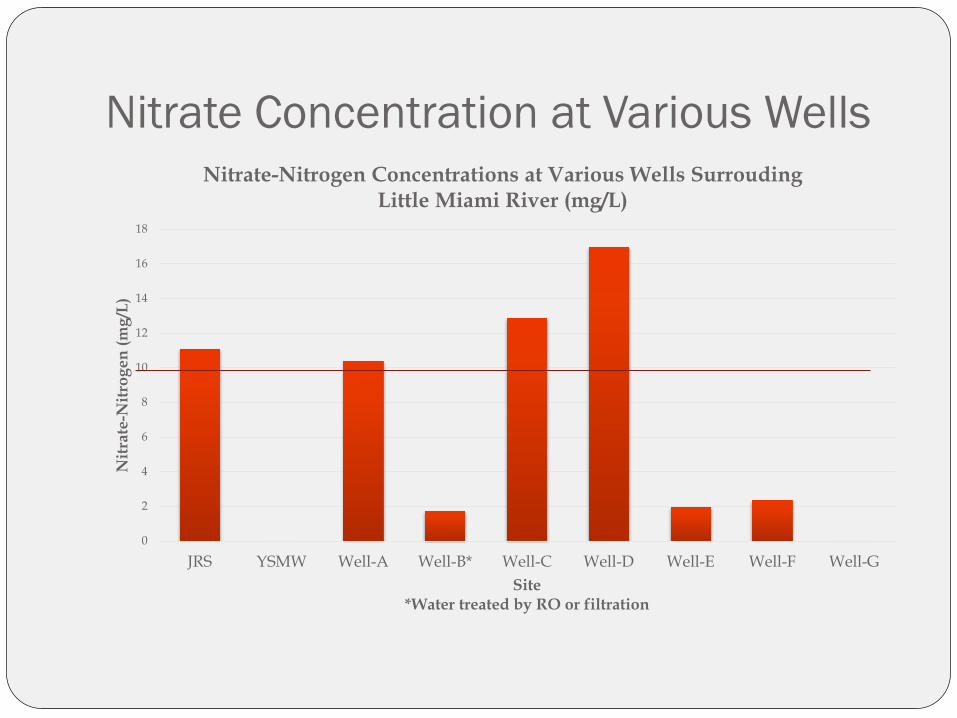
Nitrate Concentration at Various Wells Nitrate-Nitrogen Concentrations at Various Wells Surrouding
Little Miami River (mg/L)
Nitr
ate-
Nitr
ogen
(mg/
L)
16
14
12
10
8
6
4
2
0
JRS YSMW Well-A Well-B* Well-C Well-D Well-E Well-F Well-G Site
*Water treated by RO or filtration
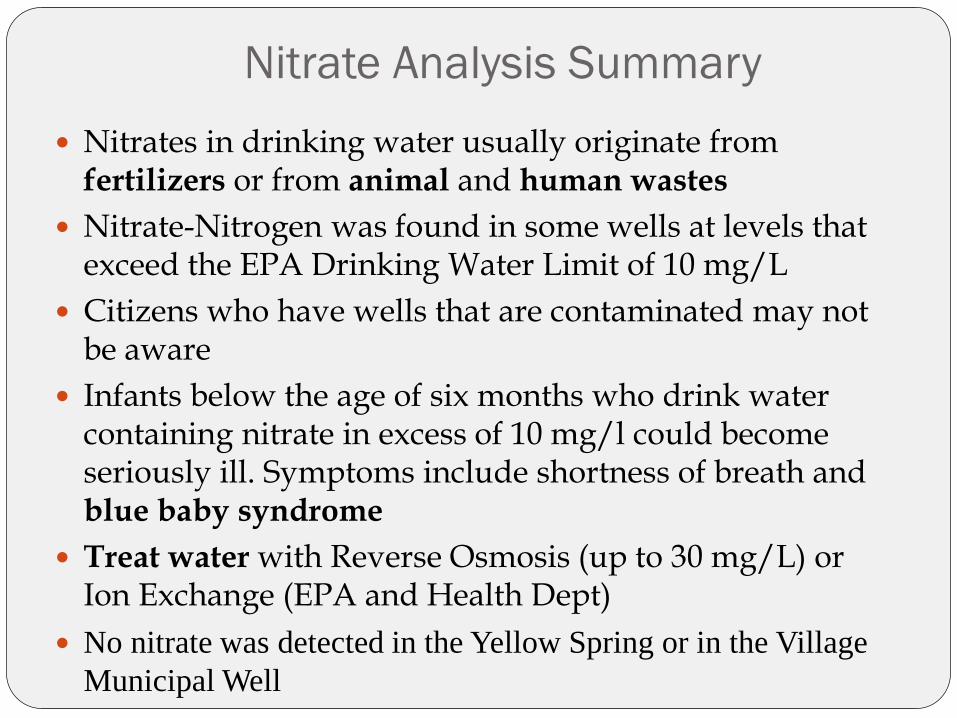
Nitrate Analysis Summary
Nitrates in drinking water usually originate from fertilizers or from animal and human wastes
Nitrate-Nitrogen was found in some wells at levels that exceed the EPA Drinking Water Limit of 10 mg/L
Citizens who have wells that are contaminated may not be aware
Infants below the age of six months who drink water containing nitrate in excess of 10 mg/l could become seriously ill. Symptoms include shortness of breath and blue baby syndrome
Treat water with Reverse Osmosis (up to 30 mg/L) or Ion Exchange (EPA and Health Dept)
No nitrate was detected in the Yellow Spring or in the Village Municipal Well
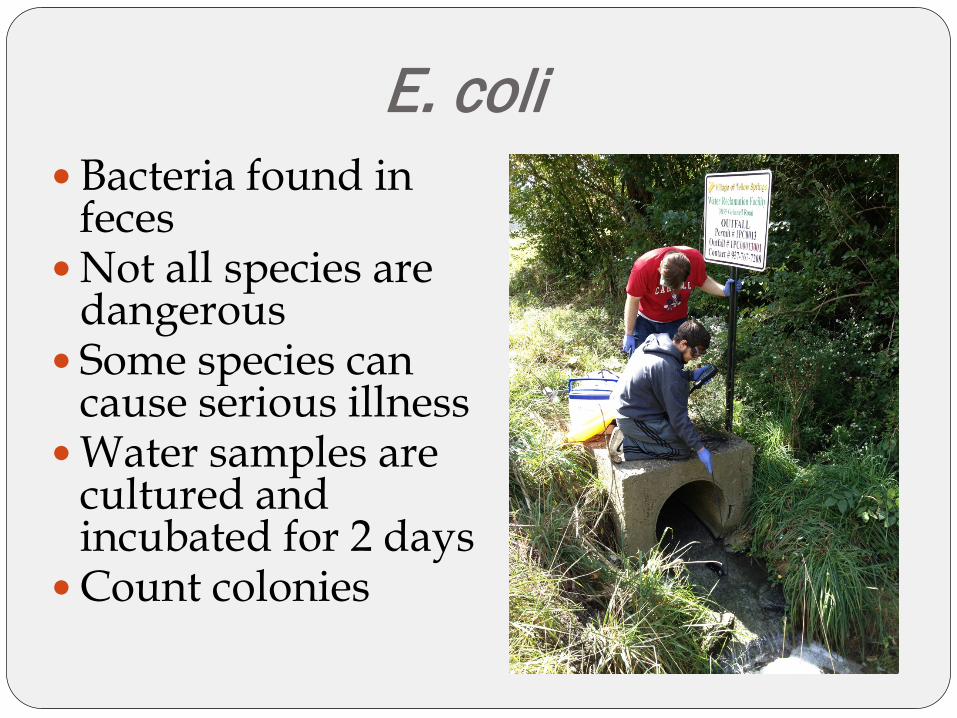
E. coli Bacteria found in
feces Not all species are
dangerous Some species can
cause serious illness Water samples are
cultured and incubated for 2 days Count colonies
600
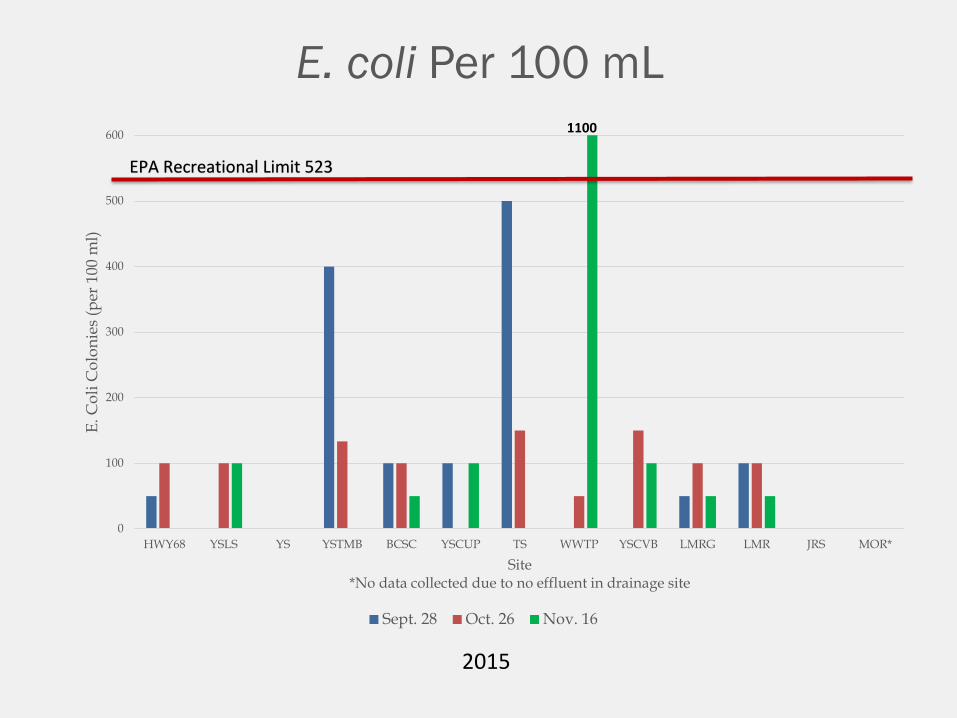
E. coli Per 100 mL 1100
Col
i Col
onie
s (pe
r 100
ml)
E.
EPA Recreational Limit 523
500
400
300
200
100
0 HWY68 YSLS YS YSTMB BCSC YSCUP TS WWTP YSCVB LMRG
Site *No data collected due to no effluent in drainage site
Sept. 28 Oct. 26 Nov. 16
LMR JRS MOR*
2015
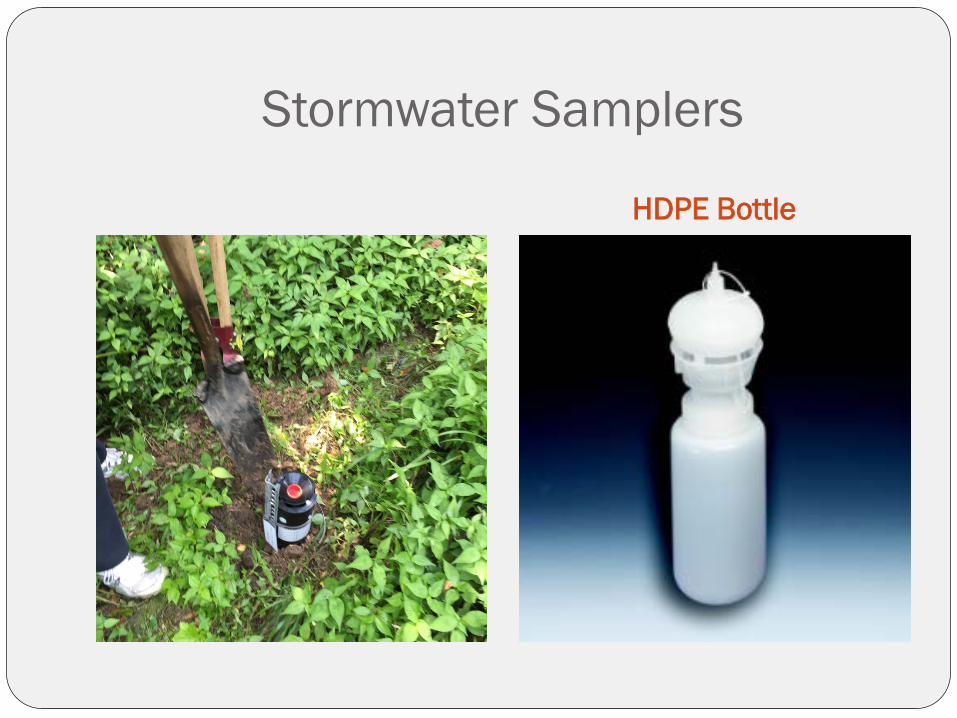
Stormwater Samplers
HDPE Bottle

Stormwater Runoff – E.coli Before Rain Event After Rain Event
07/22/2015 BCOSR 07/27/2015 BCOSR
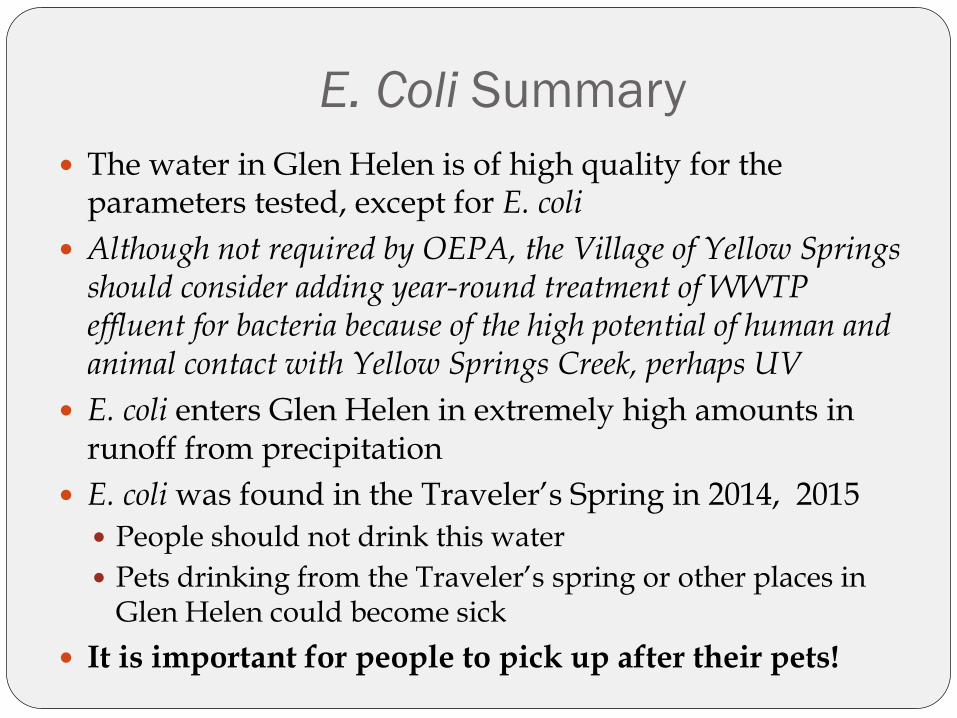
E. Coli Summary The water in Glen Helen is of high quality for the
parameters tested, except for E. coli Although not required by OEPA, the Village of Yellow Springs
should consider adding year-round treatment of WWTP effluent for bacteria because of the high potential of human and animal contact with Yellow Springs Creek, perhaps UV
E. coli enters Glen Helen in extremely high amounts in runoff from precipitation
E. coli was found in the Traveler’s Spring in 2014, 2015 People should not drink this water Pets drinking from the Traveler’s spring or other places in
Glen Helen could become sick It is important for people to pick up after their pets!

EPA Method 200.7: Determination of Metals and Trace Elements in Water and Wastes by Inductively Coupled Plasma-Atomic Emission Spectrometry
y = 14237x + 578.47 R² = 0.9997
0
10000
20000
30000
40000
50000
60000
70000
80000
0 1 2 3 4 5 6
Inte
nsity
Concentration
Iron

Yellow Springs Municipal Well (YSMW)
All parameters are within the EPA drinking-water limits, withan exception of iron
Concentration of iron was detected to be 0.336 ppm, while the EPA drinking water limit for iron is 0.3 ppm
Iron is described as a secondarycontaminant. It is not hazardous in drinking water.
The iron deposits will normallyaffect the color and taste of the water, but it is not toxic to humans in small amounts
Potential issues with manganeseand strontium
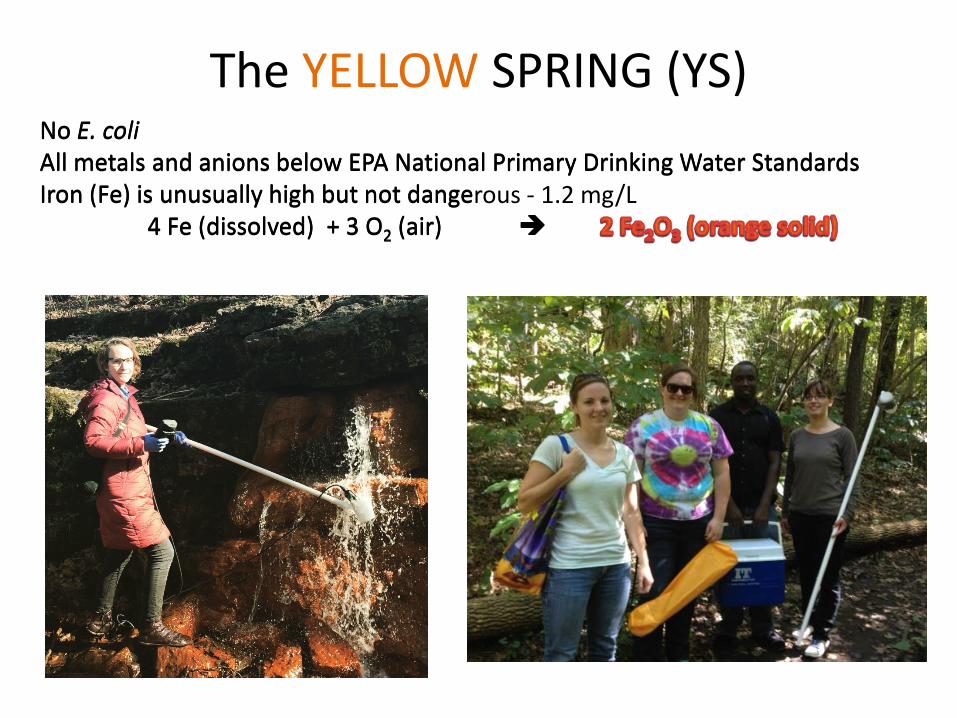
The YELLOW SPRING (YS) NNoo EE.. cocollii AAlll ml meettaalsls aanndd aannioionnss bbeellooww EEPPAA NNaattiioonnaall PrimPrimaarryy DDrinrinkkiningg WWaatteerr SSttaannddaarrddss IIrroon (Fn (Fee)) iiss unusunusuauallllyy hihigh butgh but nonott dadangngeerous - 1.2 mg/L
44 FFee (di(dissssoollvveed)d) ++ 3 O3 O22 ((aaiir)r)

Metal Concentrations in Th,e Yellow Spring Sedliment
Metal (mg/kg dry weight)
Arsenic (As) Cadmium (Cd)
Iron (Fe)
Lead (Pb)
TEC, Threshold Effect Concent:ratiorn 9.79
0.99
No limit
35.8
The Yellow Spring Sediment 170
4.04
24,892
11.1
Remarkable Findings for Metals in The Yellow Springs Sediments
• Sediments contained very high levels of arsenic • Arsenic in the water deposits in sediments over time as it emerges from the
spring
• The source of arsenic is likely natural minerals. associated with iron deposits
• This can oc,cur in SE Ohio
• Sediments contained high levels of cadmium
• Sediments contained high levels of lead
• It is not advisable for people to handle sediments from the spring
• Iron concentrations in The Yellow spring sediments are 2 to 3 times greater than sediments at other sites at about 25,000 mg/kg dry weight, giving the sediment its characteristic orange color
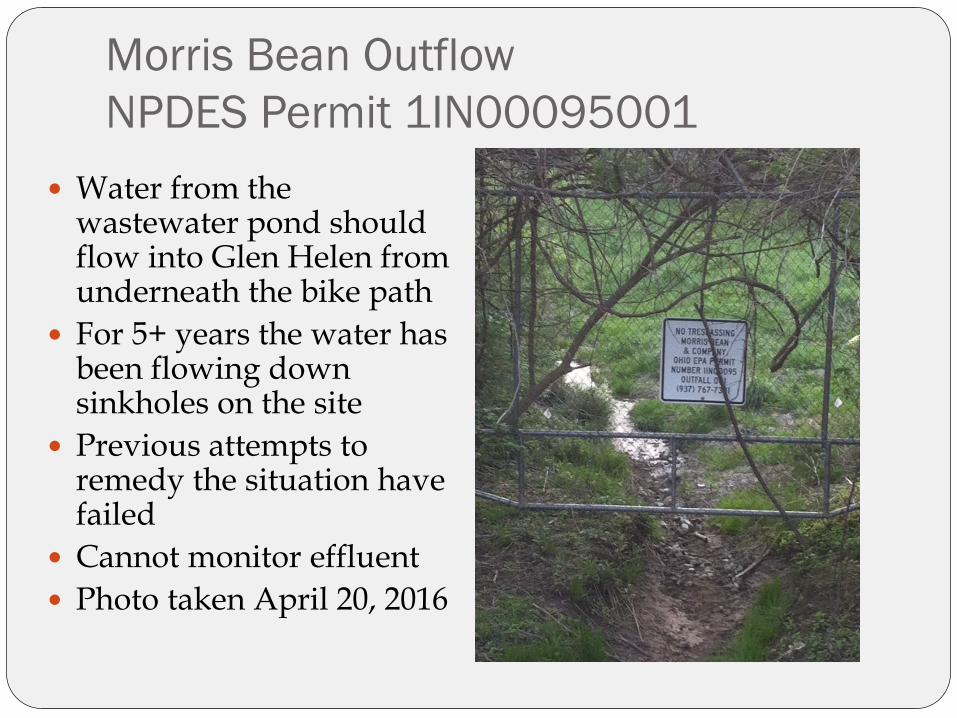
Morris Bean Outflow NPDES Permit 1IN00095001
Water from the wastewater pond should flow into Glen Helen from underneath the bike path
For 5+ years the water hasbeen flowing downsinkholes on the site
Previous attempts to remedy the situation havefailed
Cannot monitor effluent Photo taken April 20, 2016

Class Recommendation:
Since the Yellow Spring Municipal Wells are downstream, the village should consider setting timelines with OEPA and Morris Bean to permanently correct the situation by requiring a different method of wastewater management

In SUMMARY . . .
The GOOD NEWS! • Water flowing from Glen
Helen is cleaner than water flowing into it
• Glen Helen is a positive transforming force in the environment
• The protection of Glen Helen helps improve water quality in the region . . . AND BEYOND!
The Challenges! • E. coli in stormwater runoff • E. coli from WWTP in winter • Morris Bean wastewater
pond discharge going down sinkholes and toward municipal well
• Nitrate in agricultural runoff
Student Contributors Steven Ujvary Sarah Izor Lin Phu Lauren Bruce Justin Myers Jessica Clemmons Amy McNeely Ashlynn Boedecker Ritu Ghose Jessica McKinley Seth Brittle Jacob Doolin Dustin Estridge Anna Foote Shannon Hennley Megan Huddleson Robert Johnson Abraham Kemboi Carlie McGrath John “Jack” McGrath
Renata Mitton David Roland Nicholas Rose Nathaniel Brackett Brannon Dunn Robert Magley Saagar Patel Jennifer Purvis Sarah Steele Jonathan Tumey Katie Watson James Waweru Benjamin Wick Scott Atkinson Felicia Gooden Jessica Dagher Triet Truong Kayla Lilly Fadwa Constandinidis Kyle Danielson
Jessica Davis Mark Duffy Ashley Hoang Markeata Lee Richard Grimes Jeremy Lear Richard Cooke Morgan Russell Adam Lampert Kyle Liddy Tara Fujimoto Kelsie Eberst Laura Bailey Ted Alfred Sarah, Sharrock Perri Freeman* Ryann Patrus* Zeb Reichert* Sam Senzek* Nargess Jumathan*
*Antioch students

Thank You! Steve Trohalaki and the Dayton-ACS
Mr. Nick Boutis, Executive Director, Glen Helen Ecology Institute
Glen Helen Staff: Mr. Shahkar Strolger, Mr. George Bieri, Mr. Ben Silliman, Ann Simonson, Tina Spencer
Dr. David Kammler, Antioch College
Mr. Joe Bates and Mr. Brad Ault and staff at WWTP
Ms. Jessica Clemmons and YSI/Xylem
Dino’s Cappuccinos (helped keep students warm and gave us ice to keep samples cold)
Mr. Garrett VanNess, laboratory assistance Wright State University Department of Chemistry funding Sture Fredrik Anliot Fund for stormwater analysis funding
Class posters available in WSU Libraries CORE Scholar http://works.bepress.com/audrey_mcgowin/