glenmark pharmaceuticals limited€¦ · research-led global pharmaceutical company ... generics...
TRANSCRIPT

Glenmark Pharmaceuticals Limited
JP Morgan Healthcare Conference January 2016
Safe Harbor Disclaimer
This document has been prepared by Glenmark Pharmaceuticals Ltd. The information, statements and analysis made in this document describing company’s objectives, projections and estimates are forward looking statements and progressive within the meaning of applicable Security Laws and Regulations. The analysis contained herein is based on numerous assumptions. Actual results may vary from those expressed or implied depending upon economic conditions, government policies and other incidental factors. No representation or warranty, either expressed or implied, is provided in relation to this presentation. This presentation should not be regarded by recipients as a substitute for the exercise of their own judgment.
2

CORPORATE OVERVIEW
3

Vision
4
To emerge as a Leading Integrated Research-led Global pharmaceutical company
• Established research capabilities in both novel small molecules and biologics
• 7 molecules in different stages of clinical development
• Commercial presence in more than 60 countries across the globe
• More than 70% of revenue from international markets
• Ranks among the top 80 companies in the world
• Ranks 8th among companies in Asia * • Ranks 10th among companies based out
of emerging markets **
• 12 finished dosage plants in five countries • 5 API plants in India for captive and
commercial requirements • 1 biologics manufacturing site in
Switzerland
Source: SCRIP Rankings 2016 * excludes Japan ** includes countries like Brazil, Russia, India, China and South Africa
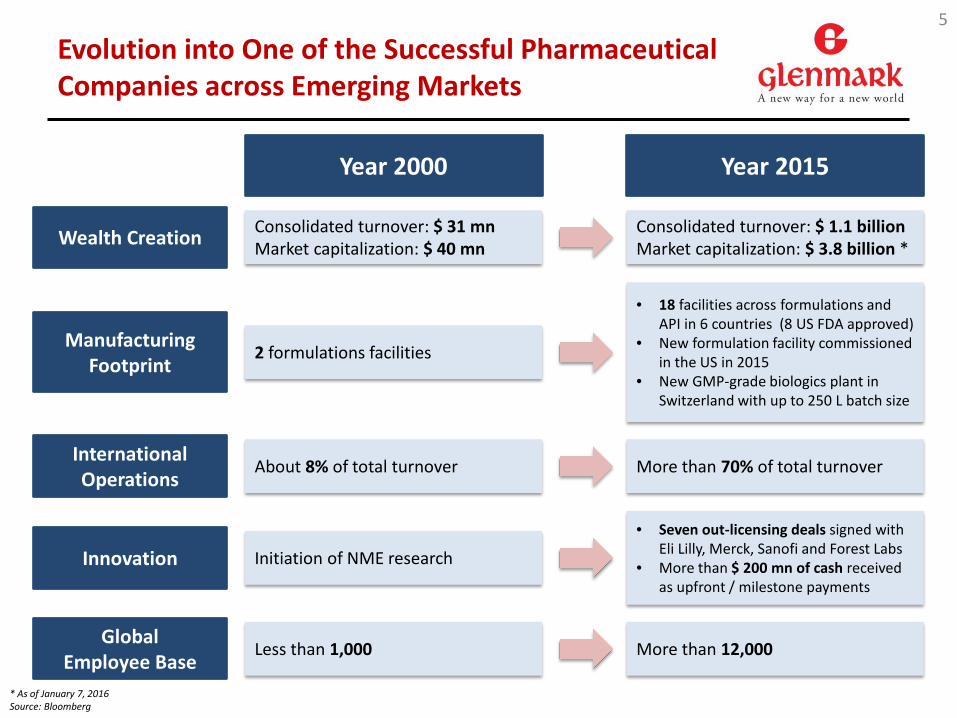
Evolution into One of the Successful Pharmaceutical Companies across Emerging Markets
5
Year 2000 Year 2015
Consolidated turnover: $ 31 mn Market capitalization: $ 40 mn
Consolidated turnover: $ 1.1 billion Market capitalization: $ 3.8 billion *
2 formulations facilities
• 18 facilities across formulations and API in 6 countries (8 US FDA approved)
• New formulation facility commissioned in the US in 2015
• New GMP-grade biologics plant in Switzerland with up to 250 L batch size
More than 70% of total turnover About 8% of total turnover
• Seven out-licensing deals signed with Eli Lilly, Merck, Sanofi and Forest Labs
• More than $ 200 mn of cash received as upfront / milestone payments
Initiation of NME research
More than 12,000 Less than 1,000
Wealth Creation
Manufacturing Footprint
International Operations
Innovation
Global Employee Base
* As of January 7, 2016 Source: Bloomberg
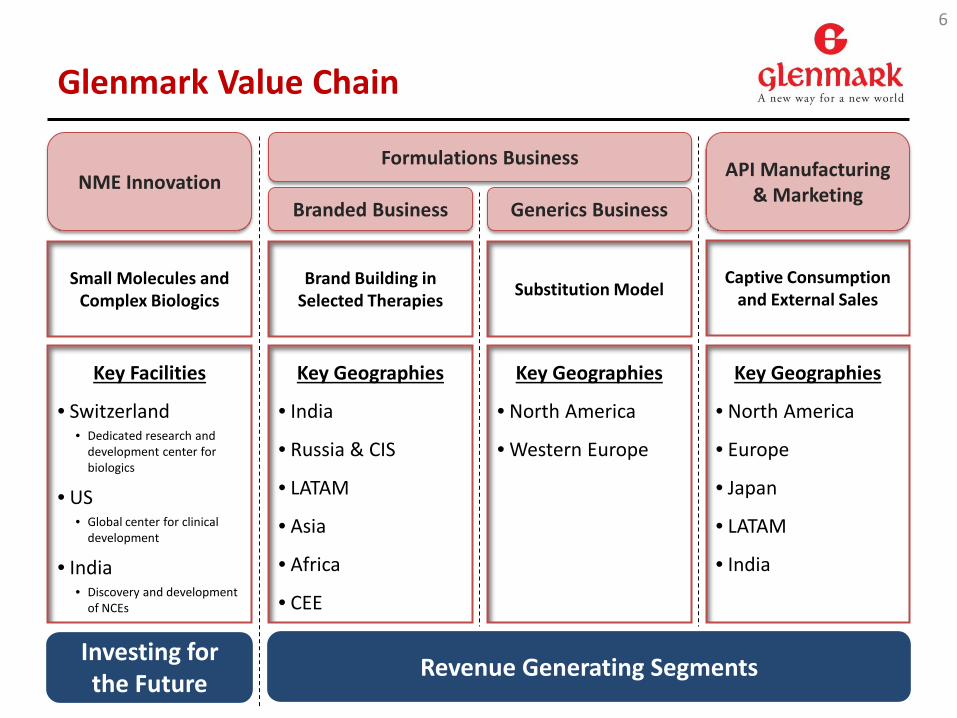
Glenmark Value Chain
6
Small Molecules and Complex Biologics Substitution Model Brand Building in
Selected Therapies Captive Consumption
and External Sales
NME Innovation Generics Business Branded Business
API Manufacturing & Marketing
Formulations Business
Key Facilities
• Switzerland • Dedicated research and
development center for biologics
• US • Global center for clinical
development
• India • Discovery and development
of NCEs
Key Geographies
• North America
• Western Europe
Key Geographies
• India
• Russia & CIS
• LATAM
• Asia
• Africa
• CEE
Key Geographies
• North America
• Europe
• Japan
• LATAM
• India
Investing for the Future Revenue Generating Segments

Strong Commercial Presence across the Globe
7
• Operations in more than 60 countries across 5 continents, with a direct presence in all major markets such as India, the US, EU, Brazil and Russia
• Global commercial infrastructure to be leveraged for marketing of innovative products in the future
LATAM 11%
USA 31%
EU 10%
INDIA 26%
GLOBAL API 9%
ROW (RCIS, ASIA and AFRICA)
12%
Source: Regional revenue breakup as of FY15

BUSINESS OVERVIEW
8

Glenmark Value Chain
9
Small Molecules and Complex Biologics Substitution Model Brand Building in
Selected Therapies Captive Consumption
and External Sales
NME Innovation Generics Business Branded Business
API Manufacturing & Marketing
Formulations Business
Key Facilities
• Switzerland
• US
• India
Key Geographies
• North America
• Western Europe
Key Geographies
• India
• Russia & CIS
• LATAM
• Asia
• Africa
• CEE
Key Geographies
• North America
• Europe
• Japan
• LATAM
• India
Investing for the Future Revenue Generating Segments

Novel Drugs Pipeline
10
• GBR 830: Phase 2a trial initiated in the US with Atopic Dermatitis as primary indication; also being evaluated in other indications
• GBR 1302: Phase 1 trial initiated in Germany • GBR 500: Currently evaluating for further out-licensing in other autoimmune indications • GBR 1342: Plan to file IND application to initiate Phase 1 in the US in the next 9 months
Pipeline as of January 2016

Glenmark Value Chain
11
Small Molecules and Complex Biologics Substitution Model Brand Building in
Selected Therapies Captive Consumption
and External Sales
NME Innovation Generics Business Branded Business
API Manufacturing & Marketing
Formulations Business
Key Facilities
• Switzerland
• US
• India
Key Geographies
• North America
• Western Europe
Key Geographies
• India
• Russia & CIS
• LATAM
• Asia
• Africa
• CEE
Key Geographies
• North America
• Europe
• Japan
• LATAM
• India
Investing for the Future Revenue Generating Segments

181 169 60 58 47 42
33% 30%
11% 10% 8% 8%
0%
5%
10%
15%
20%
25%
30%
35%
0
40
80
120
160
200
US India LATAM ROW API Europe
Regional Revenue, H1 FY16
Sustaining Growth and Margins in a Challenging Environment
H1 FY16 H1 FY15 % YoY growth FY15
Net Sales 556 494 12.5% 1,087
EBITDA 119 106 12.4% 200
EBITDA % of net sales 21.4% 21.4% 18.4%
Net Profit 61 55 11.1% 108
Net Profit % of net sales 11.0% 11.1% 10%
12
53 74 89 111 56
8%
9% 9%
10% 10%
0%
2%
4%
6%
8%
10%
12%
0
20
40
60
80
100
120
140
FY12 FY13 FY14 FY15 H1FY16
R&D Expenditure, FY12-16 $ mn
In $ mn
Source: Glenmark Q2 and H1 FY16 Statement of Financial Results Note: USD/INR = 64.06 for H1 FY16 and H1 FY15; USD/INR = 61.17 for FY15
$ mn
% o
f tot
al sa
les
% o
f tot
al sa
les

Snapshot of the US generics pipeline
13
Note: Pipeline data updated as of 2 December, 2015; MAT sales as per IMS Health NSP September 2015 ‘Others’ Includes Modified Release, Controlled Substances, Immunosuppressants
• 100+ ANDAs authorized for distribution and 62 products pending approval in the US • Key FTF launch coming up – generic Ezetimibe in December 2016
Primary Category Pending Approval
Authorized to Distribute
Total Filings Market Size ($ mn) MAT Sep 2015
Immediate Release 28 49 77 26,192
Dermatology 12 25 37 2,744
Hormones 8 17 25 2,460
Injectables 8 0 8 2,717
Others 6 13 19 2,074
Total 62 104 166 36,187
Para IV filings 26 0 26 19,020

GLENMARK IN THE NEXT DECADE
14

Key Trends are Altering the Global Industry Landscape
15
Pricing pressure across markets
• Increasing competition from smaller companies • Consolidation of supply chain in the US and EU • Governments in emerging markets implementing some level of price
control
Increased focus on quality and compliance
Shift towards more complex treatment alternatives
Decline of commodity generics in the US
Macro-economic challenges across emerging markets
• US FDA, EMA, MHRA, PICS approval becoming the norm across developed and emerging markets
• Increase in cost of doing business
• Treatment paradigm shifting towards more targeted therapies and personalized medicines
• Evolution of new technologies integrating with new drug development for more effective treatment and monitoring
• Patent cliff less than historical; potential market to reduce going forward
• Treatment paradigm shifts towards more complex molecules
• While local currency growth is healthy, overall operating environment remains benign
• Currency depreciation impacting major markets such as Brazil, Russia, Venezuela
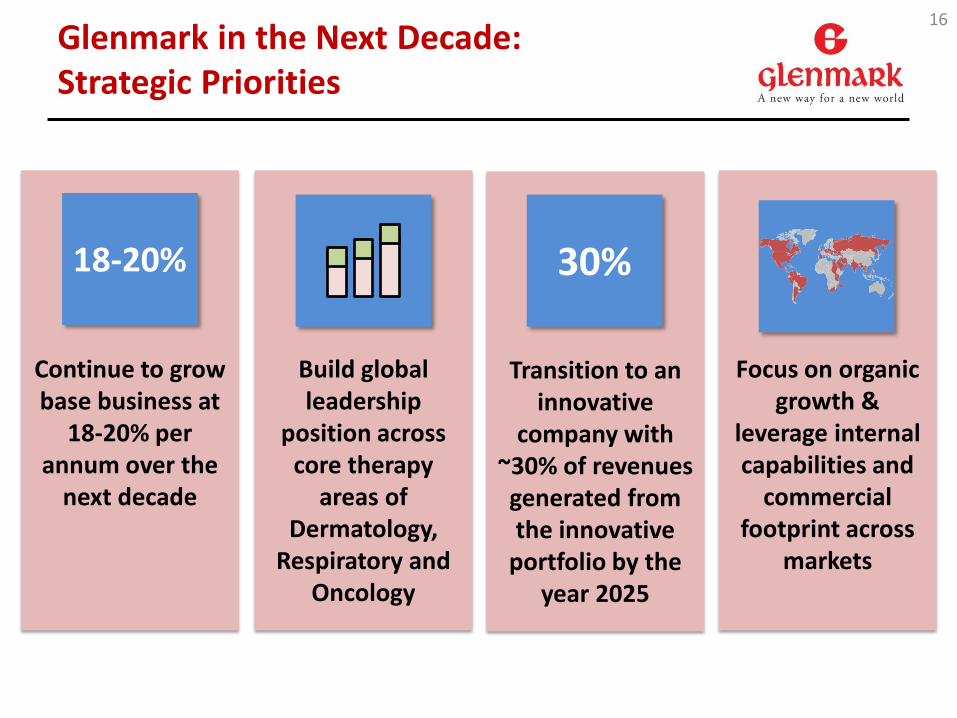
Glenmark in the Next Decade: Strategic Priorities
16
Continue to grow base business at
18-20% per annum over the
next decade
Build global leadership
position across core therapy
areas of Dermatology,
Respiratory and Oncology
Transition to an innovative
company with ~30% of revenues generated from the innovative
portfolio by the year 2025
Focus on organic growth &
leverage internal capabilities and
commercial footprint across
markets
18-20% 30%

Glenmark in the Next Decade: Focused Approach in Innovation
17
Core Therapeutic Areas
Generics NME R&D
Dermatology
Respiratory
Oncology
Inflammation Dermatology Respiratory
Autoimmune
Oncology
Primary Focus Areas
Additional Focus Areas
Cardio-Metabolic Pain
Specialty
Dermatology
Respiratory
Base Portfolio Innovative Portfolio

Glenmark in the Next Decade: Positioning for Future Success
18
Generics
Generics + 505(b)(2) Specialty products
Generics + 505(b)(2) Specialty products +
NME Products
Present – 2018
2018 – 2021
2021 Onwards

Q&A
19

20
Thank you