global agenda council's leading indicators of innovation
TRANSCRIPT
Global Agenda Council on the Economics of InnovationEvaluation of Leading Indicators of Innovation
March 2016

1
World Economic Forum Economic
Global Agenda Council on the Economics of Innovation
Evaluation of Leading Indicators of Innovation
Key Findings: Leading Indicators of Innovation Study
Innovation plays an essential role in the development of the modern global economy. It ranks among the most important of human activities, driving economic growth through the creation of job opportunities, new products and services, as well as inspiring cities, regions and countries to create environments that foster it to improve their competitiveness in local and global markets. However, many cities, regions and countries fail to realize their desired levels of prosperity as they lack an environment conducive to innovation, due to factors such as misdirected public policies, poor business strategies or a dearth of resources. In an effort to better understand innovation and aid in improving innovation outcomes, the World Economic Forum’s Global Agenda Council on the Economics of Innovation has conducted a study of the issue perhaps most at the very core of innovation: its measurement. To improve the understanding of innovation’s measurement, the Council set about to find, curate, dissect and understand the complete set of the world’s existing indexes of innovation. This inquiry led to the discovery of 17 innovation indexes and 14 innovation surveys and reports (listed below in Figure 1 and Figure 1a), which together identify some 45 indicators of innovation (listed below in Figure 2). The Council notes significant diversity in how these various indexes, surveys and reports approach the topic of innovation. Some, such as the Forum’s Global Competitiveness Report 2015-2016 and the European Commission’s Innovation Union Scoreboard 2014, have updated their innovation index yearly to provide a basis for comparisons over time, while others, such as the Alliance for Science and Technology Research in America’s (ASTRA) Innovation Indicators for Tomorrow, have only published their innovation index once. The geographical scope of innovation covered varies as well. For instance, most of the indexes, surveys and reports, such as INSEAD’s Global Innovation Index 2015, cover innovation on a global, multinational scale, including both developed and developing countries, while a few, such as Foro Consultivo Cientifico y Tecnologico’s (FCCYT) National Ranking of Science, Technology and Innovation 2013 (STI 2013), limit their scope to innovation on the regional level.

2
Figure 1. Innovation indexes
Index Source Most Recent Publication Comments 1. Australian Innovation System
Report 2011 Australian Government 2011
2. Bloomberg Innovation Quotient Bloomberg 22 January 2014 3. Digital Evolution Index Tufts University 2014 4. Global Cleantech Innovation
Index Cleantech Group and World Wildlife Fund (WWF)
2014
5. Global Entrepreneurship Monitor Global Report
Babson College 20 January 2014 This index is particularly applicable in developing and LDC environments.
6. Global Intellectual Property Center (GIPC) International IP Index
GIPC, US Chamber of Commerce 2015
7. KAM Knowledge Index World Bank 2009 8. Innovation Indicators – OECD
Statistics GIPC 2013
9. Innovation Indicators for Tomorrow
Alliance for Science and Technology Research in America (ASTRA)
2007 This index is particularly applicable in developing and LDC environments.
10. International Innovation Index Boston Consulting Group (BCG) and National Association of Manufacturers (NAM)
2009
11. Innovation Union Scoreboard 2015
European Commission 2015
12. National Ranking of Science, Technology and Innovation 2013 (STI 2013)
Foro Consultivo Cientifico y Tecnologico (FCCYT)
2013 This index is particularly applicable in developing and LDC environments.
13. UNESCO Institute for Statistics United Nations Educational, Scientific and Cultural Organization (UNESCO)
2015 This index is particularly applicable in developing and LDC environments.
14. The Global Competitiveness Report 2015-2016
World Economic Forum 2015 This index is particularly applicable in developing and LDC environments.
15. The Global Innovation Index 2015
INSEAD 2015
16. The Massachusetts Innovation Massachusetts Technology 2014

3
Economy Annual Index Collaborative 17. World Development Indicators The World Bank 2015 This index is particularly applicable in
developing and LDC environments. Figure 1a. Related surveys and reports1
Index Source Most Recent Publication Comments
1. Business Research and Development and Innovation Survey (BRDIS)
National Science Foundation (NSF) 2011
2. Eurostat Innovation Statistics European Commission 2015 3. INDIA: International Outlier in IP GIPC 2013 4. Innovation Cities Index 2014: Global 2thinknow 2014 5. Regional Innovation Scoreboard 2014 European Commission 2014 6. Science and Engineering Indicators
2014 NSF 2013
7. Survey of Science and Engineering Research Facilities
NSF 2013
8. The 2014 EU Survey on Industrial R&D Investment Trends
European Commission 2014
9. The 5 Characteristics of Successful Innovators
Harvard Business Review 2013
10. The African Science Technology and Innovation Indicators (ASTII) Initiative
New Partnership for Africa’s Development (NEPAD)
2014
11. The Community Innovation Survey European Commission 2010 12. UN Comtrade Database United Nations 2014 13. UNCTADstat United Nations Conference on
Trade and Development (UNCTAD) 2015
14. World Intellectual Property Organization (WIPO) IP Statistics Center
WIPO 2015
1 Surveys and reports in this section identify indicators of innovation, but are not themselves indexes of innovation.

4
Figure 2. Innovation indicators covered in innovation indexes, surveys and reports
Indicator 1. New Products and Services Introduced 2. Sales of New-to-Market and New-to-Firm Innovations 3. Employment in Knowledge-Intensive Activities (“Manufacturing and Services”) 4. Exports of Knowledge-Intensive Products and Services 5. Education Level of Population 6. Scientific Publications 7. Venture Capital 8. Angel Investment 9. SBIR Funding 10. R&D Expenditures 11. Patent Activity 12. Small and Medium-Sized Enterprises Collaboration 13. Public Policies 14. Public Attitudes and Sources of Information 15. High-Tech Density 16. Education Policy 17. Technology Transfer 18. Labour or Workforce Productivity 19. Intellectual Property (IP) Protection 20. Royalty and License Fees Payments and Receipts 21. Foreign Direct Investment (FDI) Inflows 22. International Cooperation in Patents 23. Number of Patents in Force 24. Relative Impact of Scientific Publications 25. Entrepreneurial Culture/Societal Attitudes 26. Core Characteristics of Entrepreneurial People 27. Initial Public Offerings (IPO) 28. Housing Affordability 29. Science, Technology and Innovation (STI) Literacy 30. Access to Multiple and Diverse Sources of Information 31. Inhibitors to Innovation 32. Organizational and/or Marketing Improvement 33. Continuous Improvement Discipline 34. Technical Skills 35. Business Sophistication 36. R&D Personnel (Human Resources) 37. Knowledge-Sharing and Collaboration Opportunities 38. Company Proximity to Others 39. Infrastructure 40. Logistics, Freights and Ports 41. Military and Defense 42. Research Facility Amount and Cost of Space 43. Information and Communications Technologies 44. Specialization in the Economic and Social Environment 45. Urban Development
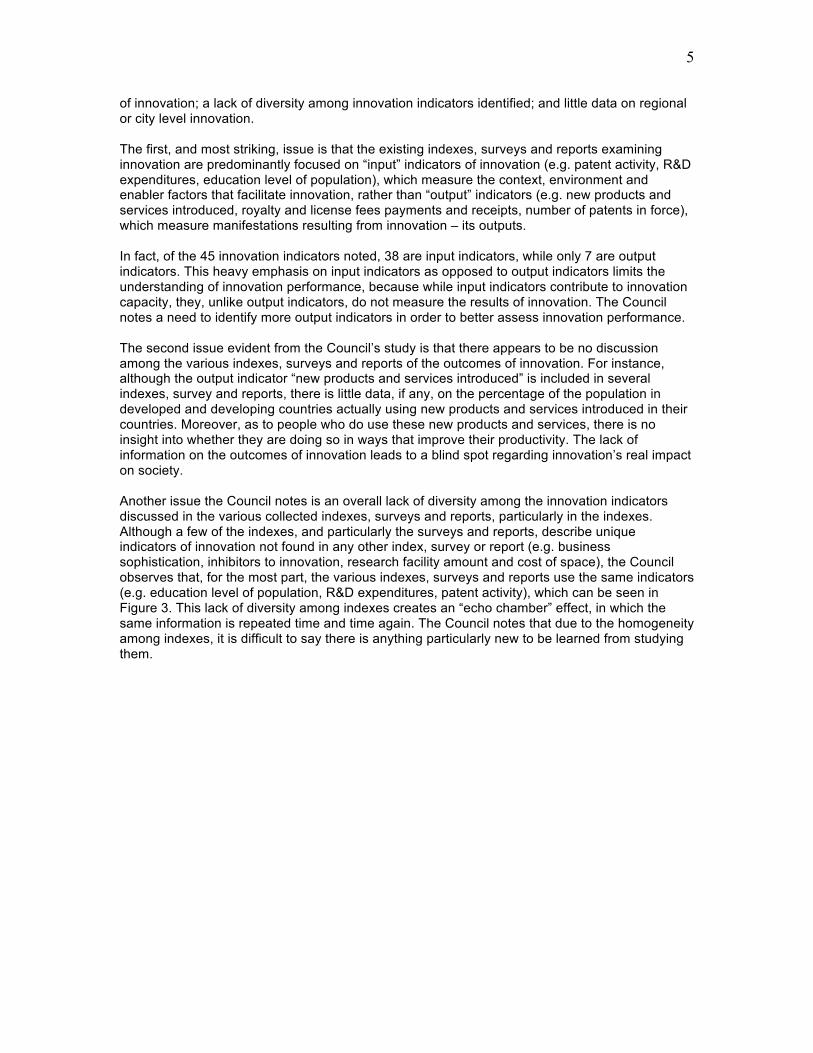
Through examination of these existing indexes, surveys and reports, the Council observes that although they all attempt in some way to measure innovation, thereby shedding light on innovation’s outputs and inputs, there remains much to be desired. The Council notes several issues evident from examining these various innovation indexes, surveys and reports: an overemphasis on input indicators as opposed to output indicators; no discussion of the outcomes
5
of innovation; a lack of diversity among innovation indicators identified; and little data on regional or city level innovation. The first, and most striking, issue is that the existing indexes, surveys and reports examining innovation are predominantly focused on “input” indicators of innovation (e.g. patent activity, R&D expenditures, education level of population), which measure the context, environment and enabler factors that facilitate innovation, rather than “output” indicators (e.g. new products and services introduced, royalty and license fees payments and receipts, number of patents in force), which measure manifestations resulting from innovation – its outputs. In fact, of the 45 innovation indicators noted, 38 are input indicators, while only 7 are output indicators. This heavy emphasis on input indicators as opposed to output indicators limits the understanding of innovation performance, because while input indicators contribute to innovation capacity, they, unlike output indicators, do not measure the results of innovation. The Council notes a need to identify more output indicators in order to better assess innovation performance. The second issue evident from the Council’s study is that there appears to be no discussion among the various indexes, surveys and reports of the outcomes of innovation. For instance, although the output indicator “new products and services introduced” is included in several indexes, survey and reports, there is little data, if any, on the percentage of the population in developed and developing countries actually using new products and services introduced in their countries. Moreover, as to people who do use these new products and services, there is no insight into whether they are doing so in ways that improve their productivity. The lack of information on the outcomes of innovation leads to a blind spot regarding innovation’s real impact on society. Another issue the Council notes is an overall lack of diversity among the innovation indicators discussed in the various collected indexes, surveys and reports, particularly in the indexes. Although a few of the indexes, and particularly the surveys and reports, describe unique indicators of innovation not found in any other index, survey or report (e.g. business sophistication, inhibitors to innovation, research facility amount and cost of space), the Council observes that, for the most part, the various indexes, surveys and reports use the same indicators (e.g. education level of population, R&D expenditures, patent activity), which can be seen in Figure 3. This lack of diversity among indexes creates an “echo chamber” effect, in which the same information is repeated time and time again. The Council notes that due to the homogeneity among indexes, it is difficult to say there is anything particularly new to be learned from studying them.

6
Figure 3. Matrix of innovation indexes and indicators

7
By identifying and discussing issues evident from a close examination of the world’s existing indexes of innovation, the Global Agenda Council on the Economics of Innovation identified areas ripe for improvement that can lead to a more detailed comprehension on how input and output innovation indicators scale up innovation. The last issue evident to the Council upon its examination is that there is little data on innovation at the regional or city level. The scope of nearly all indexes, surveys and reports is broad, covering innovation at the country level. Although it is unquestionably important to identify innovation indicators enabling comparison across different countries as a whole, and naturally headline-grabbing to proclaim that country A is more innovative than country B, in reality such indexes are mostly about the headlines, because innovation is a highly localized phenomenon requiring much more granular and faceted consideration than can be given at a national level. FCCYT’s STI 2013, which originated from Mexico and was one the few reports that focused on innovation at the regional level, shows how an emphasis at the country or international level does not fully capture innovation, missing innovation’s sensitivity to regional and city level characteristics. Reaching out to the Mexican government and interacting with members of FCCYT enabled the Council to better understand how Mexico thinks about innovation relative to other countries. The response received from the Mexican government underscores that because there are strong differences in the characteristics and economic profiles of different regions, there is a corresponding need for innovation indexes and indicators capable of capturing those nuances to develop strategies and practices aimed at improving innovation performance on a local level. To compare how various other exemplary countries think about innovation, the Council reached out to additional developing and developed countries, similar to its outreach in Mexico – Kenya, Norway and the Philippines. The feedback obtained from Kenya was that although the Kenyan government finds innovation indexes generally applicable to its country’s development, indexes would be more useful if they were able to offer specific recommended actions a country should take to increase its innovative potential. Moreover, input from Kenya indicated that innovation indicators should include diasporic measurements of innovation, as well as measurements of lower level innovation (i.e. less tech-intensive indicators). The Kenyan government also believes a key determinant to innovation is meeting community (consumer) needs, and the Council observes that measurement of this infrastructural element may be helpful in measuring innovation generally in developing countries like Kenya. In Norway, while the government looks at international innovation indexes, it is not concerned about specific scores or about taking action based on results from innovation indexes, as Norway consistently tends to perform near the top of such indexes. Norway focuses on innovation at the firm level, surveying firms with more than five employees to better understand firm performance. For the Philippines, the government is interested in diasporic measurements as accelerants to innovation. Additionally, while the government looks at innovation indexes such as Tufts University’s Digital Evolution Index (2015), it is more interested in understanding what specific actions it can take to strengthen its innovative propensity and performance. In addition to conducting interviews in various countries to understand what these countries’ key concerns are about innovation, the Council also developed a new innovation index with the aim of improving the measurement of innovation capabilities in a results-oriented fashion. The intent of this new index is to emphasize output indicators over input indicators, as well as to look at the relationship between output and input indicators (how well input indicators correlate to output indicators). The Council’s findings from this innovation index are discussed below.

8
Key Findings: Output-based Innovation Index The Council created its new output-based innovation index to develop a clearer understanding of the factors that stimulate innovative activity in a given country. The output-based innovation index measures the performance of three output indicators and five input indicators. The indicators, listed below in Figure 4, were selected, in the case of the output indicators, as all of the pure output indicators for which substantial data is available across large numbers of countries, and in the case of the input indicators, as those used most heavily across all of the indexes the Council identified in its Leading Indicators of Innovation study (see Figure 3). Figure 4. Output and input indicators in innovation index Indicator Type Indicator Output R&D Expenditures Output Researchers in R&D Output Patent Applications (from Residents) Input Foreign Direct Investment: Inward and Outward Flows and Stocks Input Graduates from Tertiary Education Input Employment in Knowledge – Intensive Activities Input Licenses and Patent Revenues from Abroad Input High – Tech Exports
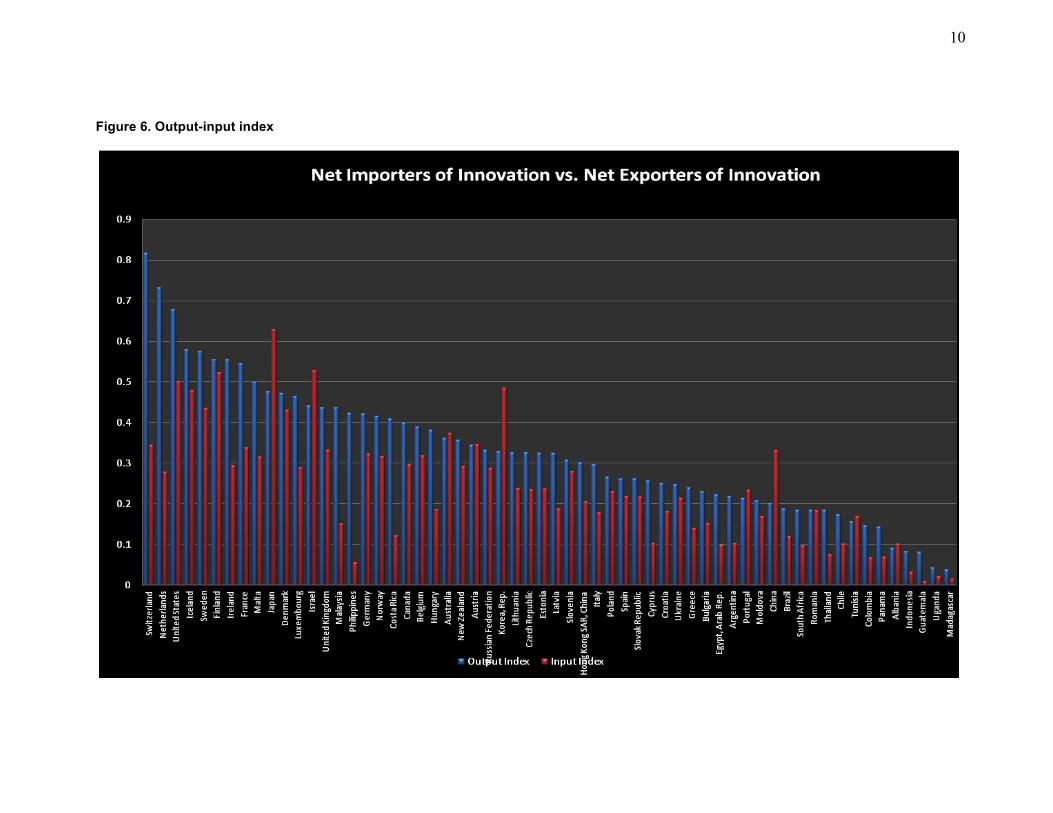
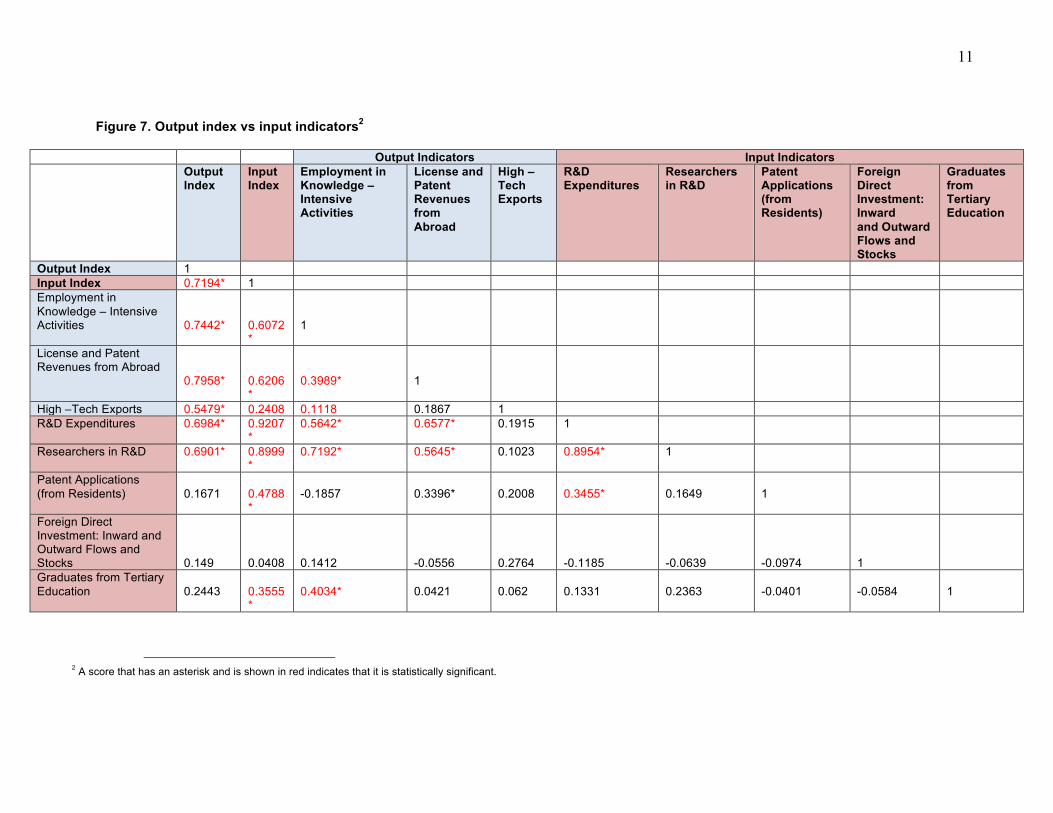
From the output indicators, the Council first created an output index that ranked how well 60 countries (the top 20 economies as well as representative countries from different geographic regions) performed across the output indicators, as shown below in Figure 5. Data for these 60 countries was obtained from various index sources in Figure 1 and Figure 1a. Of the 60 countries, Switzerland ranks first, having the best output index performance, while Madagascar takes last place. The Council then created an input index that ranked how well the same 60 countries performed on the selected input indicators. In the input index, Japan ranks first while Guatemala takes last place. Figure 6 compares how countries scored on the output index versus the input index. After constructing the output index and the input index, the Council then correlated the output index with each input indicator to determine which input indicators may best predict innovation performance. The results are shown in Figure 7. For example, if an input indicator such as “Employment in Knowledge – Intensive Activities” gives a high score to a country that also has a high output index score, then the two are well correlated, tending to show the input indicator may measure innovation propensity well for that country.

9
Figure 5. Output index
10
Figure 6. Output-input index
11
Figure 7. Output index vs input indicators2
Output Indicators Input Indicators Output
Index Input Index
Employment in Knowledge – Intensive Activities
License and Patent Revenues from Abroad
High –Tech Exports
R&D Expenditures
Researchers in R&D
Patent Applications (from Residents)
Foreign Direct Investment: Inward and Outward Flows and Stocks
Graduates from Tertiary Education
Output Index 1 Input Index 0.7194* 1 Employment in Knowledge – Intensive Activities
0.7442*
0.6072*
1
License and Patent Revenues from Abroad
0.7958*
0.6206*
0.3989*
1
High –Tech Exports 0.5479* 0.2408 0.1118 0.1867 1 R&D Expenditures 0.6984* 0.9207
* 0.5642* 0.6577* 0.1915 1
Researchers in R&D 0.6901* 0.8999*
0.7192* 0.5645* 0.1023 0.8954* 1
Patent Applications (from Residents)
0.1671
0.4788*
-0.1857
0.3396*
0.2008
0.3455*
0.1649
1
Foreign Direct Investment: Inward and Outward Flows and Stocks
0.149
0.0408
0.1412
-0.0556
0.2764
-0.1185
-0.0639
-0.0974
1
Graduates from Tertiary Education
0.2443
0.3555*
0.4034*
0.0421
0.062
0.1331
0.2363
-0.0401
-0.0584
1
2 A score that has an asterisk and is shown in red indicates that it is statistically significant.

12
From the above data and correlations, the Council made three observations: 1. A generally weak relationship between the input indicators and the output index 2. A dearth of output indicator data 3. The delta between a country’s scores on the output index and input index can aid in
understanding that country’s innovation performance The first observation is that the input indicators included in the Council’s index – which are the input indicators most widely used by existing well-documented innovation indexes – likely do not measure innovation well. The data in Figure 7 shows that only two input indicators correlate well with the output index: R&D expenditures and researchers in R&D. The correlations of the other three input indicators (patent applications, FDI, and graduates from tertiary education) with the output index are all weak, and not statistically significant. The Council notes that this finding tends to show that the identified input indicators, in general, may not accurately predict innovation. Interestingly, however, when countries are grouped into regions (i.e. Europe, Central Asia, sub-Saharan Africa), the data in Figure 7 shows better predictive capability as between the input indicators and the output index. Another observation is that there is a significant need for more innovation output indicators. This observation is in line with the Council’s previous finding that existing innovation indexes exhibit an overemphasis on input indicators as opposed to output indicators. In fact, out of the seven output indicators the Council identified from its examination of existing indexes, surveys and reports, only three had enough data to measure across a substantial number of countries, and thus to be included in the Council’s output index. In addition, there is also a need for more diverse output indicators. The Council found that the output index, like other indexes of innovation, suffers from being rather tech-biased – of the three output indicators in the index, two focus on technology (employment in knowledge – intensive activities and high-tech exports). As a result, the Council notes that more is needed to identify diverse outputs of innovation as well as to collect strong output indicator data for a significant number of countries. The last of the Council’s observations is that the delta between a country’s output index score and input index score provides insight into how well a country implements innovation. For example, a study of Figure 6 shows that although Japan has a higher output index and input index score than Malaysia, it is difficult to interpret what those two scores suggest regarding how well Japan versus Malaysia is performing. However, the output and input index score deltas for a single country, such as Malaysia, suggest that some countries are better than others at translating innovation inputs, which may not necessarily be their own, into outputs. A high output-to-input ratio would tend to indicate such innovation translation efficiency. The Council also notes in this regard that sensitivity to a country’s level of development is needed to interpret the import of various input-to-output levels. For example, a country such as China, which has a higher input index score than output index score, is at a different level of development versus a country like Vietnam, and different deltas may well make sense for these two countries based on their respective levels of development. Next Steps By studying new approaches to grouping output and input innovation indicators, the Global Agenda Council on the Economics of Innovation has identified issues that should be addressed to develop a better understanding of the extent to which input and output indicators measure and/or predict innovation. Based on its observations, the Council recognizes that while indexes can shed some light into the measurement of innovation, a shift in focus toward action is called for. In fact, after reaching out to government leaders in several countries (e.g. Kenya and the Philippines), similar to its outreach in Mexico, the Council found that although these countries find indexes of innovation
13
helpful, they are more interested in knowing what concrete steps they should take to increase their innovative propensity and performance. As a next step, the Council is working to obtain time series data from key indexes it identified in its leading indicators of innovation study. Using this data, the Council aims to identify instances where countries have accelerated in their innovation ranking performance (i.e. Country A moving from #50 in 1979 to #10 in 1992 to #3 in 1996). In doing so, the Council’s goal is to analyse what caused these accelerations and recommend to countries, based on their current level of development, steps they can take to accelerate, which steps have been successful for like-situated countries in the past. Through this initiative, the Council believes that it can help countries, regions and cities improve their innovative propensity and performance.
World Economic Forum91–93 route de la CapiteCH-1223 Cologny/GenevaSwitzerland
Tel.: +41 (0) 22 869 1212Fax: +41 (0) 22 786 2744
The World Economic Forum, committed to improving the state of the world, is the International Organization for Public-Private Cooperation. The Forum engages the foremost political, business and other leaders of society to shape global, regional and industry agendas.