global air navigation services performance report
TRANSCRIPT

GLOBAL AIR NAVIGATION SERVICES PERFORMANCE REPORT2015 − 2019 ANSP Performance Results
canso.orgProduced by the Global Benchmarking WorkgroupCANSO | OCTOBER 2021

2 GLOBAL AIR NAVIGATION SERVICES PERFORMANCE REPORT
ACKNOWLEDGEMENTSThis publication is a product of the CANSO Global Benchmarking Workgroup, produced with the assistance of Egis. The workgroup is grateful for the continued analytical support provided by Egis.
We also thank EUROCONTROL and the Performance Review Unit (PRU) for their collaboration in providing the data from the ANSP Cost Effectiveness (ACE) Report. This has enabled our CANSO Air Navigation Services Performance Report to continue to reflect a broader scope of air navigation service providers.
The workgroup would also like to thank its Chair, Diána Galgóczi of HungaroControl, for her leadership and commitment over the last year.
© Copyright CANSO 2021
All rights reserved. No part of this publication may be reproduced, or transmitted in any form, without the prior permission of CANSO. This paper is for information purposes only. While every effort has been made to ensure the quality and accuracy of information in this publication, it is made available without any warranty of any kind.
3 GLOBAL AIR NAVIGATION SERVICES PERFORMANCE REPORT
CONTENTSACKNOWLEDGEMENTS ............................................................................................................................................................................................... 2
FOREWORD ........................................................................................................................................................................................................................ 5
EXECUTIVE SUMMARY ..................................................................................................................................................................................................6
INTRODUCTION ................................................................................................................................................................................................................11
2019 INDUSTRY TRENDS ............................................................................................................................................................................................. 13
ANSP CASE STUDIES ..................................................................................................................................................................................................... 15
RELATED CANSO BENCHMARKING ACTIVITIES ...........................................................................................................................................20
LIST OF KEY PERFORMANCE INDICATORS .................................................................................................................................................... 21
METHODOLOGY...............................................................................................................................................................................................................22
2019 PARTICIPATION .....................................................................................................................................................................................................25
2019 PERFORMANCE DATA ......................................................................................................................................................................................32
ANNEX 1: IMPACT OF COVID-19 ON 2019 PERFORMANCE ....................................................................................................................56
ANNEX 2: DATA DEFINITIONS ..................................................................................................................................................................................60
ANNEX 3: KEY PERFORMANCE INDICATORS ..................................................................................................................................................62
ANNEX 4: CONTEXTUAL DATA .................................................................................................................................................................................63
ANNEX 5: KPI DATA ........................................................................................................................................................................................................97
ANNEX 6: EXCHANGE RATES ................................................................................................................................................................................... 123
ANNEX 7: ACRONYMS AND ABBREVIATIONS ............................................................................................................................................... 125
ANNEX 8: SOURCES ...................................................................................................................................................................................................... 126
LIST OF TABLES:
TABLE 1 - CANSO GBWG PUBLIC REPORT PARTICIPATION ...................................................................................................................25
TABLE 2 - ANSP REPORTING PERIODS. .............................................................................................................................................................28
TABLE 3 – PARTICIPATING ANSPS’ IFR FLIGHT HOURS ...........................................................................................................................30
LIST OF FIGURES:
FIGURE 1: AVERAGE PERCENTAGE CHANGE FOR ALL CANSO GBWG KPIS BETWEEN 2018 AND 2019 ...................... 10
FIGURE 2 - HUNGAROCONTROL'S HISTORICAL ATCO PRODUCTIVITY AGAINST IFR FLIGHT HOURS AND ATCO HOURS ................................................................................................................................................................................. 15

4 GLOBAL AIR NAVIGATION SERVICES PERFORMANCE REPORT
FIGURE 3 - HUNGAROCONTROL'S HISTORICAL ATCO HOURS AND NUMBER OF ATCOS IN OPERATIONS ............. 16
FIGURE 4 - HUNGAROCONTROL'S HISTORICAL ANNUAL WORKING HOURS PER ATCO IN OPS ................................... 16
FIGURE 5 - HUNGARY'S ACTUAL ATFM DELAY (MINUTES PER FLIGHT) ......................................................................................... 17
FIGURE 6 - NUMBER OF OVERFLIGHT MOVEMENTS IN 2018 AND 2019......................................................................................... 18
FIGURE 7 - ATCOS IN OPS HOUR PRODUCTIVITY AT NAV PORTUGAL (CONTINENTAL) OVER THE YEARS 2015-2019 ............................................................................................................................................................. 19
FIGURE 8 - COST PER IFR FLIGHT HOUR (USD) ............................................................................................................................................32
FIGURE 9 - ATCOS IN OPS EMPLOYMENT COST PER ATCOS IN OPS HOUR (USD) ..................................................................34
FIGURE 10 - ATCOS IN OPS EMPLOYMENT COST PER ATCOS IN OPS HOUR, PPP ADJUSTED (USD) ...........................36
FIGURE 11 - ATCOS IN OPS HOUR PRODUCTIVITY .......................................................................................................................................37
FIGURE 12 - COST EXCLUDING ATCOS IN OPS EMPLOYMENT COSTS PER IFR FLIGHT HOUR (USD)............................38
FIGURE 13 - PROPORTION OF TOTAL COSTS MADE UP OF ATCO IN OPS EMPLOYMENT COSTS (USD) .................... 40
FIGURE 14 - ANNUAL ATCO IN OPS EMPLOYMENT COST (USD) ......................................................................................................... 41
FIGURE 15 - ANNUAL ATCO IN OPS EMPLOYMENT COST (USD) - PPP ADJUSTED ..................................................................43
FIGURE 16 - ANNUAL WORKING HOURS PER ATCO IN OPS................................................................................................................. 44
FIGURE 17 - IFR HOURS PER ATCO IN OPS ......................................................................................................................................................45
FIGURE 18 - RATIO OF FRONTLINE SERVICE STAFF TO ATCO IN OPS..............................................................................................46
FIGURE 19 - COST PER IFR FLIGHT HOUR (USD)...........................................................................................................................................47
FIGURE 20 - ATCOS IN OPS EMPLOYMENT PER ATCOS IN OPS HOUR (USD) ........................................................................... 48
FIGURE 21 - ATCOS IN OPS EMPLOYMENT PER ATCOS IN OPS HOUR (USD) - PPP ADJUSTED .......................................49
FIGURE 22 - ATCOS IN OPS HOUR PRODUCTIVITY .....................................................................................................................................50
FIGURE 23 - COST EXCLUDING ATCOS IN OPS EMPLOYMENT COSTS PER IFR FLIGHT HOUR (USD) ........................... 51
FIGURE 24 - PROPORTION OF TOTAL COSTS MADE UP OF ATCO IN OPS EMPLOYMENT COSTS (USD) ....................52
FIGURE 25 - COST PER IFR FLIGHT HOUR (USD) ..........................................................................................................................................53
FIGURE 26 - EMPLOYMENT COST OF ATCOS IN OPS AS A PERCENTAGE OF TOTAL COST.................................................54
FIGURE 27 - NUMBER OF COVID-19 CASES REPORTED WEEKLY BY WHO REGION, AND GLOBAL DEATHS, 30 DECEMBER TO 04 OCTOBER .........................................................................................56
FIGURE 28 - PERCENTAGE CHANGE IN AIRCRAFT MOVEMENTS BY REGION, DURING 2020 ...........................................57
FIGURE 29 - ANSPS WITH REPORTING PERIODS RUNNING INTO 2020.........................................................................................58
FIGURE 30 - CANSO ANS PERFORMANCE FRAMEWORK .......................................................................................................................62

5 GLOBAL AIR NAVIGATION SERVICES PERFORMANCE REPORT
FOREWORDThe past 20 months have been one of the most difficult periods for aviation by any measure or benchmark. The collapse of traffic volumes due to state-imposed travel restrictions aimed at controlling the spread of the pandemic and new virus variants has continued to have devastating effects. The impact has extended far beyond the period which anybody first believed possible at the beginning of the crisis in early 2020. While the roll-out of vaccination programmes progress at differing rates internationally, it is increasingly apparent that things may not return to ‘normal’ for some time – and that ‘normal’ may not look like how it used to.
As our eyes begin to shift away from short-term crisis management towards longer term planning and recovery, there are still two key questions to address: what will ‘normal’ look like and what can we do to increase our resilience to similar crises in the future?
The truth is there is still a lot of uncertainty surrounding these questions. One thing most of the industry can agree on, however, is that it is vital to unpick the lessons learnt from the past two years and agree on how we baseline our performance going forward. To provide evidence to inform this and build a global picture of how ANSPs were performing before, during and (eventually) after the pandemic, we will need data – and this is where the work of the CANSO Global Benchmarking Workgroup (GBWG) can help.
This year, CANSO celebrates the eleventh edition of the CANSO Global Air Navigation Services Performance Report. The document is a key output of the work of the GBWG and acts as a tool for ANSPs to compare, contrast and identify good practices in air navigation services (ANS) performance, particularly in the areas of cost efficiency and ATCO productivity. The report has a loyal and significant list of contributors from all across the globe, including 52 ANSPs for this edition. It is an excellent example of the fruits of long-term international collaboration – an ethos that lies at the very heart of CANSO’s strategy and ambition.
This year also marks the second edition of the report where data has been incorporated from that published by EUROCONTROL’s Performance Review Unit (PRU). Inclusion of a wider set of ANSP results enhances the value of the report by presenting an even more global and comprehensive view of ANS performance, which is perhaps more important now than ever before.
Although the impacts of the pandemic will not be reflected in the data published in this report, it does present the performance of 2019. This is commonly used as a ‘baseline year’ for assessing the impact of the pandemic on performance. The findings of this report suggest that perhaps 2019 was more unusual than first thought, perhaps calling into question whether this is the best baseline for comparison of future performance.
I would like to thank the CANSO GBWG and all the participating CANSO members. I also thank EUROCONTROL for their collaboration; this has made such a difference in increasing the scope, scale and utility of the report. Finally, I would like to thank Egis for their efforts over the past nine years in data collection and analysis, and their continued dedication in supporting CANSO and the GBWG with this work.
Simon Hocquard Director General CANSO

6 GLOBAL AIR NAVIGATION SERVICES PERFORMANCE REPORT
Key findings of the report 1
Cost Efficiency
Increases in costs outweighed increases in traffic in 2019, in contrast to 2018
Average global percentage change – Total cost per IFR flight hour (2018-2019):
1 For identified results supporting these key findings, see 2019 performance data section from page 32 onwards. Please note, Airservices Australia and SANS submit data that is used to calculate the global trends within this document’s Executive Summary section but their data is not presented in the graphs included in the rest of this document. For this reason, there are also small differences between the averages presented in both sections.
EXECUTIVE SUMMARYEVER IMPROVINGThe CANSO Global Air Navigation Services (ANS) Performance Report is produced annually by CANSO’s Global Benchmarking Workgroup (GBWG) with the support of Egis.
This year is the second year that through agreement with EUROCONTROL’s Performance Review Unit (PRU), data regarding European ANSPs taken from the ATM Cost-Effectiveness (ACE) Benchmarking Report has been included. The report now provides data for 52 ANSPs, who together are responsible for the management of over 65% of global air traffic.
In line with CANSO’s ambitions for the Global ANS Performance Report to reflect a broader picture of performance, data been provided this year by the CANSO Human Resources Workgroup on key human resources metrics and trends. Collaboration between CANSO workgroups aims to enable interdependencies between data to be analysed and ultimately drive better insights into the reasons behind performance trends.
OVERVIEW OF PERFORMANCE TRENDSThis report contains performance indicators for identified ANSPs for the year 2019, along with trend data between 2015 and 2019. The data presented in this report for the European ANSPs is sourced from the PRU of EUROCONTROL and is consistent with the figures published in the ATM Cost-effectiveness (ACE) Benchmarking Report. ACE Report data collected by the PRU since 2002 is available on the ACE dashboard.
In an industry that is still experiencing the impacts of the COVID-19 pandemic, 2019 is regularly referred to as a reference year for normal traffic levels. However, from our analyses it can be seen that a number of key patterns were reversed in 2019. This is primarily due to a slowing of traffic growth across our participating ANSPs; the mean traffic growth in 2019 was 1.6%, whereas in 2018 it was 4.6%. The key findings of the report detailed below show that ANSPs’ cost bases cannot be easily scaled to respond to the slowing traffic growth.
58% 40%
42% 60%in continental total cost per IFR flight hour
in oceanic total cost per IFR flight hour
of participating ANSPs experienced an increase
of participating ANSPs experienced an increase
of participating ANSPs experienced a decrease
of participating ANSPs experienced a decrease
CONTINENTAL: +4.8% OCEANIC: +0.8%
7 GLOBAL AIR NAVIGATION SERVICES PERFORMANCE REPORT
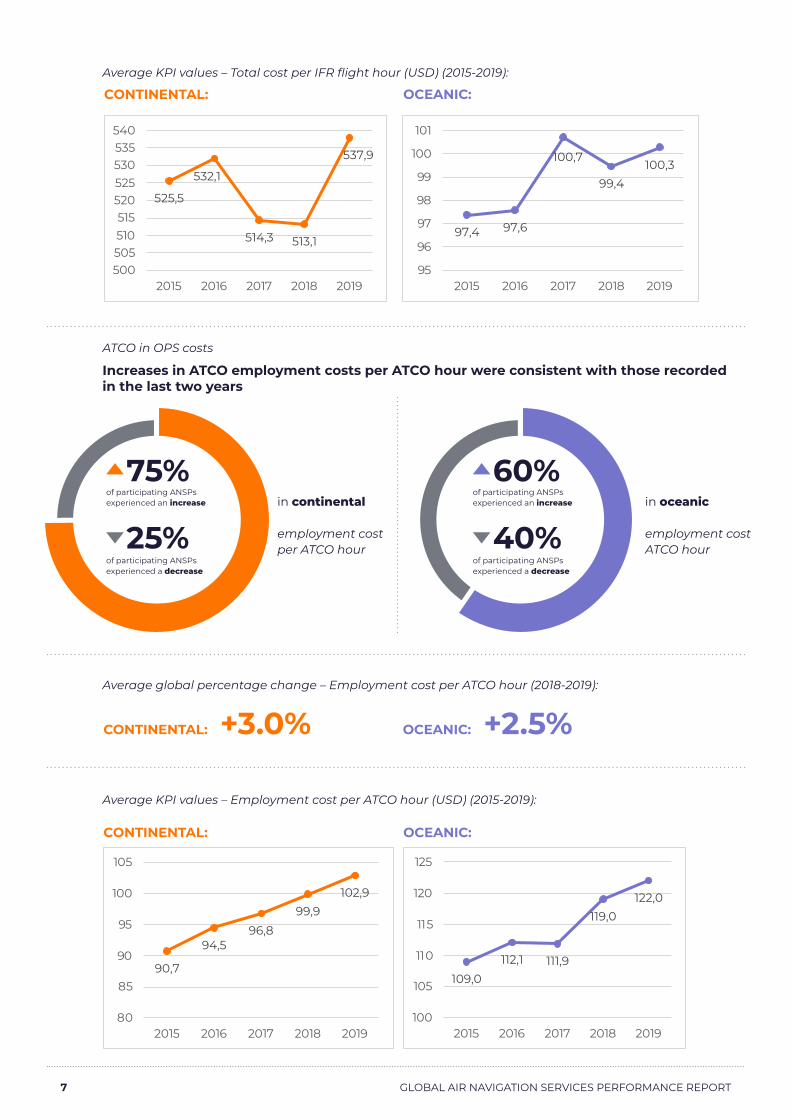
Average KPI values – Total cost per IFR flight hour (USD) (2015-2019):
ATCO in OPS costs
Increases in ATCO employment costs per ATCO hour were consistent with those recorded in the last two years
Average global percentage change – Employment cost per ATCO hour (2018-2019):
Average KPI values – Employment cost per ATCO hour (USD) (2015-2019):
CONTINENTAL:
CONTINENTAL:
OCEANIC:
OCEANIC:
97,4 97,6
100,7
99,4100,3
95
96
97
98
99
100
101
2015 2016 2017 2018 2019
525,5
532,1
514,3 513,1
537,9
500505510515
520525530535540
2015 2016 2017 2018 2019
75% 60%
25% 40%in continental employment cost per ATCO hour
in oceanic employment cost ATCO hour
of participating ANSPs experienced an increase
of participating ANSPs experienced an increase
of participating ANSPs experienced a decrease
of participating ANSPs experienced a decrease
CONTINENTAL: +3.0% OCEANIC: +2.5%
90,7
94,596,8
99,9102,9
80
85
90
95
100
105
2015 2016 2017 2018 2019
109,0112,1 111,9
119,0122,0
100
105
110
115
120
125
2015 2016 2017 2018 2019

8 GLOBAL AIR NAVIGATION SERVICES PERFORMANCE REPORT
ATCO in OPS hour productivity
The rate of ATCO productivity increase slowed
27% of ATCO productivity 2018-2019 increases were >4%, compared to 61% between 2017-2018
Average global percentage change – ATCO productivity (2018-2019):
Average KPI values – ATCO productivity (2015-2019):
60% 50%
40% 50%in continental ATCO productivity hour
in oceanic ATCO productivity hour
of participating ANSPs experienced an increase
of participating ANSPs experienced an increase
of participating ANSPs experienced a decrease
of participating ANSPs experienced a decrease
CONTINENTAL: +0.9%
CONTINENTAL:
OCEANIC: +0.5%
OCEANIC:
0,670,68
0,71
0,74 0,74
0,62
0,64
0,66
0,68
0,7
0,72
0,74
0,76
2015 2016 2017 2018 2019
3,46
3,59
3,663,64 3,65
3,35
3,4
3,45
3,5
3,55
3,6
3,65
3,7
2015 2016 2017 2018 2019

9 GLOBAL AIR NAVIGATION SERVICES PERFORMANCE REPORT
Other costs
In contrast to the previous two years, costs excluding ATCO in OPS employment costs per IFR flight hour increased for the majority of ANSPs
Average global percentage change – Other costs per IFR flight hour (2018-2019):
Average KPI values – Other costs per IFR flight hour (USD) (2015-2019):
65% 60%
35% 40%in continental other costs per IFR flight hour
in oceanic other costs per IFR flight hour
of participating ANSPs experienced an increase
of participating ANSPs experienced an increase
of participating ANSPs experienced a decrease
of participating ANSPs experienced a decrease
CONTINENTAL: +5.2%
CONTINENTAL:
OCEANIC: -1.1%
OCEANIC:
385,99
387,40
374,12 373,6
393,08
360
365
370
375
380
385
390
395
2015 2016 2017 2018 2019
60,159,2
67,265,4
64,7
54
56
58
60
62
64
66
68
2015 2016 2017 2018 2019
10 GLOBAL AIR NAVIGATION SERVICES PERFORMANCE REPORT
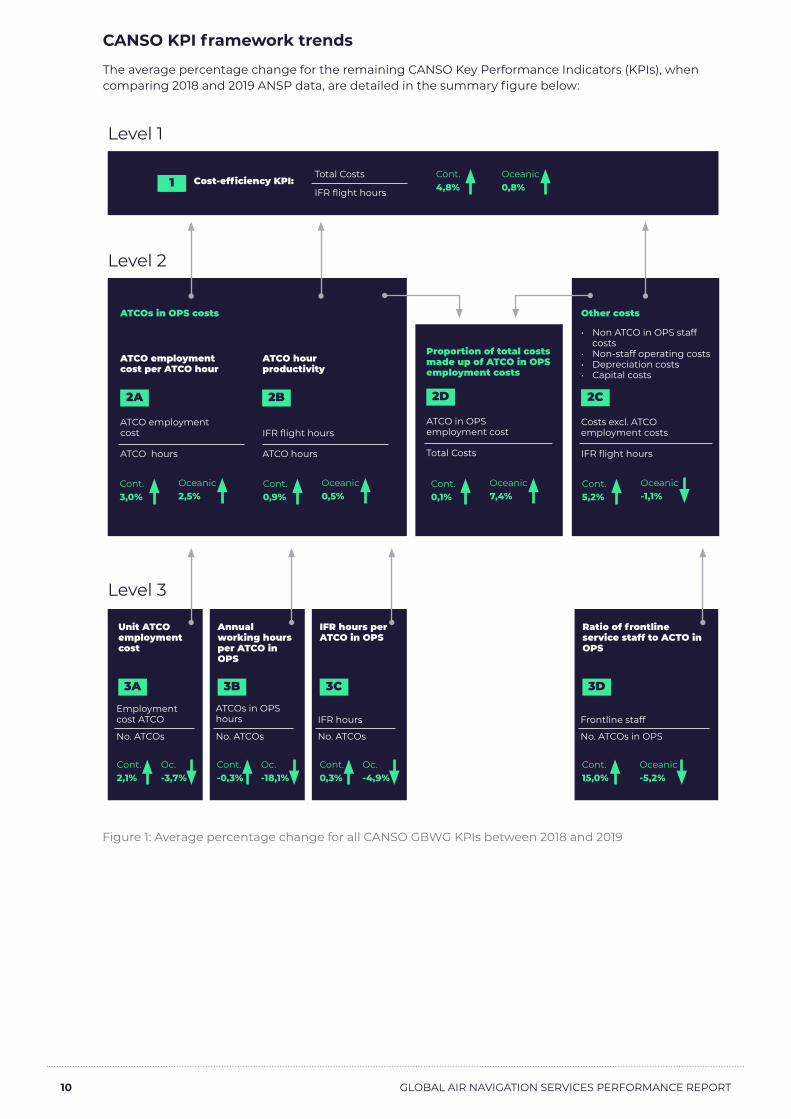
CANSO KPI framework trends
The average percentage change for the remaining CANSO Key Performance Indicators (KPIs), when comparing 2018 and 2019 ANSP data, are detailed in the summary figure below:
Figure 1: Average percentage change for all CANSO GBWG KPIs between 2018 and 2019
Level 1
Level 2
Level 3
1
2A
3A 3B 3C 3D
2D 2C2B
Cost-efficiency KPI:
ATCOs in OPS costs Other costs
ATCO employment cost per ATCO hour
Unit ATCO employment cost
Annual working hours per ATCO in OPS
IFR hours per ATCO in OPS
Ratio of frontline service staff to ACTO in OPS
Proportion of total costs made up of ATCO in OPS employment costs
ATCO employment cost
Employment cost ATCO
ATCOs in OPS hours IFR hours Frontline staff
ATCO in OPS employment cost
Costs excl. ATCO employment costs
• Non ATCO in OPS staff costs
• Non-staff operating costs• Depreciation costs• Capital costs
IFR flight hours
ATCO hours
No. ATCOs No. ATCOs No. ATCOs No. ATCOs in OPS
Total Costs IFR flight hoursATCO hours
ATCO hour productivity
Total Costs
IFR flight hours
Cont.4,8%
Cont.3,0%
Cont.0,9%
Cont.0,1%
Cont.5,2%
Cont.2,1%
Cont.-0,3%
Cont.0,3%
Cont.15,0%
Oceanic0,8%
Oceanic2,5%
Oceanic0,5%
Oceanic7,4%
Oceanic-1,1%
Oc.-3,7%
Oc.-18,1%
Oc.-4,9%
Oceanic-5,2%

11 GLOBAL AIR NAVIGATION SERVICES PERFORMANCE REPORT
COMPARING ANSP PERFORMANCEAir navigation service providers (ANSPs) are responsible for managing global air traffic safely, efficiently and cost-effectively. This includes managing and enhancing airspace capacity through improvements to infrastructure and technology, and improving efficiency through a skilled and productive workforce and an innovative approach to airspace management.
The performance of the air navigation system impacts stakeholders throughout the aviation ecosystem. From boosting connectivity and minimising delays, to upholding the highest standard of safety in aviation, efficient, effective air navigation services are a critical component of a high-performance aviation industry. To that end, CANSO has devised benchmarking exercises that aggregate and review global performance accordingly.
Comparing and benchmarking key financial and productivity indicators enables ANSPs to make informed decisions when pursuing increased cost-effectiveness and productivity, without impacting safety – the industry’s top priority. It helps ANSPs to work together to address both their own performance and that of the ATM industry worldwide. The CANSO Global ANS Performance Report highlights global performance trends and identifies performance gaps, acting as a basis for collective improvement.
IMPACT OF COVID-19 ON PERFORMANCEThis report focuses on 2015-2019 performance data, however, the reporting periods of participating ANSPs are not aligned in all instances. For a small number whose reporting periods run into the first part of 2020, data has been impacted by the drop in traffic caused by the COVID-19 pandemic. This must be taken into context when interpreting the trends of those affected ANSPs included in the 2019 Performance Data section and in comparing the performance of ANSPs whose reporting periods matches the calendar year with those whose may include months with COVID-19 traffic impacts. For the full analysis, please see Annex 1.
INTRODUCTIONMEASURING COST EFFICIENCY AND PRODUCTIVITYCost efficiency and productivity are two key performance indicators of air navigation services that enable this monitoring of performance. They demonstrate how ANSPs are delivering value and serve as indicators of operational efficiency. The CANSO ANS Performance Framework identifies the factors that determine cost-efficiency and productivity, including employment costs, hours worked and other costs, and is used to create a clear, common model for understanding global ANS performance. Understanding performance is critical as a means to inform and navigate the marked changes to the industry caused about the COVID-19 pandemic.
GLOBAL AIR NAVIGATION SERVICES PERFORMANCE REPORTThis year’s Global Air Navigation Services Performance Report contains performance indicators for identified ANSPs for the year 2019, along with trend data between 2015 and 2019.
ANSPs submitting to CANSO have also provided contextual comments, including any exceptional events during the year or items that may impact the comparability of their data. Additional comments on important events are included within the contextual data, providing insight into the results of the participating ANSPs.
The detailed results for each ANSP can be found in the CANSO Global Benchmarking Workgroup Performance Dashboard, which is available to participating GBWG members.
12 GLOBAL AIR NAVIGATION SERVICES PERFORMANCE REPORT
INCORPORATION OF PRU DATA A key objective for CANSO and the members of CANSO’s Global Benchmarking Workgroup (GBWG) is to continue to increase the global coverage of the data included in the annual Performance Report. To support this, for the second year, CANSO, with the agreement of EUROCONTROL, has incorporated public data collected by EUROCONTROL’s Performance Review Unit (PRU) to complete the representation of European ANSPs in the dataset.
It should be noted that while the raw data extracted from the ACE Report is directly comparable, the final KPIs expressed in the CANSO report are not directly comparable to those reported in the ACE report.
Primarily, this is because the KPIs use different inputs. In particular, the CANSO report uses IFR flight hours and extracts “total flight hours controlled by the ANSP” as a comparable data point from the ACE dataset, while the ACE Report uses “composite flight hours”. These comparable data points were validated as part of a comparison exercise undertaken by Egis, which was presented to the GBWG at GBWG/32 in Tokyo.
Differences in indicators between the two reports, go beyond the use of a different flight hour measurement. Two key examples are highlighted below:
⁃ CANSO’s Performance Report converts all cost data into USD instead of EURO
⁃ CANSO’s Performance Report primarily uses Organisation for Economic Co-operation and Development (OECD) as a source for exchange rate, inflation rate and PPP information, whereas EUROCONTROL’s ACE Report uses a combination of EUROSTAT and IMF data.
European GBWG members have been allowed to request, with justification, to use the GBWG submission instead. For further details please see Global Air Navigation Services Performance Report 2015-2019: Participation.

13 GLOBAL AIR NAVIGATION SERVICES PERFORMANCE REPORT
2019 INDUSTRY TRENDS
Passenger numbers in emerging markets grew +3.9%Passenger numbers in advanced economies grew
+3.1%
Traffic at the world’s 20 busiest airports grew by
1.7% in 2019, down from 4.7% in 2018.
+1.7% in Aircraft Movements in 2019 (+3.1% in 2018)
Air cargo volumes declined by
3.2% in 2019. Compared to a 3.4% growth in 2018
Global passenger growth of
3.6% in all regions. Down from 6.4% in 2018.
Movement and passenger number growth resilient
RPK ASK 0.7% increase in load factor / =
Demand continued to rise faster than supply
RPK rising more than ASK
Increase in passenger numbers driven predominantly by
Asia Pacific region Despite the moderation in growth, almost 30 million journeys added in China alone
China’s domestic market showed the fastest growth in passenger numbers by 5.8%
Load factors reached a record 82.6%.
Passenger numbers rose to almost 4.5 billion
14 GLOBAL AIR NAVIGATION SERVICES PERFORMANCE REPORT
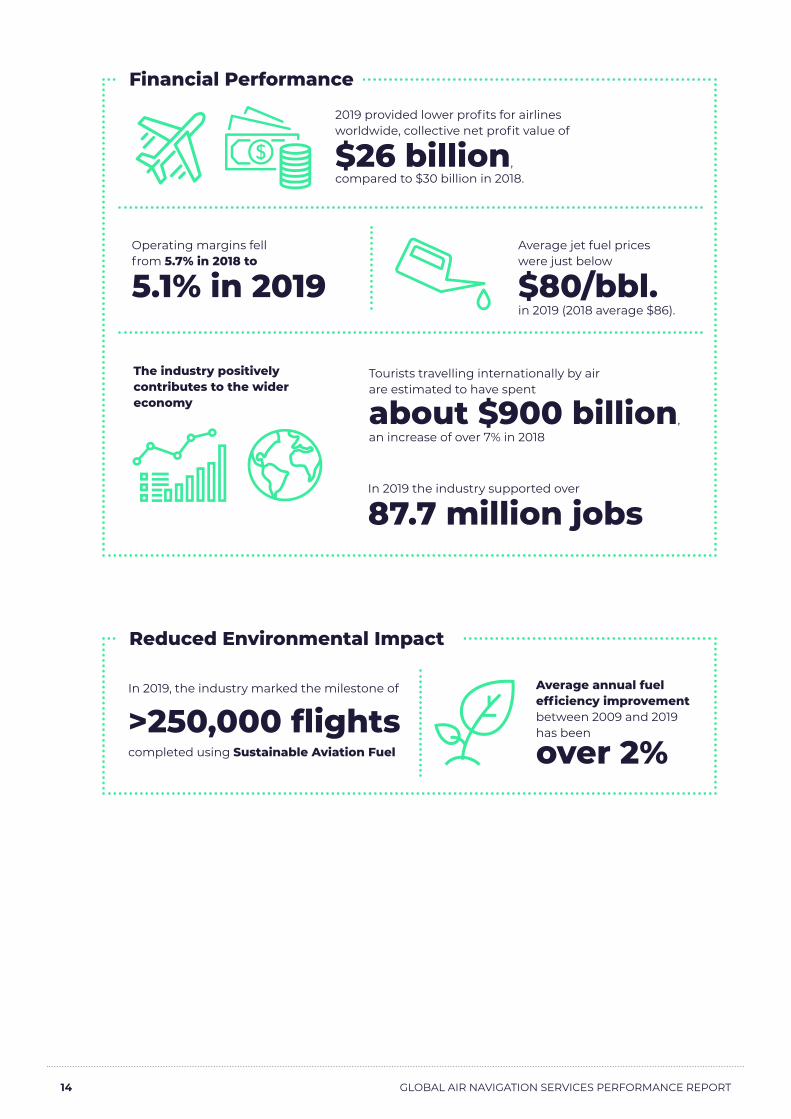
Financial Performance
Reduced Environmental Impact
2019 provided lower profits for airlines worldwide, collective net profit value of
$26 billion, compared to $30 billion in 2018.
Operating margins fell from 5.7% in 2018 to
5.1% in 2019
Tourists travelling internationally by air are estimated to have spent
about $900 billion, an increase of over 7% in 2018
In 2019 the industry supported over
87.7 million jobs
Average jet fuel prices were just below $80/bbl. in 2019 (2018 average $86).
The industry positively contributes to the wider economy
Average annual fuel efficiency improvement between 2009 and 2019 has been
over 2%
In 2019, the industry marked the milestone of >250,000 flights
completed using Sustainable Aviation Fuel

15 GLOBAL AIR NAVIGATION SERVICES PERFORMANCE REPORT
232238
256
282 282277
266276
287280
0,84
0,890,93
0,981,01
0,75
0,80
0,85
0,90
0,95
1,00
1,05
200210220230240250260270280290300
2015 2016 2017 2018 2019
ATC
O p
rod
uct
ivit
y
Hou
rs (0
00
s)
IFR Flight Hours (000) ATCO Hours (000) ATCO productivity
Figure 2 - HungaroControl's historical ATCO productivity against IFR flight hours and ATCO hours
ANSP CASE STUDIESThe following case studies have been kindly provided by HungaroControl and NAV Portugal. The case studies provide a deep dive into the reasons for improved ATCO productivity between 2015-2019.
HUNGAROCONTROL
Background of the Hungarian traffic situation:
Traffic increased significantly due to traffic bypassing Ukraine (after Malaysia Airlines Flight MH17 was shot down over Ukraine in July 2014, and Ukraine closed airspace to all Russian planes and the area was generally considered unsafe by the airlines. Subsequently, a significant amount of bypass traffic appeared in the neighbouring Hungarian airspace).
However, in the performance plan, planned traffic and capacity could not take this into account as it was prepared earlier.
Due to this extra traffic, a continuous increase in productivity can be observed, as a result of the utilisation, optimisation of existing capacities.

16 GLOBAL AIR NAVIGATION SERVICES PERFORMANCE REPORT
277
266
276
287
280
176
171
177
180179
170
172
174
176
178
180
182
250255260265270275280285290
2 015 2 016 2 017 2 018 2 019
NO
OF
ATC
OS
ATC
O H
OU
RS
(00
0S)
ATCO Hours (000) No. of ATCOs
1 573
1 558 1 560
1 596
1 564
1 5501 5551 5601 5651 5701 5751 5801 5851 5901 5951 600
2 015 2 016 2 017 2 018 2 019
HO
UR
S
Annual working hours per ATCO in OPS
Figure 3 - HungaroControl's historical ATCO hours and Number of ATCOs in Operations
Figure 4 - HungaroControl's historical annual working hours per ATCO in OPS
Same trend, different reasons in 2019
In HungaroControl's case, the improvement in ATCO productivity was the consequence of decreasing ATCO hours (while the number of IFR flight hours remained flat) from 2018 to 2019 (highlighted in the charts).
ATCO hours decreased by 3% in 2019 (compared to 2018), and so did the per-ATCO KPI. The reason for this was the introduction of measures related to fatigue risk management (FRM). Consequently, overtime was limited due to the early introduction of this new legislation.
Unfortunately, the improvement of ATCO productivity had a price: the adverse impact to service quality, namely the significant increase in delay minutes. HungaroControl's case is therefore a good reminder that changes in the KPIs should be looked at together with the relevant background information, and interdependencies in different key performance areas should be thoroughly analysed.
17 GLOBAL AIR NAVIGATION SERVICES PERFORMANCE REPORT
0,03 0,07 0,01
0,39
1,61
-0,50
0,00
0,50
1,00
1,50
2,00
2015 2016 2017 2018 2019
Min
ute
s p
er fl
igh
t ra
tio
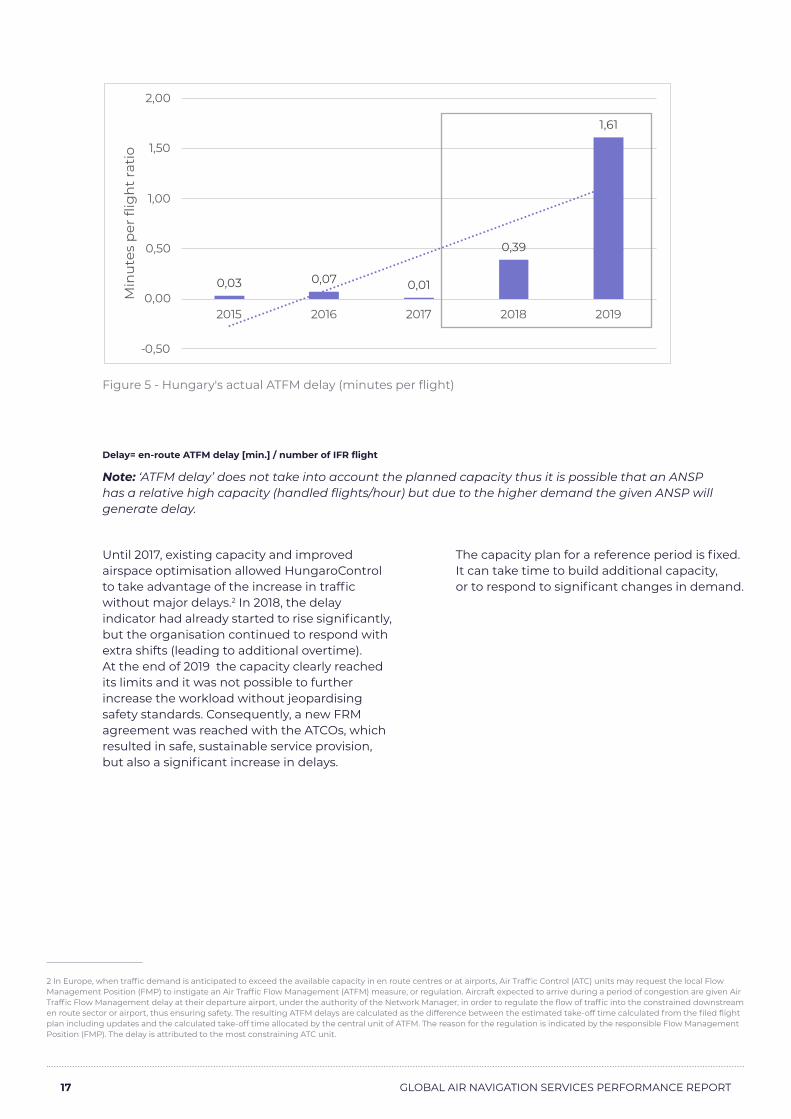
Figure 5 - Hungary's actual ATFM delay (minutes per flight)
2 In Europe, when traffic demand is anticipated to exceed the available capacity in en route centres or at airports, Air Traffic Control (ATC) units may request the local Flow Management Position (FMP) to instigate an Air Traffic Flow Management (ATFM) measure, or regulation. Aircraft expected to arrive during a period of congestion are given Air Traffic Flow Management delay at their departure airport, under the authority of the Network Manager, in order to regulate the flow of traffic into the constrained downstream en route sector or airport, thus ensuring safety. The resulting ATFM delays are calculated as the difference between the estimated take-off time calculated from the filed flight plan including updates and the calculated take-off time allocated by the central unit of ATFM. The reason for the regulation is indicated by the responsible Flow Management Position (FMP). The delay is attributed to the most constraining ATC unit.
Delay= en-route ATFM delay [min.] / number of IFR flight
Note: ‘ATFM delay’ does not take into account the planned capacity thus it is possible that an ANSP has a relative high capacity (handled flights/hour) but due to the higher demand the given ANSP will generate delay.
Until 2017, existing capacity and improved airspace optimisation allowed HungaroControl to take advantage of the increase in traffic without major delays.2 In 2018, the delay indicator had already started to rise significantly, but the organisation continued to respond with extra shifts (leading to additional overtime). At the end of 2019 the capacity clearly reached its limits and it was not possible to further increase the workload without jeopardising safety standards. Consequently, a new FRM agreement was reached with the ATCOs, which resulted in safe, sustainable service provision, but also a significant increase in delays.
The capacity plan for a reference period is fixed. It can take time to build additional capacity, or to respond to significant changes in demand.

18 GLOBAL AIR NAVIGATION SERVICES PERFORMANCE REPORT
Significant seasonality in traffic volumes requires adjustments in capacity. Figure 6 which shows overflight movements in 2018 and 2019 demonstrates how much difference there is between winter and summer for HungaroControl.
Figure 6 - Number of overflight movements in 2018 and 2019
Significant seasonality in traffic volumes requires adjustments in capacity. Figure 6 which shows overflight movements in 2018 and 2019 demonstrates how much difference there is between winter and summer for HungaroControl.
The number of movements in July is double normal February volumes. It is also evident from the comparison that in the summer months of 2019 the number of overflights was restricted due to FRM measures. In the off-peak seasons, on the contrary, when capacity was not limited, 2019 figures are above those of 2018.

19 GLOBAL AIR NAVIGATION SERVICES PERFORMANCE REPORT
NAV PORTUGAL In recent years productivity at NAV Portugal has increased progressively (see Figure 7), mainly as a result of very careful management of ATCOs resources. This efficient management, combined with a high degree of flexibility in the use of ATCOS, allowed NAV Portugal to allocate the necessary resources according to traffic demand. For this result to be possible, traffic forecasts are analysed on a daily basis
until d-1 (day before) of the operation, thus allowing for very precise planning according to the sector configurations necessary to accommodate the traffic. It is above all in this dynamic and flexible management that much of this result lies.
334
646
374
189
40
880
6
421
475
434
709
40
788
8
40
089
0
399
672
413
948
40
467
2
0,82
0,93
1,02 1,021,07
0
0,2
0,4
0,6
0,8
1
1,2
0
50000
100000
150000
200000
250000
300000
350000
400000
450000
500000
2015 2016 2017 2018 2019
IFR flight hours ATCO hours ATCO productivity
Figure 7 - ATCOs in OPS hour productivity at NAV Portugal (Continental) over the years 2015-2019

20 GLOBAL AIR NAVIGATION SERVICES PERFORMANCE REPORT
RELATED CANSO BENCHMARKING ACTIVITIESCANSO conducts a variety of benchmarking exercises to examine developments in the industry. Combined these allow for a greater understanding of the current initiatives and trends occurring across the aviation industry, contextualising the ANS performance analysis within this report. The following input has kindly been provided by the CANSO Human Resources Work Group (HRWG).
CANSO HUMAN RESOURCES WORK GROUP The CANSO Human Resources Workgroup (HPWG) examines human resources metrics, many of which are recognised as influencing the cost-efficiency and productivity KPIs explored in the Performance Report. Every few years the group undertakes an in-depth analysis of the terms and conditions of employment, employment costs, retention issues, training times, as well as factors such as progress on achieving gender balance in our industry. By sharing data, the entire ATM community can better understand and manage its performance and identify the actions that can be taken to influence it.
21 ANSPs participated in the 2020 survey, with the smallest organisation employing less than 100 employees and the largest employing over 5,000.
Some of the key results from the 2020 survey are as follows:
⁃ Among the participating ANSPs, ATCOs made up on average 37% of total staff.
⁃ ATCOs are tending to be older. The plurality of ATCOs employed by participating ANSPs now fall in the 41-50 age bracket (36%). The percentage of ATCOs under 30 years old has consistently fallen since the metric began being tracked in 2011 and now stands at 11%. The majority of ANSPs reported their ATCOs having an average length of service of over 21 years.
⁃ Significant increases in average annual ATCO salaries were reported since the 2017 survey. This year the report began exploring differences between enroute and tower/terminal salaries.
⁃ The average work week of an ATCO is just under 37 hours with an average of 23 hours spent in position.
⁃ Overtime amounts were uneven with the majority of ANSPs reporting minimal use of overtime and others reporting significant usage of overtime.
⁃ The average failure rate for ATCO students rose slightly from 17 to 18.8%
⁃ Retention rates remain high, with the majority of ATCO’s working until retirement. Turnover largely relates to ATCOs moving into management positions or relocating to another country.
⁃ Women made up on average 25% of ATCOs (up over 4% since 2015) and just over 30% of total employees among responding ANSPs.

21 GLOBAL AIR NAVIGATION SERVICES PERFORMANCE REPORT
LIST OF KEY PERFORMANCE INDICATORS
INDICATOR KPI NUMERATOR DENOMINATOR FIGURE REFERENCES
COST EFFICIENCY AND PRODUCTIVITY PERFORMANCE INDICATORS
CONTINENTAL OCEANIC
2019 / TREND 2019
1 Cost per IFR flight hour Total Cost IFR flight hours Figure 8 Figure 19
2A ATCOs in OPS Employment cost per ATCO in OPS hour
Employment costs for ATCOs in OPS
ATCOs in OPS hours Figure 9, 10 Figure 20,
21
2B ATCOs in OPS hour productivity IFR flight hours ATCOs in OPS
hours Figure 11 Figure 22
2CCost excluding ATCOs in OPS employment costs per IFR flight hour
Costs excluding employment costs for ATCOs in OPS
IFR flight hours Figure 12 Figure 23
2DEmployment cost of ATCOs in OPS as a percentage of total costs
Employment cost for ATCOs in OPS
Total Costs Figure 13 Figure 24
3A Annual employment cost per ATCO in OPS
Employment cost for ATCOs in OPS
ATCOs in OPS Figure 14,15
3B Annual Working hours per ATCO in OPS
ATCOs in OPS hours ATCOs in OPS Figure 16
3C Annual IFR hours per ATCO in OPS IFR flight hours ATCOs in OPS Figure 17
3D Ratio of frontline service staff to ATCO in OPS
No. of Frontline Service Support Staff
ATCOs in OPS Figure 18
JOINT CONTINENTAL AND OCEANIC COST EFFICIENCY PERFORMANCE INDICATORS
CONTINENTAL AND OCEANIC
2018/TREND
CO1 Cost per IFR flight hour Total Cost IFR flight hours Figure 25
CO2DEmployment cost of ATCOs in OPS as a percentage of total costs
Employment cost for ATCOs in OPS
Total Cost Figure 26
Note that KPI CO1 is the combined continental and oceanic metric for KPI 1. Likewise, KPI CO2D is the combined continental and oceanic metric for KPI 2D.

22 GLOBAL AIR NAVIGATION SERVICES PERFORMANCE REPORT
METHODOLOGYMEASURING PERFORMANCECost efficiency and productivity are two key indicators of measuring the performance of air navigation service provision. They demonstrate how ANSPs are delivering value and serve as indicators of operational efficiency. These KPIs are all part of the CANSO ANS Performance Framework (page 78).
Cost efficiency
Cost efficiency provides an indication of the balance between operational effectiveness (i.e. ATCO productivity) and the cost of providing the service.
The simplest indicator of cost efficiency is the cost of providing ANS services per IFR flight hour. A lower cost per flight hour, however, is not necessarily indicative of greater overall performance.
Economic differences outside of the control of ANSPs can drive differences in costs. This includes labour contracts, salary scales and working conditions (such as hours), as well as government regulations on pension management and mandatory financial controls. Furthermore, ANSPs do not control the volume of traffic, which is a function of economic activity and other air passenger demands. Where a minimum level of service is required, there is a limit to how activities can be scaled down in response to lower demand.
Cost indicators do not reflect external factors, other performance areas or the quality of service. Moreover, there are costs associated with providing a safer and more punctual, predictable, and efficient service.
Costs are broken down into ATCOs in OPS employment and other costs. Other costs include operating costs (excluding ATCO in OPS employment costs), depreciation/amortisation and costs of capital related to providing ATC/ATFM services. They do not include MET costs.
Productivity
The key indicator of ANS productivity is IFR flight hours per ATCO in OPS hour, often described as ‘ATCO in OPS productivity’. Although generally reflective of ANSPs’ performance, factors beyond the control of the ANSP can cause low levels of productivity – for example a geopolitical event that alters traffic demand.
ATCO in OPS productivity is driven by traffic levels and an ANSP’s ability to utilise its ATCOs in operations (OPS) resources. Although they cannot affect traffic demand, ANSPs may improve productivity by utilising flexible rostering and adapting airspace configuration to open and close sectors according to evolving traffic patterns.
Furthermore, advances in technology are now focusing more than ever on reducing the workload of ATCOs in OPS to enable them to safely manage higher levels of traffic in a given volume of airspace. Training associated with the introduction of technology, however, can lead to short-term reductions in productivity.Airspace complexity also affects ATCO in OPS productivity. Lower airspace will typically have lower levels of ATCO in OPS productivity than upper airspace where aircraft are flying at more consistent altitudes and on non-crossing routes. Therefore, an ANSP operating a high proportion of sectors in lower airspace, or with numerous busy airports with complex approach sectors, is likely to have lower ATCO in OPS productivity than an ANSP with more overflights at higher altitude.

23 GLOBAL AIR NAVIGATION SERVICES PERFORMANCE REPORT
DATA PROCESSINGData collection: ANSPs who are members of the CANSO GBWG provided data for this analysis. ANSPs either submit the minimum dataset required for participation in the report (the basic data), or additional data to inform the analysis of trial KPIs (the advanced data). ANSPs can also revise data submitted in previous years. The data submission workbook includes validation calculations that ANSPs are encouraged to consult in the data collection phase.
The entire dataset is available to all participating ANSPs to enable closer analysis and evaluation of performance trends. The advanced KPI dataset is only available to ANSPs submitting advanced data.
2019 performance data for European ANSPs has been kindly provided by EUROCONTROL, alongside data for the years 2015 – 2018 to facilitate historical trends analysis, which will be completed with the extended set of ANSPs to ensure validity of any trend analysis. European ANSP members of the CANSO GBWG, who also submit data to EUROCONTROL will have their ACE data used in this analysis, unless otherwise agreed.
As noted in the Executive Summary, it should be noted that Indicator 2B ‘ATCO productivity’ is not directly comparable to the ATCO productivity KPI used in the ACE report. This is because the CANSO ANS Performance Framework uses IFR flight hours to calculate this KPI, rather than composite flight hours as used in the ACE report ATCO productivity KPI. Finally, as part of the data sharing agreement with EUROCONTROL, CANSO data is only available to the core EUROCONTROL analysts and is not shared with the wider ACE report ANSP community.
Data Dashboard: As part of the CANSO 2015-2019 data collection cycle, a PowerBI dashboard was produced in November 2020, which allowed CANSO members a first look at trends in their data. This dashboard, and accompanying underlying data document provided members the opportunity to thoroughly review and validate their data submission, and notify Egis of any amendments if necessary.
Data processing: Data has been processed by Egis subject to a data processing agreement with CANSO and in accordance with European data privacy laws. It was subject to a one-step quality check for significant changes, potential errors or omissions and is subject to continued revision by participating ANSPs.
Separation of continental and oceanic data: Information is provided both for continental and oceanic air navigation services, where applicable. Each of these environments has different challenges associated with providing ANS. For example, it is more straightforward to provide ground infrastructure for communications and surveillance services in continental airspace than it is over oceans.
Exchange rate conversion: ANSPs submit data in their chosen currency. For KPI comparison, data is presented in USD. 2019 KPI data is converted using exchange rates provided by each ANSP or using data available from the Organisation for Economic Co-operation and Development (OECD) website. Exchange rates for some countries are unavailable using OECD; International Monetary Fund (IMF) exchange rates have been used in such situations.
For ANSPs that operate in a currency other than the USD, the assumption of lower cost may be caused in part by the strengthening USD. Between 2015 and 2016, the USD appreciated against most other world currencies, meaning each USD buys more foreign currency. Despite a dip in 2017, the USD once again strengthened in 2018. This change in the relative value of the dollar effectively lowers the price that ANSPs incur in USD.
Growth rates: Data is presented from 2019 and then for the one-year and four-year trends. The trend over four years is calculated as the compound annual growth rate (4 yr CAGR). This shows the overall trend between 2015 and 2019, but masks the fluctuations that may have taken place over the intervening years. In addition, if 2015 was an outlier, this trend may not be representative of the trend over this timeframe. Individual ANSP results for 4 yr CAGR should therefore be interpreted alongside contextual information.
The trend analysis is presented above the 2019 KPI data and is based on the data submitted in the ANSP’s chosen currency.
24 GLOBAL AIR NAVIGATION SERVICES PERFORMANCE REPORT
Inflation: The growth rates are not adjusted for inflation, and local inflation rates should therefore be considered when interpreting AGR trends.
PPP correction: Salaries and the cost of living vary extensively around the world. One way to correct for this is by using purchasing power parity (PPP). Employment costs for ATCOs in OPS are corrected using IMF data. There are, of course, limitations to this approach, as the cost of living can vary widely within a country and may be higher or lower in the region where ANS offices are located.
Q1 and Q3: The first quartile (Q1) is defined as the middle number between the smallest number and the median of the data set. The third quartile (Q3) is the middle value between the median and the highest value of the data set. The average is the mean result.
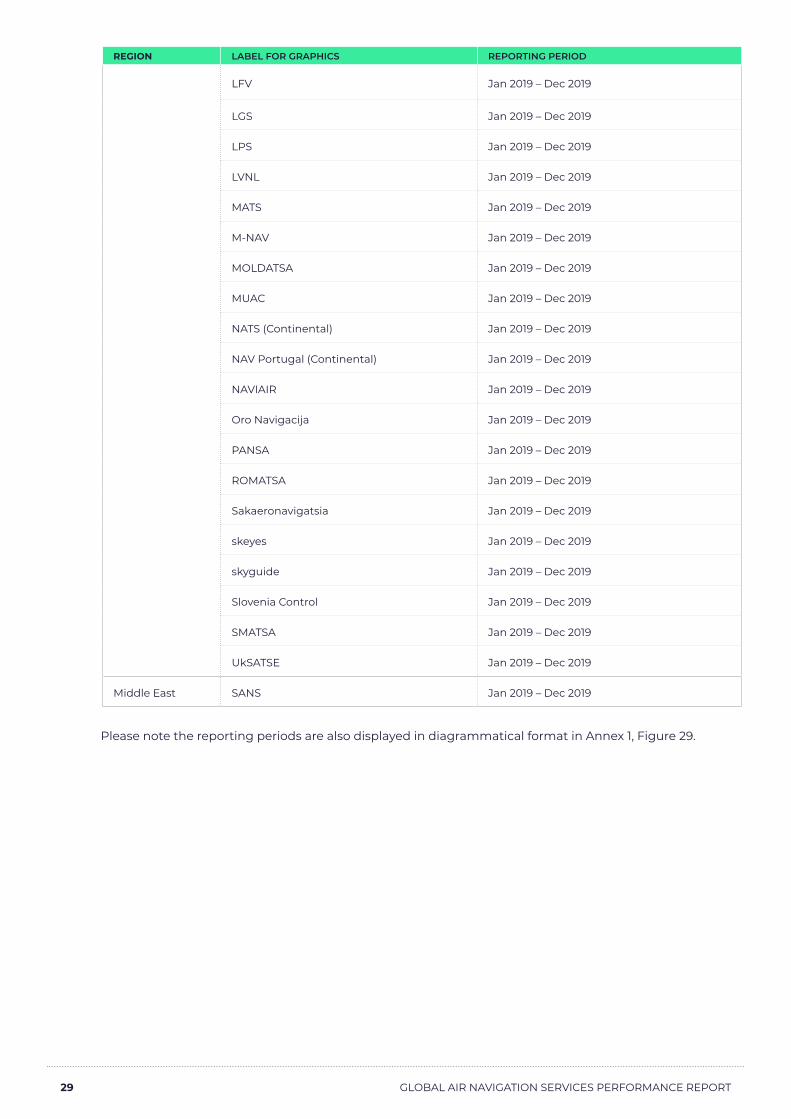
REPORTING PERIODSWhile the GBWG encourages ANSPs with reporting periods that do not run between January and December to submit their most recent dataset, it is noted this is not possible for some providers due to data validation and availability. Readers are therefore encouraged to check reporting periods when comparing individual ANSPs. These are outlined within Table 2. Figure 29, in Annex 1, also provides a summary of these reporting periods, and indicates which ANSPs may have submitted data that has been affected by the COVID-19 pandemic.
25 GLOBAL AIR NAVIGATION SERVICES PERFORMANCE REPORT
2019 PARTICIPATIONCANSO GBWG SUBMISSIONS
3 Comparative to 2018, two new CANSO submissions from ENAIRE and Slovenia Control were received for the final report. 4 As some ANSPs did not submit data for every field, this is not the total for all participating ANSPs; rather it is the total of all data submitted.
5 Airservices Australia and SANS submit data that is used to calculate the global trends within this document’s Executive Summary section but their data is not presented in the graphs included in the rest of this document.
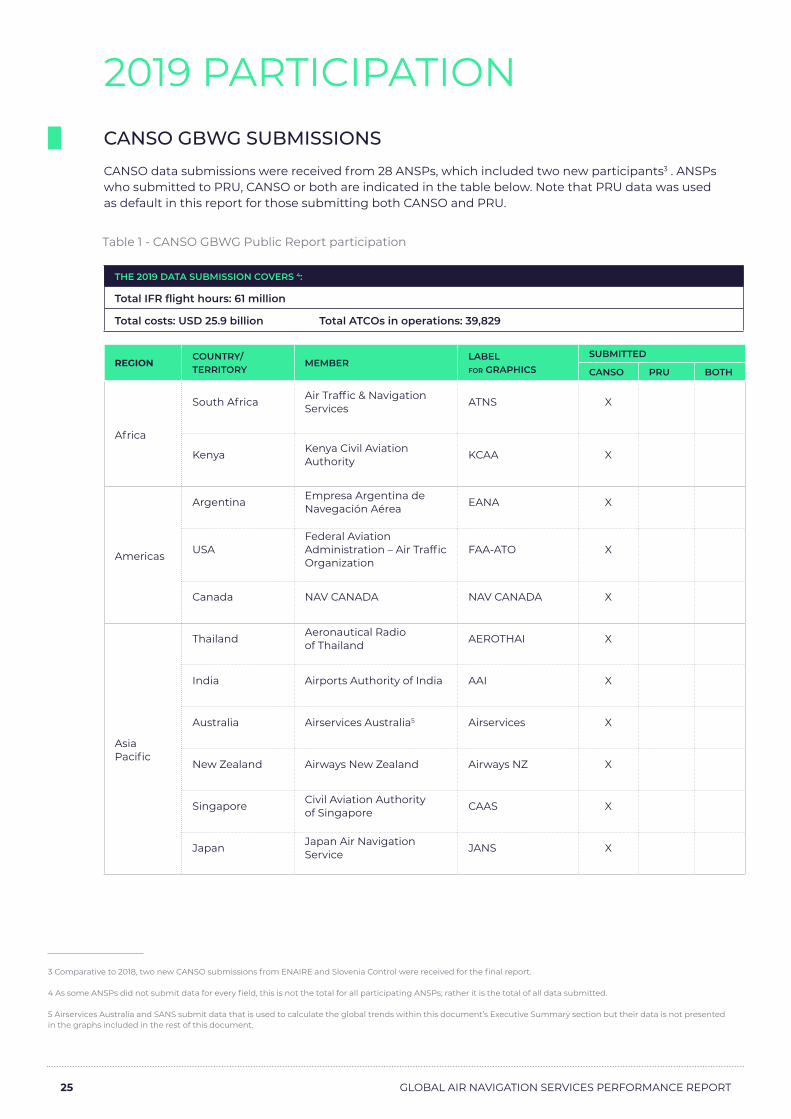
CANSO data submissions were received from 28 ANSPs, which included two new participants3 . ANSPs who submitted to PRU, CANSO or both are indicated in the table below. Note that PRU data was used as default in this report for those submitting both CANSO and PRU.
THE 2019 DATA SUBMISSION COVERS 4:
Total IFR flight hours: 61 million
Total costs: USD 25.9 billion Total ATCOs in operations: 39,829
REGIONCOUNTRY/TERRITORY
MEMBERLABEL FOR GRAPHICS
SUBMITTED
CANSO PRU BOTH
Africa
South Africa Air Traffic & Navigation Services ATNS X
Kenya Kenya Civil Aviation Authority KCAA X
Americas
Argentina Empresa Argentina de Navegación Aérea EANA X
USAFederal Aviation Administration – Air Traffic Organization
FAA-ATO X
Canada NAV CANADA NAV CANADA X
Asia Pacific
Thailand Aeronautical Radio of Thailand AEROTHAI X
India Airports Authority of India AAI X
Australia Airservices Australia5 Airservices X
New Zealand Airways New Zealand Airways NZ X
Singapore Civil Aviation Authority of Singapore CAAS X
Japan Japan Air Navigation Service JANS X
Table 1 - CANSO GBWG Public Report participation
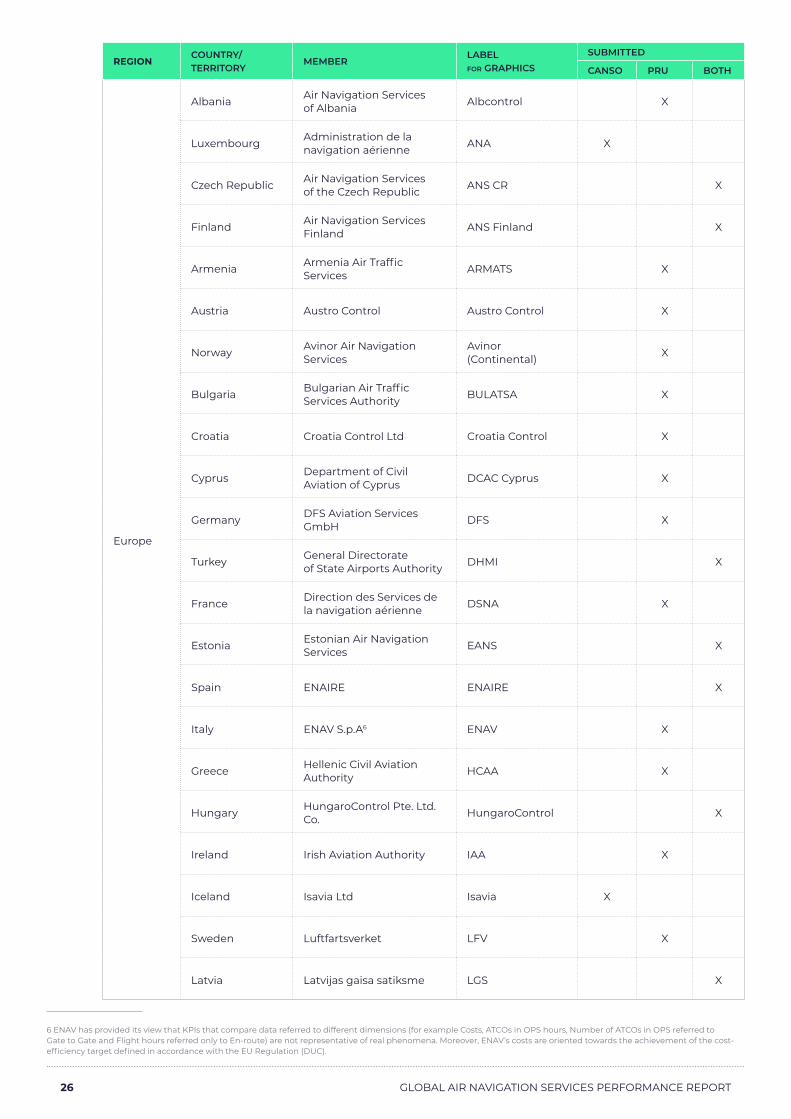
26 GLOBAL AIR NAVIGATION SERVICES PERFORMANCE REPORT
REGIONCOUNTRY/TERRITORY
MEMBERLABEL FOR GRAPHICS
SUBMITTED
CANSO PRU BOTH
Europe
Albania Air Navigation Services of Albania Albcontrol X
Luxembourg Administration de la navigation aérienne ANA X
Czech Republic Air Navigation Services of the Czech Republic ANS CR X
Finland Air Navigation Services Finland ANS Finland X
Armenia Armenia Air Traffic Services ARMATS X
Austria Austro Control Austro Control X
Norway Avinor Air Navigation Services
Avinor (Continental) X
Bulgaria Bulgarian Air Traffic Services Authority BULATSA X
Croatia Croatia Control Ltd Croatia Control X
Cyprus Department of Civil Aviation of Cyprus DCAC Cyprus X
Germany DFS Aviation Services GmbH DFS X
Turkey General Directorate of State Airports Authority DHMI X
France Direction des Services de la navigation aérienne DSNA X
Estonia Estonian Air Navigation Services EANS X
Spain ENAIRE ENAIRE X
Italy ENAV S.p.A6 ENAV X
Greece Hellenic Civil Aviation Authority HCAA X
Hungary HungaroControl Pte. Ltd. Co. HungaroControl X
Ireland Irish Aviation Authority IAA X
Iceland Isavia Ltd Isavia X
Sweden Luftfartsverket LFV X
Latvia Latvijas gaisa satiksme LGS X
6 ENAV has provided its view that KPIs that compare data referred to different dimensions (for example Costs, ATCOs in OPS hours, Number of ATCOs in OPS referred to Gate to Gate and Flight hours referred only to En-route) are not representative of real phenomena. Moreover, ENAV’s costs are oriented towards the achievement of the cost-efficiency target defined in accordance with the EU Regulation (DUC).

27 GLOBAL AIR NAVIGATION SERVICES PERFORMANCE REPORT
REGIONCOUNTRY/TERRITORY
MEMBERLABEL FOR GRAPHICS
SUBMITTED
CANSO PRU BOTH
Europe
Slovakia Letové prevádzkové služby LPS X
Netherlands Luchtverkeersleiding Nederland LVNL X
Malta Malta Air Traffic Services MATS X
MacedoniaMacedonian Air Navigation Service Provider, GOJSC
M-NAV X
Moldova Moldovian Air Traffic Services Authority MOLDATSA X
- Maastricht Upper Areal Control Centre MUAC X
United Kingdom NATS Holdings NATS (Continental) X
PortugalNavegação Aérea de Portugal - NAV Portugal, E.P.E.
NAV Portugal (Continental) X
Denmark Navigation Via Air NAVIAIR X
Lithuania SE Oro Navigacija Oro Navigacija X
Poland Polish Air Navigation Services Agency PANSA X
Romania Romanian Air Traffic Services Administration ROMATSA X
Georgia Sakaeronavigatsia Ltd. Sakaeronavigatsia X
Belgium skeyes skeyes X
Switzerland skyguide skyguide X
Slovenia Kontrola zračnega prometa Slovenije Slovenia Control X
Serbia and Montenegro
Serbia and Montenegro Air Traffic Services SMATSA IIc
SMATSA X
Ukraine Ukrainian State Air Traffic Service Enterprise UkSATSE X
Middle East Saudi Arabia Saudi Air Navigation
Services8 SANS X

28 GLOBAL AIR NAVIGATION SERVICES PERFORMANCE REPORT
REGION LABEL FOR GRAPHICS REPORTING PERIOD
AfricaATNS Apr 2019 – Mar 2020
KCAA Jul 2019 – Jun 2020
Americas
EANA Jan 2019 – Dec 2019
FAA-ATO Oct 2018 – Sep 2019
NAV CANADA Sep 2018 – Aug 2019
Asia Pacific
AEROTHAI Oct 2018 - Sep 2019
AAI Apr 2019 – Mar 2020
Airservices Jul 2018 – Jun 2019
Airways NZ Jul 2019 – Jun 2020
CAAS Apr 2019 – Mar 2020
JANS Apr 2019 – Mar 2020
Europe
Albcontrol Jan 2019 – Dec 2019
ANA Jan 2019 – Dec 2019
ANS CR Jan 2019 – Dec 2019
ANS Finland Jan 2019 – Dec 2019
ARMATS Jan 2019 – Dec 2019
Austro Control Jan 2019 – Dec 2019
Avinor (Continental) Jan 2019 – Dec 2019
BULATSA Jan 2019 – Dec 2019
Croatia Control Jan 2019 – Dec 2019
DCAC Cyprus Jan 2019 – Dec 2019
DFS Jan 2019 – Dec 2019
DHMI Jan 2019 – Dec 2019
DSNA Jan 2019 – Dec 2019
EANS Jan 2019 – Dec 2019
ENAIRE Jan 2019 – Dec 2019
ENAV Jan 2019 – Dec 2019
HCAA Jan 2019 – Dec 2019
HungaroControl Jan 2019 – Dec 2019
IAA Jan 2019 – Dec 2019
Isavia Jan 2019 – Dec 2019
Table 2 - ANSP reporting periods.
29 GLOBAL AIR NAVIGATION SERVICES PERFORMANCE REPORT
REGION LABEL FOR GRAPHICS REPORTING PERIOD
LFV Jan 2019 – Dec 2019
LGS Jan 2019 – Dec 2019
LPS Jan 2019 – Dec 2019
LVNL Jan 2019 – Dec 2019
MATS Jan 2019 – Dec 2019
M-NAV Jan 2019 – Dec 2019
MOLDATSA Jan 2019 – Dec 2019
MUAC Jan 2019 – Dec 2019
NATS (Continental) Jan 2019 – Dec 2019
NAV Portugal (Continental) Jan 2019 – Dec 2019
NAVIAIR Jan 2019 – Dec 2019
Oro Navigacija Jan 2019 – Dec 2019
PANSA Jan 2019 – Dec 2019
ROMATSA Jan 2019 – Dec 2019
Sakaeronavigatsia Jan 2019 – Dec 2019
skeyes Jan 2019 – Dec 2019
skyguide Jan 2019 – Dec 2019
Slovenia Control Jan 2019 – Dec 2019
SMATSA Jan 2019 – Dec 2019
UkSATSE Jan 2019 – Dec 2019
Middle East SANS Jan 2019 – Dec 2019
Please note the reporting periods are also displayed in diagrammatical format in Annex 1, Figure 29.
30 GLOBAL AIR NAVIGATION SERVICES PERFORMANCE REPORT
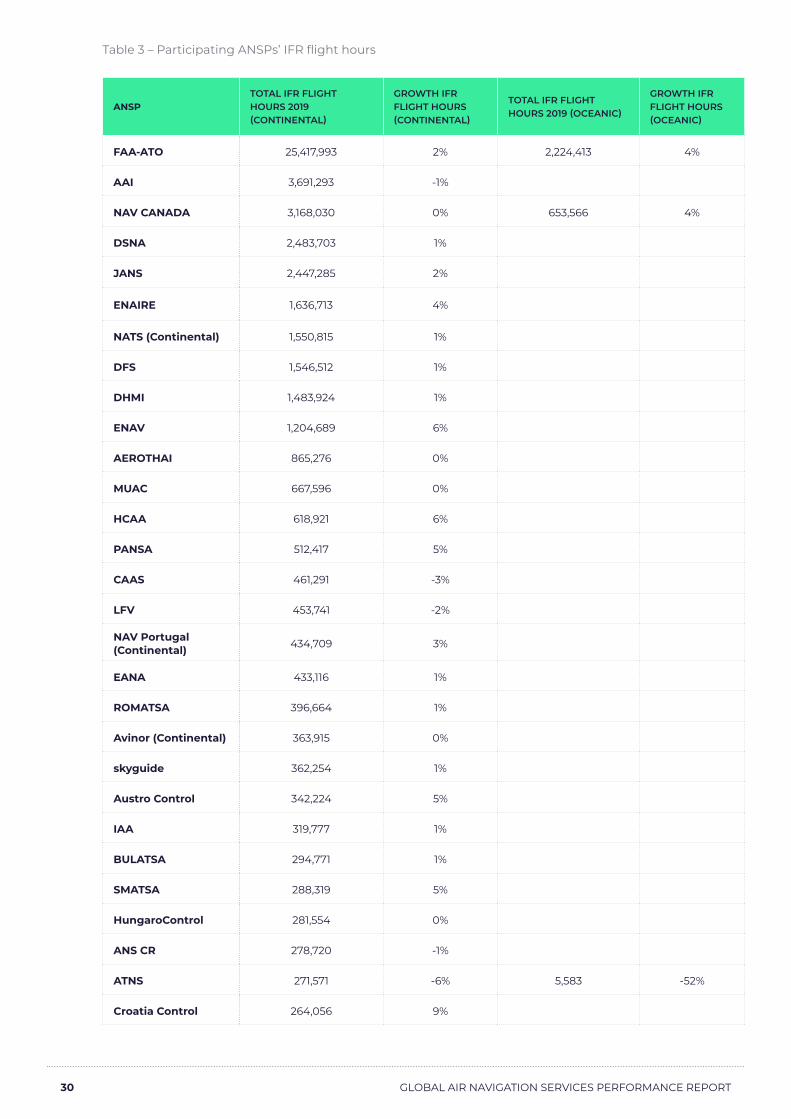
Table 3 – Participating ANSPs’ IFR flight hours
ANSPTOTAL IFR FLIGHT HOURS 2019 (CONTINENTAL)
GROWTH IFR FLIGHT HOURS (CONTINENTAL)
TOTAL IFR FLIGHT HOURS 2019 (OCEANIC)
GROWTH IFR FLIGHT HOURS (OCEANIC)
FAA-ATO 25,417,993 2% 2,224,413 4%
AAI 3,691,293 -1%
NAV CANADA 3,168,030 0% 653,566 4%
DSNA 2,483,703 1%
JANS 2,447,285 2%
ENAIRE 1,636,713 4%
NATS (Continental) 1,550,815 1%
DFS 1,546,512 1%
DHMI 1,483,924 1%
ENAV 1,204,689 6%
AEROTHAI 865,276 0%
MUAC 667,596 0%
HCAA 618,921 6%
PANSA 512,417 5%
CAAS 461,291 -3%
LFV 453,741 -2%
NAV Portugal (Continental) 434,709 3%
EANA 433,116 1%
ROMATSA 396,664 1%
Avinor (Continental) 363,915 0%
skyguide 362,254 1%
Austro Control 342,224 5%
IAA 319,777 1%
BULATSA 294,771 1%
SMATSA 288,319 5%
HungaroControl 281,554 0%
ANS CR 278,720 -1%
ATNS 271,571 -6% 5,583 -52%
Croatia Control 264,056 9%

31 GLOBAL AIR NAVIGATION SERVICES PERFORMANCE REPORT
ANSPTOTAL IFR FLIGHT HOURS 2019 (CONTINENTAL)
GROWTH IFR FLIGHT HOURS (CONTINENTAL)
TOTAL IFR FLIGHT HOURS 2019 (OCEANIC)
GROWTH IFR FLIGHT HOURS (OCEANIC)
NAVIAIR 229,977 3%
Airways NZ 211,262 -20% 101,099 -20%
UkSATSE 198,147 8%
DCAC Cyprus 196,404 5%
LVNL 174,562 2%
ANS Finland 127,118 2%
skeyes 115,863 -2%
KCAA 111,579 25%
LPS 111,298 -1%
LGS 91,367 3%
MATS 89,547 5%
EANS 76,461 -1%
Oro Navigacija 70,684 6%
Slovenia Control 63,469 7%
Sakaeronavigatsia 50,017 -9%
Albcontrol 47,384 8%
M-NAV 37,681 16%
ANA 28,738 0%
Isavia 27,884 -16% 277,750 -5%
ARMATS 17,600 -4%

32 GLOBAL AIR NAVIGATION SERVICES PERFORMANCE REPORT
2019 PERFORMANCE DATA The following section presents 2019 performance data and 2015-2019 trend data for both continental and oceanic activities in line with the CANSO ANS Performance Framework levels 1-3 (see page 62).
CONTINENTAL COST EFFICIENCY AND PRODUCTIVITY: 2019
2019 Continental – Cost efficiency
Indicator 1: Cost per IFR hour (USD) (Formula: Total costs / IFR flight hours)
-10%
16%
30%
-3%
6%1%
0%
3%
18%
-3%
19%
5%16%
-9%-9%-2%
22%
-1%
61%
14%3%
-4%0%
0%
-1%-3%
35%
-1%-12%
-1%
2%
0%
10%
-3%
5% 0%9%
1% 4%
-1%
1%
0%-5%
5%
18%11%
0%-2%
4%
25%
-20%
0%
20%
40%
60%
80%
Per
cen
tag
e C
han
ge
2018-2019 AG 4 yr CAGR
0
500
1000
1500
2000
2500
AA
I
AE
RO
THA
I
Air
way
s N
Z
Alb
con
tro
l
AN
A
AN
S C
R
AN
S Fi
nla
nd
AR
MA
TS
ATN
S
Au
stro
Con
trol
Avi
nor (
Con
tine
ntal
)
BU
LATS
A
CA
AS
Cro
atia
Con
trol
DC
AC
Cyp
rus
DFS
DH
MI
DSN
A
EA
NA
EA
NS
EN
AIR
E
EN
AV
FAA
-ATO
HC
AA
Hun
gar
oco
ntro
l
IAA
ISA
VIA
JAN
S
KC
AA
LFV
LGS
LPS
LVN
L
MA
TS
M-N
AV
MO
LDA
TSA
MU
AC
NA
TS (C
ont
inen
tal)
NA
V C
AN
AD
A
Nav
Po
rtug
al…
NA
VIA
IR
Oro
Nav
igac
ija
PA
NSA
RO
MA
TSA
Sak
aero
nav
igat
sia
skey
es
Skyg
uid
e
Slo
veni
a C
ont
rol
SMA
TSA
UkS
ATS
E
Cos
t p
er IF
R fl
igh
t h
our
(USD
)
2019 Avg Q1 Q3
Figure 8 - Cost per IFR flight hour (USD)
The 2019 average cost per IFR flight hour is USD 548. All ANSPs submitting continental data for 2019 did so for 2018; the 2018 average was USD 522. Revenue expenditure and financial market conditions caused total costs to rise for some ANSPs, while changes in traffic impacted IFR flight hours.
It should be noted that differences between the operational characteristics of ANSPs’ airspaces may significantly influence their ‘Cost per IFR flight hour’. For example, skeyes and LVNL have delegated control of their upper airspace to MUAC. skeyes and LVNL therefore
have a higher ‘Cost per IFR flight hour’, than if they would also control the upper airspace, because the traffic is generally more complex in lower airspace. MUAC, meanwhile, make use of infrastructure provided by skeyes and LVNL which reduces its ‘Cost per IFR flight hour’. Furthermore, since the upper airspace does not include VFR flights, MUAC’s ATCO in OPS productivity is fully reflected in this KPI, while the values for skeyes and LVNL does include VFR workload, which reduces the ATCO in OPS productivity.
Specific ANSP comments are outlined below.

33 GLOBAL AIR NAVIGATION SERVICES PERFORMANCE REPORT
AEROTHAI (Thailand)
AEROTHAI experienced an increase in total cost outweighing the increase in traffic due to employment cost adjustment of pension contribution (please refer to Thailand LABOUR PROTECTION ACT (NO.7) B.E. 2562 (2019)).
Airways NZ (New Zealand)
Total cost efficiency has been impacted due to reduced flights related to the COVID-19 pandemic since Airways NZ’s financial year ending 30 June 2020. There has also been an increase in staff costs due to recruitment activity, as well as wage increases resulting from the labour agreement.
ANA (Luxembourg)
Increase in staff costs due to recruitment activity as well as wage increases resulting from the labour agreement – but largely impacted by reduced IFR hours due to COVID-19
ATNS (South Africa)
IFR flight hours has declined by 5.6% as a result of South African Airways cancelling many regional and international sectors. Total cost has increased by 11.7% between 2018 and 2019, the bulk of which was employment cost, which rose by 9.5% between 2018 and 2019.
EANA (Argentina)
Argentina faced economic crisis and devaluation of the national currency in 2019. Therefore, the annual growth rates for KPIs containing EANA’s cost data will be significantly higher in this report where inflation rates have not been applied.
ISAVIA (Iceland)
ISAVIA had increased total costs due to transferal of new ATM system and reduction in approach IFR hours due to collapse of WOW air (second largest airline in Iceland).
KCAA (Kenya)
In 2019, KCAA introduced a new automated methodology to more accurately calculate IFR flight hours, which has resulted in a 25% increase in IFR flight hours between 2018 and 2019.

34 GLOBAL AIR NAVIGATION SERVICES PERFORMANCE REPORT
2019 Continental - Cost efficiency
Indicator 2A: ATCOs in OPS employment cost per ATCO in OPS hour (USD) (Formula: ATCOs in OPS employment costs / ATCOs in OPS hours)
0
50
100
150
200
250
300
350
AAI
AER
OTH
AIA
irway
s N
ZA
lbco
ntro
lA
NA
AN
S C
RA
NS
Fin
land
AR
MA
TSA
TNS
Aus
tro
Con
trol
Avi
nor
(Con
tinen
tal)
BU
LATS
AC
roat
ia C
ontr
olD
CAC
Cyp
rus
DFS
DH
MI
DSN
AEA
NA
EAN
SEN
AIR
EEN
AV
FAA
-ATO
HCA
AH
ung
aroc
ontr
olIA
AIS
AV
IAJA
NS
KCA
ALF
VLG
SLP
SLV
NL
MAT
SM
-NA
VM
OLD
ATSA
MU
AC
NAT
S (C
ontin
enta
l)N
AV C
ANA
DA
Nav
Por
tug
al…
NAV
IAIR
Oro
Nav
igac
ijaP
ANSA
RO
MA
TSA
Saka
eron
avig
atsi
ask
eyes
Skyg
uid
eSl
oven
ia C
ontr
olSM
ATSA
UkS
ATS
E
ATC
Os
in O
PS
emp
loym
ent
cost
per
A
TCO
s in
OP
S h
our
(USD
)
2019 Avg Q1 Q3
15%14%
2%6%3%
-10%
5%9%17%
12%
46%
6%2%
9%8%17%
-1%
52%
-1%
2%1%
-3%
3%5%2%4%2%0%
0%
9%
-1%
-47%
7%
41%
-11%
17%
2%0%
-8%
6%6%5%
-1%
32%
1%
0%
4%2%
51%
-60%
-40%
-20%
0%
20%
40%
60%
Per
cen
tag
e C
han
ge
2018-2019 AG 4 yr CAGR
Figure 9 - ATCOs in OPS employment cost per ATCOs in OPS hour (USD)
The 2019 average ATCOs in OPS employment cost per ATCOs in OPS hour is USD 104. All ANSPs submitting continental data for 2019 did so for 2018; the 2018 average was USD 100. Specific ANSP comments are outlined below.
AEROTHAI (Thailand)
AEROTHAI experienced an increase in ATCO in OPS employment cost due to employment cost adjustment of pension contribution (please refer to Thailand LABOUR PROTECTION ACT (NO.7) B.E. 2562 (2019)).
Airways NZ (New Zealand)
Overall staff costs increased (with the exception of COVID-19 period) due to Airways NZ recruiting heavily in preparation for their new ATM platform and the associated training. Staff costs further increased in preparation for a pending retirement bubble due to the age profile of the Airways NZ workforce.
Avinor (Norway)
The following justification is taken from the ACE Report 2019.
Avinor faced significantly increased ATM/CNS provision costs in 2019, primarily due to the large increase in employed contributions to staff pensions which results in the increase in ATCO employment costs. The occupational pension scheme in the Norwegian Public Service Pension Fund closed on 1 January 2019 and a contribution based retirement scheme was introduced on the same date.
EANA (Argentina)
Argentina faced economic crisis and devaluation of the national currency in 2019. Therefore the annual growth rates for KPIs containing EANA’s cost data will be significantly higher in this report where inflation rates have not been applied.
35 GLOBAL AIR NAVIGATION SERVICES PERFORMANCE REPORT
LVNL (Netherlands)
The following justification is taken from the ACE Report 2019.
The large decrease in ATCO in OPS employment cost per ATCO in OPS hour is mainly due to “..the introduction of a more accurate methodology to isolate ATCOs in OPS employment costs. In previous years these costs were combined with the employment costs of ATCOs working on other duties and of ATC assistants”. As a result 2019 shows a decrease in Costs excluding ATCOs in OPS employment costs per IFR hour.
M-NAV (North Macedonia)
The following justification is taken from the ACE Report 2019.
In 2019, the unit employment costs for M-NAV employees were affected by a) increases in employer contributions to social security and pensions, and b) payment of bonuses linked to increased traffic.
UkSATSE (Ukraine)
The following justification is taken from the ACE Report 2019.
The 2019 increase in staff costs mainly reflects a catch-up effect since unit employment costs had been significantly reduced in 2014, 2015 and 2016 after the traffic downturn caused by the establishment of restricted/prohibited areas in UkSATSE airspace due to military conflicts in the Eastern region of Ukraine (Crimea).
36 GLOBAL AIR NAVIGATION SERVICES PERFORMANCE REPORT
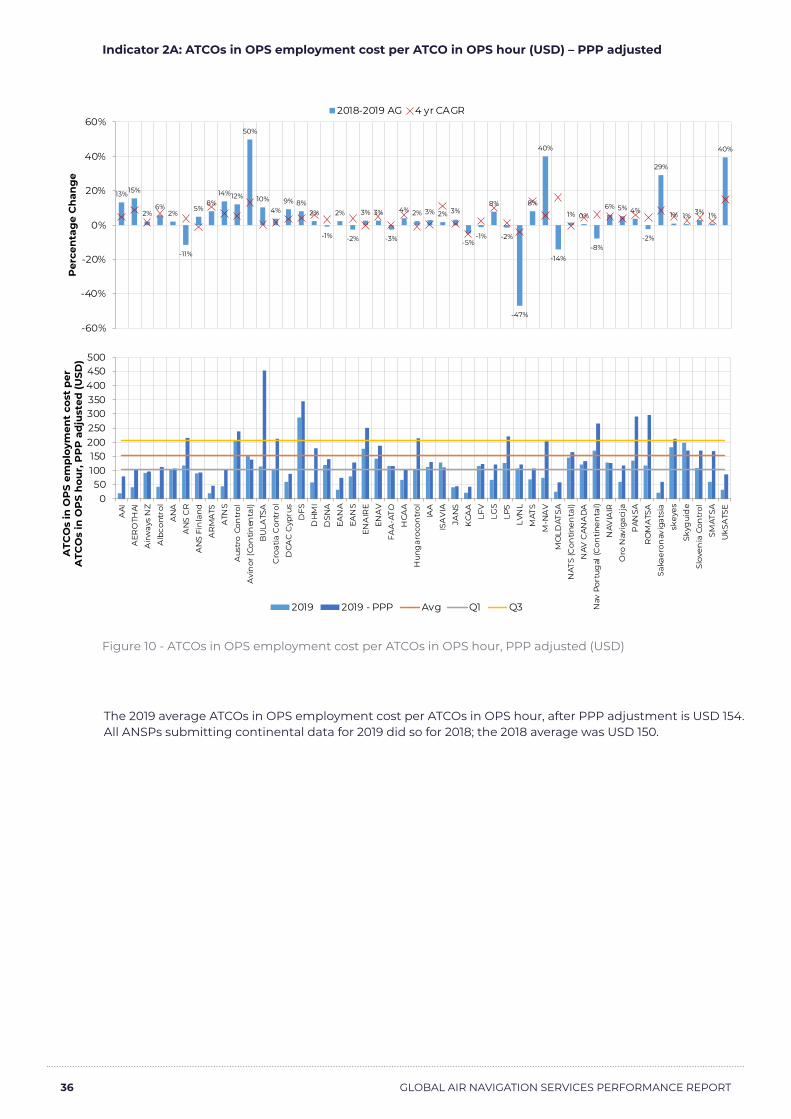
Indicator 2A: ATCOs in OPS employment cost per ATCO in OPS hour (USD) – PPP adjusted
050
100150
200250300350400450500
AAI
AER
OTH
AIA
irway
s N
ZA
lbco
ntro
lA
NA
AN
S C
RA
NS
Fin
land
AR
MA
TSA
TNS
Aus
tro
Con
trol
Avi
nor
(Con
tinen
tal)
BU
LATS
AC
roat
ia C
ontr
olD
CAC
Cyp
rus
DFS
DH
MI
DSN
AEA
NA
EAN
SEN
AIR
EEN
AV
FAA
-ATO
HCA
AH
ung
aroc
ontr
olIA
AIS
AV
IAJA
NS
KCA
ALF
VLG
SLP
SLV
NL
MAT
SM
-NA
VM
OLD
ATSA
NAT
S (C
ontin
enta
l)N
AV C
ANA
DA
Nav
Por
tug
al (C
ontin
enta
l)N
AVIA
IRO
ro N
avig
acija
PAN
SAR
OM
ATS
ASa
kaer
onav
igat
sia
skey
esSk
ygui
de
Slov
enia
Con
trol
SMAT
SAU
kSA
TSE
ATC
Os
in O
PS
emp
loym
ent
cost
per
A
TCO
s in
OP
S h
our,
PP
P a
dju
sted
(USD
)
2019 2019 - PPP Avg Q1 Q3
13%15%
2%6%
2%
-11%
5%8%
14%12%
50%
10%
4%9% 8%
2%
-1%
2%
-2%
3% 3%
-3%
4% 2% 3% 2% 3%
-5%-1%
8%
-2%
-47%
8%
40%
-14%
1% 0%
-8%
6% 5% 4%
-2%
29%
1% 1% 3% 1%
40%
-60%
-40%
-20%
0%
20%
40%
60%
Per
cen
tag
e C
han
ge
2018-2019 AG 4 yr CAGR
Figure 10 - ATCOs in OPS employment cost per ATCOs in OPS hour, PPP adjusted (USD)
The 2019 average ATCOs in OPS employment cost per ATCOs in OPS hour, after PPP adjustment is USD 154. All ANSPs submitting continental data for 2019 did so for 2018; the 2018 average was USD 150.

37 GLOBAL AIR NAVIGATION SERVICES PERFORMANCE REPORT
2019 Continental – Productivity
Indicator 2B: ATCOs in OPS hour productivity (Formula: IFR flight hours / ATCOs in OPS hours)
-2%
-7%
-20%
21%
0%
-11%
7%
-4%
1%5%
1%
-2%-3%
10%8%
2%
-2%
1%
-3%
-13%
5%2% 1%
6%3%
-10%
5%
-1%
17%
1%3%
-1%0%
9%
30%
-5%
0%3%
0%
6%2%
6%2%
-4%
-12%
-5%
2% 2% 3%6%
-30%
-20%
-10%
0%
10%
20%
30%
40%
Per
cen
tag
e C
han
ge
2018-2019 AG 4 yr CAGR
0,0
0,5
1,0
1,5
2,0
2,5
AAI
AER
OTH
AIA
irway
s N
ZA
lbco
ntro
lA
NA
AN
S C
RA
NS
Fin
land
AR
MA
TSA
TNS
Aus
tro
Con
trol
Avi
nor
(Con
tinen
tal)
BU
LATS
AC
AAS
Cro
atia
Con
trol
DCA
C C
ypru
sD
FSD
HM
ID
SNA
EAN
AEA
NS
ENA
IRE
ENA
VFA
A-A
TOH
CAA
Hun
gar
ocon
trol
IAA
ISA
VIA
JAN
SK
CAA
LFV
LGS
LPS
LVN
LM
ATS
M-N
AV
MO
LDAT
SAM
UA
CN
ATS
(Con
tinen
tal)
NAV
CAN
AD
AN
av P
ortu
gal
(Con
tinen
tal)
NAV
IAIR
Oro
Nav
igac
ijaP
ANSA
RO
MA
TSA
Saka
eron
avig
atsi
ask
eyes
Skyg
uid
eSl
oven
ia C
ontr
olSM
ATSA
UkS
ATS
E
ATC
Os
in O
PS
hou
r p
rod
uct
ivit
y
2019 Avg Q1 Q3
Figure 11 - ATCOs in OPS hour productivity
The 2019 average ATCOs in OPS hour productivity is 0.73. All ANSPs submitting continental data for 2019 did so for 2018; the 2018 average was 0.72.
Specific ANSP comments are outlined below.
Albcontrol (Albania)
The following justification is taken from the ACE Report 2019.
Albcontrol saw the 3rd highest increase in flight hours out of the ACE report ANSPs (+8.5%).
Airways NZ (New Zealand)
Airways NZ’s reporting year runs to June 2020, therefore the significant drop in IFR flight hours caused by the COVID-19 pandemic is leading to a decrease in ATCO in OPS hour productivity.
ATNS (South Africa)
IFR flight hours has declined by 5.6% due to the South African national carrier cancelling many of its regional and international sectors.
M-NAV (North Macedonia)
The following justification is taken from the ACE Report 2019.
M-NAV saw the highest increase in flight hours out of the ACE report ANSPs (+15.5%).
KCAA (Kenya)
In 2019, KCAA introduced a new automated methodology to more accurately calculate IFR flight hours, which has resulted in a 25% increase in IFR flight hours between 2018 and 2019.

38 GLOBAL AIR NAVIGATION SERVICES PERFORMANCE REPORT
2019 Continental - Cost efficiency
Indicator 2C: Costs excluding ATCOs in OPS employment costs per IFR hour (USD) (Formula: Costs excluding ATCOs in OPS employment costs / IFR flight hours)
-21%
13%
29%
-1%
8%
1% 0% 1%
19%
-6%
5% 3%
-9%-13%
-7%
22%
0%
63%
14%8%
-5%
1% 1%
-3%-10%
65%
-2%
-31%
-2%
1%
0%
31%
-4%
3% 2% 2% 2%6% 9%
0% 0%
-8%
6%
14%13%
1%
-4%
6%
22%
-40%
-20%
0%
20%
40%
60%
80%
Per
cen
tag
e C
han
ge
2018-2019 AG 4 yr CAGR
0200400600800
100012001400160018002000
AAI
AER
OTH
AIA
irway
s N
ZA
lbco
ntro
lA
NA
AN
S C
RA
NS
Fin
land
AR
MA
TSA
TNS
Aus
tro
Con
trol
Avi
nor
(Con
tinen
tal)
BU
LATS
AC
roat
ia C
ontr
olD
CAC
Cyp
rus
DFS
DH
MI
DSN
AEA
NA
EAN
SEN
AIR
EEN
AV
FAA
-ATO
HCA
AH
ung
aroc
ontr
olIA
AIS
AV
IAJA
NS
KCA
ALF
VLG
SLP
SLV
NL
MAT
SM
-NA
VM
OLD
ATSA
MU
AC
NAT
S (C
ontin
enta
l)N
AV C
ANA
DA
Nav
Por
tug
al (C
ontin
enta
l)N
AVIA
IRO
ro N
avig
acija
PAN
SAR
OM
ATS
ASa
kaer
onav
igat
sia
skey
esSk
ygui
de
Slov
enia
Con
trol
SMAT
SAU
kSA
TSE
Cos
t ex
clu
din
g A
TCO
s in
OP
S em
plo
ymen
t co
sts
per
IFR
flig
ht
hou
r (U
SD)
2019 Avg Q1 Q3
Figure 12 - Cost excluding ATCOs in OPS employment costs per IFR flight hour (USD)
The 2019 average cost excluding ATCOs in operations employment cost per IFR flight hour is USD 400. All ANSPs submitting continental data for 2019 did so for 2018; the 2018 average was USD 380.
For the same reasons stated in the description of Indicator 1 ‘Cost per IFR flight hour’, it should be noted that differences between the operational characteristics of ANSPs’ airspaces may significantly influence their ‘Costs excluding ATCOs in OPS employment costs per IFR hour’.
Specific ANSP comments are outlined below.
AEROTHAI (Thailand)
AEROTHAI experienced an increased employment cost due to an adjustment of pension contribution (please refer to Thailand LABOUR PROTECTION ACT (NO.7) B.E. 2562 (2019)).
Airways NZ
Reduction in IFR hours due to COVID-19, as well as increased capital expenditure prior to the pandemic – new ATM platform creation, Electronic Flight strips for towers and digital tower technology development.
39 GLOBAL AIR NAVIGATION SERVICES PERFORMANCE REPORT
ANA
The volume of IFR flight hours handled by ANA were stable in 2019 while other costs increased compared to the previous year. Higher other costs were mainly due to depreciation cost and new maintenance contracts.
ATNS
The volume of IFR flight hours handled by ATNS declined by 5.6% as a result of SAA cancellation of many regional and international sectors.
EANA (Argentina)
Argentina faced economic crisis and devaluation of the national currency in 2019. Therefore the annual growth rates for KPIs containing EANA’s cost data will be significantly higher in this report where inflation rates have not been applied.
ISAVIA
ISAVIA experienced increased total costs due to the transferal of ownership of a costly air traffic control system used by ISAVIA’s approach services over to their newly established company Isavia ANS. Another key issue affecting ISAVIA’s figures was the collapse of the second largest airliner in Iceland, WOW Air. This collapse is the reason for the considerable decrease in IFR Flight Hours in the oceanic section.
KCAA (Kenya)
In 2019, KCAA introduced a new automated methodology to more accurately calculate IFR flight hours, which has resulted in a 25% increase in IFR flight hours between 2018 and 2019.
LVNL (Netherlands)
The following justification is taken from the ACE Report 2019.
In 2019, there was a large decrease in ATCO in OPS employment cost per ATCO in OPS hour due to “..the introduction of a more accurate methodology to isolate ATCOs in OPS employment costs. In previous years these costs were combined with the employment costs of ATCOs working on other duties and of ATC assistants”. As a result 2019 shows a decrease in Costs excluding ATCOs in OPS employment costs per IFR hour.
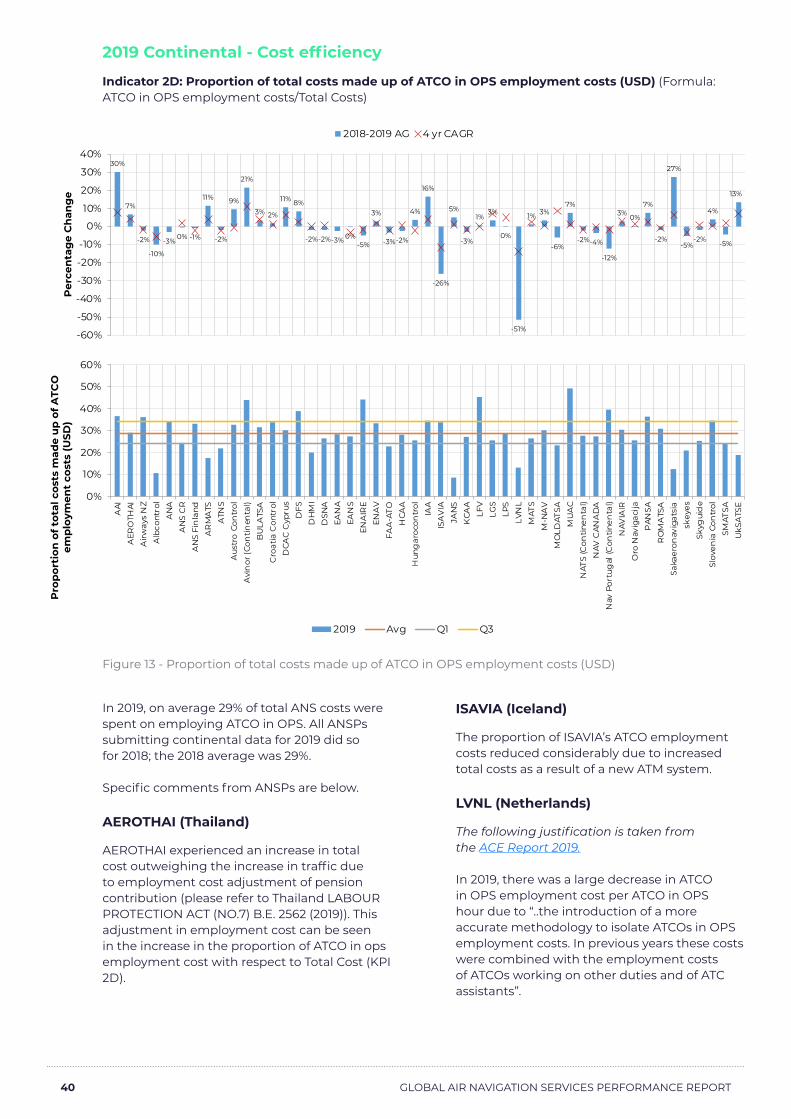
40 GLOBAL AIR NAVIGATION SERVICES PERFORMANCE REPORT
2019 Continental - Cost efficiency
Indicator 2D: Proportion of total costs made up of ATCO in OPS employment costs (USD) (Formula: ATCO in OPS employment costs/Total Costs)
0%
10%
20%
30%
40%
50%
60%
AAI
AER
OTH
AIA
irway
s N
ZA
lbco
ntro
lA
NA
AN
S C
RA
NS
Fin
land
AR
MA
TSA
TNS
Aus
tro
Con
trol
Avi
nor
(Con
tinen
tal)
BU
LATS
AC
roat
ia C
ontr
olD
CAC
Cyp
rus
DFS
DH
MI
DSN
AEA
NA
EAN
SEN
AIR
EEN
AV
FAA
-ATO
HCA
AH
ung
aroc
ontr
olIA
AIS
AV
IAJA
NS
KCA
ALF
VLG
SLP
SLV
NL
MAT
SM
-NA
VM
OLD
ATSA
MU
AC
NAT
S (C
ontin
enta
l)N
AV C
ANA
DA
Nav
Por
tug
al (C
ontin
enta
l)N
AVIA
IRO
ro N
avig
acija
PAN
SAR
OM
ATS
ASa
kaer
onav
igat
sia
skey
esSk
ygui
de
Slov
enia
Con
trol
SMAT
SAU
kSA
TSE
Pro
por
tion
of t
otal
cos
ts m
ade
up
of A
TCO
em
plo
ymen
t co
sts
(USD
)
2019 Avg Q1 Q3
30%
7%
-2%
-10%
-3% 0% -1%
11%
-2%
9%
21%
3% 2%
11% 8%
-2%-2%-3% 0%-5%
3%
-3%-2%
4%
16%
-26%
5%
-3%
1%3%
0%
-51%
1% 3%
-6%
7%
-2%-4%
-12%
3% 0%
7%
-2%
27%
-5%-2%
4%
-5%
13%
-60%
-50%
-40%
-30%
-20%
-10%
0%
10%
20%
30%
40%
Per
cen
tag
e C
han
ge
2018-2019 AG 4 yr CAGR
Figure 13 - Proportion of total costs made up of ATCO in OPS employment costs (USD)
In 2019, on average 29% of total ANS costs were spent on employing ATCO in OPS. All ANSPs submitting continental data for 2019 did so for 2018; the 2018 average was 29%.
Specific comments from ANSPs are below.
AEROTHAI (Thailand)
AEROTHAI experienced an increase in total cost outweighing the increase in traffic due to employment cost adjustment of pension contribution (please refer to Thailand LABOUR PROTECTION ACT (NO.7) B.E. 2562 (2019)). This adjustment in employment cost can be seen in the increase in the proportion of ATCO in ops employment cost with respect to Total Cost (KPI 2D).
ISAVIA (Iceland)
The proportion of ISAVIA’s ATCO employment costs reduced considerably due to increased total costs as a result of a new ATM system.
LVNL (Netherlands)
The following justification is taken from the ACE Report 2019. In 2019, there was a large decrease in ATCO in OPS employment cost per ATCO in OPS hour due to “..the introduction of a more accurate methodology to isolate ATCOs in OPS employment costs. In previous years these costs were combined with the employment costs of ATCOs working on other duties and of ATC assistants”.

41 GLOBAL AIR NAVIGATION SERVICES PERFORMANCE REPORT
2019 Continental - Cost efficiency
Indicator 3A: Annual employment cost per ATCO in OPS (USD) (Formula: ATCOs in OPS employment costs / No. ATCOs in OPS)
15%23%
2% 5%
-15%-7%
4%8%
13%11%
43%
6%3%
9%10%15%
-1%
52%
-1% -1%
5%
-1%
3% 3%
0%
-10%
2% 0% 0%8%
0%
-45%
5%
34%
-7%
19%
0%
0%
-2%
5% 5% 4%
0%
32%
2%
0%
3%
-1%
55%
-60%
-40%
-20%
0%
20%
40%
60%
Per
cen
tag
e C
han
ge
2018-2019 AG 4 yr CAGR
0
50
100
150
200
250
300
350
400
AAI
AER
OTH
AIA
irway
s N
ZA
lbco
ntro
lA
NA
AN
S C
RA
NS
Fin
land
AR
MA
TSA
TNS
Aus
tro
Con
trol
Avi
nor
(Con
tinen
tal)
BU
LATS
AC
roat
ia C
ontr
olD
CAC
Cyp
rus
DFS
DH
MI
DSN
AEA
NA
EAN
SEN
AIR
EEN
AV
FAA
-ATO
HCA
AH
ung
aroc
ontr
olIA
AIS
AV
IAJA
NS
KCA
ALF
VLG
SLP
SLV
NL
MAT
SM
-NA
VM
OLD
ATSA
MU
AC
NAT
S (C
ontin
enta
l)N
AV C
ANA
DA
Nav
Por
tug
al (C
ontin
enta
l)N
AVIA
IRO
ro N
avig
acija
PAN
SAR
OM
ATS
ASa
kaer
onav
igat
sia
skey
esSk
ygui
de
Slov
enia
Con
trol
SMAT
SAU
kSA
TSE
Un
it A
TCO
in O
PS
emp
loym
ent
cost
(1
00
0s
of U
SD)
2019 Avg Q1 Q3
Figure 14 - Annual ATCO in OPS employment cost (USD)
The 2019 average unit ATCO in OPS employment cost is USD 149,243. All ANSPs submitting continental data for 2019 did so for 2018; the 2018 average was USD 145,942.
Specific comments from ANSPs are below:
ANA (Luxembourg)
This KPI has decreased for ANA compared to 2018 although the total ATCO staff number has increased. The reason for this is that the increase in ANA’s ATCO staff is driven by the recruitment of new trainees who don't have the same salary as the other staff who were already on a much higher level in their career.
Avinor (Norway)
The following justification is taken from the ACE Report 2019.
Avinor faced significantly increased ATM/CNS provision costs in 2019, primarily due to the large increase in employed contributions to staff pensions which results in the increase in ATCO employment costs. The occupational pension scheme in the Norwegian Public Service Pension Fund closed on 1 January 2019 and a contribution based retirement scheme was introduced on the same date.
42 GLOBAL AIR NAVIGATION SERVICES PERFORMANCE REPORT
EANA (Argentina)
Argentina faced economic crisis and devaluation of the national currency in 2019. Therefore the annual growth rates for KPIs containing EANA’s cost data will be significantly higher in this report where inflation rates have not been applied.
M-NAV (North Macedonia)
The following justification is taken from the ACE Report 2019.
In 2019, the unit employment costs for M-NAV employees were affected by a) increases in employer contributions to social security and pensions, and b) payment of bonuses linked to increased traffic.
UkSATSE (Ukraine)
The following justification is taken from the ACE Report 2019.
The 2019 increase in staff costs mainly reflects a catch-up effect since unit employment costs had been significantly reduced in 2014, 2015 and 2016 after the traffic downturn caused by the establishment of restricted/prohibited areas in UkSATSE airspace due to military conflicts in the Eastern region of Ukraine (Crimea).

43 GLOBAL AIR NAVIGATION SERVICES PERFORMANCE REPORT
Indicator 3A: Annual employment cost per ATCO in OPS (USD) – PPP adjusted
13%
24%
2% 5%
-15%-9%
3%7% 11% 11%
46%
10%4%
9% 10%
1%
-1%
2%
-2% -1%
6%
-1%
4%0% 1%
-12%
3%
-5%-1%
7%
-1%
-46%
6%
34%
-10%
0%
0%
1%
-2%
5% 5% 3%
-1%
29%
2% 1% 2%
-2%
44%
-60%
-40%
-20%
0%
20%
40%
60%
Per
cen
tag
e C
han
ge
2018-2019 AG 4 yr CAGR
0
100
200
300
400
500
600
700
AAI
AER
OTH
AIA
irway
s N
ZA
lbco
ntro
lA
NA
AN
S C
RA
NS
Fin
land
AR
MA
TSA
TNS
Aus
tro
Con
trol
Avi
nor
(Con
tinen
tal)
BU
LATS
AC
roat
ia C
ontr
olD
CAC
Cyp
rus
DFS
DH
MI
DSN
AEA
NA
EAN
SEN
AIR
EEN
AV
FAA
-ATO
HCA
AH
ung
aroc
ontr
olIA
AIS
AV
IAJA
NS
KCA
ALF
VLG
SLP
SLV
NL
MAT
SM
-NA
VM
OLD
ATSA
MU
AC
NAT
S (C
ontin
enta
l)N
AV C
ANA
DA
Nav
Por
tug
al (C
ontin
enta
l)N
AVIA
IRO
ro N
avig
acija
PAN
SAR
OM
ATS
ASa
kaer
onav
igat
sia
skey
esSk
ygui
de
Slov
enia
Con
trol
SMAT
SAU
kSA
TSE
Un
it A
TCO
in O
PS
emp
loym
ent
cost
(10
00
s of
USD
), P
PP
ad
just
ed
2019 2019 - PPP Q1 Q3 Avg
Figure 15 - Annual ATCO in OPS employment cost (USD) - PPP adjusted
The 2019 average unit ATCO in OPS employment cost, after PPP adjustment, is USD 222,798. All ANSPs submitting continental data for 2019 did so for 2018; the 2018 average was USD 217,606.
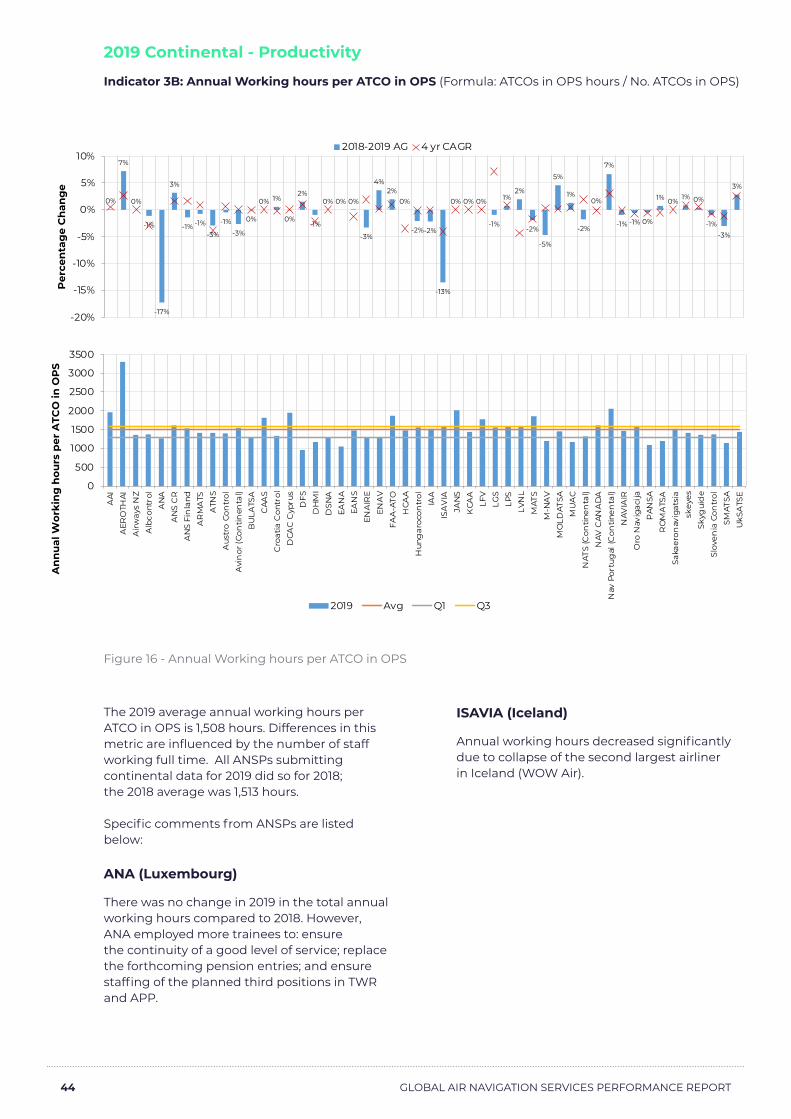
44 GLOBAL AIR NAVIGATION SERVICES PERFORMANCE REPORT
2019 Continental - Productivity
Indicator 3B: Annual Working hours per ATCO in OPS (Formula: ATCOs in OPS hours / No. ATCOs in OPS)
0%
7%
0%
-1%
-17%
3%
-1% -1%
-3%
-1%
-3%
0%
0% 1%
0%
2%
-1%
0% 0% 0%
-3%
4%2%
0%
-2%-2%
-13%
0% 0% 0%
-1%
1%2%
-2%
-5%
5%
1%
-2%
0%
7%
-1% -1% 0%
1% 0% 1% 0%
-1%-3%
3%
-20%
-15%
-10%
-5%
0%
5%
10%
Per
cen
tag
e C
han
ge
2018-2019 AG 4 yr CAGR
0
500
1000
1500
2000
2500
3000
3500
AAI
AER
OTH
AIA
irway
s N
ZA
lbco
ntro
lA
NA
AN
S C
RA
NS
Fin
land
AR
MA
TSA
TNS
Aus
tro
Con
trol
Avi
nor
(Con
tinen
tal)
BU
LATS
AC
AAS
Cro
atia
Con
trol
DCA
C C
ypru
sD
FSD
HM
ID
SNA
EAN
AEA
NS
ENA
IRE
ENA
VFA
A-A
TOH
CAA
Hun
gar
ocon
trol
IAA
ISA
VIA
JAN
SK
CAA
LFV
LGS
LPS
LVN
LM
ATS
M-N
AV
MO
LDAT
SAM
UA
CN
ATS
(Con
tinen
tal)
NAV
CAN
AD
AN
av P
ortu
gal
(Con
tinen
tal)
NAV
IAIR
Oro
Nav
igac
ijaP
ANSA
RO
MA
TSA
Saka
eron
avig
atsi
ask
eyes
Skyg
uid
eSl
oven
ia C
ontr
olSM
ATSA
UkS
ATS
E
An
nu
al W
orki
ng
hou
rs p
er A
TCO
in O
PS
2019 Avg Q1 Q3
Figure 16 - Annual Working hours per ATCO in OPS
The 2019 average annual working hours per ATCO in OPS is 1,508 hours. Differences in this metric are influenced by the number of staff working full time. All ANSPs submitting continental data for 2019 did so for 2018; the 2018 average was 1,513 hours.
Specific comments from ANSPs are listed below:
ANA (Luxembourg)
There was no change in 2019 in the total annual working hours compared to 2018. However, ANA employed more trainees to: ensure the continuity of a good level of service; replace the forthcoming pension entries; and ensure staffing of the planned third positions in TWR and APP.
ISAVIA (Iceland)
Annual working hours decreased significantly due to collapse of the second largest airliner in Iceland (WOW Air).

45 GLOBAL AIR NAVIGATION SERVICES PERFORMANCE REPORT
2019 Continental - Productivity
Indicator 3C: Annual IFR hours per ATCO in OPS (Formula: IFR flight hours / No. ATCOs in OPS)
-2%-1%
-20%
19%
-17%
-8%
5%
-5%-2%
4%
-2%-2%-3%
10%8%4%
-3%
1%
-3%
-13%
1%6%
3%6%
1%
-12%-9%
-1%
17%
1%2%0%2%7%
24%
-1%
2%1%
0%
13%
1%5%
2%
-3%
-12%
-4%
2%1%
0%
9%
-25%
-20%-15%
-10%
-5%
0%5%
10%
15%20%
25%
30%
Per
cen
tag
e C
han
ge
2018-2019 AG 4 yr CAGR
0
500
1000
1500
2000
2500
3000
AAI
AER
OTH
AIA
irway
s N
ZA
lbco
ntro
lA
NA
AN
S C
RA
NS
Fin
land
AR
MA
TSA
TNS
Aus
tro
Con
trol
Avi
nor
(Con
tinen
tal)
BU
LATS
AC
AAS
Cro
atia
Con
trol
DCA
C C
ypru
sD
FSD
HM
ID
SNA
EAN
AEA
NS
ENA
IRE
ENA
VFA
A-A
TOH
CAA
Hun
gar
ocon
trol
IAA
ISA
VIA
JAN
SK
CAA
LFV
LGS
LPS
LVN
LM
ATS
M-N
AV
MO
LDAT
SAM
UA
CN
ATS
(Con
tinen
tal)
NAV
CAN
AD
AN
av P
ortu
gal
(Con
tinen
tal)
NAV
IAIR
Oro
Nav
igac
ijaP
ANSA
RO
MA
TSA
Saka
eron
avig
atsi
ask
eyes
Skyg
uid
eSl
oven
ia C
ontr
olSM
ATSA
UkS
ATS
EIFR
hou
rs p
er A
TCO
in O
PS
2019 Avg Q1 Q3
Figure 17 - IFR hours per ATCO in OPS
The 2019 average annual IFR hours per ATCO in OPS was 1,095 hours. All ANSPs submitting continental data for 2019 did so for 2018; the 2018 average was 1,090.
Specific comments from ANSPs are listed below:
Airways NZ (New Zealand)
The drop in IFR hours per ATCO in OPS for Airways NZ in 2019 can be explained by the decrease in traffic as a result of COVID, noting that Airways NZ’s data was measured between July 2019 and June 2020.
ATNS (South Africa)
IFR flight hours has declined by 5.6% and in respect of Oceanic the reduction in IFR flights hours was almost 50%, and this was as a result of SAA cancellation of many regional and international sectors.
KCAA (Kenya)
In 2019, KCAA introduced a new automated methodology to more accurately calculate IFR flight hours, which has resulted in a 25% increase in IFR flight hours between 2018 and 2019.

46 GLOBAL AIR NAVIGATION SERVICES PERFORMANCE REPORT
2019 Continental - Productivity
Indicator 3D: Ratio of Frontline Service Staff to ATCO in OPS (Formula: No. Frontline Service Support Staff / No. ATCOs in OPS)
14%9%
-1%
-9%
12%
2%
8%
-3%
-15%
-10%
-5%
0%
5%
10%
15%
20%
Per
cen
tag
e C
han
ge
2018-2019 AG
0001111122
AA
I
AE
RO
THA
I
Air
wa
ys N
Z
AN
A
AT
NS
EA
NA
ISA
VIA
JAN
S
NA
V C
AN
AD
A
Rat
io o
f Fro
ntl
ine
Serv
ice
Staf
f to
ATC
Os
in O
PS
2019 Avg Q1 Q3
Figure 18 - Ratio of frontline service staff to ATCO in OPS
The 2019 average ratio of frontline service staff to ATCO in OPS is 1.01 . The 2019 average of only the ANSPs that submitted for 2019 and 2018 is 1.01, an increase compared to 0.85 in 2018. Please note there is no four year CAGR data points for this KPI because ANSPs have only submitted frontline service staff data in 2018 and 2019.
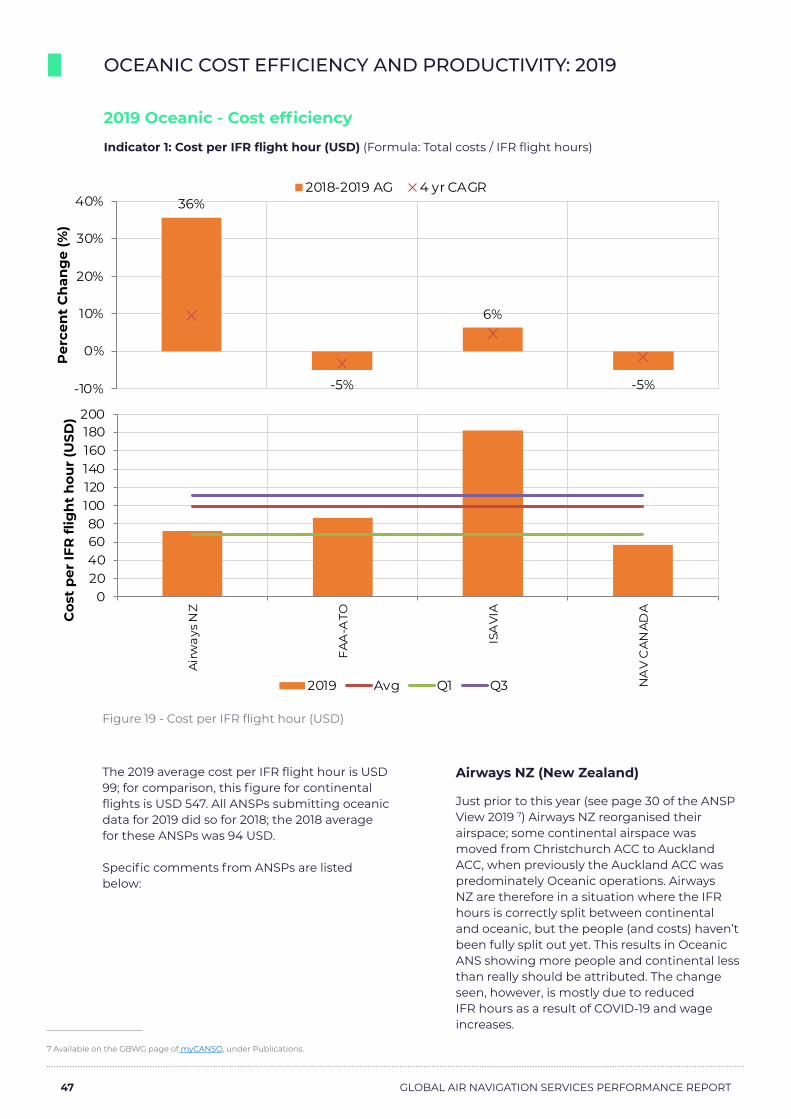
47 GLOBAL AIR NAVIGATION SERVICES PERFORMANCE REPORT
OCEANIC COST EFFICIENCY AND PRODUCTIVITY: 2019
2019 Oceanic - Cost efficiency
Indicator 1: Cost per IFR flight hour (USD) (Formula: Total costs / IFR flight hours)
36%
-5%
6%
-5%-10%
0%
10%
20%
30%
40%
Per
cen
t C
han
ge
(%)
2018-2019 AG 4 yr CAGR
020406080
100120140160180200
Air
wa
ys N
Z
FA
A-A
TO
ISA
VIA
NA
V C
AN
AD
A
Cos
t p
er IF
R fl
igh
t h
our
(USD
)
2019 Avg Q1 Q3
Figure 19 - Cost per IFR flight hour (USD)
The 2019 average cost per IFR flight hour is USD 99; for comparison, this figure for continental flights is USD 547. All ANSPs submitting oceanic data for 2019 did so for 2018; the 2018 average for these ANSPs was 94 USD.
Specific comments from ANSPs are listed below:
7 Available on the GBWG page of myCANSO, under Publications.
Airways NZ (New Zealand)
Just prior to this year (see page 30 of the ANSP View 2019 7) Airways NZ reorganised their airspace; some continental airspace was moved from Christchurch ACC to Auckland ACC, when previously the Auckland ACC was predominately Oceanic operations. Airways NZ are therefore in a situation where the IFR hours is correctly split between continental and oceanic, but the people (and costs) haven’t been fully split out yet. This results in Oceanic ANS showing more people and continental less than really should be attributed. The change seen, however, is mostly due to reduced IFR hours as a result of COVID-19 and wage increases.

48 GLOBAL AIR NAVIGATION SERVICES PERFORMANCE REPORT
2019 Oceanic - Cost efficiency
Indicator 2A: ATCOs in OPS employment cost per ATCOs in OPS hour (USD) (Formula: ATCOs in OPS employment costs / ATCOs in OPS Hours)
0
20
40
60
80
100
120
140
160
180
Air
way
s N
Z
FAA
-ATO
ISA
VIA
NA
V C
AN
AD
A
ATC
Os
in O
PS
emp
loym
ent
cost
per
A
TCO
s in
OP
S h
our
(USD
)
2019 Avg Q1 Q3
5%
-4%
19%
1%
-10%
0%
10%
20%
30%
Per
cen
t C
han
ge
(%)
2018-2019 AG 4 yr CAGR
Figure 20 - ATCOs in OPS employment per ATCOs in OPS hour (USD)
The 2019 oceanic average employment cost per ATCO in OPS hour is USD 133. For comparison, the 2019 figure for continental airspace is USD 104. All ANSPs submitting oceanic data for 2019 did so for 2018; the 2018 average was USD 127.
Specific comments from ANSPs are listed below:
ISAVIA (Iceland)
Total ATCO employment cost decreased for ISAVIA as did the working hours but IFR hours did not decrease in the same proportion leading to the result that ATCO employment cost per IFR flight hour as a ratio increased.

49 GLOBAL AIR NAVIGATION SERVICES PERFORMANCE REPORT
Indicator 2A: ATCOs in OPS employment cost per ATCOs in OPS hour (USD) – PPP adjusted
1% 0%
15%
4%
-10%
-5%
0%
5%
10%
15%
20%
Per
cen
t C
han
ge
(%)
2018-2019 AG 4 yr CAGR
020406080
100120140160180
Air
way
s N
Z
FAA
-ATO
ISA
VIA
NA
V C
AN
AD
A
ATC
Os
in O
PS
emp
loym
ent
cost
per
A
TCO
s in
OP
S h
our,
PP
P a
dju
sted
(USD
)
2019 2019 - PPP Avg Q1 Q3
Figure 21 - ATCOs in OPS employment per ATCOs in OPS hour (USD) - PPP adjusted
The 2019 oceanic average employment cost per ATCO (PPP Adjusted) in OPS hour is USD 133, the average figure for continental airspace is USD 154. All ANSPs submitting oceanic data for 2019 did so for 2018; the 2018 average was USD 129.

50 GLOBAL AIR NAVIGATION SERVICES PERFORMANCE REPORT
2019 Oceanic – Productivity
Indicator 2B: ATCOs in OPS hour productivity (Formula: IFR flight hours / ATCOs in OPS Hours)
-10%
44%
5% 3% 0%
-50%
0%
50%
100%
150%
200%
Per
cen
t C
han
ge
(%)
2018-2019 AG 4 yr CAGR
012345678
Air
wa
ys N
Z
AT
NS
FA
A-A
TO
ISA
VIA
NA
V C
AN
AD
AATCO
s in
OPS
hou
r pro
duct
ivity
2019 Avg Q1 Q3
Figure 22 - ATCOs in OPS hour productivity
The 2019 average ATCOs in OPS hour productivity is 4.09 IFR flight hours per ATCO in OPS hours, significantly higher than the continental figure of 0.73. All ANSPs submitting oceanic data for 2019 did so for 2018; the 2018 average is 4.07, showing a slight increase for 2019.
Specific comments from ANSPs are listed below:
Airways NZ
Just prior to this year (see page 30 of the ANSP View 20198) Airways NZ reorganised their airspace; some continental airspace was moved from Christchurch ACC to Auckland ACC, when previously the Auckland ACC was predominately Oceanic operations.
8 Available on the GBWG page of myCANSO, under Publications.
Airways NZ are therefore in a situation where the IFR hours is correctly split between continental and oceanic, but the people (and costs) haven’t been fully split out yet. This results in Oceanic ANS showing more people and continental less than really should be attributed. The change seen, however, is mostly due to reduced IFR hours as a result of COVID-19.
ATNS
While ATNS are not able to submit oceanic costs, they have provided productivity figures, hence their inclusion in this KPI.
IFR flight hours handled by ATNS declined by almost 50% as a result of SAA cancelling many of its regional and international sectors. ATCO in OPS also dropped by 82% due to the impact of the pandemic.
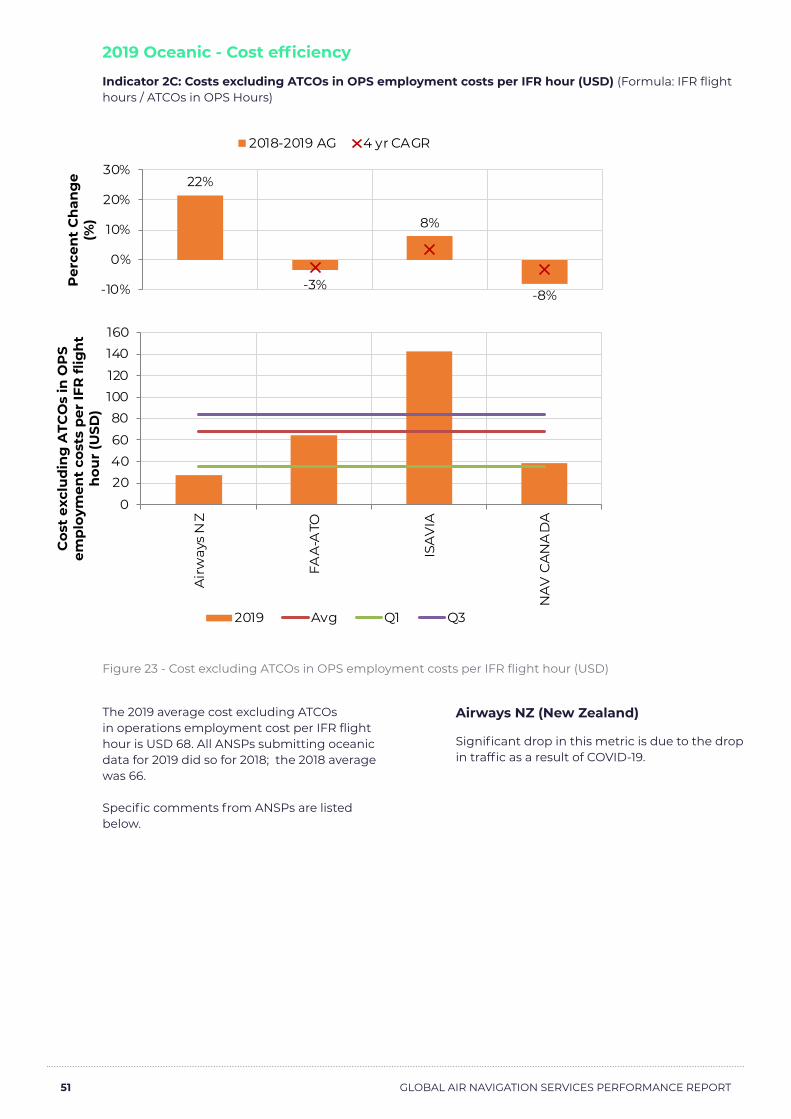
51 GLOBAL AIR NAVIGATION SERVICES PERFORMANCE REPORT
2019 Oceanic - Cost efficiency
Indicator 2C: Costs excluding ATCOs in OPS employment costs per IFR hour (USD) (Formula: IFR flight hours / ATCOs in OPS Hours)
22%
-3%
8%
-8%-10%
0%
10%
20%
30%
Per
cen
t C
han
ge
(%)
2018-2019 AG 4 yr CAGR
0
204060
80100120
140160
Air
way
s N
Z
FAA
-ATO
ISA
VIA
NA
V C
AN
AD
A
Cos
t ex
clu
din
g A
TCO
s in
OP
S em
plo
ymen
t co
sts
per
IFR
flig
ht
hou
r (U
SD)
2019 Avg Q1 Q3
Figure 23 - Cost excluding ATCOs in OPS employment costs per IFR flight hour (USD)
The 2019 average cost excluding ATCOs in operations employment cost per IFR flight hour is USD 68. All ANSPs submitting oceanic data for 2019 did so for 2018; the 2018 average was 66.
Specific comments from ANSPs are listed below.
Airways NZ (New Zealand)
Significant drop in this metric is due to the drop in traffic as a result of COVID-19.

52 GLOBAL AIR NAVIGATION SERVICES PERFORMANCE REPORT
2018 Oceanic - Cost efficiency
Indicator 2D: Proportion of total costs made up of ATCO in OPS employment costs (USD) (Formula: ATCO in OPS employment costs/Total Costs)
0%
10%
20%
30%
40%
50%
60%
70%
Air
wa
ys N
Z
FA
A-A
TO
ISA
VIA
NA
V C
AN
AD
A
Pro
por
tion
of t
otal
cos
ts m
ade
up
of
ATC
O e
mp
loym
ent
cost
s (U
SD)
2019 Avg Q1 Q3
2%-1%
6%4%
-10%
-5%
0%
5%
10%
15%
20%
25%
Per
cen
t C
han
ge
(%)
2018-2019 AG 4 yr CAGR
Figure 24 - Proportion of total costs made up of ATCO in OPS employment costs (USD)
The 2019 average for the proportion of total costs made up of ATCO in OPS employment costs is 36%. All ANSPs submitting oceanic data for 2019 did so for 2018; the 2018 average was 29%.
Specific comments from ANSPs are listed below:
Airways NZ (New Zealand)
Some continental costs within oceanic figures were unable to be extracted as part of moving a sector of airspace from Christchurch ACC to Auckland ACC, where Auckland ACC was predominantly oceanic operations.

53 GLOBAL AIR NAVIGATION SERVICES PERFORMANCE REPORT
JOINT CONTINENTAL AND OCEANIC COST EFFICIENCY: 2019
2019 Continental and Oceanic - Cost efficiency
Indicator CO1: Cost per IFR hour (USD) (Formula: Total costs /IFR flight hours)
-10%
16%
30%
-3%
6%1%
0%
3%
18%
-3%
19%
5%
16%
-9%-9%-2%
22%
-1%
61%
14%
3%
-4%-1%
0%
-1%-3%
9%
-1%
-12%
-1%
2%
0%
10%
-3%
5%0%
9%1% 3%
-1%
1%
0%-5%
5%
18%11%
0% -2%
4%
25%
-20%
0%
20%
40%
60%
80%
Per
cen
tag
e C
han
ge
2018-2019 AG 4 yr CAGR
0
500
1000
1500
2000
2500
AAI
AER
OTH
AIA
irway
s N
ZA
lbco
ntro
lA
NA
AN
S C
RA
NS
Fin
land
AR
MA
TSA
TNS
Aus
tro
Con
trol
Avi
nor
(Con
tinen
tal)
BU
LATS
AC
AAS
Cro
atia
Con
trol
DCA
C C
ypru
sD
FSD
HM
ID
SNA
EAN
AEA
NS
ENA
IRE
ENA
VFA
A-A
TOH
CAA
Hun
gar
ocon
trol
IAA
ISA
VIA
JAN
SK
CAA
LFV
LGS
LPS
LVN
LM
ATS
M-N
AV
MO
LDAT
SAM
UA
CN
ATS
(Con
tinen
tal)
NAV
CAN
AD
AN
av P
ortu
gal
…N
AVIA
IRO
ro N
avig
acija
PAN
SAR
OM
ATS
ASa
kaer
onav
igat
sia
skey
esSk
ygui
de
Slov
enia
Con
trol
SMAT
SAU
kSA
TSE
Cos
t p
er IF
R fl
igh
t h
our
(USD
)
2019 Avg Q1 Q3
Figure 25 - Cost per IFR flight hour (USD)
The 2019 average cost per IFR flight hour is USD 542. All ANSPs that submitted in 2019 did so in 2018; the 2018 average was USD 518.

54 GLOBAL AIR NAVIGATION SERVICES PERFORMANCE REPORT
2019 Continental and Oceanic - Cost efficiency
Indicator CO2D: Employment cost of ATCOs in OPS as a percentage of total costs (Formula: ATCOs in OPS employment costs / Total costs)
30%
7%
0%
-10%-3% 0% -1%
11%
-2%
9%
21%
3% 2%
11% 8%
-2%-2%-3% 0%-5%
3%
-3%-2%
4%
16%
-9%
5%
-3%
1% 3%
0%
-51%
1% 3%
-6%
7%
-2%-3%
-12%
3% 0%7%
-2%
27%
-5%-2%
4%
-5%
13%
-60%
-40%
-20%
0%
20%
40%
Per
cen
tag
e C
han
ge
2018-2019 AG 4 yr CAGR
0%
10%
20%
30%
40%
50%
60%
AA
IA
ER
OTH
AI
Air
wa
ys N
ZA
lbco
ntr
ol
AN
AA
NS
CR
AN
S Fi
nla
nd
AR
MA
TSA
TN
SA
ust
ro C
ontr
olA
vin
or (C
on
tin
enta
l)B
ULA
TSA
Cro
atia
Co
ntr
ol
DC
AC
Cyp
rus
DF
SD
HM
ID
SN
AE
AN
AE
AN
SE
NA
IRE
EN
AV
FA
A-A
TOH
CA
AH
un
gar
oco
ntr
ol
IAA
ISA
VIA
JAN
SK
CA
ALF
VLG
SLP
SLV
NL
MA
TSM
-NA
VM
OLD
AT
SAM
UA
CN
ATS
(C
on
tin
en
tal)
NA
V C
AN
AD
AN
av
Po
rtu
ga
l (C
on
tin
enta
l)N
AV
IAIR
Oro
Na
vig
aci
jaP
AN
SA
RO
MA
TSA
Sak
aer
ona
vig
atsi
ask
eye
sS
kyg
uid
eS
love
nia
Con
trol
SM
ATS
AU
kSA
TSE
Pro
por
tion
of t
otal
cos
ts m
ade
up
of
ATC
O e
mp
loym
ent
cost
s
2019 Avg Q1 Q3
Figure 26 - Employment cost of ATCOs in OPS as a percentage of total cost
The 2019 average employment cost of ATCOs in OPS as a percentage of total costs is 29%. All ANSPs that submitted data in 2019 did so in 2018; the 2018 average was 28%.

55 GLOBAL AIR NAVIGATION SERVICES PERFORMANCE REPORT
SUMMARY OF PERFORMANCE TRENDS
Key findings: ⁃ Increases in costs outweighed increases
in traffic in 2019, in contrast to 2018.
⁃ Increases in employment costs were consistent with those recorded in the last two years.
⁃ The rate of ATCO productivity increase slowed in 2019.
⁃ In contrast to the previous two years, costs excluding ATCO in OPS employment costs per IFR flight hour increased for the majority of ANSPs.
In an industry that is today still experiencing the impacts of the COVID-19 pandemic, 2019 is regularly referred to as a reference year for normal traffic levels. However, slowing traffic growth in 2019 resulted in a number of the key trends from previous years being reversed.
Cost Efficiency
In the case of total cost efficiency, 57% of 52 ANSPs experienced an increase in cost per IFR flight hour, compared to only 43% in 2018, when comparing the same set of ANSPs. The rate of traffic growth fell in 2019, with combined IFR flight hours growth falling from 4.58% (2017-2018) to 1.63% (2018-2019), when comparing the same set of ANSPs.
In contrast to 2018, the majority of ANSPs also saw an increase in their ‘Costs excluding ATCO in OPS employment costs’ relative to traffic during 2019, which will have contributed to the observed worsening in cost efficiency. The effect of this increase will have been heightened by continued increases in ATCO costs per ATCO hour, with 75% of continental and 60% of oceanic service providers reporting an increase in this metric.
Productivity
The proportion of ANSPs experiencing increases in ATCO productivity is significantly reduced compared to previous years: 59% of ANSPs saw an increase in their ATCO productivity when compared to 78% in 2018. It appears that the cause for this is the slowing in IFR flight hours growth and an increase in ATCO in OPS hours – total number of continental and oceanic ATCO in OPS increased 1.14% 2018-2019, compared to 0.72% between 2017-2018.
Analysis presented in the Annex 1 - Impact of COVID-19 on 2019 performance shows that six ANSPs have a financial year that extends beyond December 2019. Their data has therefore been affected by the reduced traffic caused by the pandemic.
Cost-efficiency vs Productivity
Despite ATCO productivity growth slowing, the KPI did still increase for the majority of ANSPs. Therefore it can be deduced that the reduced cost efficiency is influenced by increasing ATCO in OPS employment costs and other costs, in the face of slowing traffic growth.
Future performance
The impact of the COVID-19 pandemic on ANSP performance will significantly impact the results of future reports. It is very likely that the slowing of ATCO productivity and falling of cost efficiency will continue worsen as a dramatic drop in IFR flight hours is anticipated in the data of all ANSPs. Costs and ATCO hours are unlikely to fall at a proportional rate, as ANSPs have been required to keep their airspace open during the pandemic, but with severely depleted traffic.
The challenge will be to recover ATCO productivity and cost efficiency in a sustainable manner by incorporating solutions that ensure ANSPs improve their resilience to future changes in traffic demand. Resilience and cost scalability are key themes in the contextual information questions in the 2016-2020 data collection cycle, and will provide the basis for the theme of next year’s report.
If you are interested in participating in next year’s report or the CANSO GBWG, then please get in touch via [email protected].

56 GLOBAL AIR NAVIGATION SERVICES PERFORMANCE REPORT
ANNEX 1 - IMPACT OF COVID-19 ON 2019 PERFORMANCE
9 https://www.bbc.co.uk/news/world-51235105 10 Taken from WHO COVID-19 weekly update 5th October
During the 33rd meeting of the GBWG (GBWG/33), the group discussed how the impact of the COVID-19 pandemic on IFR flight hours will affect performance trends. While this will be more relevant to the 2016-2020 data collection cycle, a small collection of ANSPs’ performance could be affected in the 2015-2019 data, where their reporting periods cross into 2020.
To summarise the extent to which 2015-2019 data is impacted, in collaboration with FAA-ATO, we have set out details of the timeline of COVID-19 in this document.
As highlighted in the participation section of the Global ANS Performance Report, the reporting periods of members’ organisations are not aligned in all instances. The performance data of those ANSPs that have reporting periods running into the first part of 2020 may be impacted by the drop in traffic caused by the COVID-19 pandemic.
Figure 27 provides a view on the number of COVID-19 cases recorded across the different regions of the globe through the course of 2020. The Western Pacific Region was the first region within which there was a significant spike in recorded COVID-19 infections, beginning in late January, and peaking during the w/c 10th February. The rise of recorded infections then began to spread across the globe, with Europe noticing a significant spike in March, peaking at the start of April. Recorded cases then began to increase significantly in the Americas and Eastern Mediterranean during the month of April and May. Africa followed next, with recorded cases building to a peak during late-May and June. The last region to see a spike in recognised infections was South-East Asia, where recorded cases peaked during July and August. The number of deaths due to COVID-19 follows a similar regional pattern during 20209.
Figure 27 - Number of COVID-19 cases reported weekly by WHO Region, and global deaths, 30 December to 04 October10

57 GLOBAL AIR NAVIGATION SERVICES PERFORMANCE REPORT
To some extent, aircraft movements across 2020 (as shown in Figure 28) follow a similar regional staggered pattern to the distribution of cases shown in Figure 27. Figure 28 highlights the clear reduction in aircraft movements in Asia in February, several weeks ahead of the marked traffic decreases seen in other regions (NB: the CANSO Asia Pacific region used in Figure 28 contains a subset of the countries included in the WHO’s Western Pacific region11). During this initial stage of the pandemic, Europe and North America only faced minor traffic decreases, as travel bans were limited to certain routes to and from China during the early stages of the pandemic.
11 https://www.who.int/countries/ 12 https://www.iata.org/en/pressroom/pr/2020-07-07-01/
During March 2020, the timeframe within which aircraft movements in the remaining regions dropped was, however, far more truncated than that of the increase in number of COVID-19 cases. This reflects the sudden, and wide reaching, travel restrictions imposed by governments to prevent further infections being introduced to their respective countries through their borders at the start of the pandemic. This drop in movements also reflects the drastic shift of passenger opinion towards an avoidance of air travel to reduce the risk of catching COVID-1912 .
Percent change in movements by region
Figure 28 - Percentage change in aircraft movements by region, during 2020. Taken from CANSO ATM Traffic Analysis Report (November 2020)
There is a clear correlation between the rise in coronavirus cases globally and the unprecedented and sustained drop in traffic seen during the first months of 2020. The effect this will have had on ANSPs with regards to their performance data will be significant, notably affecting those ANSPs in Asia approximately one month earlier than others across the rest of the world.
In collaboration with FAA-ATO, we have highlighted those ANSPs’ whose reporting period stretches into 2020, to identify 2019 performance data that may have been significantly affected by the impact of the COVID-19 pandemic. This must be taken into context when interpreting the trends of those affected ANSPs included in the 2019 Performance Data section.

58 GLOBAL AIR NAVIGATION SERVICES PERFORMANCE REPORT
Reporting periods and COVID-19
Figure 29 - ANSPs with reporting periods running into 2020
Jul-18 Jun-19 Airservices
Sep-18 Aug-19 NAV CANADA
Oct-18 Sep-19AEROTHAI
FAA-ATO
Jan-19 Dec-19
Albcontrol
COVID-19
ANA
ANS CR
ANS Finland
ARMATS
Austrol Control
Avinor (Continental)
BULATSA
Croatia Control
DCA Cyprus
DFS
DHMI
DSNA
EANA
EANS
ENAIRE
HCAA
HungaroControl
IAA
Isavia
LFV
LGS
LPS
LVNL
M-NAV
MATS
MOLDATSA
MUAC
NATS (Continental)
NAV Portugal (Continental)
NAVIAIR
Oro Navigacija
PANSA
PNGASL
ROMATSA
Sakaeronavigatsia
SANS
skeyes
skyguide
Slovenia Control
SMATSA
UkSATSE
Apr-19 Mar-20
AAI
ATNS
CAAS
JANS
Jul-19 Jun-20Airways NZ
KCAA
Apr-18 Oct-18 Apr-19 Oct-19 Apr-20

59 GLOBAL AIR NAVIGATION SERVICES PERFORMANCE REPORT
As part of the ‘general’ tab in the 2020 submissions workbook, a question regarding the potential impact of the COVID-19 on the data provided in the reference period was included. The responses for the ANSPs’ in question are provided in the table below:
ANSP Comment
AAI“COVID-19 has had an impact on the last two months of the control period (February and March 2020)”
Airways NZ “Significant drop in IFR hours and revenue while cost base increasing.”
ATNS“COVID-19 impacted on ATNS movements, revenue and achievement of planned projects especially for the months of February and March”
CAAS“COVID-19 has resulted in a significant decline in IFR flight hours in February and March 2020”
JANS“It had a big impact on IFR flight hours. In particular, IFR flight hours in March decreased by about 29% compared to the same month of previous year. I can't forecast impact but I think the 2020 KPI will decrease significantly.”
KCAA “Suspension of passenger flights due COVID-19.”
The information above provides insight into where trends in the 2019 performance data are likely to be skewed due to the overlapping of some reporting periods with 2020 and thus the impacts of the COVID-19 pandemic. The findings should be noted in particular for any analyses of the performance of AAI, ATNS, CAAS and JANS, and even more so for Airways NZ and KCAA.
The 2016-2020 data collection cycle will provide a unique insight into the impact of the pandemic on ANSP performance. The Global Benchmarking Workgroup will look for opportunities for early reporting on performance trend impacts on the group’s global cohort of members, and will be complemented by working discussions during GBWG/36 in October 2021.

60 GLOBAL AIR NAVIGATION SERVICES PERFORMANCE REPORT
ANNEX 2: DATA DEFINITIONSCONTEXTUAL DATA ELEMENT DEFINITIONS
Data Element Definitions
IFR hours per sq. kmThis is the result of dividing the number of IFR hours for the current year of data by surface area (in square kilometres).
Sq. km – oceanic and continental
The size (the surface area) of the airspace for which an ANSP is responsible. This should include the area where ANS have been delegated to the ANSP by another provider, and exclude the area in which ANS have been delegated to another ANSP. The sq. km here should be consistent with ACC coverage with respect to total area. Differentiation for facilities controlling only upper or lower airspace will be addressed by item 3 below. (Source: PRU D1).
Percentage surveillance coverage at 30,000ft - primary radar
Surveillance coverage from primary radar.
Percentage surveillance coverage at 30,000ft - secondary radar
Surveillance coverage from secondary radar.
Percentage surveillance coverage at 30,000ft - ADS-B
Surveillance coverage from ADS-B.
Percentage surveillance coverage at 30,000ft - Space based ADS-B
Surveillance coverage from space-based ADS-B.
Percentage ADS-C coverage at 30,000 ft
Surveillance coverage from ADS-C.
Number of FIRsA Flight Information Region is airspace of defined dimensions within which flight information service and alerting service are provided.
Number of ACC facilitiesACC facilities are the ATC units providing ATC services to en-route traffic in control areas under its jurisdiction. Part of an ACC may also provide approach services.
Number of co-located ACC and approach facilities
An ACC unit is described above. An approach control unit is an ATC unit providing ATC services to arriving, departing and over-flying flights within the airspace in the vicinity of an airport.
Number of stand-alone approach facilities
Definition of an approach control unit is above.
Number of co-located approach and tower facilities
Definition of an approach control unit is above. Tower facilities, or a tower control unit, is an ATC unit at an airport responsible for the provision of ATC services in respect of flights that are landing and taking off and other traffic that is on the active runway(s).
Number of co-located approach, tower and ACC facilities
For definitions see above.
Number of stand-alone towers Definition of a tower control unit is above.

61 GLOBAL AIR NAVIGATION SERVICES PERFORMANCE REPORT
INPUT DATA DEFINITIONS
Data Element Definitions
Total Costs
The sum of operating costs, depreciation/amortisation and cost of capital related to providing continental and oceanic ATC/ATFM services. Meteorological costs and EUROCONTROL costs (if applicable) are not included.
IFR flight hoursTotal number of controlled IFR flight hours in continental and oceanic airspace.
ATCO hoursTotal annual working hours for ATCOs in operations – including breaks and overtime. Holiday is not included.
ATCO employment cost
Total employment costs including gross wages and salaries, payments for overtime and other bonuses, employer contribution to social security scheme and taxes, pension contributions and other benefits for ‘ATCOs in operations’. This excludes: mission related expenditures, including travel expenditures and training fees, as these are considered operating costs.
Other costs Total operating costs minus ATCO in OPS employment costs.
Number of ATCOs
The number of FTE ATCOs – whose employment costs were included in "ATCO employment cost" – participating in an activity that is either directly related to the control of traffic or is a necessary requirement for ATCOs to be able to control traffic.
Number of Frontline Service Support Staff
Sum of ATC assistants, ops support, ops support (non-ATCOs), technical support staff for operational maintenance monitoring and control, technical support staff for planning and development. ATCOs on other duties, and outsourced frontline service support.

62 GLOBAL AIR NAVIGATION SERVICES PERFORMANCE REPORT
ANNEX 3: KEY PERFORMANCE INDICATORSThe detailed metrics for determining the cost efficiency and productivity of continental and oceanic air navigation services are set out in Figure 30. These performance indicators are derived from the CANSO ANS Performance Framework.
DETERMINING PERFORMANCE METRICSThe CANSO ANS Performance Framework was established to create common performance indicators for global ANS data. Based on a tiered structure, the framework was developed in 2014 by the CANSO Global Benchmarking Workgroup (GBWG). It aims to demonstrate the drivers of cost efficiency.
Over the years, the GBWG has worked to identify alternative KPIs to investigate the drivers of the KPIs in the framework, in particular KPI 2C. Last year, KPI 3D was added to framework to better understand the proportion of ‘frontline service support staff’ to ATCO in OPS in an ANSP.
It is important to note the dependence of the higher tier metrics on the lower tier. This can be established as follows:
KPI 1 = +KPI 2C(KPI 2A)(KPI 2B)
KPI 2A = (KPI 3A)(KPI 3B)
KPI 2B =(KPI 3C)(KPI 3B)
KPI 2D = +KPI 1
KPI 2AKPI 2B KPI 1-KPI 2C
KPI 1
Figure 30 - CANSO ANS performance framework
Level 1
Level 2
Level 3
1
2A
3A 3B 3C 3D
2D 2C2B
Cost-efficiency KPI:
ATCOs in OPS costs Other costs
ATCO employment cost per ATCO hour
Annual employment cost per ATCO in OPS
Annual working hours per ATCO in OPS
Annual IFR hours per ATCO in OPS
Ratio of frontline service staff to ACTO in OPS
Proportion of total costs made up of ATCO in OPS employment costs
ATCO in OPS employment cost
ACTO in OPS Employment cost
ATCOs in OPS hours IFR hours Frontline staff
ATCO in OPS employment cost
Costs excl. ATCO employment costs
• Non ATCO in OPS staff costs
• Non-staff operating costs• Depreciation costs• Capital costs
IFR flight hours
ATCO hours
No. ATCOs No. ATCOs No. ATCOs No. ATCOs in OPS
Total Costs IFR flight hoursATCO hours
ATCO hour productivity
Total Costs
IFR flight hours

63 GLOBAL AIR NAVIGATION SERVICES PERFORMANCE REPORT
ANNEX 4: CONTEXTUAL DATAPlease note contextual data is only included for CANSO GBWG submitters.
ANSP: AIRPORTS AUTHORITY OF INDIA
In your opinion, what are the main drivers or issues for performance within your region? Consistent traffic growth in APAC
What are the main initiatives you are undertaking to improve your performance?
Adopting latest ATM technologies like space based ADS-B
Were there any factors that impacted your individual ANSP performance in your 2019 reporting period, as shown in the KPIs in this report? For example, exceptional events in the year related to traffic
Closure of neighbouring ANSP airspace
Legal status:
A government entity empowered to manage and use the revenues it generates through charges for the services it provides.
CONTEXTUAL DATA ELEMENT CONTINENTAL OCEANIC COMMENTS
Operational data
IFR hours per sq. km. 1.034
Sq. km. – oceanic and continental 3,570,000 6,400,000
Percentage surveillance coverage at 30,000ft – primary radar
100.0 0.00%
Percentage surveillance coverage at 30,000ft – secondary radar
100.0 0.00%
Percentage surveillance coverage at 30,000ft – ADS-B
100.0 0.00%
Percentage surveillance coverage at 30,000ft – Space based ADS-B
0.0 100.00%
Percentage ADS-C coverage at 30,000 ft 0.0 100.00%
Number of FIRs 1 3
3 Oceanic FIRs are also partially continental.

64 GLOBAL AIR NAVIGATION SERVICES PERFORMANCE REPORT
CONTEXTUAL DATA ELEMENT CONTINENTAL OCEANIC COMMENTS
Facilities
Number of ACC facilities 0
Number of co-located ACC and approach facilities
0
Number of stand-alone approach facilities 0
Number of co-located approach and tower facilities
76
Number of stand-alone towers 5
Number of co-located ACC, approach and tower facilities
16

65 GLOBAL AIR NAVIGATION SERVICES PERFORMANCE REPORT
ANSP: AEROTHAI
Does your ANSP have stated objectives? If so, what are they?
Yes. We have 10 strategic objectives supporting our vision of "a sustainable quality excellent air navigation service provider."
In your opinion, what are the main drivers or issues for performance within your region?
Augmentation of air traffic (demand/volume), aviation technology and infrastructure development are significant drivers for performance improvement in region. It is important to adopt technology that can scale up both operation and infrastructure to support air traffic growth.
What are the main initiatives you are undertaking to improve your performance?
1. We are in the process of transitioning to the new ATM system which will be fully operated in February 2020.
2. We have been working with ANSPs in Asia Pacific to develop and employ multi-nodal ATFM to improve air traffic flow within the region.
3. We have been working with the Thai government and the military to improve the commercial use of Thai airspace.
Were there any factors that impacted your individual ANSP performance in your 2019 reporting period, as shown in the KPIs in this report? For example, exceptional events in the year related to traffic
1. ATCO in ops hours is increased due to process of training and working on transitioning to the new ATM system.
2. ATCO in ops and Non-ATCO in ops employment cost are higher due to the adjustment of pension contribution refer to LABOUR PROTECTION ACT (NO.7) B.E. 2562 (2019).
Legal status:
A company established as a public-private partnership to provide the services on behalf of the government, and part-owned by the government.
CONTEXTUAL DATA ELEMENT CONTINENTAL COMMENTS
Operational data
IFR hours per sq. km. 1.113
Sq. km. – oceanic and continental 777,760
Percentage surveillance coverage at 30,000ft – primary radar 5%
Percentage surveillance coverage at 30,000ft – secondary radar 100%
Percentage surveillance coverage at 30,000ft – ADS-B 0
Percentage surveillance coverage at 30,000ft – Space based ADS-B
0
Percentage ADS-C coverage at 30,000 ft 0
Number of FIRs 1
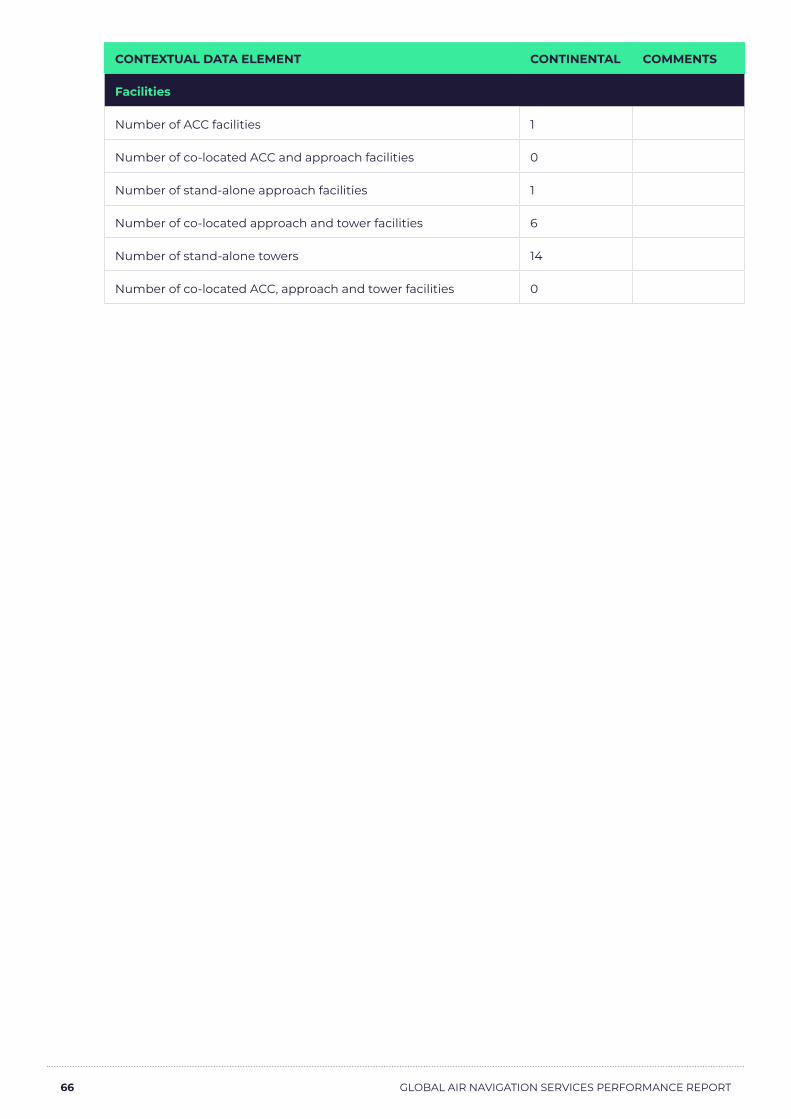
66 GLOBAL AIR NAVIGATION SERVICES PERFORMANCE REPORT
CONTEXTUAL DATA ELEMENT CONTINENTAL COMMENTS
Facilities
Number of ACC facilities 1
Number of co-located ACC and approach facilities 0
Number of stand-alone approach facilities 1
Number of co-located approach and tower facilities 6
Number of stand-alone towers 14
Number of co-located ACC, approach and tower facilities 0

67 GLOBAL AIR NAVIGATION SERVICES PERFORMANCE REPORT
ANSP: AIRWAYS NEW ZEALAND
Does your ANSP have stated objectives? If so, what are they?
Creating flexible and responsive operations. Focus on sustainability. Growing partnerships with tomorrows customers and suppliers eg. UAV and space based technologies. Implementing new ATM platform which will result in one ATM platform for both continental and oceanic operations replacing the current setup with two systems
In your opinion, what are the main drivers or issues for performance within your region?
Fairly rigid staff costs and low ability to respond quickly with staffing changes due to collective agreement constraints and long training times, less predictability with customer schedule volatility, reactionary behaviour by customers to industry demands/trends. Emerging technology eg. Digital towers
What are the main initiatives you are undertaking to improve your performance?
Building a new ATM platform incorporating both continental and oceanic operations as well as electronic flight strips into all towers. Cross skilling of workforce, up skilling and airspace resectorisation review initiated
Were there any factors that impacted your individual ANSP performance in your 2019 reporting period, as shown in the KPIs in this report? For example, exceptional events in the year related to traffic
Impact of COVID-19 is felt in our data set due to our financial year ending 30 June 2020. Plus a continuance from previous year where continental airspace was transferred to Auckland ACC but as yet unable to separate continental costs from oceanic costs so oceanic costs will appear higher (as noted in last year’s report) and continental costs lower.
Legal status:
A government entity empowered to manage and use the revenues it generates through charges for the services it provides.
CONTEXTUAL DATA ELEMENT CONTINENTAL OCEANIC COMMENTS
Operational data
IFR hours per sq. km. 0.2448 0.0035
Sq. km. – oceanic and continental 863,100 28,790,000
Percentage surveillance coverage at 30,000ft - primary radar
40.0% 0.00% approx values
Percentage surveillance coverage at 30,000ft - secondary radar
100.0% 0.00%
Percentage surveillance coverage at 30,000ft - ADS-B
90.0% 5.00% approx values
Percentage surveillance coverage at 30,000ft - Space based ADS-B
0.0 0.00%
Percentage ADS-C coverage at 30,000 ft 100.0% 100.00%
Number of FIRs 1 1

68 GLOBAL AIR NAVIGATION SERVICES PERFORMANCE REPORT
CONTEXTUAL DATA ELEMENT CONTINENTAL OCEANIC COMMENTS
Facilities
Number of ACC facilities 0 1
Number of co-located ACC and approach facilities
1 0
Number of stand-alone approach facilities 0 0
Number of co-located approach and tower facilities
6 0
Number of stand-alone towers 11 0
ZQN tower now Aerodrome only with approach being provided by ACC
Number of co-located ACC, approach and tower facilities
0 0

69 GLOBAL AIR NAVIGATION SERVICES PERFORMANCE REPORT
ANSP: AIR NAVIGATION SERVICES OF THE CZECH REPUBLIC
Does your ANSP have stated objectives? If so, what are they?
Yes, objectives are stated in the corporate Business Plan developed currently for years 2015 to 2019. Objectives covers current 4 KPAs: SAF, ENV, CAP and CEF
In your opinion, what are the main drivers or issues for performance within your region?
EU regulations on Performance and Charging Scheme
What are the main initiatives you are undertaking to improve your performance?
Internal performance monitoring system with predefined objectives to be met
Were there any factors that impacted your individual ANSP performance in your 2019 reporting period, as shown in the KPIs in this report? For example, exceptional events in the year related to traffic
Continuing network measures in the European NM area. Adverse network effects when some of the neighbouring ACCs had capacity issues, effectively "walling in" the Czech airspace.
Legal status:
A corporatised entity with special status, not governed by normal commercial law but by a specific founding law or statute (and wholly owned by the government).
CONTEXTUAL DATA ELEMENT CONTINENTAL COMMENTS
Operational data
IFR hours per sq. km. 3.624
Sq. km. – oceanic and continental 76,900
Percentage surveillance coverage at 30,000ft - primary radar
100%
Percentage surveillance coverage at 30,000ft - secondary radar
100%
Percentage surveillance coverage at 30,000ft - ADS-B 100%
Percentage surveillance coverage at 30,000ft - Space based ADS-B
100%
Percentage ADS-C coverage at 30,000 ft 100%
Number of FIRs 1
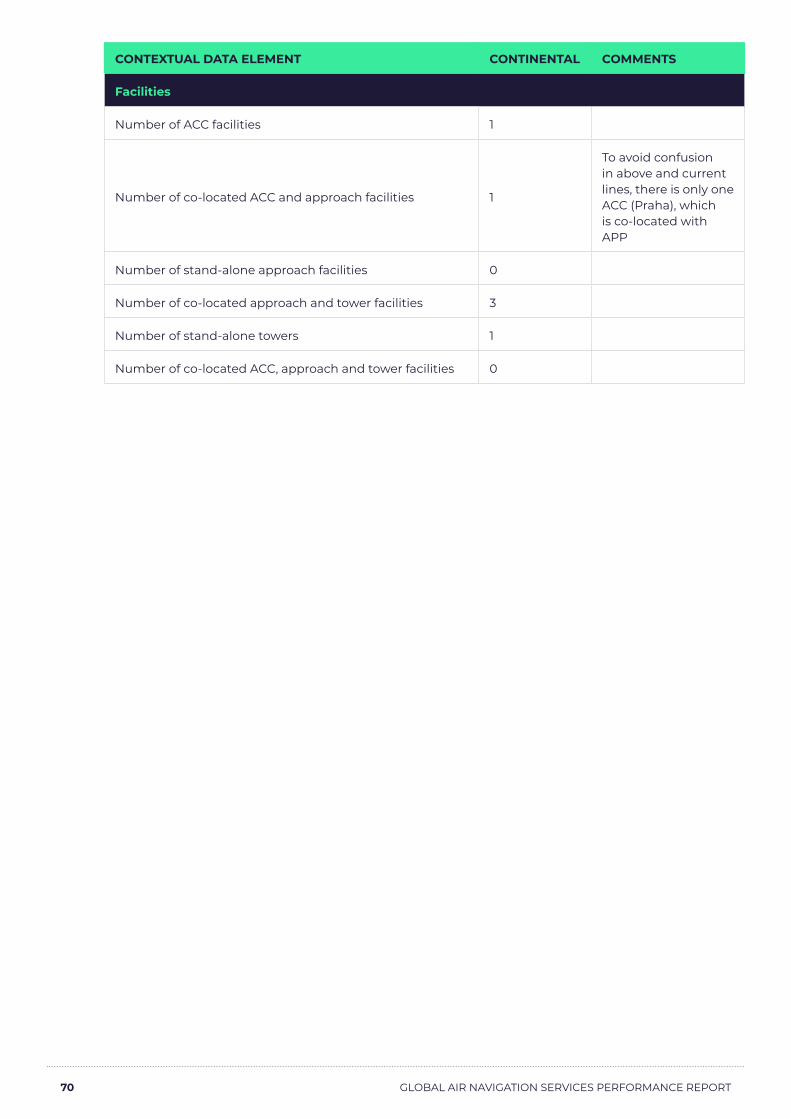
70 GLOBAL AIR NAVIGATION SERVICES PERFORMANCE REPORT
CONTEXTUAL DATA ELEMENT CONTINENTAL COMMENTS
Facilities
Number of ACC facilities 1
Number of co-located ACC and approach facilities 1
To avoid confusion in above and current lines, there is only one ACC (Praha), which is co-located with APP
Number of stand-alone approach facilities 0
Number of co-located approach and tower facilities 3
Number of stand-alone towers 1
Number of co-located ACC, approach and tower facilities 0

71 GLOBAL AIR NAVIGATION SERVICES PERFORMANCE REPORT
ANSP: AIR NAVIGATION SERVICES FINLAND OY (PREVIOUSLY FINAVIA)
Does your ANSP have stated objectives? If so, what are they?
Objectives are defined in RP3 performance plan (RP3 performance plans will be updated in 2021)
In your opinion, what are the main drivers or issues for performance within your region? COVID-19
What are the main initiatives you are undertaking to improve your performance?
Remarkable staff cost savings in 2020 and 2021
Were there any factors that impacted your individual ANSP performance in your 2019 reporting period, as shown in the KPIs in this report? For example, exceptional events in the year related to traffic
Good traffic development in 2019.
Legal status:
A corporatised entity with special status, not governed by normal commercial law but by a specific founding law or statute (and wholly owned by the government). General Companies act is applied.
CONTEXTUAL DATA ELEMENT CONTINENTAL COMMENTS
Operational data
IFR hours per sq. km. 0.309
Sq. km. – oceanic and continental 411,000
Percentage surveillance coverage at 30,000ft – secondary radar
100%
Number of FIRs 1
Facilities
Number of ACC facilities 1
Number of co-located ACC and approach facilities 1
Number of stand-alone approach facilities 0
Number of co-located approach and tower facilities 5
Number of stand-alone towers 15
Number of co-located ACC, approach and tower facilities 1

72 GLOBAL AIR NAVIGATION SERVICES PERFORMANCE REPORT
ANSP: AIR TRAFFIC & NAVIGATION SERVICES (SOUTH AFRICA)
Does your ANSP have stated objectives? If so, what are they?
Yes, these objectives includes Financial, Customer Service Related objectives, Internal Process Improvement, Human Resources Related objectives as well as Shareholder related objectives
In your opinion, what are the main drivers or issues for performance within your region?
The current issue relates to the impact of COVID-19 on our business
What are the main initiatives you are undertaking to improve your performance?
Stakeholder Engagement, Investigation of alternative funding, Influencing government regulations relating to COVID-19 measures
Were there any factors that impacted your individual ANSP performance in your 2019 reporting period, as shown in the KPIs in this report? For example, exceptional events in the year related to traffic
Yes, COVID-19
Legal status:
A government entity empowered to manage and use the revenues it generates through charges for the services it provides.
CONTEXTUAL DATA ELEMENT CONTINENTAL OCEANIC COMMENTS
Operational data
IFR hours per sq. km. 0.030 -No oceanic IFR flight hours submission
Sq. km. – oceanic and continental 9,279,080 12,720,920
Percentage surveillance coverage at 30,000ft - primary radar
92.0 0.00%
Percentage surveillance coverage at 30,000ft - secondary radar
98.0 0.00%
Percentage surveillance coverage at 30,000ft - ADS-B
0.0 0.00%
Percentage surveillance coverage at 30,000ft - Space based ADS-B
0.0 0.00%
Percentage ADS-C coverage at 30,000 ft 0.0 95.00%
Number of FIRs 2 1

73 GLOBAL AIR NAVIGATION SERVICES PERFORMANCE REPORT
CONTEXTUAL DATA ELEMENT CONTINENTAL OCEANIC COMMENTS
Facilities
Number of ACC facilities 0 0
Number of co-located ACC and approach facilities
0 0
Number of stand-alone approach facilities 0 0
Number of co-located approach and tower facilities
9 0
Number of stand-alone towers 10 0
Number of co-located ACC, approach and tower facilities
2 0

74 GLOBAL AIR NAVIGATION SERVICES PERFORMANCE REPORT
ANSP: CIVIL AVIATION AUTHORITY OF SINGAPORE
Legal status:
A government entity empowered to manage and use the revenues it generates through charges for the services it provides.
CONTEXTUAL DATA ELEMENT CONTINENTAL COMMENTS
Operational data
IFR hours per sq. km. 0.5492
Sq. km. – oceanic and continental 840,000
Number of FIRs 1
Facilities
Number of ACC facilities 1
Number of co-located ACC and approach facilities 0
Number of stand-alone approach facilities 1
Number of co-located approach and tower facilities 0
Number of stand-alone towers 2
Number of co-located ACC, approach and tower facilities 0

75 GLOBAL AIR NAVIGATION SERVICES PERFORMANCE REPORT
ANSP: DEVLET HAVA MEYDANLARI İŞLETMESI GENEL MÜDÜRLÜĞÜ
Legal status:
A government entity empowered to manage and use the revenues it generates through charges for the services it provides.
CONTEXTUAL DATA ELEMENT CONTINENTAL COMMENTS
Operational data
IFR hours per sq. km. 1.511
Sq. km. – oceanic and continental 982,000
Number of FIRs 2
Facilities
Number of ACC facilities 2
Number of co-located ACC and approach facilities 3
Number of stand-alone approach facilities 0
Number of co-located approach and tower facilities 44
Number of stand-alone towers 0
Number of co-located ACC, approach and tower facilities 0
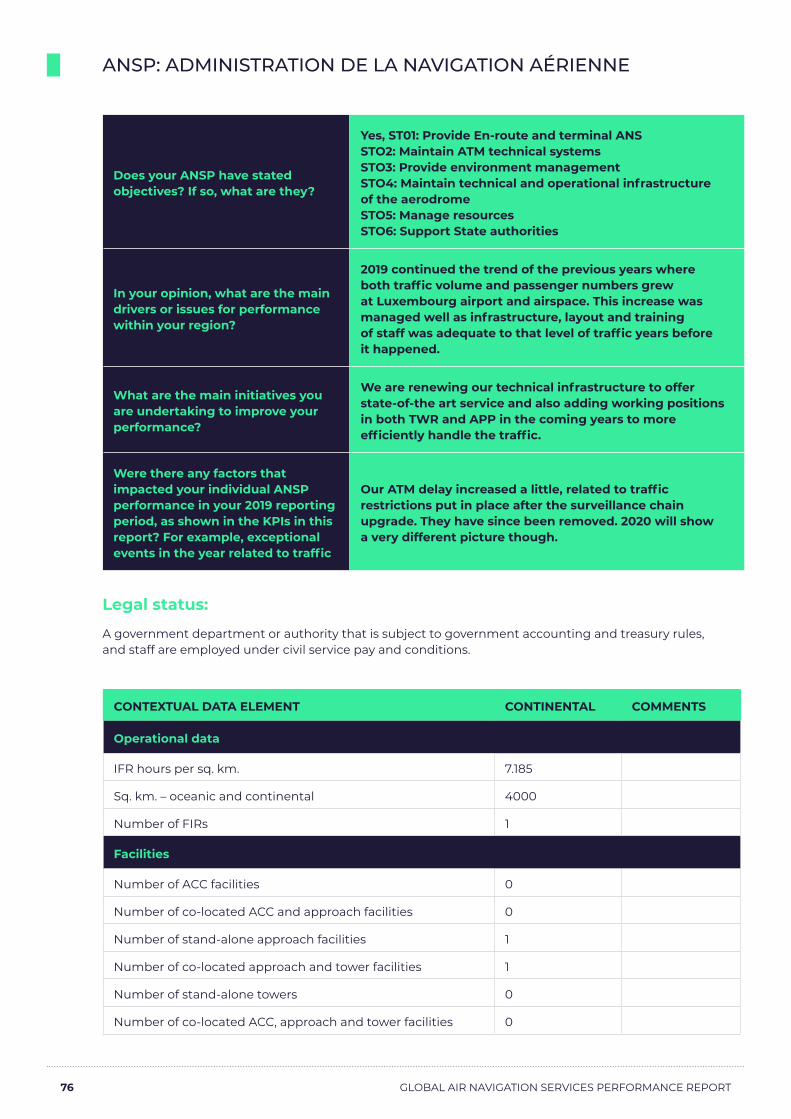
76 GLOBAL AIR NAVIGATION SERVICES PERFORMANCE REPORT
ANSP: ADMINISTRATION DE LA NAVIGATION AÉRIENNE
Does your ANSP have stated objectives? If so, what are they?
Yes, ST01: Provide En-route and terminal ANSSTO2: Maintain ATM technical systemsSTO3: Provide environment managementSTO4: Maintain technical and operational infrastructure of the aerodromeSTO5: Manage resourcesSTO6: Support State authorities
In your opinion, what are the main drivers or issues for performance within your region?
2019 continued the trend of the previous years where both traffic volume and passenger numbers grew at Luxembourg airport and airspace. This increase was managed well as infrastructure, layout and training of staff was adequate to that level of traffic years before it happened.
What are the main initiatives you are undertaking to improve your performance?
We are renewing our technical infrastructure to offer state-of-the art service and also adding working positions in both TWR and APP in the coming years to more efficiently handle the traffic.
Were there any factors that impacted your individual ANSP performance in your 2019 reporting period, as shown in the KPIs in this report? For example, exceptional events in the year related to traffic
Our ATM delay increased a little, related to traffic restrictions put in place after the surveillance chain upgrade. They have since been removed. 2020 will show a very different picture though.
Legal status:
A government department or authority that is subject to government accounting and treasury rules, and staff are employed under civil service pay and conditions.
CONTEXTUAL DATA ELEMENT CONTINENTAL COMMENTS
Operational data
IFR hours per sq. km. 7.185
Sq. km. – oceanic and continental 4000
Number of FIRs 1
Facilities
Number of ACC facilities 0
Number of co-located ACC and approach facilities 0
Number of stand-alone approach facilities 1
Number of co-located approach and tower facilities 1
Number of stand-alone towers 0
Number of co-located ACC, approach and tower facilities 0
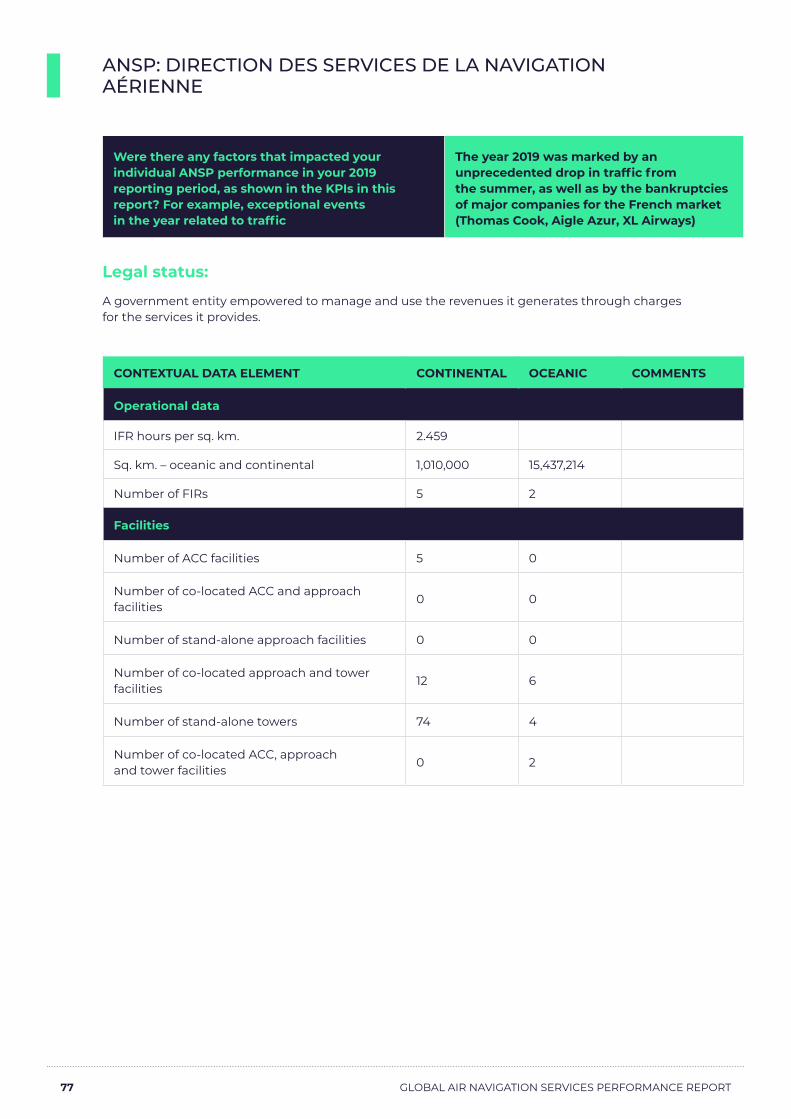
77 GLOBAL AIR NAVIGATION SERVICES PERFORMANCE REPORT
ANSP: DIRECTION DES SERVICES DE LA NAVIGATION AÉRIENNE
Were there any factors that impacted your individual ANSP performance in your 2019 reporting period, as shown in the KPIs in this report? For example, exceptional events in the year related to traffic
The year 2019 was marked by an unprecedented drop in traffic from the summer, as well as by the bankruptcies of major companies for the French market (Thomas Cook, Aigle Azur, XL Airways)
Legal status:
A government entity empowered to manage and use the revenues it generates through charges for the services it provides.
CONTEXTUAL DATA ELEMENT CONTINENTAL OCEANIC COMMENTS
Operational data
IFR hours per sq. km. 2.459
Sq. km. – oceanic and continental 1,010,000 15,437,214
Number of FIRs 5 2
Facilities
Number of ACC facilities 5 0
Number of co-located ACC and approach facilities
0 0
Number of stand-alone approach facilities 0 0
Number of co-located approach and tower facilities
12 6
Number of stand-alone towers 74 4
Number of co-located ACC, approach and tower facilities
0 2

78 GLOBAL AIR NAVIGATION SERVICES PERFORMANCE REPORT
ANSP: EMPRESA ARGENTINA DE NAVEGACIÓN AÉREA
Does your ANSP have stated objectives? If so, what are they?
The year 2019 was marked by an unprecedented drop in traffic from the summer, as well as by the bankruptcies of major companies for the French market (Thomas Cook, Aigle Azur, XL Airways)
In your opinion, what are the main drivers or issues for performance within your region?
Improve Operational Safety, reduce ATC delays, achieve better space redesigns and more coordination between regional ansp
What are the main initiatives you are undertaking to improve your performance?
By planning and executing of a new 4 year investment plan which focus on core CNS equipment and networking, physical infrastructure and strong training for all the workers
Were there any factors that impacted your individual ANSP performance in your 2019 reporting period, as shown in the KPIs in this report? For example, exceptional events in the year related to traffic
Economic crisis and devaluation of the national currency
Legal status:
A government entity empowered to manage and use the revenues it generates through charges for the services it provides.
CONTEXTUAL DATA ELEMENT CONTINENTAL OCEANIC COMMENTS
Operational data
IFR hours per sq. km. 0.0266
Sq. km. – oceanic and continental 16,300,000.0
Percentage surveillance coverage at 30,000ft - ADS-B only
90% 2.00%
Percentage ADS-C coverage at 30,000 ft only 90% 100.00%
Number of FIRs 5
Facilities
Number of ACC facilities 5 0
Number of co-located ACC and approach facilities 0
Number of stand-alone approach facilities 0
Number of co-located approach and tower facilities 54
Number of stand-alone towers 0
Number of co-located ACC, approach and tower facilities
0

79 GLOBAL AIR NAVIGATION SERVICES PERFORMANCE REPORT
ANSP: LENNULIIKLUSTEENINDUSE AS
Legal status: A corporatised entity with special status, not governed by normal commercial law but by a specific founding law or statute (and wholly owned by the government).
CONTEXTUAL DATA ELEMENT CONTINENTAL COMMENTS
Operational data
IFR hours per sq. km. 0.988
Sq. km. – oceanic and continental 77,400
Percentage surveillance coverage at 30,000ft - primary radar
0.0
EANS does not have primary radars for air surveillance. There are plans to get a feed from military in the future.
Percentage surveillance coverage at 30,000ft - secondary radar
100.0There is Mode A/C (EANS secondary radars) as well as Mode S (WAM) coverage.
Percentage surveillance coverage at 30,000ft - ADS-B
100.0Although EANS has full ADS-B coverage, it is not used operationally yet.
Percentage surveillance coverage at 30,000ft - Space based ADS-B
0.0
EANS has taken an indicative quotation for the service, but there are now plans to start using the service yet.
Percentage ADS-C coverage at 30,000 ft 0.0EANS does not need ADS-C because of its geographical location.
Number of FIRs 1
Facilities
Number of ACC facilities 0
Number of co-located ACC and approach facilities
0
Number of stand-alone approach facilities 0
Number of co-located approach and tower facilities
0
Number of stand-alone towers 0
Number of co-located ACC, approach and tower facilities
1

80 GLOBAL AIR NAVIGATION SERVICES PERFORMANCE REPORT
ANSP: ENAIRE
Does your ANSP have stated objectives? If so, what are they?
The year 2019 was marked by an unprecedented drop in traffic from the summer, as well as by the bankruptcies of major companies for the French market (Thomas Cook, Aigle Azur, XL Airways)
In your opinion, what are the main drivers or issues for performance within your region?
Europe is strongly driven by the SES Performance and Charging scheme regulation in the EU, and EUROCONTROL vision at wider level (ECAC). 2019 performance in Europe was still influenced by the capacity crunch of year 2018 where ATFM delays were significant. Though less impact of whether related delays was observed in 2019, delays management still required action in 2019. Traffic was growing in many countries of Europe, particularly in Spain, showing significant deviation with what was planned in the RP2 performance plans.
What are the main initiatives you are undertaking to improve your performance?
ENAIRE establishes its priorities and main initiatives in their Strategic Plan (in 2019 "Flight Plan 2020" which has been adapted in 2020 in order to adapt to the new circumstances and is now being updated during 2021)
Were there any factors that impacted your individual ANSP performance in your 2019 reporting period, as shown in the KPIs in this report? For example, exceptional events in the year related to traffic
Traffic in 2019 was higher than expected and planned in the RP2 performance plan, although was already showing signs of slowing towards the end of the year
Legal status:
A government entity empowered to manage and use the revenues it generates through charges for the services it provides.
CONTEXTUAL DATA ELEMENT CONTINENTAL COMMENTS
Operational data
IFR hours per sq. km. 0.759
Sq. km. – oceanic and continental 2,190,000
Number of FIRs 3
Facilities
Number of ACC facilities 5
Number of co-located ACC and approach facilities 0
Number of stand-alone approach facilities 3
Number of co-located approach and tower facilities 14
Number of stand-alone towers 7
Number of co-located ACC, approach and tower facilities 0

81 GLOBAL AIR NAVIGATION SERVICES PERFORMANCE REPORT
ANSP: FEDERAL AVIATION ADMINISTRATION – AIR TRAFFIC ORGANIZATION
Legal status: A government department or authority that is subject to government accounting and treasury rules, and staff are employed under civil service pay and conditions.
CONTEXTUAL DATA ELEMENT CONTINENTAL OCEANIC COMMENTS
Operational data
IFR hours per sq. km. 1.714 0.0367
Sq. km. – oceanic and continental 14,832,411 60,628,411
Number of FIRs 21 5
Facilities
Number of ACC facilities 21 3
Number of co-located ACC and approach facilities
3 2
Number of stand-alone approach facilities 25
Number of co-located approach and tower facilities
132
Number of stand-alone towers 131
Number of co-located ACC, approach and tower facilities
1

82 GLOBAL AIR NAVIGATION SERVICES PERFORMANCE REPORT
ANSP: HUNGAROCONTROL PTE. LTD. CO
Does your ANSP have stated objectives? If so, what are they?
Development of a Balanced Scorecard model is in progress.
In your opinion, what are the main drivers or issues for performance within your region?
The main driver of the European performance is the performance scheme
What are the main initiatives you are undertaking to improve your performance?
The ANSPs have to bear cost and traffic risk however they do not have influence on traffic. Having incentives on the level of delays as well, HungaroControl is interested in the further development of capacities (technological investments, airspace management procedures, training).
Were there any factors that impacted your individual ANSP performance in your 2019 reporting period, as shown in the KPIs in this report? For example, exceptional events in the year related to traffic
Continuously significant growth in traffic.
Legal status:
A corporatised entity with special status, not governed by normal commercial law but by a specific founding law or statute (and wholly owned by the government).
CONTEXTUAL DATA ELEMENT CONTINENTAL COMMENTS
Operational data
IFR hours per sq. km. 2.707
Sq. km. – oceanic and continental 104,000
Percentage surveillance coverage at 30,000ft - primary radar 100%
Percentage surveillance coverage at 30,000ft - secondary radar 100%
Percentage surveillance coverage at 30,000ft - ADS-B 100% (not used operationally)
Percentage surveillance coverage at 30,000ft - Space based ADS-B
0%
Percentage ADS-C coverage at 30,000 ft 0%
Number of FIRs 2

83 GLOBAL AIR NAVIGATION SERVICES PERFORMANCE REPORT
CONTEXTUAL DATA ELEMENT CONTINENTAL COMMENTS
Facilities
Number of ACC facilities 0
Number of co-located ACC and approach facilities 1
Number of stand-alone approach facilities 0
Number of co-located approach and tower facilities 0
Number of stand-alone towers 1
Number of co-located ACC, approach and tower facilities 0

84 GLOBAL AIR NAVIGATION SERVICES PERFORMANCE REPORT
ANSP: ISAVIA LTD
Legal status:
A corporatised entity with special status, not governed by normal commercial law but by a specific founding law or statute (and wholly owned by the government).
CONTEXTUAL DATA ELEMENT CONTINENTAL OCEANIC COMMENTS
Operational data
IFR hours per sq. km. 0.0566
Sq. km. – oceanic and continental 5,400,000Combined oceanic/continental
Number of FIRs 1 2
Facilities
Number of ACC facilities 1 1
Number of co-located ACC and approach facilities
1 1
Number of stand-alone approach facilities 0 0
Number of co-located approach and tower facilities
1 0
Number of stand-alone towers 2 0
Number of co-located ACC, approach and tower facilities
0 0
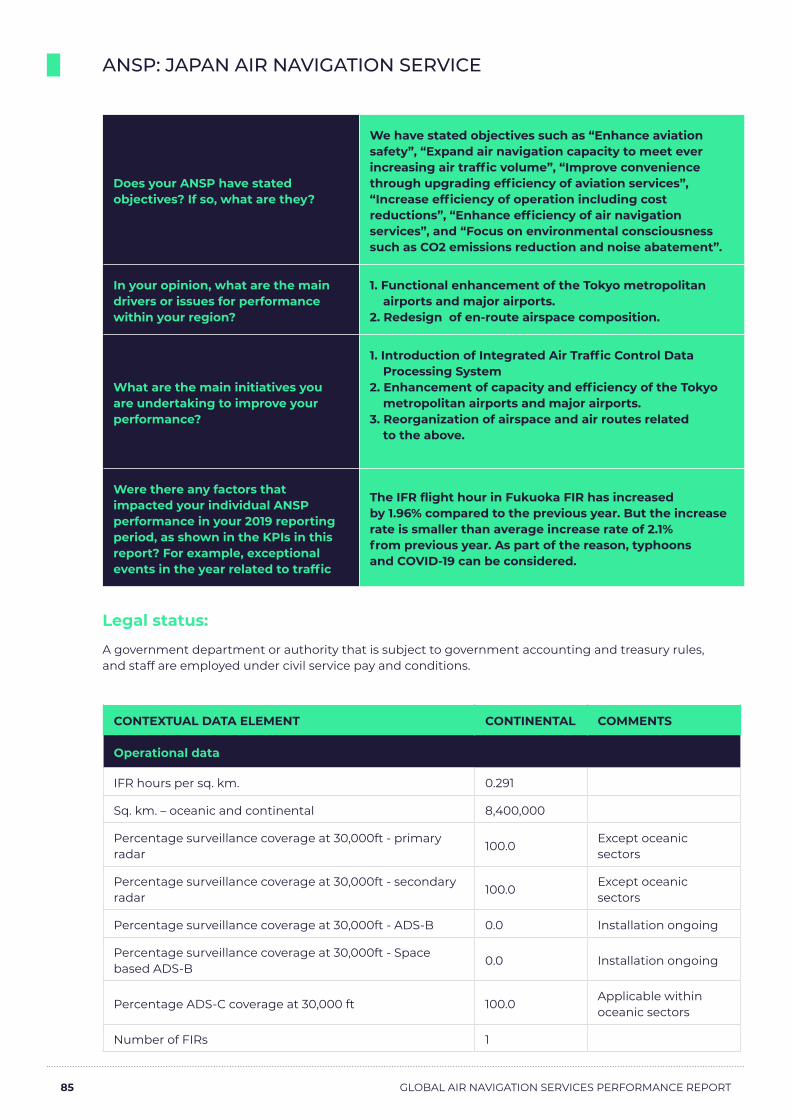
85 GLOBAL AIR NAVIGATION SERVICES PERFORMANCE REPORT
ANSP: JAPAN AIR NAVIGATION SERVICE
Does your ANSP have stated objectives? If so, what are they?
We have stated objectives such as “Enhance aviation safety”, “Expand air navigation capacity to meet ever increasing air traffic volume”, “Improve convenience through upgrading efficiency of aviation services”, “Increase efficiency of operation including cost reductions”, “Enhance efficiency of air navigation services”, and “Focus on environmental consciousness such as CO2 emissions reduction and noise abatement”.
In your opinion, what are the main drivers or issues for performance within your region?
1. Functional enhancement of the Tokyo metropolitan airports and major airports.
2. Redesign of en-route airspace composition.
What are the main initiatives you are undertaking to improve your performance?
1. Introduction of Integrated Air Traffic Control Data Processing System
2. Enhancement of capacity and efficiency of the Tokyo metropolitan airports and major airports.
3. Reorganization of airspace and air routes related to the above.
Were there any factors that impacted your individual ANSP performance in your 2019 reporting period, as shown in the KPIs in this report? For example, exceptional events in the year related to traffic
The IFR flight hour in Fukuoka FIR has increased by 1.96% compared to the previous year. But the increase rate is smaller than average increase rate of 2.1% from previous year. As part of the reason, typhoons and COVID-19 can be considered.
Legal status:
A government department or authority that is subject to government accounting and treasury rules, and staff are employed under civil service pay and conditions.
CONTEXTUAL DATA ELEMENT CONTINENTAL COMMENTS
Operational data
IFR hours per sq. km. 0.291
Sq. km. – oceanic and continental 8,400,000
Percentage surveillance coverage at 30,000ft - primary radar
100.0Except oceanic sectors
Percentage surveillance coverage at 30,000ft - secondary radar
100.0Except oceanic sectors
Percentage surveillance coverage at 30,000ft - ADS-B 0.0 Installation ongoing
Percentage surveillance coverage at 30,000ft - Space based ADS-B
0.0 Installation ongoing
Percentage ADS-C coverage at 30,000 ft 100.0Applicable within oceanic sectors
Number of FIRs 1

86 GLOBAL AIR NAVIGATION SERVICES PERFORMANCE REPORT
CONTEXTUAL DATA ELEMENT CONTINENTAL COMMENTS
Facilities
Number of ACC facilities 4
Number of co-located ACC and approach facilities 0
Number of stand-alone approach facilities 0
Number of co-located approach and tower facilities 13
Number of stand-alone towers 20
Number of co-located ACC, approach and tower facilities 0

87 GLOBAL AIR NAVIGATION SERVICES PERFORMANCE REPORT
ANSP: KENYA CIVIL AVIATION AUTHORITY
Does your ANSP have stated objectives? If so, what are they?
Maintain Safety, increase efficiency
In your opinion, what are the main drivers or issues for performance within your region? Safety and efficiency
What are the main initiatives you are undertaking to improve your performance?
KCAA has developed KPIs for measurement of key performance areas.
Were there any factors that impacted your individual ANSP performance in your 2019 reporting period, as shown in the KPIs in this report? For example, exceptional events in the year related to traffic
Suspension of passenger flights due COVID-19.
Legal status:
A government entity empowered to manage and use the revenues it generates through charges for the services it provides.
CONTEXTUAL DATA ELEMENT CONTINENTAL COMMENTS
Operational data
IFR hours per sq. km. 1.448
Sq. km. – oceanic and continental 77,052
Percentage surveillance coverage at 30,000ft - primary radar 40.0
Percentage surveillance coverage at 30,000ft - secondary radar 100.0
Percentage surveillance coverage at 30,000ft - ADS-B 100.0
Percentage surveillance coverage at 30,000ft - Space based ADS-B
0.0
Percentage ADS-C coverage at 30,000 ft 25.0
Number of FIRs 1
Facilities
Number of ACC facilities 1
Number of co-located ACC and approach facilities 1
Number of stand-alone approach facilities 2
Number of co-located approach and tower facilities 3
Number of stand-alone towers 5
Number of co-located ACC, approach and tower facilities 1

88 GLOBAL AIR NAVIGATION SERVICES PERFORMANCE REPORT
ANSP: LATVIJAS GAISA SATIKSME
Does your ANSP have stated objectives? If so, what are they?
1.) Safety management. Preparing for COMMISSION IMPLEMENTING REGULATION (EU) 2017/373. 2.) Modernization of technologies (VOR/DME, PBN, CPDLC, etc.).
In your opinion, what are the main drivers or issues for performance within your region?
Volatility of traffic. Territory, cost-effectiveness pressures
Legal status:
A corporatised entity with special status, not governed by normal commercial law but by a specific founding law or statute (and wholly owned by the government).
CONTEXTUAL DATA ELEMENT CONTINENTAL COMMENTS
Operational data
IFR hours per sq. km. 0.952
Sq. km. – oceanic and continental 95,900
Percentage surveillance coverage at 30,000ft - primary radar
35.0%Single coverage in Riga TMA
Percentage surveillance coverage at 30,000ft - secondary radar
100.0%Minimum Double coverage is available
Percentage surveillance coverage at 30,000ft - ADS-B 100.0% Not used operationally
Percentage surveillance coverage at 30,000ft - Space based ADS-B
0.0%
Percentage ADS-C coverage at 30,000 ft 0.0%
Number of FIRs 1
Facilities
Number of ACC facilities 0
Number of co-located ACC and approach facilities 1
Number of stand-alone approach facilities 0
Number of co-located approach and tower facilities 0
Number of stand-alone towers 1
Number of co-located ACC, approach and tower facilities 0

89 GLOBAL AIR NAVIGATION SERVICES PERFORMANCE REPORT
ANSP: MACEDONIAN AIR NAVIGATION SERVICE PROVIDER
Does your ANSP have stated objectives? If so, what are they?
M-NAV strategic objectives are stated in company's Strategic business plan, and are constantly promoted as such. They include: achieving international and national standards in Safety, Quality and Security, optimize airspace capacity, optimise cost effectiveness, comply with associated SES Regulations, Guidelines and SES II, Support national and international environment standards, enhance Human Resources Management, adopt managerial structures to future SES Requirements.
In your opinion, what are the main drivers or issues for performance within your region?
Progressive implementation of the objectives stated in the European ATM Master Plan lvl 3, rapid traffic growth, enhanced regional cooperation and sharing mutual experiences for best practices.
What are the main initiatives you are undertaking to improve your performance?
The new ATM System Project, optimisation of Human Resources and flexible sectorisation on daily basis in order to reduce Europe- wide en- route delays.
Legal status:
A government entity empowered to manage and use the revenues it generates through charges for the services it provides.
CONTEXTUAL DATA ELEMENT CONTINENTAL COMMENTS
Operational data
IFR hours per sq. km. 1.513
Sq. km. – oceanic and continental 24,900
Percentage surveillance coverage at 30,000ft – secondary radar 100% SSR radar only
Number of FIRs 1
Facilities
Number of ACC facilities 0
Number of co-located ACC and approach facilities 0
Number of stand-alone approach facilities 0
Number of co-located approach and tower facilities 1
Number of stand-alone towers 0
Number of co-located ACC, approach and tower facilities 1

90 GLOBAL AIR NAVIGATION SERVICES PERFORMANCE REPORT
ANSP: NAV PORTUGAL
Does your ANSP have stated objectives? If so, what are they?
Yes. We have a 5 year Business Plan with objectives and targets steaming from EU regulation for Capacity, Environment, Cost-Efficiency and Safety
In your opinion, what are the main drivers or issues for performance within your region?
SES Regulations and specifically Performance scheme works as the main driver to improve efficiency as well as traffic demand and customer satisfaction.
On the other hand, economic regulation is not oriented to encourage more and better efficiency by ANSPs. Additionally, SES regulation, its timeframe and requirements also contribute to increase ANSP's burden doesn't allowing ANSPs to gain some traction with a stable regulatory framework
What are the main initiatives you are undertaking to improve your performance?
Implement new ATM systems to respond to the increase digitalisation of the sector, as well the CNS infrastructure, to keep/ improve our capacity, safety and productivity indicators.
Were there any factors that impacted your individual ANSP performance in your 2019 reporting period, as shown in the KPIs in this report? For example, exceptional events in the year related to traffic
Traffic continued to grow during 2019, on top of 4-year continuous growth, with a deviation of the initial traffic assumptions by more than +21% between 2015 and 2019.
Legal status:
A corporatised entity with special status, not governed by normal commercial law but by a specific founding law or statute (and wholly owned by the government).
CONTEXTUAL DATA ELEMENT CONTINENTAL OCEANIC COMMENTS
Operational data
IFR hours per sq. km. 0.642
Sq. km. – oceanic and continental 671,000 5,180,000
Percentage surveillance coverage at 30,000ft - primary radar
0.0 0.00%
Percentage surveillance coverage at 30,000ft - secondary radar
86.0 15.00%
Percentage surveillance coverage at 30,000ft - ADS-B
90.8 26.30%
Percentage surveillance coverage at 30,000ft - Space based ADS-B
0.0 0.00%
Percentage ADS-C coverage at 30,000 ft 0.0 100.00%
Number of FIRs 1 1

91 GLOBAL AIR NAVIGATION SERVICES PERFORMANCE REPORT
CONTEXTUAL DATA ELEMENT CONTINENTAL OCEANIC COMMENTS
Facilities
Number of ACC facilities 1 1
Number of co-located ACC and approach facilities
1 0
Number of stand-alone approach facilities 0 0
Number of co-located approach and tower facilities
7 0
Number of stand-alone towers 3 0
Number of co-located ACC, approach and tower facilities
0 0

92 GLOBAL AIR NAVIGATION SERVICES PERFORMANCE REPORT
ANSP: ORO NAVIGACIJA
Legal status:
A corporatised entity with special status, not governed by normal commercial law but by a specific founding law or statute (and wholly owned by the government).
CONTEXTUAL DATA ELEMENT CONTINENTAL COMMENTS
Operational data
IFR hours per sq. km. 0.939
Sq. km. – oceanic and continental 75,300
Number of FIRs 1
Facilities
Number of ACC facilities 1
Number of co-located ACC and approach facilities 0
Number of stand-alone approach facilities 0
Number of co-located approach and tower facilities 3
Number of stand-alone towers 1
Number of co-located ACC, approach and tower facilities 0

93 GLOBAL AIR NAVIGATION SERVICES PERFORMANCE REPORT
ANSP: PANSA POLISH AIR NAVIGATION SERVICES AGENCY
Does your ANSP have stated objectives? If so, what are they?
Objectives related to the Performance Plan/SES Regulations and 4 key performance areas: safety, capacity, cost-effectiveness and environment.
In your opinion, what are the main drivers or issues for performance within your region?
SES Regulations, FABs Performance Plans requirements, Performance and Charging Scheme regulations; changes in traffic paths due to the Ukrainian situation.
What are the main initiatives you are undertaking to improve your performance?
Airspace modernisation, separation of air traffic flows, reducing delays, shortening the flight paths, reducing CO2 emissions, roster plan extended by additional ATCOs, implementation of Traffic Complexity Tool and improving the competitiveness offered by the Polish Air Navigation Services Agency services for users of Polish airspace.
Were there any factors that impacted your individual ANSP performance in your 2019 reporting period, as shown in the KPIs in this report? For example, exceptional events in the year related to traffic
Revision of the Baltic Functional Airspace Block Performance Plan for Air Navigation Services for second reference period (2015-2019) concerns only cost-efficiency KPA for 2017-2019. Following partial closure of the Ukrainian airspace, Poland lost a lot of overflying “heavy traffic” (A380, B747, B777) going from North/West to the South/East, crossing southern half of Warsaw FIR.
Legal status:
A government entity empowered to manage and use the revenues it generates through charges for the services it provides.
CONTEXTUAL DATA ELEMENT CONTINENTAL COMMENTS
Operational data
IFR hours per sq. km. 1.556
Sq. km. – oceanic and continental 334,000
Percentage surveillance coverage at 30,000ft - primary radar 0.0
Percentage surveillance coverage at 30,000ft - secondary radar 100.0
Percentage surveillance coverage at 30,000ft - ADS-B 0.0
Percentage surveillance coverage at 30,000ft - Space based ADS-B
0.0
Percentage ADS-C coverage at 30,000 ft 0.0
Number of FIRs 1

94 GLOBAL AIR NAVIGATION SERVICES PERFORMANCE REPORT
CONTEXTUAL DATA ELEMENT CONTINENTAL COMMENTS
Facilities
Number of ACC facilities 1
Number of co-located ACC and approach facilities 1
Number of stand-alone approach facilities 3
Number of co-located approach and tower facilities 0
Number of stand-alone towers 15
Number of co-located ACC, approach and tower facilities 0
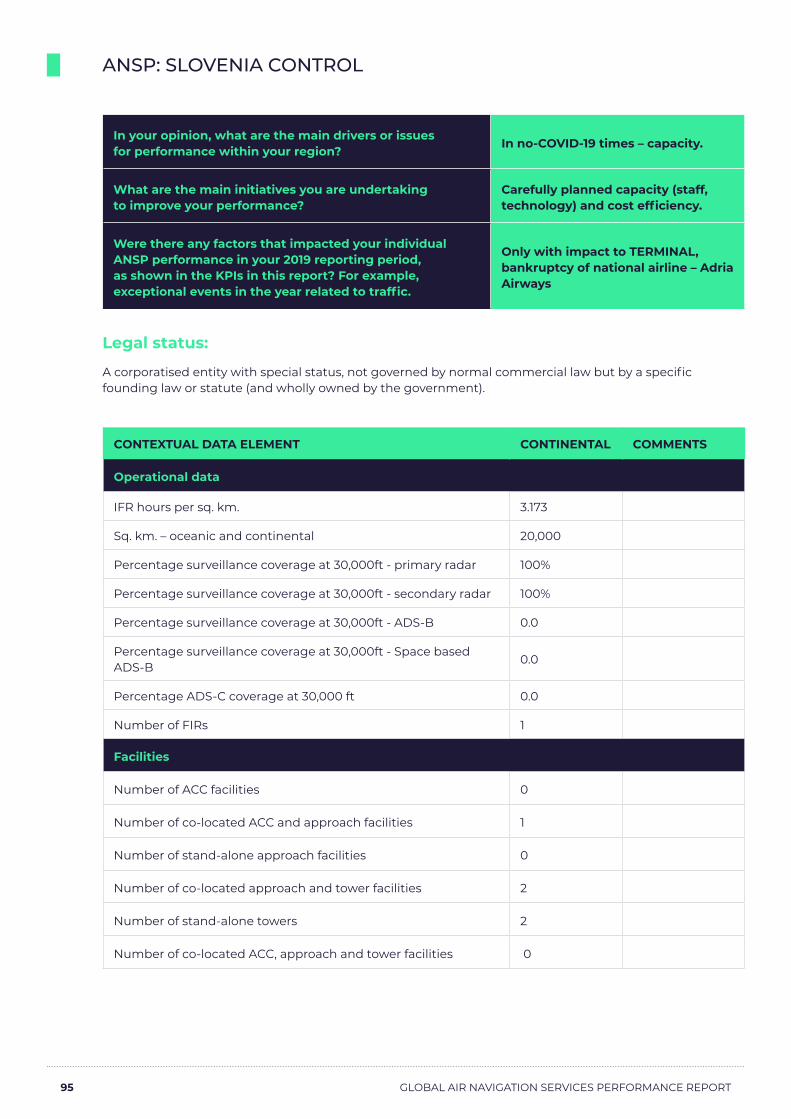
95 GLOBAL AIR NAVIGATION SERVICES PERFORMANCE REPORT
ANSP: SLOVENIA CONTROL
In your opinion, what are the main drivers or issues for performance within your region? In no-COVID-19 times – capacity.
What are the main initiatives you are undertaking to improve your performance?
Carefully planned capacity (staff, technology) and cost efficiency.
Were there any factors that impacted your individual ANSP performance in your 2019 reporting period, as shown in the KPIs in this report? For example, exceptional events in the year related to traffic.
Only with impact to TERMINAL, bankruptcy of national airline – Adria Airways
Legal status:
A corporatised entity with special status, not governed by normal commercial law but by a specific founding law or statute (and wholly owned by the government).
CONTEXTUAL DATA ELEMENT CONTINENTAL COMMENTS
Operational data
IFR hours per sq. km. 3.173
Sq. km. – oceanic and continental 20,000
Percentage surveillance coverage at 30,000ft - primary radar 100%
Percentage surveillance coverage at 30,000ft - secondary radar 100%
Percentage surveillance coverage at 30,000ft - ADS-B 0.0
Percentage surveillance coverage at 30,000ft - Space based ADS-B
0.0
Percentage ADS-C coverage at 30,000 ft 0.0
Number of FIRs 1
Facilities
Number of ACC facilities 0
Number of co-located ACC and approach facilities 1
Number of stand-alone approach facilities 0
Number of co-located approach and tower facilities 2
Number of stand-alone towers 2
Number of co-located ACC, approach and tower facilities 0

96 GLOBAL AIR NAVIGATION SERVICES PERFORMANCE REPORT
ANSP: SERBIA AND MONTENEGRO AIR TRAFFIC SERVICES SMATSA LLC
In your opinion, what are the main drivers or issues for performance within your region? SES requirements.
Legal status:
Limited liability company, 100% state-owned (92% owned by Serbia and 8% owned by Montenegro). Integrated civil/military ANSP.
CONTEXTUAL DATA ELEMENT CONTINENTAL COMMENTS
Operational data
IFR hours per sq. km. 2.270
Sq. km. – oceanic and continental 127,000
Percentage surveillance coverage at 30,000ft - primary radar 100.0%
Number of FIRs 1
Facilities
Number of ACC facilities 1
Number of co-located ACC and approach facilities 1
Number of stand-alone approach facilities
Number of co-located approach and tower facilities 7
Number of stand-alone towers 1
Number of co-located ACC, approach and tower facilities

97 GLOBAL AIR NAVIGATION SERVICES PERFORMANCE REPORT
ANNEX 5: KPI DATA1: CONTINENTAL COST PER IFR HOUR (USD)Formula: Total costs (USD) / IFR flight hours
ANSP KPI 2018-2019 AGR 4-year CAGR
AAI 66.07 -10.02% -1.70%
AEROTHAI 442.07 15.64% 2.49%
Airways NZ 492.58 30.37% 6.90%
Albcontrol 691.05 -2.62% 1.08%
ANA 763.31 6.32%
ANS CR 575.22 0.68% 0.83%
ANS Finland 556.74 -0.37% -5.47%
ARMATS 656.82 2.72% -6.57%
ATNS 402.08 18.31% 10.05%
Austro Control 758.20 -2.52% 0.64%
Avinor (Continental) 605.27 19.45% 3.59%
BULATSA 439.81 4.72% 2.15%
CAAS 442.14 15.72% 8.56%
Croatia Control 389.36 -8.57% -5.83%
DCAC Cyprus 207.37 -9.12% -8.79%
DFS 810.83 -2.25% -2.39%
DHMI 355.73 21.84% 18.47%
DSNA 656.43 -0.61% -1.21%
EANA 261.22 61.19%
EANS 382.52 13.62% 8.78%
ENAIRE 524.91 2.95% -4.89%
ENAV 645.93 -3.57% -4.14%
FAA-ATO 445.61 -0.37% -0.40%
HCAA 272.49 0.04% -5.65%
HungaroControl 403.76 -1.46% -1.48%
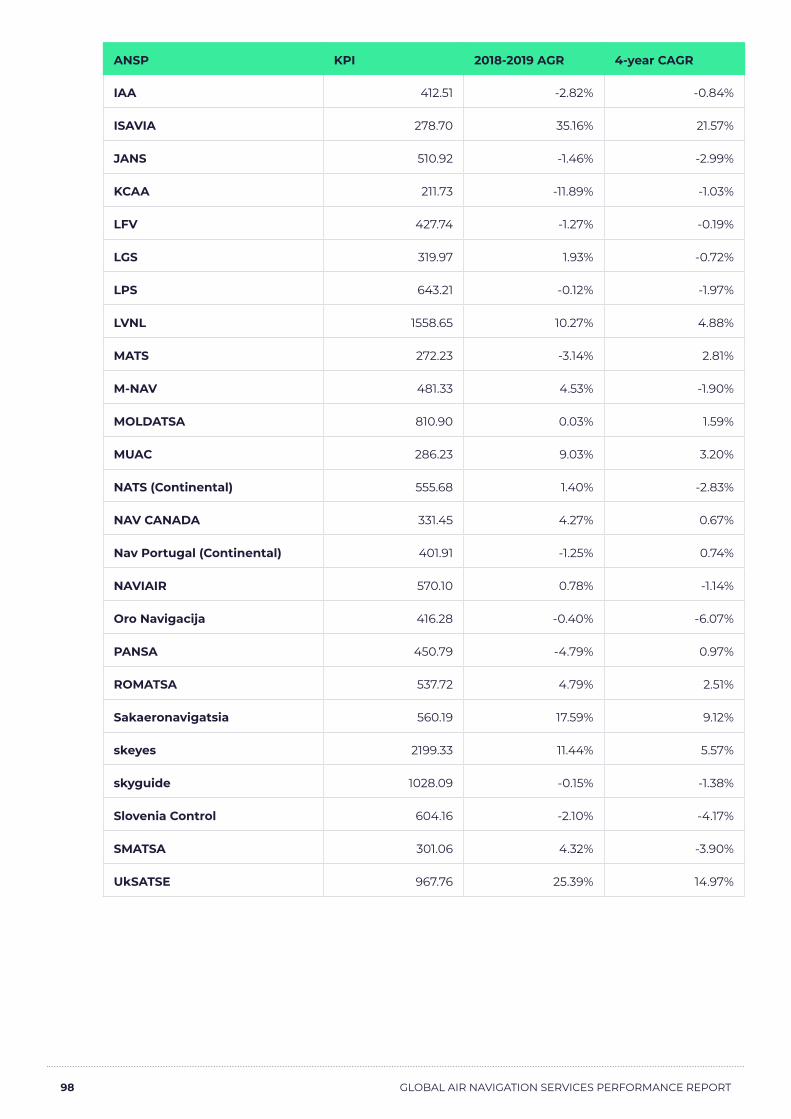
98 GLOBAL AIR NAVIGATION SERVICES PERFORMANCE REPORT
ANSP KPI 2018-2019 AGR 4-year CAGR
IAA 412.51 -2.82% -0.84%
ISAVIA 278.70 35.16% 21.57%
JANS 510.92 -1.46% -2.99%
KCAA 211.73 -11.89% -1.03%
LFV 427.74 -1.27% -0.19%
LGS 319.97 1.93% -0.72%
LPS 643.21 -0.12% -1.97%
LVNL 1558.65 10.27% 4.88%
MATS 272.23 -3.14% 2.81%
M-NAV 481.33 4.53% -1.90%
MOLDATSA 810.90 0.03% 1.59%
MUAC 286.23 9.03% 3.20%
NATS (Continental) 555.68 1.40% -2.83%
NAV CANADA 331.45 4.27% 0.67%
Nav Portugal (Continental) 401.91 -1.25% 0.74%
NAVIAIR 570.10 0.78% -1.14%
Oro Navigacija 416.28 -0.40% -6.07%
PANSA 450.79 -4.79% 0.97%
ROMATSA 537.72 4.79% 2.51%
Sakaeronavigatsia 560.19 17.59% 9.12%
skeyes 2199.33 11.44% 5.57%
skyguide 1028.09 -0.15% -1.38%
Slovenia Control 604.16 -2.10% -4.17%
SMATSA 301.06 4.32% -3.90%
UkSATSE 967.76 25.39% 14.97%
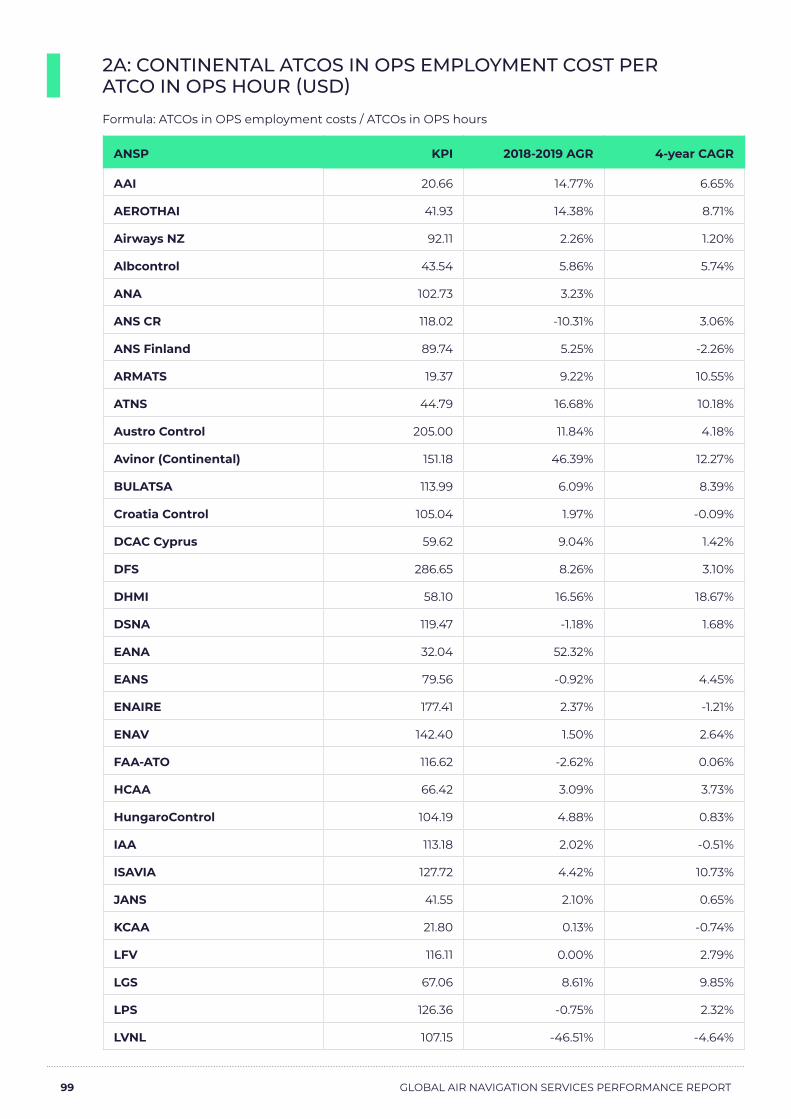
99 GLOBAL AIR NAVIGATION SERVICES PERFORMANCE REPORT
2A: CONTINENTAL ATCOS IN OPS EMPLOYMENT COST PER ATCO IN OPS HOUR (USD) Formula: ATCOs in OPS employment costs / ATCOs in OPS hours
ANSP KPI 2018-2019 AGR 4-year CAGR
AAI 20.66 14.77% 6.65%
AEROTHAI 41.93 14.38% 8.71%
Airways NZ 92.11 2.26% 1.20%
Albcontrol 43.54 5.86% 5.74%
ANA 102.73 3.23%
ANS CR 118.02 -10.31% 3.06%
ANS Finland 89.74 5.25% -2.26%
ARMATS 19.37 9.22% 10.55%
ATNS 44.79 16.68% 10.18%
Austro Control 205.00 11.84% 4.18%
Avinor (Continental) 151.18 46.39% 12.27%
BULATSA 113.99 6.09% 8.39%
Croatia Control 105.04 1.97% -0.09%
DCAC Cyprus 59.62 9.04% 1.42%
DFS 286.65 8.26% 3.10%
DHMI 58.10 16.56% 18.67%
DSNA 119.47 -1.18% 1.68%
EANA 32.04 52.32%
EANS 79.56 -0.92% 4.45%
ENAIRE 177.41 2.37% -1.21%
ENAV 142.40 1.50% 2.64%
FAA-ATO 116.62 -2.62% 0.06%
HCAA 66.42 3.09% 3.73%
HungaroControl 104.19 4.88% 0.83%
IAA 113.18 2.02% -0.51%
ISAVIA 127.72 4.42% 10.73%
JANS 41.55 2.10% 0.65%
KCAA 21.80 0.13% -0.74%
LFV 116.11 0.00% 2.79%
LGS 67.06 8.61% 9.85%
LPS 126.36 -0.75% 2.32%
LVNL 107.15 -46.51% -4.64%

100 GLOBAL AIR NAVIGATION SERVICES PERFORMANCE REPORT
ANSP KPI 2018-2019 AGR 4-year CAGR
MATS 69.75 6.68% 13.04%
M-NAV 75.02 40.51% 7.32%
MOLDATSA 25.27 -11.19% 19.53%
MUAC 314.86 17.49% 7.48%
NATS (Continental) 145.09 1.67% -0.68%
NAV CANADA 120.88 0.10% 3.43%
Nav Portugal (Continental) 171.23 -8.41% 5.71%
NAVIAIR 127.90 5.52% 2.95%
Oro Navigacija 60.00 5.73% 4.41%
PANSA 134.81 4.82% 6.15%
ROMATSA 118.04 -0.92% 5.06%
Sakaeronavigatsia 21.28 32.13% 11.55%
skeyes 182.43 0.84% 4.15%
skyguide 198.53 -0.48% 1.18%
Slovenia Control 109.89 3.73% 3.55%
SMATSA 59.95 2.21% 3.04%
UkSATSE 32.87 50.58% 30.93%

101 GLOBAL AIR NAVIGATION SERVICES PERFORMANCE REPORT
2A: CONTINENTAL ATCOS IN OPS EMPLOYMENT COST PER ATCO IN OPS HOUR (USD), PPP ADJUSTED
ANSP KPI 2018-2019 AGR 4-year CAGR
AAI 79.17 13.33% 4.80%
AEROTHAI 106.40 15.49% 8.82%
Airways NZ 96.13 1.96% 1.57%
Albcontrol 112.60 5.81% 6.72%
ANA 107.37 2.15%
ANS CR 215.40 -11.49% 3.81%
ANS Finland 93.17 4.94% -0.95%
ARMATS 46.83 8.19% 10.40%
ATNS 102.76 13.83% 6.72%
Austro Control 239.07 12.01% 5.27%
Avinor (Continental) 138.65 49.93% 13.24%
BULATSA 452.76 10.30% 0.31%
Croatia Control 212.61 3.81% 1.69%
DCAC Cyprus 87.46 9.13% 3.59%
DFS 345.21 8.12% 4.34%
DHMI 179.94 2.30% 5.91%
DSNA 141.52 -0.88% 3.47%
EANA 73.54 2.28%
EANS 129.17 -2.45% 3.84%
ENAIRE 250.29 2.60% 0.00%
ENAV 188.54 2.71% 4.99%
FAA-ATO 116.62 -2.62% 0.06%
HCAA 105.68 4.11% 5.86%
HungaroControl 213.72 2.29% -0.84%
IAA 129.33 2.87% 0.36%
ISAVIA 111.33 1.60% 10.98%
JANS 43.82 3.32% 0.67%
KCAA 42.23 -4.82% -5.12%
LFV 123.14 -1.00% 2.60%
LGS 120.72 7.69% 9.91%
LPS 221.70 -1.55% 1.42%
LVNL 121.48 -47.03% -3.98%

102 GLOBAL AIR NAVIGATION SERVICES PERFORMANCE REPORT
ANSP KPI 2018-2019 AGR 4-year CAGR
MATS 107.98 7.98% 14.13%
M-NAV 203.32 40.22% 5.76%
MOLDATSA 58.45 -14.25% 16.04%
NATS (Continental) 164.95 1.37% -0.56%
NAV CANADA 134.33 0.46% 4.58%
Nav Portugal (Continental) 266.26 -7.77% 6.18%
NAVIAIR 126.44 5.97% 5.02%
Oro Navigacija 118.20 5.15% 3.97%
PANSA 291.73 3.63% 6.00%
ROMATSA 295.82 -2.20% 4.61%
Sakaeronavigatsia 60.83 29.19% 8.64%
skeyes 212.08 1.01% 5.20%
skyguide 170.76 0.57% 2.89%
Slovenia Control 170.93 2.84% 4.48%
SMATSA 168.75 0.74% 2.37%
UkSATSE 86.42 39.61% 14.87%

103 GLOBAL AIR NAVIGATION SERVICES PERFORMANCE REPORT
2B: CONTINENTAL ATCOS IN OPS HOUR PRODUCTIVITYFormula: IFR flight hours / ATCOs in OPS hours
ANSP KPI 2018-2019 AGR 4-year CAGR
AAI 0.85 -1.81% 0.79%
AEROTHAI 0.33 -7.22% 1.91%
Airways NZ 0.52 -19.79% -3.62%
Albcontrol 0.59 20.62% 10.47%
ANA 0.39 0.20%
ANS CR 0.84 -10.55% 0.42%
ANS Finland 0.49 6.63% 5.89%
ARMATS 0.17 -4.48% 13.94%
ATNS 0.51 0.60% 2.13%
Austro Control 0.83 4.93% 4.28%
Avinor (Continental) 0.57 1.01% -2.38%
BULATSA 0.82 -2.03% 2.16%
CAAS 0.63 -2.96% -1.51%
Croatia Control 0.79 9.68% 5.11%
DCAC Cyprus 0.95 8.49% 4.77%
DFS 0.91 2.27% 3.09%
DHMI 0.82 -2.44% 0.30%
DSNA 0.69 1.28% 2.46%
EANA 0.43 -2.98%
EANS 0.76 -12.64% -0.91%
ENAIRE 0.76 4.81% 5.45%
ENAV 0.66 2.37% 5.09%
FAA-ATO 1.15 1.15% 2.63%
HCAA 0.87 5.57% 9.54%
HungaroControl 1.01 2.65% 4.63%
IAA 0.79 -9.77% -3.39%
ISAVIA 1.35 4.68% 2.92%
JANS 0.95 -1.38% 2.86%
KCAA 0.38 17.26% 1.97%
LFV 0.60 0.68% 3.17%
LGS 0.82 3.00% 3.54%
LPS 0.69 -0.55% -0.54%

104 GLOBAL AIR NAVIGATION SERVICES PERFORMANCE REPORT
ANSP KPI 2018-2019 AGR 4-year CAGR
LVNL 0.52 -0.03% 5.43%
MATS 0.96 8.83% 7.29%
M-NAV 0.52 29.93% 8.93%
MOLDATSA 0.13 -5.38% 8.38%
MUAC 2.23 0.26% 3.19%
NATS (Continental) 0.95 2.51% 3.84%
NAV CANADA 1.33 -0.49% 3.17%
Nav Portugal (Continental) 1.07 5.50% 6.97%
NAVIAIR 0.74 1.80% 1.40%
Oro Navigacija 0.56 5.97% 9.66%
PANSA 0.82 2.46% 2.83%
ROMATSA 0.71 -3.54% 3.35%
Sakaeronavigatsia 0.31 -11.65% -3.71%
skeyes 0.40 -4.53% 2.02%
skyguide 0.76 1.73% 1.92%
Slovenia Control 0.53 1.90% 7.80%
SMATSA 0.83 2.62% 5.23%
UkSATSE 0.18 6.06% 6.22%

105 GLOBAL AIR NAVIGATION SERVICES PERFORMANCE REPORT
2C: CONTINENTAL COSTS EXCLUDING ATCOS IN OPS EMPLOYMENT COSTS PER IFR HOUR (USD)Formula: Costs excluding ATCOs in OPS employment costs / IFR flight hours
ANSP KPI 2018-2019 AGR 4-year CAGR
AAI 41.83 -20.61% -5.03%
AEROTHAI 314.08 12.78% 1.00%
Airways NZ 314.59 28.60% 8.05%
Albcontrol 617.50 -1.33% 1.82%
ANA 500.97 8.13%
ANS CR 435.04 0.81% 0.29%
ANS Finland 371.80 0.09% -4.25%
ARMATS 541.53 0.54% -7.25%
ATNS 313.72 18.98% 10.70%
Austro Control 510.44 -6.39% 1.01%
Avinor (Continental) 339.13 4.98% -2.39%
BULATSA 301.24 3.16% 0.56%
Croatia Control 257.10 -9.34% -6.27%
DCAC Cyprus 144.60 -12.75% -10.77%
DFS 495.55 -6.80% -3.77%
DHMI 284.57 22.45% 18.50%
DSNA 482.69 0.06% -1.36%
EANA 187.25 62.91%
EANS 277.62 13.69% 10.20%
ENAIRE 292.93 7.54% -3.68%
ENAV 430.14 -4.87% -4.99%
FAA-ATO 344.10 0.67% 0.27%
HCAA 195.83 1.01% -5.78%
HungaroControl 300.17 -2.65% -0.69%
IAA 269.85 -9.54% -2.60%
ISAVIA 184.34 65.19% 33.99%
JANS 467.06 -1.90% -3.07%

106 GLOBAL AIR NAVIGATION SERVICES PERFORMANCE REPORT
ANSP KPI 2018-2019 AGR 4-year CAGR
KCAA 154.34 -31.10% -0.39%
LFV 233.56 -1.76% -0.03%
LGS 237.76 0.76% -2.62%
LPS 460.00 -0.09% -3.62%
LVNL 1353.29 31.43% 8.37%
MATS 199.75 -3.56% 1.96%
M-NAV 336.18 3.05% -2.08%
MOLDATSA 622.41 2.07% -0.46%
MUAC 145.03 2.11% 2.32%
NATS (Continental) 402.30 2.28% -2.22%
NAV CANADA 240.34 5.73% 0.84%
Nav Portugal (Continental) 242.51 8.57% 2.11%
NAVIAIR 397.26 -0.42% -2.20%
Oro Navigacija 309.40 -0.47% -6.50%
PANSA 286.34 -8.44% -0.22%
ROMATSA 371.15 5.75% 2.91%
Sakaeronavigatsia 490.80 14.14% 8.32%
skeyes 1739.04 13.09% 6.59%
skyguide 766.53 0.56% -1.60%
Slovenia Control 394.84 -4.04% -4.30%
SMATSA 228.69 5.91% -4.44%
UkSATSE 784.10 22.05% 13.39%

107 GLOBAL AIR NAVIGATION SERVICES PERFORMANCE REPORT
2D: CONTINENTAL PROPORTION OF TOTAL COSTS MADE UP OF ATCO IN OPS EMPLOYMENT COSTS (USD)Formula: ATCO in OPS employment Costs / Total Costs
ANSP KPI 2018-2019 AGR 4-year CAGR
AAI 0.37 29.91% 7.65%
AEROTHAI 0.29 6.61% 4.08%
Airways NZ 0.36 -2.21% -1.78%
Albcontrol 0.11 -9.88% -5.30%
ANA 0.34 -3.10%
ANS CR 0.24 -0.42% 1.78%
ANS Finland 0.33 -0.93% -2.36%
ARMATS 0.18 11.33% 3.85%
ATNS 0.22 -1.97% -1.97%
Austro Control 0.33 9.33% -0.74%
Avinor (Continental) 0.44 21.32% 11.03%
BULATSA 0.32 3.40% 3.86%
Croatia Control 0.34 1.68% 0.94%
DCAC Cyprus 0.30 10.60% 6.13%
DFS 0.39 8.30% 2.45%
DHMI 0.20 -1.94% -0.13%
DSNA 0.26 -1.83% 0.45%
EANA 0.28 -2.60%
EANS 0.27 -0.17% -3.09%
ENAIRE 0.44 -5.12% -1.50%
ENAV 0.33 2.81% 1.89%
FAA-ATO 0.23 -3.38% -2.11%
HCAA 0.28 -2.39% 0.36%
HungaroControl 0.26 3.68% -2.17%
IAA 0.35 16.35% 3.85%
ISAVIA 0.34 -26.21% -11.50%
JANS 0.09 5.05% 0.87%
KCAA 0.27 -3.09% -1.64%
LFV 0.45 0.60% -0.18%
LGS 0.26 3.46% 6.85%
LPS 0.28 -0.08% 4.94%
LVNL 0.13 -51.48% -13.76%

108 GLOBAL AIR NAVIGATION SERVICES PERFORMANCE REPORT
ANSP KPI 2018-2019 AGR 4-year CAGR
MATS 0.27 1.20% 2.48%
M-NAV 0.30 3.46% 0.43%
MOLDATSA 0.23 -6.18% 8.57%
MUAC 0.49 7.48% 0.92%
NATS (Continental) 0.28 -2.20% -1.56%
NAV CANADA 0.27 -3.52% -0.42%
Nav Portugal (Continental) 0.40 -12.09% -1.90%
NAVIAIR 0.30 2.85% 2.71%
Oro Navigacija 0.26 0.19% 1.37%
PANSA 0.36 7.45% 2.23%
ROMATSA 0.31 -1.97% -0.83%
Sakaeronavigatsia 0.12 27.20% 6.16%
skeyes 0.21 -5.22% -3.29%
skyguide 0.25 -2.03% 0.67%
Slovenia Control 0.35 3.97% 0.24%
SMATSA 0.24 -4.52% 1.88%
UkSATSE 0.19 13.23% 7.21%

109 GLOBAL AIR NAVIGATION SERVICES PERFORMANCE REPORT
3A: CONTINENTAL ANNUAL EMPLOYMENT COST PER ATCO IN OPS (USD) Formula: ATCOs in OPS employment costs / No. ATCOs in OPS
ANSP KPI 2018-2019 AGR 4-year CAGR
AAI 40508.98 14.88% 7.22%
AEROTHAI 138608.96 22.58% 11.61%
Airways NZ 125632.82 2.26% 1.20%
Albcontrol 60092.77 4.62% 2.70%
ANA 129983.46 -14.57%
ANS CR 190593.23 -7.45% 4.78%
ANS Finland 138288.07 3.79% -0.71%
ARMATS 27421.08 8.41% 11.50%
ATNS 63313.35 13.29% 5.85%
Austro Control 287431.80 11.27% 4.82%
Avinor (Continental) 233427.80 42.52% 12.29%
BULATSA 146581.67 6.06% 8.37%
Croatia Control 140254.14 2.52% -0.35%
DCAC Cyprus 116206.37 8.99% 1.50%
DFS 275045.70 9.89% 4.12%
DHMI 68431.88 15.43% 16.01%
DSNA 153396.04 -1.18% 1.68%
EANA 33582.87 52.32%
EANS 117956.43 -0.89% 3.13%
ENAIRE 229979.62 -0.99% 0.72%
ENAV 182786.70 5.18% 2.73%
FAA-ATO 218681.75 -0.68% 1.04%
HCAA 98433.65 3.09% 0.20%
HungaroControl 162933.89 2.75% 0.69%
IAA 172149.88 -0.19% -0.59%
ISAVIA 202392.56 -9.67% 6.30%
JANS 83726.82 2.10% 0.65%
KCAA 31386.57 0.13% -0.74%
LFV 205862.57 0.00% 2.85%
LGS 104328.84 7.56% 17.68%
LPS 198782.97 -0.05% 3.19%
LVNL 169088.78 -45.46% -8.75%
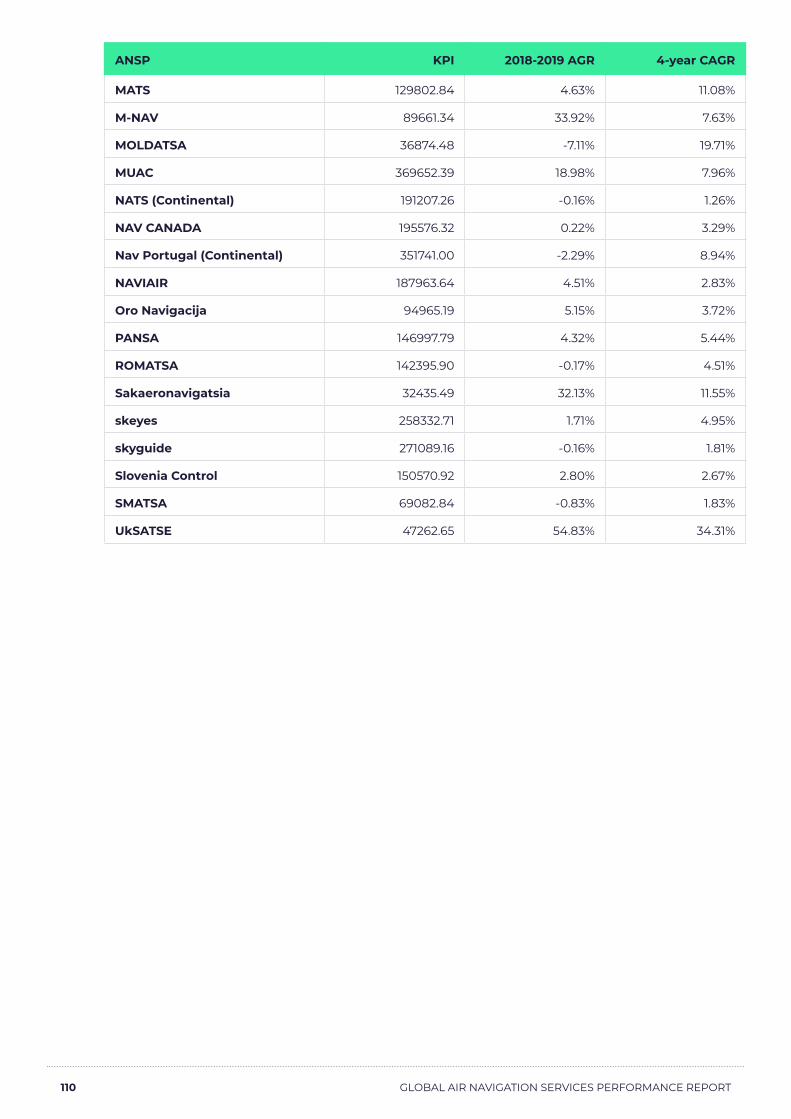
110 GLOBAL AIR NAVIGATION SERVICES PERFORMANCE REPORT
ANSP KPI 2018-2019 AGR 4-year CAGR
MATS 129802.84 4.63% 11.08%
M-NAV 89661.34 33.92% 7.63%
MOLDATSA 36874.48 -7.11% 19.71%
MUAC 369652.39 18.98% 7.96%
NATS (Continental) 191207.26 -0.16% 1.26%
NAV CANADA 195576.32 0.22% 3.29%
Nav Portugal (Continental) 351741.00 -2.29% 8.94%
NAVIAIR 187963.64 4.51% 2.83%
Oro Navigacija 94965.19 5.15% 3.72%
PANSA 146997.79 4.32% 5.44%
ROMATSA 142395.90 -0.17% 4.51%
Sakaeronavigatsia 32435.49 32.13% 11.55%
skeyes 258332.71 1.71% 4.95%
skyguide 271089.16 -0.16% 1.81%
Slovenia Control 150570.92 2.80% 2.67%
SMATSA 69082.84 -0.83% 1.83%
UkSATSE 47262.65 54.83% 34.31%

111 GLOBAL AIR NAVIGATION SERVICES PERFORMANCE REPORT
3A: CONTINENTAL ANNUAL EMPLOYMENT COST PER ATCO IN OPS (USD), PPP ADJUSTED
ANSP KPI 2018-2019 AGR 4-year CAGR
AAI 155195.44 13.43% 5.36%
AEROTHAI 351706.14 23.76% 11.72%
Airways NZ 131124.97 1.96% 1.57%
Albcontrol 155414.75 4.57% 3.66%
ANA 135851.09 -15.46%
ANS CR 347853.84 -8.67% 5.54%
ANS Finland 143570.91 3.49% 0.62%
ARMATS 66281.57 7.38% 11.35%
ATNS 145256.73 10.51% 2.52%
Austro Control 335205.39 11.45% 5.92%
Avinor (Continental) 214086.54 45.97% 13.25%
BULATSA 582216.92 10.28% 0.29%
Croatia Control 283875.11 4.37% 1.42%
DCAC Cyprus 170450.51 9.08% 3.68%
DFS 331239.22 9.75% 5.37%
DHMI 211943.28 1.31% 3.53%
DSNA 181705.95 -0.88% 3.47%
EANA 77074.43 2.28%
EANS 191498.85 -2.43% 2.53%
ENAIRE 324454.66 -0.77% 1.94%
ENAV 242025.29 6.44% 5.08%
FAA-ATO 218681.75 -0.68% 1.04%
HCAA 156620.41 4.11% 2.25%
HungaroControl 334223.55 0.21% -0.98%
IAA 196703.59 0.64% 0.27%
ISAVIA 176420.92 -12.11% 6.54%
JANS 88297.17 3.32% 0.67%
KCAA 60809.93 -4.82% -5.12%
LFV 218335.80 -1.00% 2.66%
LGS 187801.53 6.64% 17.75%
LPS 348773.78 -0.85% 2.28%
LVNL 191700.52 -45.98% -8.13%

112 GLOBAL AIR NAVIGATION SERVICES PERFORMANCE REPORT
ANSP KPI 2018-2019 AGR 4-year CAGR
MATS 200952.79 5.91% 12.15%
M-NAV 243002.83 33.64% 6.06%
MOLDATSA 85287.24 -10.30% 16.21%
NATS (Continental) 217383.33 -0.45% 1.38%
NAV CANADA 217337.70 0.58% 4.44%
Nav Portugal (Continental) 546934.42 -1.60% 9.43%
NAVIAIR 185817.67 4.95% 4.89%
Oro Navigacija 187084.97 4.57% 3.28%
PANSA 318102.29 3.13% 5.30%
ROMATSA 356867.62 -1.46% 4.06%
Sakaeronavigatsia 92705.79 29.19% 8.64%
skeyes 300320.56 1.88% 6.01%
skyguide 233168.57 0.89% 3.53%
Slovenia Control 234207.10 1.91% 3.59%
SMATSA 194470.27 -2.26% 1.17%
UkSATSE 124252.99 43.56% 17.84%
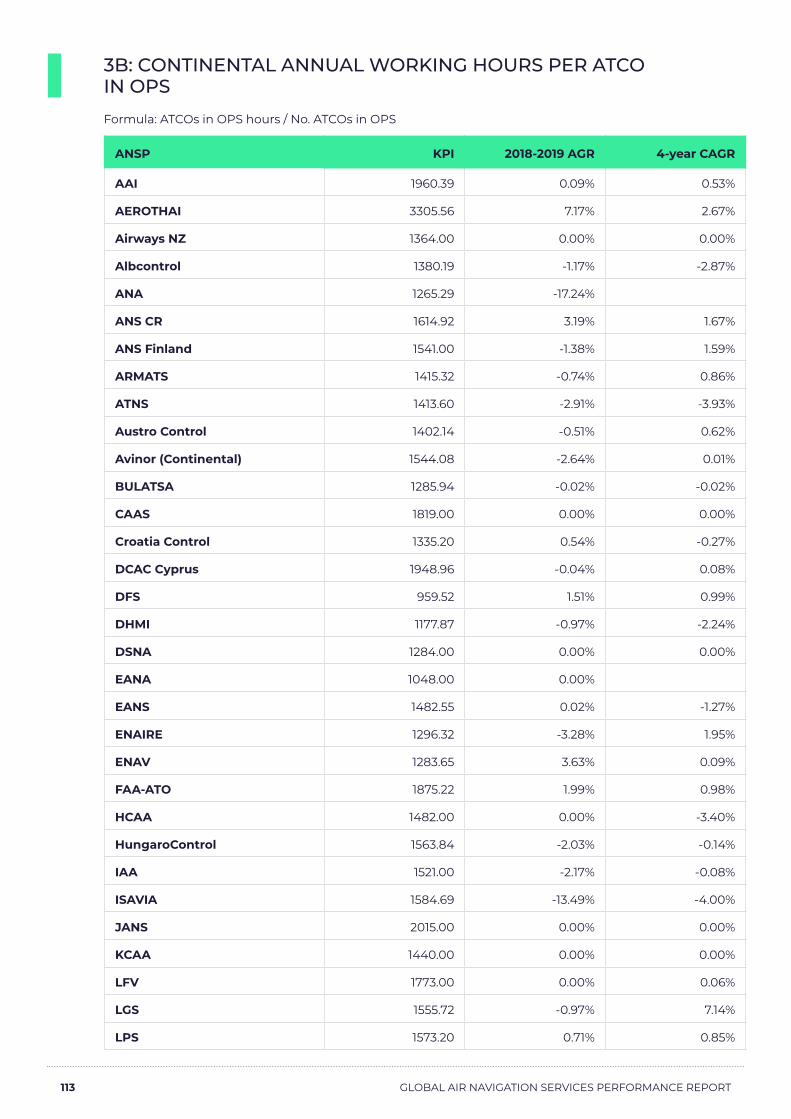
113 GLOBAL AIR NAVIGATION SERVICES PERFORMANCE REPORT
3B: CONTINENTAL ANNUAL WORKING HOURS PER ATCO IN OPS Formula: ATCOs in OPS hours / No. ATCOs in OPS
ANSP KPI 2018-2019 AGR 4-year CAGR
AAI 1960.39 0.09% 0.53%
AEROTHAI 3305.56 7.17% 2.67%
Airways NZ 1364.00 0.00% 0.00%
Albcontrol 1380.19 -1.17% -2.87%
ANA 1265.29 -17.24%
ANS CR 1614.92 3.19% 1.67%
ANS Finland 1541.00 -1.38% 1.59%
ARMATS 1415.32 -0.74% 0.86%
ATNS 1413.60 -2.91% -3.93%
Austro Control 1402.14 -0.51% 0.62%
Avinor (Continental) 1544.08 -2.64% 0.01%
BULATSA 1285.94 -0.02% -0.02%
CAAS 1819.00 0.00% 0.00%
Croatia Control 1335.20 0.54% -0.27%
DCAC Cyprus 1948.96 -0.04% 0.08%
DFS 959.52 1.51% 0.99%
DHMI 1177.87 -0.97% -2.24%
DSNA 1284.00 0.00% 0.00%
EANA 1048.00 0.00%
EANS 1482.55 0.02% -1.27%
ENAIRE 1296.32 -3.28% 1.95%
ENAV 1283.65 3.63% 0.09%
FAA-ATO 1875.22 1.99% 0.98%
HCAA 1482.00 0.00% -3.40%
HungaroControl 1563.84 -2.03% -0.14%
IAA 1521.00 -2.17% -0.08%
ISAVIA 1584.69 -13.49% -4.00%
JANS 2015.00 0.00% 0.00%
KCAA 1440.00 0.00% 0.00%
LFV 1773.00 0.00% 0.06%
LGS 1555.72 -0.97% 7.14%
LPS 1573.20 0.71% 0.85%

114 GLOBAL AIR NAVIGATION SERVICES PERFORMANCE REPORT
ANSP KPI 2018-2019 AGR 4-year CAGR
LVNL 1578.08 1.98% -4.32%
MATS 1860.96 -1.92% -1.73%
M-NAV 1195.20 -4.69% 0.29%
MOLDATSA 1459.09 4.60% 0.15%
MUAC 1174.03 1.26% 0.45%
NATS (Continental) 1317.85 -1.79% 1.95%
NAV CANADA 1617.92 0.12% -0.13%
Nav Portugal (Continental) 2054.17 6.69% 3.06%
NAVIAIR 1469.60 -0.96% -0.12%
Oro Navigacija 1582.83 -0.55% -0.66%
PANSA 1090.39 -0.48% -0.66%
ROMATSA 1206.37 0.76% -0.53%
Sakaeronavigatsia 1524.00 0.00% 0.00%
skeyes 1416.08 0.86% 0.77%
skyguide 1365.50 0.32% 0.62%
Slovenia Control 1370.20 -0.90% -0.85%
SMATSA 1152.42 -2.97% -1.17%
UkSATSE 1437.79 2.82% 2.59%

115 GLOBAL AIR NAVIGATION SERVICES PERFORMANCE REPORT
3C: CONTINENTAL ANNUAL IFR HOURS PER ATCO IN OPSFormula: IFR flight hours / No. ATCOs in OPS
ANSP KPI 2018-2019 AGR 4-year CAGR
AAI 1671.02 -1.72% 1.32%
AEROTHAI 1082.95 -0.57% 4.63%
Airways NZ 705.85 -19.79% -3.62%
Albcontrol 816.97 19.21% 7.30%
ANA 495.48 -17.08%
ANS CR 1359.61 -7.69% 2.10%
ANS Finland 747.75 5.16% 7.57%
ARMATS 237.84 -5.19% 14.92%
ATNS 716.55 -2.33% -1.88%
Austro Control 1160.08 4.40% 4.93%
Avinor (Continental) 877.07 -1.66% -2.37%
BULATSA 1057.78 -2.05% 2.14%
CAAS 1153.23 -2.96% -1.51%
Croatia Control 1060.47 10.27% 4.83%
DCAC Cyprus 1851.12 8.44% 4.85%
DFS 872.38 3.81% 4.11%
DHMI 961.71 -3.39% -1.95%
DSNA 882.92 1.28% 2.46%
EANA 454.00 -2.98%
EANS 1124.43 -12.63% -2.17%
ENAIRE 991.35 1.37% 7.50%
ENAV 847.05 6.09% 5.18%
FAA-ATO 2154.46 3.17% 3.64%
HCAA 1284.07 5.57% 5.81%
HungaroControl 1572.93 0.57% 4.48%
IAA 1206.71 -11.73% -3.47%
ISAVIA 2144.92 -9.44% -1.20%
JANS 1908.96 -1.38% 2.86%
KCAA 546.96 17.26% 1.97%
LFV 1060.14 0.68% 3.23%
LGS 1268.99 2.00% 10.93%
LPS 1085.01 0.15% 0.31%

116 GLOBAL AIR NAVIGATION SERVICES PERFORMANCE REPORT
ANSP KPI 2018-2019 AGR 4-year CAGR
LVNL 823.41 1.95% 0.88%
MATS 1790.94 6.74% 5.43%
M-NAV 617.72 23.83% 9.24%
MOLDATSA 195.63 -1.02% 8.54%
MUAC 2618.02 1.53% 3.66%
NATS (Continental) 1246.60 0.67% 5.86%
NAV CANADA 2146.36 -0.37% 3.03%
Nav Portugal (Continental) 2206.64 12.56% 10.24%
NAVIAIR 1087.47 0.82% 1.28%
Oro Navigacija 888.55 5.38% 8.93%
PANSA 893.92 1.97% 2.15%
ROMATSA 854.88 -2.81% 2.80%
Sakaeronavigatsia 467.45 -11.65% -3.71%
skeyes 561.24 -3.70% 2.80%
skyguide 1036.44 2.05% 2.55%
Slovenia Control 719.36 0.99% 6.89%
SMATSA 954.70 -0.43% 4.00%
UkSATSE 257.33 9.05% 8.96%
3D: RATIO OF FRONTLINE SERVICE STAFF TO ATCO IN OPS Formula: No. Frontline Service Staff / No. ATCOs in OPS
ANSP KPI 2018-2019 AGR
AAI 0.29 14.03%
AEROTHAI 1.37 9.26%
Airways NZ 0.67 -0.65%
ANA 1.17 -9.23%
ATNS 0.99 11.75%
EANA 1.23 2.42%
ISAVIA 0.46 7.69%
JANS 1.61 -3.37%
NAV CANADA 1.33

117 GLOBAL AIR NAVIGATION SERVICES PERFORMANCE REPORT
1: OCEANIC COST PER IFR HOUR (USD) Formula: Total costs / IFR flight hours
ANSP KPI 2018-2019 AGR 4-year CAGR
Airways NZ 71.96 35.74% 9.63%
FAA-ATO 86.65 -5.08% -3.23%
ISAVIA 181.92 6.29% 4.84%
NAV CANADA 57.15 -5.02% -1.45%
2A: OCEANIC ATCO IN OPS EMPLOYMENT COST PER ATCO IN OPS HOUR (USD) Formula: ATCOs in OPS employment costs / ATCOs in OPS Hours
ANSP KPI 2018-2019 AGR 4-year CAGR
Airways NZ 98.89 4.60% 0.69%
FAA-ATO 158.56 -4.04% 0.16%
ISAVIA 149.63 19.21% 14.30%
NAV CANADA 125.06 0.75% 2.99%
2A: OCEANIC ATCO IN OPS EMPLOYMENT COST PER ATCO IN OPS HOUR (USD), PPP ADJUSTED
ANSP KPI KPI - PPP 2018-2019 AGR 4-year CAGR
Airways NZ 98.89 103.21 4.29% 1.05%
FAA-ATO 158.56 158.56 -4.04% 0.16%
ISAVIA 149.63 130.43 15.99% 14.56%
NAV CANADA 125.06 138.98 1.12% 4.14%
2B: OCEANIC ATCO IN OPS HOUR PRODUCTIVITYFormula: IFR flight hours / ATCOs in OPS hours
ANSP KPI 2018-2019 AGR 4-year CAGR
Airways NZ 2.21 -35.37% -10.05%
ATNS 0.61 174.15% 43.61%
FAA-ATO 7.20 6.22% 5.04%
ISAVIA 3.80 17.97% 2.69%
NAV CANADA 6.63 -1.13% 0.39%

118 GLOBAL AIR NAVIGATION SERVICES PERFORMANCE REPORT
2C: OCEANIC COSTS EXCLUDING ATCOS IN OPS EMPLOYMENT COSTS PER IFR HOUR (USD) Formula: Costs excluding ATCOs in OPS employment costs / IFR flight hours
ANSP KPI 2018-2019 AGR 4-year CAGR
Airways NZ 27.19 21.51%
FAA-ATO 64.64 -3.41% -2.73%
ISAVIA 142.57 7.84% 3.35%
NAV CANADA 38.28 -8.09% -3.18%
2D: OCEANIC PROPORTION OF TOTAL COSTS MADE UP OF ATCO IN OPS EMPLOYMENT COSTS (USD) Formula: ATCO in OPS employment Costs / Total Costs
ANSP KPI 2018-2019 AGR 4-year CAGR
Airways NZ 0.62 19.23% 2.11%
FAA-ATO 0.25 -4.83% -1.47%
ISAVIA 0.22 -4.93% 6.17%
NAV CANADA 0.33 7.28% 4.10%
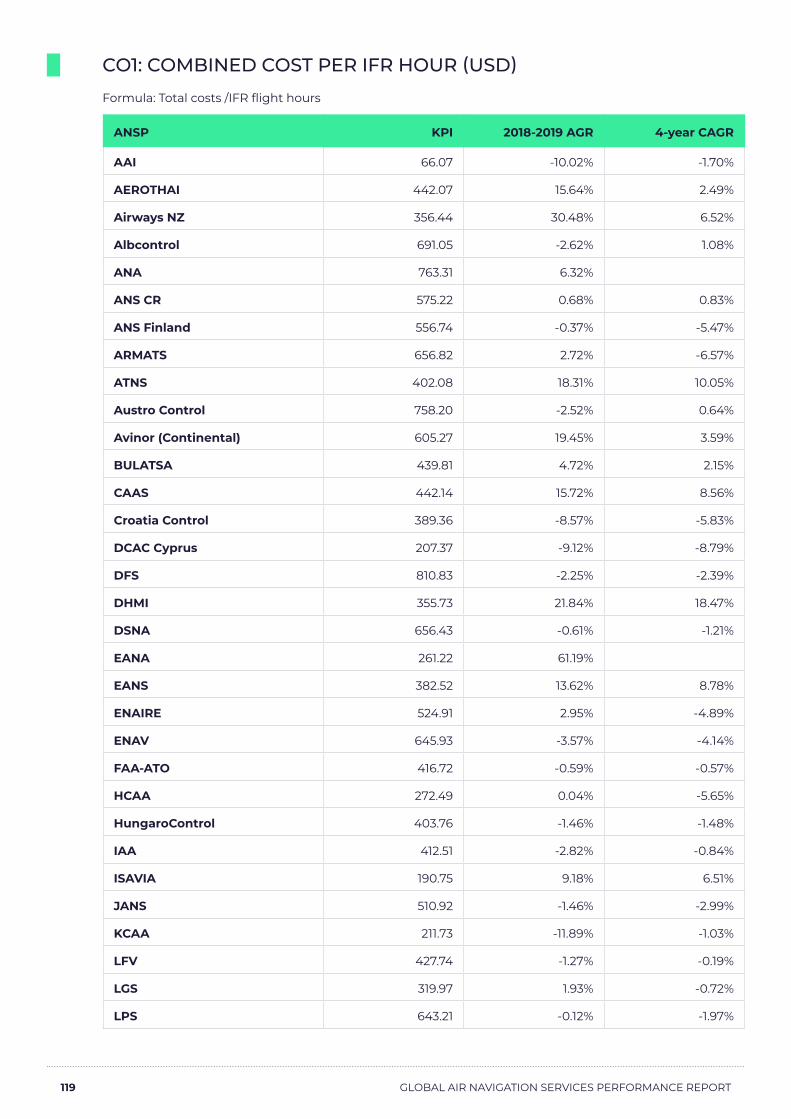
119 GLOBAL AIR NAVIGATION SERVICES PERFORMANCE REPORT
CO1: COMBINED COST PER IFR HOUR (USD) Formula: Total costs /IFR flight hours
ANSP KPI 2018-2019 AGR 4-year CAGR
AAI 66.07 -10.02% -1.70%
AEROTHAI 442.07 15.64% 2.49%
Airways NZ 356.44 30.48% 6.52%
Albcontrol 691.05 -2.62% 1.08%
ANA 763.31 6.32%
ANS CR 575.22 0.68% 0.83%
ANS Finland 556.74 -0.37% -5.47%
ARMATS 656.82 2.72% -6.57%
ATNS 402.08 18.31% 10.05%
Austro Control 758.20 -2.52% 0.64%
Avinor (Continental) 605.27 19.45% 3.59%
BULATSA 439.81 4.72% 2.15%
CAAS 442.14 15.72% 8.56%
Croatia Control 389.36 -8.57% -5.83%
DCAC Cyprus 207.37 -9.12% -8.79%
DFS 810.83 -2.25% -2.39%
DHMI 355.73 21.84% 18.47%
DSNA 656.43 -0.61% -1.21%
EANA 261.22 61.19%
EANS 382.52 13.62% 8.78%
ENAIRE 524.91 2.95% -4.89%
ENAV 645.93 -3.57% -4.14%
FAA-ATO 416.72 -0.59% -0.57%
HCAA 272.49 0.04% -5.65%
HungaroControl 403.76 -1.46% -1.48%
IAA 412.51 -2.82% -0.84%
ISAVIA 190.75 9.18% 6.51%
JANS 510.92 -1.46% -2.99%
KCAA 211.73 -11.89% -1.03%
LFV 427.74 -1.27% -0.19%
LGS 319.97 1.93% -0.72%
LPS 643.21 -0.12% -1.97%

120 GLOBAL AIR NAVIGATION SERVICES PERFORMANCE REPORT
ANSP KPI 2018-2019 AGR 4-year CAGR
LVNL 1558.65 10.27% 4.88%
MATS 272.23 -3.14% 2.81%
M-NAV 481.33 4.53% -1.90%
MOLDATSA 810.90 0.03% 1.59%
MUAC 286.23 9.03% 3.20%
NATS (Continental) 555.68 1.40% -2.83%
NAV CANADA 284.54 3.31% 0.51%
Nav Portugal (Continental) 401.91 -1.25% 0.74%
NAVIAIR 570.10 0.78% -1.14%
Oro Navigacija 416.28 -0.40% -6.07%
PANSA 450.79 -4.79% 0.97%
ROMATSA 537.72 4.79% 2.51%
Sakaeronavigatsia 560.19 17.59% 9.12%
skeyes 2199.33 11.44% 5.57%
skyguide 1028.09 -0.15% -1.38%
Slovenia Control 604.16 -2.10% -4.17%
SMATSA 301.06 4.32% -3.90%
UkSATSE 967.76 25.39% 14.97%

121 GLOBAL AIR NAVIGATION SERVICES PERFORMANCE REPORT
CO2D: COMBINED PROPORTION OF TOTAL COSTS MADE UP OF ATCO IN OPS EMPLOYMENT COSTS (USD) Formula: ATCO in OPS employment Costs / Total Costs
ANSP KPI 2018-2019 AGR 4-year CAGR
AAI 0.37 29.91% 7.65%
AEROTHAI 0.29 6.61% 4.08%
Airways NZ 0.38 -0.17% -1.28%
Albcontrol 0.11 -9.88% -5.30%
ANA 0.34 -3.10%
ANS CR 0.24 -0.42% 1.78%
ANS Finland 0.33 -0.93% -2.36%
ARMATS 0.18 11.33% 3.85%
ATNS 0.22 -1.97% -1.97%
Austro Control 0.33 9.33% -0.74%
Avinor (Continental) 0.44 21.32% 11.03%
BULATSA 0.32 3.40% 3.86%
Croatia Control 0.34 1.68% 0.94%
DCAC Cyprus 0.30 10.60% 6.13%
DFS 0.39 8.30% 2.45%
DHMI 0.20 -1.94% -0.13%
DSNA 0.26 -1.83% 0.45%
EANA 0.28 -2.60%
EANS 0.27 -0.17% -3.09%
ENAIRE 0.44 -5.12% -1.50%
ENAV 0.33 2.81% 1.89%
FAA-ATO 0.23 -3.41% -2.10%
HCAA 0.28 -2.39% 0.36%
HungaroControl 0.26 3.68% -2.17%
IAA 0.35 16.35% 3.85%
ISAVIA 0.23 -8.87% 3.32%
JANS 0.09 5.05% 0.87%
KCAA 0.27 -3.09% -1.64%
LFV 0.45 0.60% -0.18%
LGS 0.26 3.46% 6.85%
LPS 0.28 -0.08% 4.94%

122 GLOBAL AIR NAVIGATION SERVICES PERFORMANCE REPORT
ANSP KPI 2018-2019 AGR 4-year CAGR
LVNL 0.13 -51.48% -13.76%
MATS 0.27 1.20% 2.48%
M-NAV 0.30 3.46% 0.43%
MOLDATSA 0.23 -6.18% 8.57%
MUAC 0.49 7.48% 0.92%
NATS (Continental) 0.28 -2.20% -1.56%
NAV CANADA 0.28 -3.14% -0.26%
Nav Portugal (Continental) 0.40 -12.09% -1.90%
NAVIAIR 0.30 2.85% 2.71%
Oro Navigacija 0.26 0.19% 1.37%
PANSA 0.36 7.45% 2.23%
ROMATSA 0.31 -1.97% -0.83%
Sakaeronavigatsia 0.12 27.20% 6.16%
skeyes 0.21 -5.22% -3.29%
skyguide 0.25 -2.03% 0.67%
Slovenia Control 0.35 3.97% 0.24%
SMATSA 0.24 -4.52% 1.88%
UkSATSE 0.19 13.23% 7.21%
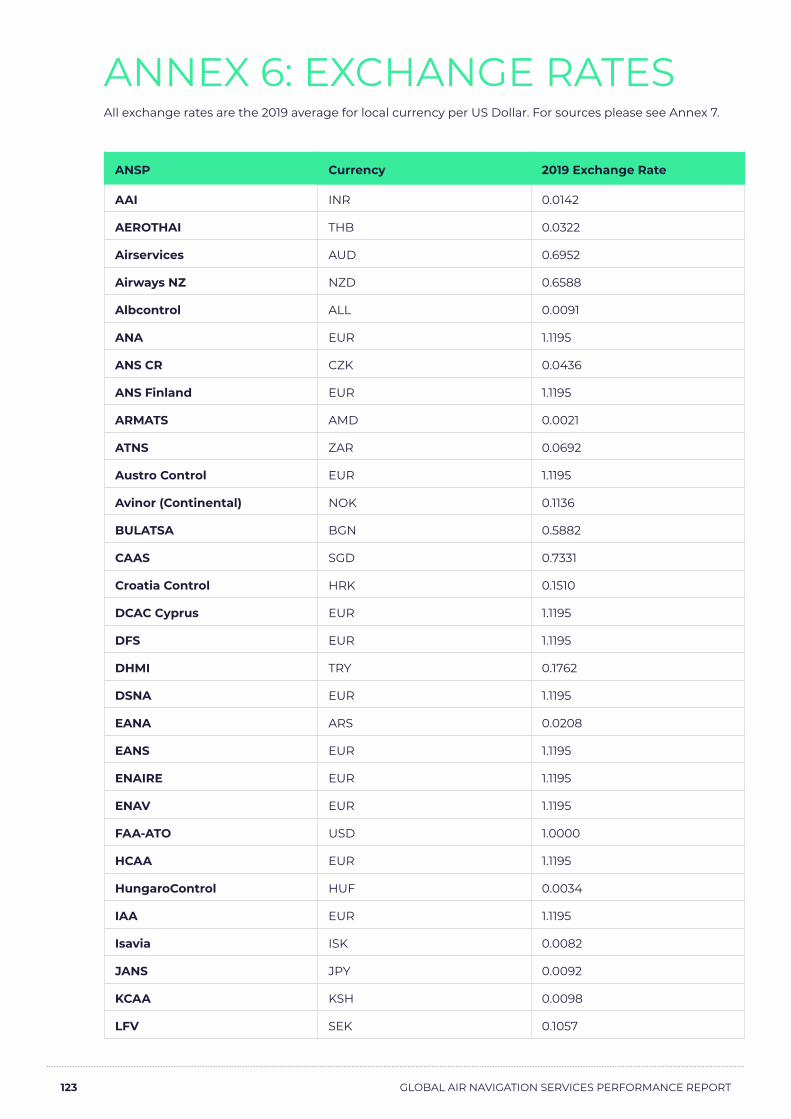
123 GLOBAL AIR NAVIGATION SERVICES PERFORMANCE REPORT
ANNEX 6: EXCHANGE RATESAll exchange rates are the 2019 average for local currency per US Dollar. For sources please see Annex 7.
ANSP Currency 2019 Exchange Rate
AAI INR 0.0142
AEROTHAI THB 0.0322
Airservices AUD 0.6952
Airways NZ NZD 0.6588
Albcontrol ALL 0.0091
ANA EUR 1.1195
ANS CR CZK 0.0436
ANS Finland EUR 1.1195
ARMATS AMD 0.0021
ATNS ZAR 0.0692
Austro Control EUR 1.1195
Avinor (Continental) NOK 0.1136
BULATSA BGN 0.5882
CAAS SGD 0.7331
Croatia Control HRK 0.1510
DCAC Cyprus EUR 1.1195
DFS EUR 1.1195
DHMI TRY 0.1762
DSNA EUR 1.1195
EANA ARS 0.0208
EANS EUR 1.1195
ENAIRE EUR 1.1195
ENAV EUR 1.1195
FAA-ATO USD 1.0000
HCAA EUR 1.1195
HungaroControl HUF 0.0034
IAA EUR 1.1195
Isavia ISK 0.0082
JANS JPY 0.0092
KCAA KSH 0.0098
LFV SEK 0.1057

124 GLOBAL AIR NAVIGATION SERVICES PERFORMANCE REPORT
ANSP Currency 2019 Exchange Rate
LGS EUR 1.1195
LPS EUR 1.1195
LVNL EUR 1.1195
MATS EUR 1.1195
M-NAV MKD 0.0182
MOLDATSA MDL 0.0569
MUAC EUR 1.1195
NATS (Continental) GBP 1.2764
NAV CANADA CDN 0.7537
NAV Portugal (Continental) EUR 1.1195
NAVIAIR DKK 0.1499
Oro Navigacija EUR 1.1195
PANSA PLN 0.2605
ROMATSA RON 0.2360
Sakaeronavigatsia GEL 0.3548
SANS SAR 0.2667
skeyes EUR 1.1195
skyguide CHF 1.0062
Slovenia Control EUR 1.1195
SMATSA RSD 0.0085
UkSATSE UAH 0.0387

125 GLOBAL AIR NAVIGATION SERVICES PERFORMANCE REPORT
ANNEX 7: ACRONYMS AND ABBREVIATIONS
ACI Airports Council International
ANS Air navigation services
ANSP Air navigation service provider
ASK Available seat kilometres
ATC Air traffic control
ATCO Air traffic controller
ATM Air traffic management
CANSO Civil Air Navigation Services Organisation
CAPEX Capital Expenditure
GBWG Global Benchmarking Workgroup
GDP Gross domestic product
IATA International Air Transport Association
IFR Instrument flight rules
KPI Key performance indicator
MET Aeronautical Meteorological
OPS Operations
PPP Purchasing power parity
PRU Performance Review Unit
RPK Revenue passenger kilometres
USD United States Dollar
VFR Visual flight rules

126 GLOBAL AIR NAVIGATION SERVICES PERFORMANCE REPORT
ANNEX 8: SOURCESDefinitions:
EUROCONTROL Specification for Economic Information Disclosure V2.6
EUROCONTROL Specification for Economic Information Disclosure V3.0
ACE benchmarking report data dashboard:
Eurocontrol.int/ACE/ACE-Home.html
Industry Trends:
IATA annual review – 2020
aci.aero/news/2020/05/19/aci-reveals-top-20-airports-for-passenger-traffic-cargo-and-aircraft-movements/
ICAO annual report 2019
IATA global fact sheet.
atag.org/component/factfigures/?Itemid=
aci.aero/news/2020/10/08/acis-world-airport-traffic-report-brings-home-how-far-airport-traffic-has-fallen/
aci.aero/wp-content/uploads/2020/10/Key-Statistics-ACI-World-WATR-2020_Final.pdf
Exchange rate data:
data.oecd.org/conversion/exchange-rates.htm
bankofengland.co.uk/boeapps/iadb/index.asp?Travel=NIxIRx&levels=2&XNotes=Y&A3790XNode3790.x=7&A3790XNode3790.y=5&Nodes=&SectionRequired=I&HideNums=-1&ExtraInfo=true#BM
xe.com/currencytables/
exchangerates.org.uk/US-Dollar-USD-currency-table.html
IMF World Economic Outlook database:
imf.org/external/pubs/ft/weo/2017/01/weodata/index.aspx
PPP rate data:
data.oecd.org/conversion/purchasing-power-parities-ppp.htm
imf.org/external/datamapper/PPPEX@WEO/OEMDC/ADVEC/WEOWORLD

127 GLOBAL AIR NAVIGATION SERVICES PERFORMANCE REPORT
canso.org