global burden of disease and injur y series
DESCRIPTION
Global Burden of Disease and Injur y Series1990 and projected to 2020TRANSCRIPT


SUMMARY GLOBAL BURDEN OF DISEASE AND INJUR Y SERIES
THEGLOBAL BURDEN OF DISEASE
A comprehensive assessment of mortality and disability from diseases, injuries, and
risk factors in 1990 and projected to 2020
-) ~ ·1 ~ ~ '1 1!? ~~
WORLD HEAL TH ORGANIZATION
EDITED BY
CHRISTOPHER J. L. MURRAY
HARVARD UNIVERSITY
BOSTON, MA, USA
ALAN D. LOPEZ
HARVARD SCHOOL OF PUBUC HEAL TH
WORLD BANK
PUBLISHED BY THE HARVARD SCHOOL OF PUBLIC HEALTH ON BEHALF OF
THE WoRLD HEALTH ÜRGANIZATION ANO THE WoRLD BANK
DISTRIBUTED BY HARVARD UNIVERSITY PRESS

ISBN: 0-9655466-0-8 Library of Congress Cataloging-in-Publicarion (CIP) Data applied for.
The Global Burden of Disease Study and rhe The Global Burden of Disease and Global Health Statistics would not have been possible withour rhe financia! support of rhe Edna McConnell Clark Foundarion, rhe Rockefeller Foundation, rhe World Bank and the WHO Ad Hoc Committee on Health Research Relaring ro Future lntervention Options.
©Copyright 1996 World Health Organization. All righrs reserved.
CoNTENTS
INTRODUCTION I
r. THE GBD's APPROACH TO MEASURING HEALTH STATUS 6
2. How THE WORLD DIES TODAY 14
3· DISABILITY: THE INVISIBLE BURDEN 20
4· THE GLOBAL BURDEN OF DISEASE IN 1990
5· RISK FACTORS FOR DEATH ANO DISABILITY 2.7
6. LOOKING AHEAD: THE HEALTH OF THE WORLD IN 2020 3 I
7. FROM THE SERIES 40
Table of Contents for Volume 1 40
Líst of Annex Tables 41
Global Health Statistics: Sample cable from Volume II 42
The Global Burden of Disease and lniury Series 43
This booklec is a summary of che The Global Burden of Disease: A Comprehensive Assessment of Mortality and Disability from Diseases, ln¡uries, and Risk Factors in 1990 and Projected to 2020, edited by Christopher J.L. Murray and Alan D. Lopez, published by che Harvard School of Public Healch on behalf of che World Healch Organization and che World Bank and disrributed by Harvard University Press. le also conrains examples of che decailed informacion on che epidemiology of 240 conditions around the world published in Global Health Statistics: A Compendium o( lncidence, Prevalence and Mortality Estimates for Over 200 Conditions, by Chriscopher J.L. Murray and Alan D. Lopez, published by the Harvard School of Public Healch on behalf of che World Health Organization and che World Bank and distributed by Harvard Universicy Press.
Thís summary has been prepared by Phyllida Brown. The prepararían and príntíng of che summary were made possible through a grane from che Eli Lilly Foundacion and Harvard Medica] Internacional.

"Publication of the Global Burden of Disease and Injury Series marks the transition ro a new era ... 1 firmly predice rhat by the turn of che century the official reporting of health outcomes in dozens of countries and globally will embody the approach and standards described in this series."
Dean T. Jamison, Professor of Public Health, University of California Los Angeles and Chairman, WHO Ad Hoc Committee of Health Research Relating to Future Jntervention Options
~lGIONAL G I.O\fl'll\IGS
O&;;: ~\~r:!~:;:Wr ~~'" rorAr> r~.~ r "'~Y' <6 ..\ w~rn iln tAr.u¡
(] ~5-lll6hl\ Abk:.a 1 ~A l
~~~~~~~~~ts~/ •
WM ÁJtln"'UU'""' •lw C..uohllcoa• ILAQ Annc.~ r ... ñru r c-1 C..u,.~t 1 At.CI 11""'"•QVC'I.,u:occ: ú r.Y.bn. (AI.CJ
• ,\fi44k F.Ukt'n C:k'Crn l t.\ lt::O Ar~<l dcf Onpr<- ,\ 1('>fl'l• ,\()~\}
Crui ~unr noorm-utm.u l jC..\10)
INTRODUCTION
The next two decades will see drama tic changes in che health needs of the world's populations. In the developing regions where four-fifths of the planet's people live, noncornmunicable diseases such as depression and heart disease are fase replacing che tradicional enemies, such as infectious diseases and malnutrition, as the leading causes of disability and premacure death. By the year 2020, noncommunicable diseases are expected ro account for seven out of every ten deaths in che developing regions, compared wich less than half today. Injuries, both unintentional and intencional, are also growing in importance, and by 2020 could rival infectious diseases worldwide as a source of ill health.
These changes are expected beca use of the rapid aging of the developing world's populations. As a population's birrh rate falls, the number of adults relative to children increases, and the population's commonest health problems become those of adules rather than those of children. In China, sorne other parrs of Asia and Latín America, chis so-called "epidemiological transition" is already much further advanced chao many public health specialists appreciate. In all regions che rapidity of change, and the very large absolute numbers in volved, will pose serious challenges ro health-care systems and force difficult decisions about the allocation of scarce resources. Yet, until now, many governments have lacked even the mosr basic data they needed to inform debate and to assess priorities for public health.
Now, for the first time, this gap has been filled with a landmark publication. Researchers at the Harvard School of Public Health and che World Health Organization, with more than 100 collaborators from around the world, have produced a comprehensive, internally consistenc and comparable ser of estimares of current parteros of mortality and dísability from disease and injury for all regions of the world, wich projections ro the year 2020. The Global Burden of Disease and Injury Series, the ten-volume result of their study, is a unique resource that

2
provides policyomakers with their first comprehensive picture of che world's current and future healch needs.
The researchers involved in chis ambitious five-year effort developed a new approach to measuring health status. Their method quantifies not merely the number of deaths but also the impact of premature death and disability on a population, and combines these into a single unit of measurement of the overall "burden of disease" on the
The Global Burden o{ Disease
Deaths from noncommunicable diseases are expected to climb from 28.z mil/ion
ayear in I990 to 49·7 mil/ion by 2020-an increase in absolute numbers of 77 per cent.
population. The series also presents che first estimares of the proportion of mortality and dísability thac can be attributed ro certain risk factors for disease, including tobacco, alcohol, poor water and sanitation, and unsafe sex.
A TIMELY ASSESSMENT OF GLOBAL HEALTH NEEDS
Far from confirming what was already known, the study offers significa m surprises. Overall, it shows that the epidemiological transition is already
Figure 1 Projected trends in death by bread cause Group, developing regions
Developing regions
-.... . Q
40
30
I 20 "' -5 ~
Cl 10
1990 2000
- Noncommunicable diseases
2010 2020
- Communicable, perinatal, maternal and nutritional conditions
- Injuries
SUMMARY 3
well advanced, suggesting that public health policy, with its tradicional emphasis on infectious disease, has not kept pace with events. In addítíon, it makes a number of startlíng individual observacions. Just four examples are highlighted here:
• The burdens of mental illnesses, such as depression, alcohol dependence and schizophrenia, have been seriously underestimated by tradicional approaches chat take account only of deaths and not dísability. While psychiatric condicions are responsible for little more than one per cent of deaths, they account for almost 11 per cene of disease burden worldwide.
• Adules under che age of 70 in Sub-Saharan Africa toda y face a higher probability of death from a noncommunicable disease than adules of the same age in the Established Market Economíes.
• Men living in the Formerly Socialíst Economies of Europe have a disturbingly poor, and deteríorating, health status, íncluding a 28 per cene risk of death between the ages of 15 and 60.
• By 2020, tobacco is expected to kili more people than any single disease, surpassing even che HIV epidemic.
Adults under the age of 70 in Sub-Saharan Africa today face a higher probability of death from a noncommunicable disease than adults of the same age in the Established Market Economies.
The Global Burden of Disease study (GBD) has involved an estimated forty person-years of effort. An excraordínarily large volume of data-on 483 separare sequelae of 107 diseases and injuries, and 14 míllion death certificares--has been subjecred to rigorous analysis using both newly developed and wellescablished methods. Volume I, The Global Burden o( Disease, summarizes the key concepts, methods and results and Volume 11, Global Health Statistics, presents che mass of underlying
epidemiologícal and demographic data. Details of che remaining eíghc vol u mes, which deal wíth specific condícions and country based analyses, are shown on page 43 of chis booklec.
The burden of disease and injury has been calculated for eight demographic regions (see Map}: the Established Market Economies (largely che OECD countries) (EME); the Formerly Socialíst Economies of Europe (FSE); India (IND); China (CHNI; Other Asia and Islands (O Al); Sub-Saharan Africa (SSA); Latín America and the Caribbean (LAC) and che Middle Eastern Crescent (MEC). Burden is analysed by five age groups, by sex and by cause.

4 The Global Burden o{Disease
This bookler presenrs the key findíngs of Volume [. The first section summarizes the concepts and methods involved in developing a single measure of health status. Sections 2 rhrough 5 present the results for the 1990 assessmenrs and section 6 summarizes the 2020 projections. The final sectíon provides details and samples of the content of Volumes 1 and JI.
Figure 2 Change in the rank arder of disease burden for 15 leading causes, world, 1990-2020
Disease burden measured in Disobility-Adjusted Ufe Yeors (DALYs) Vol 1 p 375
1990
Disease or injury
Lower respiratory infectlons Dlarrhoeal diseases
Condltlons arising during 3 the perlnatal perlod
Unipolar major depression lschaemic heart disease
Cerebrovascular disease
Tuberculosis
Measles Road traffic accidents
Congenital anomaltes
Malaria
Chronic obstructive pulmonary disease Fa lis
lron-deficiency anaemla
Protein-energy malnutrition
16
17
19
28
33
2020 (Baseline scenario)
Disease or injury
lschaemic heart disease
2 Unipolar major depression
3 Road trafflc accidents
4 Cerebrovascular disease
5 Chronlc obstructive pulmonary disease
6 Lower respiratory infections
Tuberculosis
War Diarrhoeal diseases HIV
Condltions arislng during the perinatal period
Vlolence
Congenital anomalies
Self-infllcted injuries
Trachea, bronchus and lung cancers
19
24
25
37
39
SuMMARY
Figure 3
Voll p 317
140
120
-"' 100 e:
~ 80 l
VI
~ 60 ~
40
20
Figure 4
DAL Ys attributable to diarrhoea, HIV and tobacco, 1990-2020 (baseline scenario)
1990 1995 2000 2005 2010 2015 2020
--- Diarrhoea - HIV ---- Tobacco
By 2020, tobacco is expected to cause more premature death and disability than any single disease
Vol 1 p 3 16 (See Map for explanation of regional compositlon)
25%.-----------------------------------~------,
EME FSE CHN LAC OAI MEC IND SSA WORLD
Reglon
5

6 The Global Burden of Disease
I. THE GBD's APPROACH TO MEASURING HEALTH
STATUS
I . I WHY THE GBD JS DIFFERENT
In general, statistics on the health status of populations suffer from severa! limitations that reduce their practica! value ro policy-makers:
• First, they are partial and fragmented. In many countries even the most basic data-the number of deaths from particular causes each yearare not available. Even where mortality data are available, they fail to capture the impact of non-fatal outcomes of disease and injury, such as dementia or blindness, on population health.
• Second, estimares of the numbers killed or affected by particular conditions or diseases may be exaggerated beyond their demographically plausible limits by well-intentioned epidemiologists who also find themselves acring as advocates for the affected popularions in competition for scarce resources. If the currently available epidemiological estimares for all conditions were right, sorne people in a given age group or region would have to die twice over to account foral! the deaths that are claimed.
• Third, tradicional health statistics do not allow policy-makers ro compare the relative cost-effectiveness of different interventions, such as, for example, the treatment of ischaemic heart disease versus longterm care for schizophrenia . Ata time when people's expectations of health services are growing and funds are tightly constrained, such information is essential to aid the rational allocation of resources.
The GBD ser out to address these problems with three explicit aims:
1. to incorporare non-fatal conditions into assessments of health status;
2. ro disentangle epidemiology from advocacy in order to produce objective, independent and demographically plausible assessments of the burdens of particular conditions and diseases; and
3. to meas u re disease and injury burden in a currency that can al so be used to assess the cost-effectiveness of imerventions, in terms of the cost per unit of disease burden averted.
1.2 A SINGLE MEASURE OF DISEASE BURDEN
In order to capture the impact of both premature death and disability in a single measure, a common currency is required. Since the late 1940s, researchers ha ve generally agreed that time is an appropriate currency: time (in years) lost through premature death, and time (in years) lived with a disability. A range of such time-based measures has been developed in
SUMMARY
different countries, many of them variants of the so-catled QualityAdjusted Life Year or QAL Y. For the GBD, an internationally standardized form of the QAL Y has been developed, called the DisabilityL Adjusted Lífe Year (DAL Y). The DAL Y expresses years of life lost to
premature death and years lived with a disability of specified severity and duration. One DAL Y is thus one lost year of healthy life. Here, a "premature" death is defined as one that occurs before the age to which the dying person could ha ve expected to survive if they were a member of a standardized model populatíon wíth a Jife expectancy at bírth equal to that of the world's longest-surviving population, japan.
One D ALY is one lost year of healthy life.
To calculare total DALYs for a given condition in a population, years of Ji fe lost ·: YLLs) and years lived with disability of known severity and duration (YLDs) for that condition must each be
estimated, and then the total summed. For example, to calculare DAL Ys incurred through road traffic accidents in India in 1990, add the total years of life lost in fatal road accidenrs and the total years of life lived with disabilities by survivors of such accidents.
1.3 A SOCIETY'S VALUES ARE EXPLICJTLY BUILT INTO ITS MEASURES OF
HEALTH STATUS
It might appear that quantifying disease burden is a neutral exercise, entirely free of value choices. However, this is far from the case. Disease burden is, in effect, the gap between a population's actual health status and sorne "ideal", or reference status. In arder to measure burden, a society has to decide what che ideal or reference status should be. This involves making five value choices:
• How long "should" people live? If health researchers are to estimare how many years of life are lost through death at any given age, chey must decide on the number of years for which a person at that age should expect to survive in the ideal , or reference, population. That could be, for example, 60, 80 or 90 years from birth.
• Are years of healthy life worth more in young adulthood than in early or late life?
• Is ayear of healthy life now worth more to society than ayear of healthy life in 30 years' time?
• Are all people equal? For example, should one socioeconomic group's years of healthy life count for more than another's?
• How do you compare years of life lose dueto premature death and years of li fe lived with disabilities of differing severities?

8 The Global Burden of Disease
Health researchers developing a measure of disease burden must recognize their responsibility to reflect societies' preferred answers to rhese five questions, but also ro guard against and "filter out" unjustifiable preferences such as racism, sexism or economic discrimination rhat may be institutionalized in certain societies. lt is unlikely that any measure can reflect a perfect vision of the ideal society; but its choices should be acceptable toas many people of as many different cultures as possible.
The Egalitarian Principies on which the DAL Y ls Based
The GBD has sought to develop a measure based on explicit and transparent value choices that may be readily debated and modified. Overall, the DAL Y has a strongly egalitarian flavour. It is built on the principie that only two characteristics of indíviduals that are not directly related to their health-their age and their sex-should be taken into consideration when calculating the burden of a given health outcome in that individual. Other characteristics, such as socioeconomic status, race or level of education, are not considered, so, for example, years of healthy life lived by the director of a bank are regarded as no more valuable than those Ji ved by a poor rural peasant. In the remainder of this section the social choices that affect the ' DAL Y are each discussed briefly.
How Long Should People Live?
In accordance with the GBD's egalitarian principies, the study assumes a standard life rabie for al! populations, with lífe expectancies at birth fixed at 82.5 years for women and 80 years for men. A standard life expectancy
DALYs are intended to be a transparent too/ to enhance dialogue on the major health challenges facing humanity.
allows deaths in all communities at the same age to contribute equally ro the burden of disease. Alternatives, such as using different life expectancies for different populations that more closely match their actual life expectancies, interfere with the egalitarian principie. For example, if a 35 year-old woman dies in childbirth in an African country where she might have expected to live another 30 years, her years of life lost would be deemed unfairly to be fewer than those for a 35 year-old woman who dies in childbirth in Japan, when she might otherwise have expected ro live another 48 years.
Life expectancy is not equal formen and women. Accordingly, the GBD has given mena lower reference life expectancy than women. However, since much of the difference between men and women is determined by men's higher exposure to various risks such as alcohol, tobacco and occupational injury, rather than purely biological differences this choice is arguably a form of discrimination against men and could be modified in future revisions of the DAL Y.
SUMMARY
Are Years of Healthy Life Worth More in Young Adulthood than in Early or Late Life?
9
If individuals are forced to choose between saving ayear of life for a 2 yearold and saving it for a 22 year-old, most prefer to save the 22 year"old. A range of studies confirms this broad social preference to "weight" the value of a year lived by a young adult more heavily than one lived by a very young child oran older adult. Adults are widely perceived to play a critica! role in the family, community and society. The GBD researchers therefore incorpora red age-weighting into the DAL Y. They assume that the relative value of ayear of life rises rapidly from zero at birth toa peak in the early twenties, after which ir sreadily declines.
Figure S
Voll p60
... ..e: .!!.-O Gl ~
~ ·¡;¡
"' q¡ a::
2.0
l. S
1.0
0.5
The relative value of a year of life lived at different ages, as incorporated lnto DAL Ys
20 40 60
Age (years)
80 100
Is a Year of Healthy Life Now Worth More to Society than a Year of Healthy Life in 30 Years' Time?
If a person is offered $100 today or $100 in a year's time, that person is likely to prefer $100 today. Future dollars are thus discounted-valued lower-against current dollars. Whether a year of healthy life, like a do llar, is also deemed to be preferable now rather than la ter, is a matter of intense debate among economists, medical ethicists and public health planners, because discounting future health affects both measurements of disease burden and estimares of the cost-effectiveness of an intervention.
There are arguments for and against discounting and The Global Burden of Disease discusses them in depth. The GBD researchers decided, however, to discount future life years by 3 per cent per year. This means

lO
that a year of healrhy life boughr for 1 O y ea rs hence is worth around 24 per cent less rhan one bought for now, as discounting is represenred as an exponenrial decay function. Because rhe impacr of discounring is significanr, rhe GBD publishes alternarive results based on DAL Ys wirhour discounting.
Discounring furure health reduces the relarive impacr of a child death compared wirh an
The G loba/ Burden of Di sea se
If individuals are forced
to choose between saving
a year or life for a 2
year-old and saving it for
a 22 year-old, most
prefer to save the 22
year-old.
adult dearh. For example, with age-weighring also incorporated, a yearold girl's death causes a loss of 34 years of life while a 25 year-old woman's death results in a loss of 33 years of life. Discounting also reduces rhe value of intervenrions rhat pay off largely in the future-such as vaccinaring against hepatitis B, which may prevent thousands of cases of liver cancer, but sorne decades later.
How Do You Compare Time Lost Dueto Premature Death with Time Lived with Disabi/ity?
While death is not difficult to define, disability is. All non-fatal health outcomes of disease are different from each other in their causes, nature, and their impact on the individual, and rhe impact on the individual is in rurn mediated by rhe way the surrounding community responds. Yet, in order to quantify time lived with a non-fatal healrh outcome and assess disabilities in a way rhat will help ro inform health policy, disability must be defined, measured and valued in a clear framework that inevitably involves simplifying reality.
There is surprisingly wide agreement between cultures on what constitures a severe or a mild disability. For example, a year lived with blindness appears to most people to be a more severe disability than ayear Ji ved with watery diarrhoea, while quadriplegia is regarded as more severe rhan blindness.These judgements must be made formal and explicit if they are to be incorporated into measurements of disease burden.
Two methods are commonly used ro formalize social preferences for different stares of health. Both involve asking people to make judgements about the trade-off between quantity and quality of life. This can be expressed as a rrade-off in time (how many years lived wirh a given disability would you trade for a fixed period of perfect health?) ora tradeoff between persons (would you prefer ro save one life-year for 1000 perfectly healthy individuals as opposed to saving one life-year for 2000 individuals in a worse health state?). While such trade-offs may affront our perceptions about whar is morally acceptable, they are practised implicirly throughout rhe world's health care systems. The philosophy of
SUMMARY
Table 1
Voll p 40
11
Gauging the severity of disability: dlsability dasses and weights set by the GBD protocol for 22 indicator conditions
Disability Severity class weights lndlcator conditions
0.00~0.02 v,:tilgo on face. weight-for-height less than 2 scandard deviations
2 0.02-0.12 Watery diarrhoea, severe sore throat. severe anaemia
3 0.12-0.24 Radius fracture in a stlff cast, infertility, erectile dysfunction. rheumatoid arthritis. angina
4 0.24-0.36 Below-the-knee ampucation, deafness
5 0.36-0.50 Rectovaginal fistula, mild mental recardation, Down syndrome
6 0.50-0.70 Unipolar major depression, blindness, paraplegia
7 0.70-1.00 Active psychosis, dementia, severe migraine. quadriplegia
Note: These welghts were estabLshed using the person trade-off method wlth an ínternational group of health workers who met at WHO In Geneva in August 1995. Each condition is actually a detailed case. For example, angina in this exercise ls defined as reproducible chest pain, when walklng 50 meters or more, that the individual would rate as a S on a sub¡ect ve pa,,n scale lrom O to 1 O.
che GBD is thar the more explicitly rhese preferences are ser out, the more meaningfully they may be debated.
The GBD therefore developed a protocol based on the person trade-off method. In a formal exercise involving health workers from all regions of rhe world, the severity of a ser of 22 indicator disabling conditions-such as blindness, depression, and conditions thar cause pain-was weighted between O (perfect health) and 1 (equivalent to death). These weights were then grouped into seven classes where class I has a weight between 0.00 and 0.02 and Class VIl a weight between 0.7 and 1(see Table 1).
Despite their diverse cultural backgrounds, the participants reached consensus on these weights. Their choices also closely match the pooled results of nine additional exercises with orher participants using the same protocol (Figure 6).
In essence, che weight is ser by the number of people with a given condition whose claim on a fixed healthcare budget is equal, in the judgement of a partipant, to thar of 1000 healthy people. For example, if rhe participan! judges that 1000 entirely healthy people would have an equal claim on the resources as 8000 people with sorne severe disability, the weight assigned to chat particular disabiliry is equal ro 1 minus 1000 divided by 8000, or 0.875. If 1000 entirely healthy people were judged to ha vean equal claim on the resources as 2000 people with a particular, less severe, disability, che weighc assigned would be equal to 1 minus 1000 divided by 2000, or 0.5.
For che GBD prorocol, each participant is asked two versions of the person rrade-off question, one about extending life for people in a given health state versus extending life for healthy people, the second about

Il
Figure 6
Voll p 40
1.0
~ ..e ·~ 0.8 ~
~ 0.6 :o t!l
:t; 0.4 oc Ql S::
:o E 0.2 o u
The Global Burden o{ Disease
In clase agreement: weights set for 22 indicator disabling conditions based on the combined results of nine exercises using the GBD protocol, compared with the results of the Geneva meeting
0.2 0.4 0.6 0.8 l. O
Geneva meeting dlsability weights
giving health back to people in a given health state versus extending life for healthy people. Two questions are asked because people's answers to each one are invariably inconsistent with the other, and the process of making them consistent forces the participant to thínk through the implications of their decision in greater depth.
The implications of choosing between che claims of different groups in a society are profound, so the process of setting weights cannot be undertaken lightly. While sorne other studies have used relatively rapid methods, such as telephone surveys, the GBD protocol is a deliberative process in which a comparatively small group of participants (between 8 and 12) are confronted with the implications of their decision, encouraged to discuss their choices with their peers, and allowed to revise theír inítial eh o ices. This is time-consuming: at most 20-25 conditions can be discussed in a full working day. Once the 22 indicator conditions have been weighted, the participants assigned che remaining conditions across the seven classes.
1.4 How MUCH DO DIFFERENT VALUE CHOICE$ AFFECT THE RESULTS?
To gauge the impact of changing these social choices on the final measures of disease burden, the GBD researchers re-calculated their assessments with alterna ti ve age-weighting and discount rates, and with alterna ti ve methods for weighting the severity of disabilities.
SuMMARY 13
Overall, the rankings of diseases and che distribution of burden by broad cause Group are largely unaffected by ageweighting and only slightly affected by changing the method for weighting disability. Changes to the discount rate, by contrast, may have a more significant effect on the overall results. A higher discount rate results in an increased burden in older age groups, while a lower discount rate results in an increased burden in younger age groups. Changes in che age discribution of burden, in turn, affect the distribution by cause, because communicable and perinatal conditions are commonest in children while noncommunicable diseases are commonest in older adults. The most significant effect of changing the discount and age weights is to reduce the importance of several psychiatric conditions (Figure 7).
Ultimately, however, the accuracy of che underlying basic epidemiological data from which disease burden is calcula red will influence the final results much more than the discount rate, the age weíght, or the dísability weighting method. If, for example, estimares of the incidence of blindness are off by a factor of two, then it follows that this will be reflected in the results. The GBD researchers conclude chat researchers' efforts should be invested in improving the basic data rather than in spending excessive energy on analysing the effects of small adjuscments to the measure itself.
Figure 7
Vol 1 p 282
100
'L:' QI
D4"E 80 .5o .. .lo: -&,e ·~!. 60
' Q) Q) ...
~f o ... S:: § 40 "'o ~~ <(:0 a o 20 ....
Ql N
Relationship between the rank arder of causes of global burden using DAL Y s calculated without age-weighting and discountlng and standard DALYs calculated with ageweighting and a three per cent discount rate, 1990 (highest rank is the largest cause)
Unipolar major depression
"'--Anaemia
'..........._Alcohol use
"'-- Bipolar disorder El"'-- Obsess~ve-compulsive
"'-- Chlamydia drsorder
' Druguse Panic disorder
0 ~~-----L------~--------._------~------~
o 20 40 60 80 100
Standard DALYs (rank arder)
The Global Burden o( Disease
2. How THE WORLD DIES TODAY
Most developing countries still ha ve only limited informarían about how their populations die. One of the chief objectives of the GBD has been ro develop comprehensive internally consistent estima tes of how many people died of each majar cause in 1990 worldwide. No such data set was available befare the GBD began work. The methods are briefly described, followed by a selection of key results.
2.I How THE GBD ESTIMATED THE DEATHS DUETO EACH CAUSE
Deaths were classified using a tree structure. The first leve! of disaggregarion comprises three broad cause Groups:
• Group 1: Communicable, maternal, perinaral and nutritional conditions;
• Group II: Noncommunicable diseases; and
• Group III: Injuries.
Each group was then subdivided into sub-categories: for example, cardiovascular diseases and malignant neoplasms (cancers) are two subcategories of Group JI. Beyond chis leve!, there are two further disaggregation levels so that 107 individual causes for which codes have been included in the Ninth Revision of the lnrernational Classification of Diseases (ICD-9), such as tuberculosis, stomach cancer, or road traffic accidenrs, can be listed separately.
A demographic data ser giving information on population size and the distribution of deaths for each region was developed especially for the GBD. Next, to reach estimares on rhe number of deaths by cause, rhe researchers drew on four broad sources of data:
• Vital registration systems. These are complete only for rhe Esrablished Market Economies and rhe Formerly Socialist Economies of Europe, bur sorne vital registration informarían is avaílable for all regions except China, India and Sub-Saharan Africa (excepting South Africa).
• Sample death registration systems. In China, a ser of 145 Disease Surveillance Points, representa ti ve of both rural and urban areas, and covering about 10 million people, provides information on deaths by cause. In India, Maharashtra State provides full medica! certificarían for at least 80 per cene of urban deaths, while a rural surveillance system including more than 1300 primary health care centres nationwide was used ro assess rural death patterns.
• Epidemiological assessments. Epidemiologists ha ve made estimares of deaths for specific causes, such as malaria, in certain regions. These estimares combine information from surveys on the incidence or prevalence of the disease with daca on case-fatality rates for both treated and untreated cases.
SUMMARY
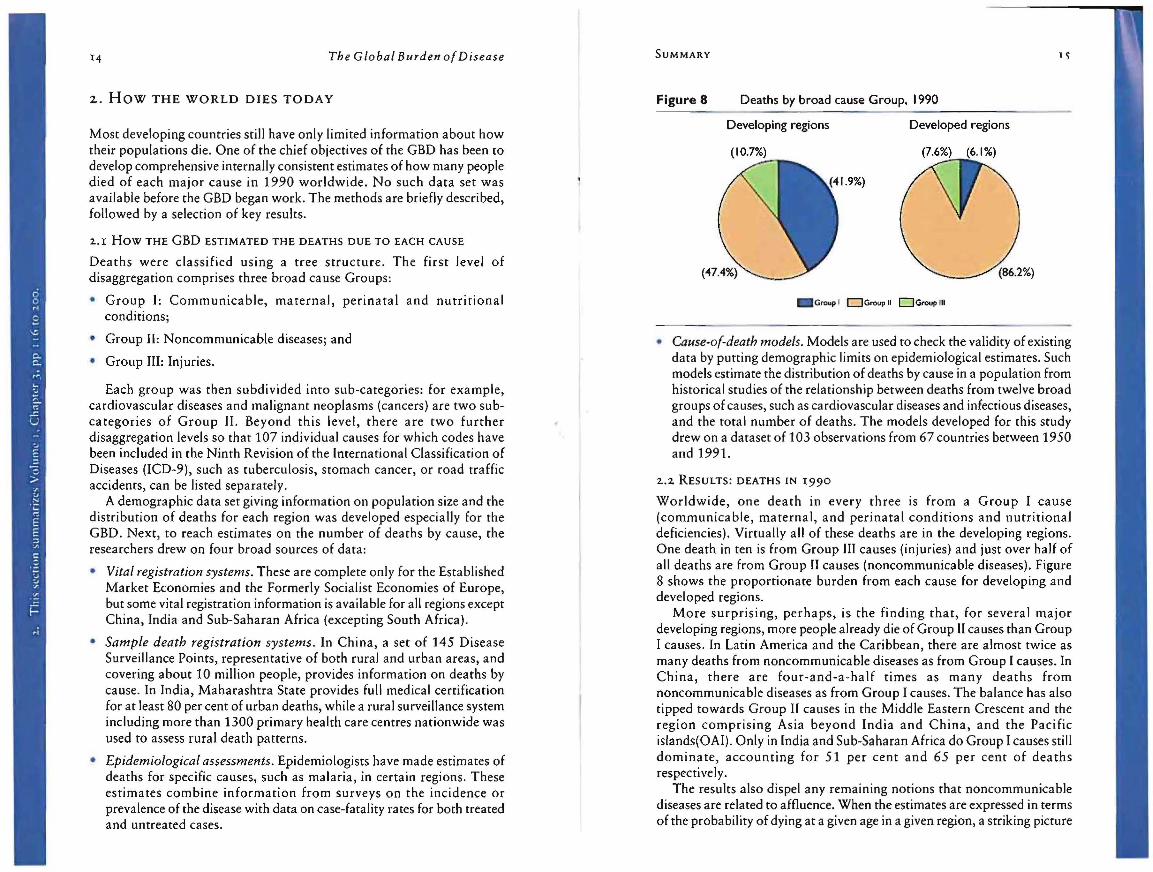
Figure 8 Deaths by broad cause Group, 1990 ----------------
Developing regions Developed regions
(10.7%)
1.9%)
(86.2%)
Group 1 0Group 11 0Group U
• Cause-of-death models. Models are used ro check the validity of exisring data by putting demographic limits on epidemiological estimares. Such models estimare the distribution of dearhs by cause in a population from historical srudies of the relationship between deaths from twelve broad groups of causes, such as cardiovascular diseases and infectious diseases, and the total number of deaths. The models developed for this study drew on a dataset of 103 observations from 67 counrries between 1950 and 1991.
2.2 RESULTS: DEATHS IN I990
Worldwide, one death in every three is from a Group I cause (communicable, maternal, and perinatal conditions and nutritional deficiencies). Virtually all of chese deaths are in the developing regions. One death in ten is from Group III causes (injuries) and just over half of all deaths are from Group 11 causes (noncommunicable diseases). Figure 8 shows che proporcionare burden from each cause for developing and developed regions.
More surprising, perhaps, is che finding that, for severa] majar developing regions, more people airead y die of Group 11 causes than Group 1 causes. In Latín America and the Caribbean, there are almost twice as many dearhs from noncommunicable diseases as from Group 1 causes. In China, there are four-and-a-half times as many deaths from noncommunicable diseases as from Group I causes. The balance has also tipped towards Group 11 causes in the Middle Eastern Crescent and the regían comprising Asia beyond India and China, and the Pacific islands(OAI). Only in India and Sub-Saharan Africa do Group I causes still domínate, accounting for 51 per cent and 65 per cent of deaths respectively.
The results also dispel any remaining notions that noncommunicable diseases are related to affluence. When the estimares are expressed in terms of the probability of dying ata given age in a given region, a striking picture

16 The Global Burden o( Disease
Correcting for miscoding and "garbage" codes
Under the rules of rhe lnternarional Classification of Diseases, dearhs must be assigned ro one cause only, and this must be the underlying cause: for example, if someone has a heart attack and later dies of pneumonia in hospital, rhe cause of death must be recorded' as ischaemic heart disease. Miscoding of deaths-that is, assigning rhe death to rhe "wrong" cause in ICD-9, occurs regularly in all countries with registration systems. For example, the choice of codes for cardiovascular diseases is notoriously variable between industrialized countries, with a significant proportion of ischaemic heart disease deaths being attributed to ill-defined codes such as heart failure. When national sratistics are corrected for probable miscoding, su bstantially different pictures emerge. Miscoding may help to account, for example, for sorne of the unexplained variation in rates of death from ischaemic heart disease between the developed nations. Befare correction, the national data suggest there are more rhan six times as many deaths from ischaemic heart disease in adults in Finland (the country with the highest rate) as in Japan (the country with the lowest rate). After correction, the difference is reduced to 2.3 to l. To correct for such miscoding, the GBD developed specific algorithms to redistribute the miscoded deaths.
A varying proportion of deaths in all countries are ascribed to so-called "garbage" codes, such as "Symptoms, signs, and ill-defined conditions," which account for less than 3 per cent of certificares in the Established Market Economies but as many as one-fifth in sorne developing countries. These deaths are redistributed across other causes.
Box Figure 1
Vol ! p 132
400
Mortality rates from ischaemlc heart disease for selected countries, corrected and uncorrected
- IHD death rates before correction IHD death rates after correction
§ 300
8 ~ 200 c.. 111
-5 1':1 100 Q
SUMMARY 17
emerges. For adults under the age of 70, the probability of dying from a noncommunicable disease is greater in both Sub-Saharan Africa and India than in the Established Market Economies. The results show that premature mortality rates from noncommunicable diseases are higher in populations with high mortality and low income than in the industrialized countries (Figure 9}.
The health of men in the Formerly Socialist Economies of Europe is surprisingly poor. Men face a 28 per cent risk of death between the ages of 15 and 60, the highest risk in any region except Sub-Saharan Africa. This excess is explained by a higher rate of noncommunicable diseases and also by a higher risk of death from injury than formen in the Established Market Economies.
Leading Causes of Death in 1990
Justo ver 50 mi Ilion people died worldwide in 1990, with ischaemic heart disease (IHD) causing more deaths than any other disease or injury. Only 2.7 million of the 6.3 million who died of IHD were in the developed
Figure 9 Noncommunicable diseases are not diseases of affiuence: risks of death from each broad cause Group, by region, 1990
Vol 1 p 177 Males
40 Probabillty of death between ages O and 1 S
glO
~o Probability of death between ages 1 S and 60
gJo 1:;-"'20
~ i:. 10
40 Probability of death between ages 60 and 70
gJo 1:;= 20
:2 ~ 10
Fe males
40 Probabllity of death between ages O and 15
EME FSE CHN LAC OAI HEC , ND SSA
~o Probability of death between ages 1 S and 60
EME FSE CHN LAC OAI HEC IND SSA
~: f- Probability of death between ages 60 and 70
f 20
e 10 "-
0~--------~----~-------.L EME FSf CHN LAC OAI MEC IND SSA EME FSE CHN LAC OAI MEC IND SSA
Probability of death from: - Group l Group 11 - Group 111

r8 The Global Burden of Disease
world. Cerebrovascular disease (stroke) killed 4.4 mi Ilion people, of whom only 1.4 million were in che developed world. Lower respiratory infections (pneumonia) killed 4.3 mitlion people, all but 0.4 million of them in the developing world. Diarrhoeal diseases caused 2.9 mi Ilion deaths, virtually all in the developing world. The ten leading causes together accounted for just over half of all deaths (Table 2).
The Traditional Enemies in Developing Countries
Despite the epidemiological transition, deaths from communicable diseases, maternal and perinatal conditions and nutritional deficiencies cominue to take a heavy, and largely avoidable, toll even chough there ha ve been spectacular successes in their control over the past 30 years. Fully 17.3 million deachs in 1990 were due to chis group of causes, and more than 16.5 million of these were in developing regions, mainly India and Sub, Saharan Africa. Of all Group I deaths, 4 out of 10 were due co eirher pneumonia or diarrhoeal disease, which together accounted for more rhan 7 míllion deaths. Perinatal conditions were responsible for more than 2.4 million deaths, and tuberculosis another 2.0 million deaths. The vast majority of these deaths could have been prevented with exisring interventions.
Because Group I conditions affect children disproportionately, che age structure of deaths also varíes sharply between regions. A baby girl boro in Sub-Saharan Africa faces a 22 per cene risk of death before age 15. In China the risk is less than S per cene and in the Established Market Economies che risk is just 1.1 per cene.
Table 1 The ten leading causes of death, 1990 ----------------
Voll p 178-179
Developed Regions Developing Regions Deaths Cumu· Deaths Cumu~
('OOOs) latln " ('000•) latl...., ~
All Causes 10 912 All Causes 39 554 lschumic heart disease 2 695 2-4.7 1 lower respiratory infectlons 3 9 i S 9.9
2 Cerebrovascular disease 1 427 1 37.8 2 lschaemlc heart disease 3 565 18.9 3 Trachea. bronchus and 523 42.6 3 Cerebrovascular disease 2 954 26.4
lung cancer 4 lower respiratory 385 46. 1 4 Diarrhoeal diseases 2 940 33.8
infections 5 Chronic obstructive 324 49.1 S Conditions arising during 2 361 38.7
pulmonary dlsease the perinatal period 6 Colon and rectum cancers 277 51.6 6 Tuberculosis 1 922 43.'1 7 Stomach cancer 241 53.8 7 Chronic obstructive 1 887 46. 1
pulmonary disease 8 Road traffic acc dents 222 55.8 8 Measles 1 058 48.7 9 Self-inflicted injuries 193 57.6 9 Malaria 856 50.9
1 O Diabetes mellitus 176 59.2 1 O Road traffic accidents 777 52.8
SUMMARY
Injuries and the Burden o( Suicide
Worldwide in 1990, about 5 million people died of injuries of all types, two thirds of them men. Most of these deaths are heavily concentrated among young adules. In chis age group, road traffic accidenrs, suicide, war, fire and violence all figured within rhe ten leading causes of death. The significance of injuries has been largely overlooked by che healrh sector in many countries.
Among adules aged 15-44 worldwide, road traffic accidents were the leading cause of death for men and the fifth most important for women. For women aged between 15 and 44, suicide was second only to tuberculosis as a cause of death. In China alone, more rhan 180 000 women killed themselves in 1990. In India, women face an appallingly high risk of dying in fires: in 1990 alone, more than 87 000 lndian women died chis way. In Sub-Saharan Africa, by contrast, the most important cause of injury deaths for both women and men is war.
2.3 RESULTS: THE TOLL OF PREMATURE DEATH
In conrrast to crude numbers of deaths, a time-based measure such as years of life lost (YLLs, see Section 1 above) atlows public health researchers to identify those causes rhat account for premature deaths, a more informative measure for the design of hea lth polides. For example, injuries affect mainly young people so, while injuries accounted for only 10 per cene of deaths in 1990, rhey accounred fo r 15 per cene of YLLs . Accordingly noncommunicable diseases, which affect mainly older people, accounted for only 31 per cent of YLLs, compared with 56 per cene of deaths (Figure 10).
Figure 10 The leading causes of death and of premature death, world, 1990
Percent of total deaths or Ylls Causes O 5 10
lschaemic ~ean dinase
lower re.spir.ltory lnfectlon.s
OiJ.rrhoeal dlsnses
Conditions arisin¡ durlng the perin:n:al period
Chronk obsuuc.tive pulmoml ry cfisase
Tncloea. bronchus and lung canetrs
Deaths Ylls

20 The Global Burden of Disease
3· DISABILITY: THE INVISIBLE BURDEN
3.r How THE GBD ASSESSED DISABIUTY
A disease or injury may have multiple disabling effects, or sequelae. For example, diabetes may result in diabetic foot, retinopathy, neuropathy, or amputation. To estimare the total burden of disability, the study measured the amount of time lived with each of the various disabling sequelae of diseases and injuries, in both treated and untreated states, and weighted for their severity, in each population. In all, 483 disabling sequelae of diseases and injuries were analysed for this study, for all regions and age groups, and for both sexes.
To calculare the number of years lived with a disabling condition, it is necessary ro know its incidence, the average age of its onset, the average duration of the disability (whether just months or lifelong} and the severity weighr for the condition. The GBD researchers requested epidemiological specialists to estimare each of these variables for each condition based on an in depth review of published and unpublished studies. They also estima red the prevalence of each sequela, its case-fatality rates, remission rates and death rates. This information allowed them ro correct the preliminary estimares for interna! consistency- that is, ro ensure that estimated prevalence was consistent with estimated incidence and vice versa. Consistency was validated using a model developed specially for che study, known as D1sMoo. Frequently, inconsistencies were detecred, and epidemiological specialisrs were asked to revise their inicial estimares. Overall, rhe team took the disability estimares through three complete rounds of revision in a process lasting nearly five years.
The severity weights of different conditions were set using the protocol described in Section l. A ser of 22 indicator conditions ranging from mild to severe disabilities were assigned to seven classes of severity weight between O (perfect health) and 1 (equivalent to death}. Following this exercise, each remaining condition was assigned a distri bution across rhese seven classes.
The number of years lived with a given disability for each individual were calcula red from che incidence of the disability, with the "stream" of disability arising from it measured from the age of onset, for the estima red duration of the disability, multiplied by the condition's severity weight. To calculare the YLDs due ro a condition in any given population, the number of YLDs lost per incident case must be multiplied by the number of incident cases. For example, a case of asthma carries a disability weight of 0.1 if untreated and 0.06 if treated. If the incidence of asthma in males aged 15-44 years is 1 million, the untreated proportion is 35 per cent, and the average duration is seven years, rhen chis sequela alone is estimated to cause 664 000 YLDs in a given year for that demographic group.
Unlike the estimares of years of life lost, not all sequelae of al! conditions could be explicitly assessed for YLDs. Estimares for conditions not
t
'
SuMMARY 21
explicitly considered were made on the basis ofinformation on the ratio of total premature mortality (years of life lose) to disability (YLDs) for each broad cause Group.
3.2 RESULTS: THE UNSEEN BURDEN OF PSYCHIATRIC DISEASE
The GBD's findings demonstrate clearly that disability plays a central role in determining the overall health status of a population. Yet that role has until now been almost invisible to public health. The leading causes of disability are shown ro be substantially different from the leading causes of death, thus casting serious doubt on the practice of judging a population's health from its mortality statistics alone.
Mental Illnesses
Most significantly, the study shows rhat the burden of psychiatric conditions has been heavily underestimated. Of the ten leading causes of disability worldwide in 1990, measured in years lived with a disability, five were psychiatric conditions: unipolar depression, alcohol use, bipolar affective disorder (manic depression} schizophrenia and obsessivecompulsive disorder. Unipolar depression alone was responsible for more than one in every ten years of life lived with a disability worldwide. Alrogether, psychiatric and neurological conditions accounted for 28 per cent of all YLDs, compared with 1.4 per cent of all deaths and 1.1 per cent of years of life lost. The predominance of these conditions is by no means restricted to the rich countries, although their burden is highest in the Established Market Economies. They were the most important contributor to YLDs in al! regions except Sub-Saharan Africa, where they accounted for a relatively modest 16 per cent of the total.
Alcohol use is the leading cause of male disability= and the tenth largest in women-in the developed regions. More surprisingly, perhaps, it is also the fourth largest cause in men in developing regions. The remaining important causes of YLDs were anaemia, falls, road traffic accidents, chronic obstructive pulmonary disease and osteoarthritis (Table 3}.
Table 3 The leading causes of disability, world, 1990
Total Percent of (mllllons) total
All Causes 472.7
1 Unipolar majar depression 50.8 10.7 2 lron·deflciency anaemla 12.0 4.7 3 Falls 22.0 4.6 4 Alcohol use 15.8 3.3 S Chronic obstructive pulmonary disease 14.7 3.1 6 Bipolar disorder 14.1 3.0 7 Congen.t:al anomalies 13.5 2.9 8 Osteoarthritis 13.3 2.8 9 Schlzophren'ia 11.1 2.6
10 Obsessive-compulslve dlsorders 10.2 2.2

22 The Global Burden o{ Di sea se
3·3 RESULTS: LONGER LIFESPAN MEANS LONGER "HEALTH SPAN" TOO
The GBD provides support for the theory that people in the high-income, low-mortality populations of the Established Market Economies not only Ji ve longer, but remain healthier for longer too. In recent years, researchers ha ve been divided between those who say that ill health is "compressed" inro rhe last few years of life in these populations, and those who argue that longer life merely exposes people to a longer period of poor health. The new results suggest that older people in the developed world are healthier rhan their counrerparts in developing countries (Figure 11).
They found that babies born in Sub,Saharan Africa can expect to spend about 15 per cent of their lifespan disabled, compared with just 8 per cent for babies born in the Established Market Economies. A 60 year-old in Sub-Saharan Africa can expecr ro spend abour half his or her remaining years with a disabiliry, whereas a 60 year-old in the Established Market Economies is likely ro spend just one-fifth of those years disabled. These results suggest that the proporrion of rhe lifespan lived with a disability falls as life expectancy rises.
Figure 11
Vol 1 p 232
, Ql
60
~ 50 "' '6 e 40 "' Q.
"' :* 30 ...... o ... 20 e Ql V l... 10
cf. o
Proportion of expected remaining lifespan at age 60 that will be lived dlsabled, by region.
EME FSE CHN LAC OAI MEC IND SSA
Region
Males • Females '
SuMMARY 2J
4· THE GLOBAL BuRDEN OF DISEASE IN 1990
A key aim of the GBD was to quantify the combined burden of fatal and non-fatal health outcomes in a single measure, the Disability-Adjusted Life Year (DAL Y). This secrion presents the key resulrs of the assessments of overall burden for each regíon.
The methods for deve!oping the DAL Y are described in secrion l. To calculare DAL Ys due to each disease or injury in a given year and popularion, rhe researchers added together: (a) rhe years of life lost rhrough all deaths in that year, and (b) the years of life expected ro be lived wirh a disability for all cases beginning in rhar year summed, and weighted for the severity of rhe condition.
4.! RESULTS: STARK REGIONAL IMBALANCES IN THE BURDEN OF
DISEASE
The peoples of Sub-Saharan A frica and India together bore more rhan fourrenrhs of rhe total global burden of disease in 1990, although they make up only 26 per cenr of rhe world's population. By contrasr, the Established Market Economies and rhe Formerly Socialist Economies of Euro pe, with about a fifth of the world's popularion berween them, togerher bore less rhan 12 per cent of the total disease burden. China emerged as substantially rhe most "healthy" of rhe developing regions, with 15 per cenr of the global disease burden anda fifth of the world's population. Put differently, about 579 years of healthy life were lost for every 1000 people in Sub-Saharan Africa, compared with just 124 for every 1000 people in the Established Market Economies. This assessment demonstrates clearly the glaring inequalities of world health at the end of rhe 20th cenrury.
The rates of premarure death varied sharply between regíons, wirh rates 7 times higher in Sub-Saharan Africa rhan in the Established Market Economies. By contrast, che rates of disabílity were less varied, with Sub-Saharan Africa having rwice the race of YLDs as the rich countries (Figure 12) .
Figure 12
Vol 1 p 255
o o o .... CIJ a. 111 ... res
a!
DAL Y s per 1 000 population by region broken down into YLL and YLD rates, 1990
600
500
400
300
200
100
O~E-M-E~~-E._CH~N~~-C--0-~-~~----~--
Region
YLL rate
YLD rate
8

The Global Burden o( Disease
Traditional Enemies Remain a Significan! Force
The grip of the tradicional enemies-communicable, maternal, perinatal conditions and nutritional deficiencies-persists as a problem for che whole world. E ven though rhese Group I conditions accounted for only 7 per cent of the burden in the Established Market Economies and less than 9 per cent in che Former Socialist Economies, they nevertheless made up more than four-tenths the total global burden of disease in 1990, and almost half of the burden (49 per cent) in developing regions. In Sub-Saharan Africa, two out of three years of healthy life lost were due to Group 1 conditions. Even in China, where the epidemiological transition is far advanced, a quarter of years of healthy life lost were due ro chis Group. Worldwide, five out of che ten leading causes of disease burden are Group I conditions: lower respirarory infections (pneumonia); diarrhoeal disease; perinatal conditions; tuberculosis and measles. In developing countries, malaria is added to this already daunting list (Figure 13).
Injuries Are a Large, and Neglected, Health Problem in All Regions
The burden of injury in 1990 was highest in the Formerly Socialist Economies of Europe, where almost 19 per cene of all burden was attributed to chis group of causes. China had the second highesr injury burden, Latín America and the Caribbean the third, and Sub-Saharan Africa the fourth. Even in the Established Market Economies, however, the burden of injuries-dominated by road traffic accidents-was almost 12 per cent of the total.
In almost all regions, unintentional injuries were a much bigger source of ill-health in 1990 than intentional injuries such as interpersonal violence and war. The only exception was the Middle Eastern Crescent, where unintentional and intentional injuries took an approximately equal toll because of a particularly high burden of war in the regían at che time.
Leading Causes of Disease Burden
When causes of death are compared, in rank order, with causes of disease burden, substancial differences emerge, again reinforcing the need ro take non-fatal conditions into account as well as deaths when assessing a
Figure 13
Vol 1 p 257
The burden of disease, by broad cause Group, 1990
EME FSE CHN LAC OAI MEC IND SSA
Region
Group 1
SUMMARY
Figure 14
Vol 1 p 287
The relatlonship between the rank order of causes of global ill-health when measured using deaths alone or total disease burden, 1990
Lower respir.nory Tuberculosis ínfections
100 Unipolat major depress1on
a Malaria\ ~/ -lschaemic Falls \ .'1'9 eJl hem disease
........ 80 .... QJ
"E o 60
.::L e
~ 111 40 ~
~ 20
Anaemia Bipolar dlsorder Alcohol use O
0 O O'-'" C 'Stroke
Os<eoa8 hritis 0 o o
O !!n, [] COPO HIV\. O er--
O Oo OC []
[]
[] o
C!
[] o
0 Cl [] 0
O Trachea. bronchus O O \ and lung caneen;
O Cl O Diabetes
[] o [] o o o n....
O \:J C Pancreas cancer [] o o 0 O 0
O 0 O Pronate cancer
¡§1 C !J Bladder cancer 61 o
20 40 60 80 100
Deaths (rank order) ---------------------popularion's health status. While a few leading conditions-such as lower respiratory infections, diarrhoeal diseases and perinatal conditions-are ar the top of both lists, there are 14 conditions in the top half of the list for disease burden thar are in rhe bottom half of the list for deaths. Depression is the most marked of these, falling wirhin the rop ten for disease burden, but the bottom ten for deaths (Figure 14).
The leading causes of disease burden worldwide in 1990 were broadly similar to those for the developing regions. (Table 4).
Sex Differences in Disease Burden
Alrhough in infancy and early childhood, girls and boys suffer from broadly similar health problems, striking sex differences emerge in adulrs. Firsr, and most obviously, women suffer disproporrionately from their reproductive role. Although che burden of reproductive ill-health is almost entirely confined to the developing regions, ir is so great that even worldwide, maternal conditions make up three out of the ten leading causes of disease burden in women aged berween 15 and 44. In developing regions, five out the ten leading causes of DAL Ys are relared ro reproductive ill-health, induding the consequences of unsafe abortion and chlamydia. Almost all of this loss of healthy life is avoidable.
However, poor reproductive health is far from being women's sale concern (Figure 15). In both developing and developed regions, depression is women's leading cause of disease burden. In developing regions, suicide is the fourth. Thus, while programmes to reduce rhe unacceptably high burden of poor reproductive health must remain a high priority for years to come, women 's psychological health also deserves much more attention.

The Global Burden of Disease
Table 4 Ten leading causes of disease burden (DALYs), developing world, 1990
Total Per cent of (mlllions) total
All Causes 1 218.2
Lower respiratory infections 110.5 9.1
2 Diarrhoeal diseases 99.2 8.1
3 Conditions arising during the perinatal period 89.2 7.3
4 Unipolar major depression 41.0 3.4 5 Tuberculosis 37.9 3.1
6 Meas les 36.5 3.0
7 Malaria 31.7 2.6
8 lschaemic heart disease 30.7 25
9 Congenital anomalies 29.4 2.4
10 Cerebrovascular disease 29.1 2.4
Formen aged 15-44, road traffic accidents are the biggest cause of illhealth and premature death worldwide, and the second biggest in developing regions, surpassed only by depression. Alcohol use, violence, tuberculosis, war, bipolar affective disorder, suicide, schizophrenia and iron-deficiency anaemia make up the remainder of the list in developing countries. The high toll of road traffic accidents in developing regions has received relatively little attention from public health specialists in che past.
Figure 15 The ten leading causes of disease burden for women, aged 1 5-44, 1990
Percent of all causes in developed or developing regions
Causes O 5 1 O 15 20
Chlamydia
Setf~nflicc:ed injuries
Rheumttoid anhritis
lron-deflclency anaemia
Developed Developing -
SU M MAR Y 2.7
5. RISK FACTORS FOR DEATH AND DISABILITY
Exposure to particular hazards, such as tobacco, alcohol, unsafe sex or poor sanitation, can significantly increase individuals' risks of developing disease. These hazards, or risk factors, are significant contributors toche total global disease burden and health policy makers need accurate information on their impact if chey are to devise effective prevention strategies. Until now, however, there have been few attempcs ro measure the burdens of chese risk factors, orto express them in a currency thac can be compared directly with the burdens of individual diseases.
The GBD researchers ha ve sought ro overcome this problem. They ha ve assessed, for the first time, che mortality and loss of healrhy life that can be attributed ro each of ten major risk factors in each region. These risk factors are: malnutrition; poor water supply, sanitation and personal/domestic hygiene; unsafe sex; tobacco use; alcohol use; occupation (that is, exposure to hazards through work); hypertension; physical inactivity; illicit drug use; and air pollucion.
5.1 How THE BURDEN OF RISK
FACTORS WAS ASSESSED
The burden of disease or injury in a population today chat can be attributed to pase exposure ro a given risk factor is, essentially, an estímate of che burden that could
Unsafe sex was the third
biggest risk factor for
disease burden.
In young adult women
in Sub-Saharan Africa,
it accounts for an
estimated 3 o per cent
of the total burden.
ha ve been a verted in rhe population if that particular risk factor had been eliminated. More precisely, chis is defined as the difference becween che currently observed burden and che burden that would be observed if pase levels of exposure had been equal ro a specified, reference distribution of exposure. In general, to calculare chis, it is necessary to know: (a) the relative risk at different levels of exposure for each cause of death and disability linked to che factor; (b)the distribution of different levels of exposure in the population; and (e) the burden of disease or injury dueto each of the causes linked ro the factor. Depending on che na cure of che risk factor, the reference distriburion against which relative risk is compared could be zero exposure for che whole popularion, a population distribution of exposure from low ro high levels based on observed populations, oran arbitrary distribution. For this study, the researchers used, wherever possible, zero exposure as the reference, except for risk factors such as hypertension, where clearly no one can be said ro exposed to "zero" levels.

28 The Global Burden of Disease
Table S Global burden of disease and injury attributable to selected risk factors, 1990
As%of total
DALYs
Malnuuition S 881 11.7 199<486 22.0 20 089 4.2 219 575 15.9
Poor water supply sanitatlon and personal
2 668 5.3 as 520 9.4 7 872 1.7 93 392 6.6
and domestic hygiene
Unsafe sex 1 095 2.2 27 602 3.0 21 100 4.5 46 702 3.5
Tobacco 3 038 6.0 26 217 2.9 9 965 2.1 36 182 2.6
Alcoh 774 1.5 19287 2.1 28400 6.0 47 687 3.5
Occupatlon 1 129 2.2 22493 2.5 15 39<1 3.3 37 687 2.7
Hypertension 2918 5.6 17665 1.9 1 411 0.3 19 076 lA
Physical inactivlty 1 991 3.9 11 353 1.3 2 300 0.5 13 653 1.0
IINcit drugs 100 0.2 2 634 0.3 5834 1.2 8467 0.6
Air pollution 568 1.1 5625 0.6 1 630 0.3 7 254 0.5
Source: Authors' estima tes are based on data and inlorrnation contalned in individual chapters of Volume IX of the Global 8urden o( DisMSe and lnjury Series.
5.2 RESULTS: THE CONTRIBUTIONS OF RISK FACTORS TO GLOBAL
BU ROEN
Of the ten risk factors studied, the most significant were malnutrition, poor water, sanitation and hygiene, unsafe sex, alcohol, tobacco and occupation. Together, these six hazards accounted for more than one-third of total disease burden worldwide in 1990 (see Table 5). Of the six, malnutrition and poor sanitation were the dominant hazards, responsible for almost a quarter of the global burden between them. Unsafe sex and alcohol each conuibured approximately 3.5 per cent of the total disease burden, closely followed by tobacco and occupation hazards with just under 3 per cent each. These are comparable to the burdens caused by tuberculosis and measles.
Not surprísíngly, the researchers found sharp inequalitíes between regíons and between roen and women in the burdens of most risk factors. For example, the ill-health consequences of unsafe sex-whích ínclude both infectíons and the complications of unwanted pregnancy-are borne disproportionately by women in all regions. In young adult women in Sub Saharan Africa, unsafe sex accounts for almost one-third of the total dísease burden.
Tobacco and alcohol currently cause their heaviest burdens in roen in the developed regions. In these regíons, the two rogether accounted for more than one-fifth of the total burden in 1990. However, the health burdens of smoking and drínking are far from being the exclusive preserve of the industrialized world. The recent rapíd increase in tobacco use in Asía and other developing regions is expected ro kili many more people in the coming decades than ha ve so far díed in the developed regions {see Sectíon 6).
SuMMARY
Figure 16
Voll p 319
Male deaths attributable to, and averted by, alcohol use.
-;;;"'t:: 1:
!JI ::::1 o -5 -
Established Market Economies (EME)
"' .l: .... -50 ~ o
-;;;-"'t:: 1:
"' "' ::::1 o .l: .... -"' .l: .... "' Q)
o
-100 L...,,..J-:..,--~~.--7.:""'-;-;;-~.,...-'-:;;:;-.....;;...,;~ 15-29 30-4-4 45-59 60-69
Age group (years)
100 . Sub-Saharan Africa (SSA)
75
50
25
o
-25 15-29 30-44 45-59 60 - 69 70+ Age group (years)
- lnjury Disease - Protective effects (on ischaemic heart disease)
The impact of alcohol varíes between regions not only because of different levels of use in each population, but also beca use of differences in the age structure of those populations (Figure 16). Alcohol has consistently been shown to provide sorne protection against death from íschaemic heart disease, but to íncrease the rísk of severa! other diseases, such as alcoholíc psychoses, pancreatitis, sorne cancers and cirrhosis of the Jiver, as well as many injuries. Because of its protective effect agaínst ischaemic heart disease, in populations where this condition is common and injuries and violence are rare, alcohol may prevent about as many deaths as it causes. In the Established Market Economies, for ínstance, this is probably the case. Neverrheless, alcohol causes asevere disease burden in these rich countries, beca use it causes so many injuries and premature deaths and thus results in large numbers of years lived wíth a disability and years of lífe lost.
In Sub-Saharan Africa, the picture ís very different. There, ischaemíc heart disease is relatively uncommon, so the protective effect of alcohol is far outweighed by its harmful effects in increasing the rates of death and disabílíty from injuries. The contribution of alcohol to injuries is also

JO The Global Burden o(Disease
extremely high in Latín America and the Caribbean, where alcohol use accounts for almost 10 per cene of total disease and injury burden, a figure surpassed only in the developed regions. Ultimately, alcohol is estimated ro ha ve caused about three-quarters of a million more deaths in 1990 than ít a verted, with more than four-fifths of the excess deaths in the developing regions.
5·3 SOME DISEASES ARE THEMSELVES POWERFUL RISK FACTOR$ FOR
OTHER DISEASES
While assessments of the burdens of rísk facrors such as tobacco and alcohol can help to guide príorities, it is also useful to think about the impact of cerrain diseases as risk factors for other diseases. For example, diabetes mellitus strongly increases an individual's risk of developíng ischaemic heart disease and srroke, while infection with hepatitis B virus increases the risk of developing liver cancer and cirrhosis of the liver. Tradicional methods of assessing deaths by cause fail to capture these relationships. The GBD researchers have attempted to overcome this for a short list of well-studied conditons. They treated ea eh condition as a risk factor and estimated how much of the total disease burden wou ld be averted in each region's population if the condition were eliminared (Table 6). The most dramatic differences between directly coded and total burden are for diabetes and hepatitis B and hepatitis C.
Table 6. Total burden for major diseases, world, 1990
Chagas disease Hepatitis B and hepatitis C Diabetes mettitus Cataracu Glaucoma Onchocerciasis Trachoma Unipolar majar depression Sexually transmltted diseases
Chagas dlsease Hepatitis B and hepatitis C Diabetes melliws Cataracts Glaucoma Onchocerclasis Trachorna Unipolar major depression Sexuafty transmitted disease.s
Deaths Both sexes Males (thousands) (thousands)
-49.2 28.0 818.7 559.6
2 758.9 1 279.4 1 104.4 544.0
330.5 141.4
18.6 11.8 103. 1 29.4 786.2 456.4
-413.3 183.0
DALYs 8oth sexes Males (miltions) (millions)
1.6 0.9 13.3 9.2 26.3 12.9
17.9 a6 5.8 2.3
1.2 0.7
2.0 0.6 69.8 28.3
25.3 9.1
Fe males (thousands)
21.2 259.1
1 479.6 560.4 189.1
6.8 73.7
329.9 230.3
Females (millions)
0.7 4.1
13.4 9.2 3.5 0.5 1.4
41.5 16.2
Dl~ect/
total
0.39 0 .13 0.21 0.01 0.02
000 0.00 0.00
0.56
Dlrect/ total
0.40 0.16 0.42
0.42 0.+1 0.76 0.51 0.73 0.74
SuMMARY 31
6. LOOKING AHEAD: THE HEALTH OF THE WORLD I N
2020
To plan health services effecrively, policy-makers need to know how current health needs could develop in the future. For this study, the GBD developed projections of mortality and disability for each five year period from 1990 to 2020, by cause, for all regions and both sexes. The findings have striking implications for public policy.
6.1 How THE PROJECTIONS WERE DEVELOPED
The GBD researchers used a ser of relatively simple models to develop projections of future health rrends. Rather than attempt ro model the effects of the many separare direct, or proximal, dererminants of disease from the limired data rhar are available, ir was decided to consider a limired number of socio-economic variables: ( 1) income perca pira; (2) the average number of years of schooling in adults, termed " human capital"; and (3) time, a proxy measure for the secular improvement in health this century that results in part from accumulating knowledge and techno logical development. These socio-economic variables show clear his torical relationships wirh mortali ty rates: for example, income growth is closely related ro the improvement in life expectancy that many countries have
Figure 17 The rich get richer: baseline projections of income per capita by region, 1990-2020
Vol 1 p 340
35 .----------------------------------,
o L_~--~----~--~----~--~----~-J
1990 1995 2000 2005 20 1 O 201 S 2020
Years
- EME
-- FSE
IND
CHN
O Al
SSA
LAC
MEC

32. The Global Burden of Disease
achieved chis century. Beca use of their relationships with death races, these socioeconomic variables may be regarded as indirecc, or distal, determinants of healch. In addition, a fourth variable, tobacco use, was included, because of its overwhelming impact on health status, using information from more than four decades of research on che time lag between persistent tobacco use-measured in terms of "smoking intensity"- and its effects on health.
Death rates for all majar causes based on historical data for 47 countries since 1950-91 were related to these four variables to generare che projections. A separa te model was used for HIV and modifications for che interaction between HIV and tuberculosis. Three projection scenarios were developed using different projections of che independent variables.
6.2 RESULTS: PATTERNS OF DEATH-AND LIFE-IN THE 21ST CENTURY
Life Expectancy Grows Almost Everywhere, but Men Fare Worse
Life expectancy at birth is expected ro grow for women in all regions. By 2020, infant girls born in che Established Market Economies may expect to survive to almost 88 years (Figure 18). For meo, life expectancy will grow much more slowly, mainly because of che impact of che tobacco epidemic. Nevertheless by 2020, males born in Sub-Saharan Africa, whose life expectancy at birch was below 50 in 1990, may expect to reach 58 years. Males born in Latín America and che Caribbean, who in 1990 could have expected ro live co 65, may expect ro reach 71 years.
However, formen in the Formerly Socialist Economies of Europe, life expectancy is not expected co grow at all between 1990 and 2020. This is partly due ro che fact that it has actually fallen between 1990 and 1995, so that any positive change is likely ro be merely recovering ro che 1990 position.
In young children and adolescents under the age of 15, the risk of death is projected to decline dramatically in all regions, falling by about cwothirds in Sub-Saharan Africa and India. In adule women, too, the risk of death is expected to fall in all regions. For men, che picture is more complex. Beca use of che tobacco epidemic, men in che Formerly Socialist Economies of Europe and China may expect a higher risk of dying between the ages of 15 and 60 than they do today. In other regions, che risk of death for men in chis age group is expected to fall, but more modestly chao in women. Remarkably, by 2020, men of this age group in che Formerly Socialist Economies of Europe could face a higher risk of deach even than men in Sub,Saharan Africa.
The Impact of Infectious Disease May Be Reduced
Deaths from communicable, maternal and perinatal conditions and nutritional deficiencies (Group 1) are expected ro fall from 17.3 million in 1990 to 10.3 million in 2020. As a percentage of the total burden, Group 1 conditions are expected to drop by more than half, from 34 per cent to 15 per cent.
SuMMARY 33
Figure 18 Projected life expectancy at birth in 2020, by region:
baseline, optimistic and pessimistic scenarios, compared with 1990 estimates
Voll p 354
Males 1r Estimated life expectancies in 1990
Projected life expectancles in 2020 90
85
80 ~
"' L.
75 "' Gl b >.. 70 u t e: ~ 67 u Gl e_ 60 )(
w • ~ 55 :;¡
so 45
40
EME FSE CHN LAC O Al MEC IND SSA
Region
Fe males Estimaced life expectancies in 1990
t Projected life expectancies in 2020 90
85
80 ~ r "' 75 QJ .e T >.. 70 u e: ~ 67 ál • Q. 60 ~ ~ SS :;¡
so • 45
40 EME FSE CHN LAC OAI MEC IND SSA
Reglon
Not~: The stars in the figure denote llfe expecancíes at birth in 1990. Basellne lífe expecancíes projected for 2020 appear as a horizontal bar crossed by a vertica'; bar that gives upper and lower limits defioed by the optimlstic and pessimisric projection scenarios.

34
This projected reduction overall, despite increased burdens dueto HIV and tuberculosis, runs counter to the now widely accepted belief that infectious diseases are making a comeback worldwide. lt reflects, in part, the relative contraction of the world's "young" population: the under-15 age group is expected to grow by only 22 per cent between 1990 and 2020, whereas the cohort of adules aged between 15 and 60 is expected ro grow by more than 55
The Global Burden of Disease
Even under the
pessimistic scenario,
deaths from infectious
diseases, maternal and
perinatal conditions and
nutritional deficiencies
are expected to (al/
slightly.
per cent. In addition, rhe projection reflecrs rhe observed overall decline in Group l conditions over the pase four decades, due ro increased income, education and technological progress in che development of antimicrobials and vaccines. Even under the pessimistic scenario, in which both income growth and technological progress are expected ro be mínima!, deaths from these conditions are still expected ro fall slighdy to 16.9 million (Figure 19).
Clearly, it should not be taken for granted that che progress of the past four decades against infectious diseases will be ma intained. Iris possible, for example, that antibiotic development and other control technologies
Figure 19 Pessimistic projection of deaths from Group 1 causes, world, 1990-2020
Voll p 360
20 -
1f 15 - ----------~-------------------------1 ~ 1
<1> ..e: .... "' QJ
1 o t-- 1-
O S t--
o 1990 2000
lnfectious - Respiratory infections
2010 2020 Year Perinatal - Nutritional - Maternal
SU M MAR Y 35
wi ll not keep pace w ith the emerge nce of drug-resistant stra ins o f importa nt microbes such as Mycobacterium tubercu losis. If such a frightening scenario were to prove correct, and if, in addition, case-fatality rates were to rise beca use of such drug-resistant stra ins, the gains o f t he present century cou ld be halted or even reversed. Undoubted ly, the continuing high toll o f Group l ca uses today leaves no room for complacency. Nonetheless, rhe evidence to date suggests that, as long as, and only if, current effo rts are maintained, Group I causes are likely ro continue to decline.
HlV AND TuBERC ULOSIS
Projections for HlV morta lity were develo ped using a separare model. The GBD pro jections for H IV demonstrate that rhe death toll from che AIDS epidemic may be even greater than feared in fut ure.
In Sub-Saharan Africa, death rates from HIV/AIDS are expected to peak around 2005 with around 800 000 deaths per yea r. In Ind ia, death rates a re expected to peak a little later, around 2010, at about half a mill ion a year . The worldwide peak for HIV deaths is expected ro be around 2006, with perhaps l. 7 mili ion deaths that year. Clearly, these estimares are subject ro considerable uncertainty.
Projections of the future impact of tuberculosis are also subject ro large uncertainties, but the resu lts a re no more reassuring than chose for AIDS. The figure shows baseline, optimistic and pessimistic projections of the deaths the disease is expected ro cause between 1990 and 2020 (Figure 20!.
Figure 20
3500
-3000 <1>
"U e: "' VI :::1 o
:§_ 2500
"' ..e: .... "' QJ
o 2000 '
1500
Projections of deaths from tuberculosis, world, 1990-2020
- - - Optimistic scenario
Baseline scenario
--- Pessimistic scenario
O LL----------~----------~----------~ 1990 2000 2010 2020

The Global Burden ofDisease
The Rise of Noncommunicable Diseases
While overall, Group I conditions are expected to decline, deaths from noncommunícable diseases (Group 11) are expected to climb from 28.1 mili ion deaths in 1990 to 49.7 mili ion in 2020, an increase of 77 per cent in absolute numbers. In proporciona te terms, Group II deaths are expected to íncrease their share of the total from 55 per cene in 990 to 73 per cent in 2020. These global figures, impressive as they are, mask che extreme nature of che change that is projected in sorne developing regions beca use they incorporare the projeccions for the rich nacions, which show little change. In India, deaths from noncommunicable diseases are projected to almost double, from about 4 million to about 8 million ayear, while Group l deaths are expected ro fall from almost 5 million to below 3 million a year. In the developing world as a whole, deaths from noncommunicable diseases are expecced to rise from 47 per cent of the burden to almost 70 per cent.
The steep projected increase in the burden of noncommunicable diseases worldwide is largely driven by population aging, augmented by the large numbers of people in developing regions who are now exposed to tobacco. lt is important to stress that aging will result in a rise in che absolute numbers of cases of noncommunica ble diseases and in their increased share of the total disease burden for che population as a whole, but not in any change toche rates of those diseases in any given age group.
As studies in che Established Market Economies show, the age-specific rates of sorne important noncommunicable diseases, such as ischaemic heart disease and stroke, have been falling sceadily for at least two decades. Whether these rates are also falling in other regions is much less clear.
Figure 21
Vol 1 p 359
60
The rlse of noncommunicable diseases: Group 11 deaths by causes, world, 1990-2020
Group 11 deaths
o 1990 2000 2010 2020 Year
• Cardiovascular • Cancer Respiratory • Oigestive • Other
SUMMARY 37
However, any age-specific decrease in the cates of these diseases that may also emerge in low-income countries is likely to be outweighed by the large and demographically driven increase in the absolute numbers of adults at risk for these diseases, augmented by the tobacco epidemic.
As with noncommunicable diseases, deaths from injury are also expected to rise for mainly demographic reasons . Young adults are generaJly exposed to greater risks of injury.
6.2 THE BURDEN OF DISEASE IN 2020
When disability is taken into account as well as death, a different view of che future emerges- and one that emphasizes adult health problems scill further. By 2020, the disease burden dueto communicable, maternal and perinatal conditions and nutritional deficiencies (Group 1) is expected to fall coa fifth of the total. The burden attributable to Group II, accordingly, is expected to rise sharply, and the burden from injuries is also expected to rise to that of Group 1 conditions (Figure 22).
Mental Health: Unmet and Growíng Needs
As with the 1990 assessments, psychiatric diseases emerge as a highly significant component of global disease burden when disability, as well as death, is taken into account. The projections show that psychiatric and neurological conditions could increase their share of the total global burden by almost half, from 10.5 per cene of the total burden to almost 15 per cent in 2020. This is a bigger proportionate increase than that for cardiovascular diseases.
Figure 22 Change in the distribution of DAL YS, by broad cause Group, developing regions, 1990-2020.
1990 2020
(17.6%)
(68.7%)
(10.7%)
- Groupl Group 11 Group 111

The G loba/ Burden of Disease
Tobacco's Legacy
By 2020, che burden of disease acrribucable ro tobacco is expected to oucweigh that caused by any single disease. From its 1990 leve) of 2.6 per cene of all disease burden worldwide, tobacco is expected to increase its share to just under 9 per cent of che total burden in 2020, compared with just under 6 per cene for ischaemic heart disease, che leading projected disease. This is a global health emergency chat many governments have yet to confronc.
Leading Causes of Disease Burden in 2020
Figure 2 on page 8 shows how che global pattern of disease burden is expected to shift over che next 24 years. In 1990, the three leading causes of disease burden were, in descending arder, pneumonia, diarrhoeal diseases and perinatal condicions. The three conditions projected to cake their place by 2020 are ischaemic heart disease, depression and road traffic accidents. Pneumonia is expected to fall to sixch place, diarrhoeal diseases co ninth and perinacal conditions to eleventh. Nocably, measles, curren ti y in eighth place, is expected ro drop ro twenry ~ fifth. However, noc all infectious diseases are expected co decline, despice che projecced overall collapse of Group 1 condicions. Tuberculosis is expected to remain at its current leve! of seventh place, a substantial source of disease burden for che foreseeable fucure. Of equally greac concern is the finding thac HIV, currently twenty-eighth in che ranking, could be as high as cenrh by 2020.
Road Traffic Accidents and Violence
Because of che growth of the adule fraction of che population, the burdens of severa! important types of injury are also likely to increase. For example, young menare the group most frequently involved in road traffic accidents, so if che young-adult proportion of the population increases sharply, road traffic accidents are likely to increase too. lndeed, according ro the baseline projection, road traffic accidents could rise to third place from ninth worldwide. Violence, currently nineteenth, could rise as high as twelfth place and suicide could climb from seventeenth ro fourteenth place.
Not surprisingly, these changes are not expected to be evenly dispersed worldwide. The total number of lost years of healthy life in che Established Market Economies is likely ro fall slightly, while ic will increase slightly in che Formerly Socialist Economies of Europe. Scrikingly, however, SubSaharan Africa's future looks discurbingly poor despite che decline in che burden of Group 1 conditions that currently domínate its health needs. Overall, che region faces an increase in che number of lose years of healthy life between 1990 and 2020, due mainly to a steep projected rise in che burden of injuries from road accidents, war and violence.
SUMMARY 39
CONCLUSION
The GBD study has provided a new and much needed picture of current and projected health needs . In particular, it has shown that noncommunicable diseases are rapidly becoming the dominant causes of ill-health in all developing regions except Sub-Saharan Africa; it has revealed the extent to which mental health problems have been underestimated worldwide; and ir has shown rhe significance of injuries as a problem for the health sector in all regions. The findings pose new and immediate challenges to policy-makers and are certain ro provoke debate. Ultimately, che study's impact will be judged in two ways: first, by the degree to which it stimulates other researchers ro apply che same rigorous methods of measuring disease burden in all regions; and second, ro rhe extent that it changes priorities for public health in the decades ahead .

40 The Global Burden of Disease
FROM THE SERIES
T ALBE OF CONTENTS: The Global Burden of Disease
LIST OF TABLES ............... ... ......................................... ...................... ¡¡¡
LIST OF FIGURES .......... .... ... ........................... ..................................... V
GLOBAL BORDEN OF DISEASE ANO INJURY SERIES FOREWORD Ra/ph H. Henderson ........... ..... ......................... .............. ........... xiii
GLOBAL BoRDEN oF DISEASE ANo INJURY SERIES FoREWORD Dean T. jamison ............................... .. ........................................ xv
fOREWORD Wil/iam H. Foege ...................................................... xxv
PREFACE ............................. .. ......................................................... xxvii
ACKNOWLEDGEMENTS ................................................................... xxxi
CHAPTER r. RETHINKING DALYs Christopher ].L. Murray .............................................................. 1
CHAPTER 2. NoN ~ FATAL HEALTH OUTCOMES: CONCEPTS, INSTRUMENTS ANO INDICATORS Ann Goerdt, jeff P. Koplan, jean-Marie Robine, Michel C. Thuriaux, Jerome K. van Ginneken ................. .. ....................... 99
CHAPTER 3· ESTIMATING CAUSES OF DEATH: NEW METHODS ANO GLOBAL ANO REGIONAL APPLICATIONS FOR 1990 Christopher ].L. Murray, Alan D. Lopez ............................... 118
CHAPTER 4· GLOBAL ANO REGIONAL DESCRIPTIVE EPIDEMIOLOGY OF DlSABILITY: INCIDENCE, PREVALENCE, HEALTH EXPECTANCIES ANO YEARS LIVED WITH DISABILITY Christopher ].L. Murray, AJan D. Lopez ............................... 201
CHAPTER 5· THE GLOBAL BORDEN OF DISEASE IN 1990: FINAL RESULTS ANO THEIR SENSITIVITY TO ALTERNATIVE EPIDEMIOLOGICAL PERSPECTIVES, DISCOUNT RATES, AGEWEIGHTS ANO DISABILITY WEIGHTS Christopher ].L. Murray, Alan D. Lopez ............................... 247
CHAPTER 6. QUANTIFYING THE BORDEN OF DISEASE ANO INJURY ATTRIBUTABLE TO TEN MAJOR RISK FACTORS Christopher ].L. Murray, Alan D. Lopez ............................... 295
CHAPTER 7· ALTERNATIVE VISIONS OF THE FUTURE: PROJECTING MORTALITY ANO DISABILITY, 199o-2020 Christopher ].L. Murray, AJan D. Lopez ............................... 325
ANNEX TABLES ............................................................................... 397
INOEX .............................................................................................. 977
5UMMARY 41
ANNEX TABLES TO The Global Burden o( Disease
1
2
3
4
5
6 7 8 9 10 11
12
13
14
15
16
17
18
19
20
21
States or territories included in the Global Burden of Disease Study, by demographic region ........................................... 398 Cause Groups, diseases and injuries, and sequelae included in the Global Burden of Disease Study ................................. 400 Age -specific disability weights for the untreated and treated forms of sequelae included in the Global Burden of Disease Study .................................................................................... 412 Proportions of cases receiving treatment for each sequela, by region, 1990 ........................................................................ 417 Percentages of deaths in each cause Group for varying levels of mortality; regression results from 67 countries .......... 419 Deaths by age, sex and cause (thousands), 1990 ............ 433 YLLs by age, sex and cause (thousands), 1990 ............... 469 YLDs by age, sex and cause (thousands), 1990 .............. 505 DAL Ys by age, sex and cause (thousands), 1990 ............ 541 DALYs[O,O] by age, sex and cause (thousands), 1990 .... 577 Population by age, sex and region (thousands), 1990-2020 ............................................................................................. 613
Deaths by age, sex and cause (thousands), 2000, baseline scenario ....................... ... ... ................................................... 616 DAL Ys by age, sex and cause (thousands), 2000, baseline scenario ............... .. ......... ..... ....... .......................................... 652 Deaths by age, sex and cause (thousands), 2010, baseline scenario .............................. .................................................. 688 DALYs by age, sex and cause (thousands), 2010, baseline scenario ...................................................... .......................... 724 Deaths by age, sex and cause (thousands), 2020, baseline scenario ................................................................................ 760 DAL Ys by age, sex and cause (thousands), 2020, baseline scenario ................................................................................ 796 Deaths by age, sex and cause (thousands), 2020, pessimistic scenario .......................... ........ ...... .. ....... .. ... ... ....................... 832 DAL Ys by age, sex and cause (thousands), 2020, pessimistic scenario ............................................................ 868 Deaths by age, sex and cause (thousands), 2020, optimistic scenario ................................................................................ 904 DAL Ys by age, sex and cause (thousands), 2020, optimistic scenario ................................................................................ 940

The Global Burden o( Di seas e
GLOBAL HEALTH STATISTICS provides these detailed epidemiological estimates for 240 conditions. The following are examples o( these tables:
Tabl•l&l
Olebetes M.,lil!A
Tibie 15&1 EME- PEMC • EM8E
Al;}& rllQaeneo 1990
g•{)(JO Numbo1 Rato
(yNIS] ('OQO$) (Pflr IDO 000}
...... 0 ·4 11 .0
5-1-4 8 .0
15·44
4S.59
60· All•gn
o-•
60•
Tot.l
'"" gmup
(""""}
...... , <H 5·1<4
Fema!M ... 5·14
1S .... <45·59 60·
TtJ~I
5-14 1~-44
45·59
60· A~age-s
11l ... 567
1 096
61 .6
616.9 9J6 ... 280.6
10.0 11 .0
109 60.8 <40of S95.9 692 618.0
1 213 297.7
2 308 289.3
lndY. • lndll - Inda
rnOdenco 1990 ~bctr R¡¡le
(fJOOs} (poi roo 000}
• 7
96 3A5
283
'"'
87
329 2n 699
1 "'"
7.0 7.0
47.7
n52 9492 167.1
7.0 7.0
.. 1.7
714.1
941 .3 170.4
168.7
SSA. • ASS- ASS
1nooenoe 1990 Nl,tl'lber Rato
['OOOsJ (~ 100 ()()()}
2.0 1 2.1)
22' 20 . .9 n Jn.7
$-4 51·U 1SS 61.4
2.0 1 2.0
22 20.9
82 372..9 73 sn.G
180 69.0 335 65.a
Cvadro 1!1!1
Diabetes motlhU"&
ProvaiOnoe 1990 .lwg. aoe Aw>BgO
ev&bon
{ysars)
Number Ra!t SI OOS41
('l)OO$} (P6t 1000()()) (ye.srs)
7
so 1900
4 240
10573 16 771
6
Sl
r"1e
'Jl2 , .. 790
21079 37850
27 .. 1002 6411
17461 4 295
25
""' 1059 6J09
17490
5 175 4 744
Prevalot"~Ce 1990
2.5 10.0
30.0 52.3 70. 7
59.2
2 .5 10.0 20.9
52.3 72<
61.5 60.A
Avg. age
6l.6 57.5 39.5
20.6 9.0
16.8
696 6l.O 45.2 24 .9
10.2 15.6 178
Nurri:>ef Rale 61 Ot'IS<!t
(O(JO:J} (Por tOO 000) (ye~rs)
5.6
7.0 1 :)6.6 680.4
J06e 6448.9 4795 16109.5
9n(t 2102 ...
5.6 1.0
\ Zl6 674 .7
2966 64~.8
4 64S 16058.5 8&41 21S7.2
16 065 2 126.9
Pr~M~:lenee 1990
2 .5 0 .97 10.0 5 .27
29.7 32.98 52.2 16.89
69.1 7.35 55. 1 15.1 1
2..S 0 .97 10.0 5.26 2'9.7 34.08 52.2 1733 69.5 7.4.9
55.4 IS.66 SS.3 15.l8
A~g. age Nurrber Ra.te JI orcs.et ('OOOs) (¡;»r 100 000) tw•rs)
1
300 646 874
1 022
1
307 700
1099
2 107
l029
1.1
1.3
2895 :3179.1
8 320.9 722.0
1. r
1.l 208.7 31~.9
8635A 816.8 7699
2.4
10.0 294 52.1 69.0 64 .1
2.4 10.0
29.5 52.2 69.4
55.8 55.0
0.61 2.95
29.64 15.65 7.\0
14 .41
0.61 2.99
30.66 16.110
7.25 1427 , .. . JO
Tlbleau 151
Olabtte 1t.~er•
Cas
08811'1& 1990
Numbor Aale ('000$} ,_ roo 0001
0. 1 o.o 1.4
11 .0 47 77.9
57 14.6
0 .1
0 .1 0.9 7.5
81 96 .1
88 21.6 145 18.2
Oealh:S 1990 Nurrbcr Rale ('OOOs} (j)er 100 000}
10
28
••
11 ,.. SS
104
OealhS 1990
:15 4.3 2.3
20.9 ..... 11 .2
3 .6 4 .4
2.2 tl-3
1162
13.3 122
fltutr'tl(tr F:\ale
(l)()Os} (""' roo 000)
0.8 2.0
0.9 10.4
49.2 10 4.0
1.0 20 0.4
11 .8
65.7
13 5.2 23 4.6
FóJ ~Q{Jical ~rcas see Mc;:Keigue and King 1996. FOf !he methOd! u&ed to ostimate 1100 pf'Oject
in()(lenco. p.-ovümco. and deatns aae Mutn~y ¡¡md Lopez 199&). S06 o11~nat0t"y notos tor ootrniOI\$ aotl cavao1s.
~&th• 2000 (ProjKtOO)
N'IMT\ber A&IC
{'O()()s} (PM IOC 000}
0.1
0.0 1.3
7 9.2
Sl na I):J 152
0. 1 0 .1 <l7 5.7
96 98.3 102 23.7 164 19.6
Ol.lboles moal!;!us • Cases
~ths 2000 (Proj«ted)
Nl.mbor Rafe
I'OOOsJ (poi roo 0001
4
ro l9 ..
10
39 .. 106
a. a 28
1.a 16.4
77.6 9.4
4.0
2.8 1.4
17.4
101 .4
12.0
10.6
Olabc1os molfilus • Cases
Oc.llt\l: 2000 ( Protectccn ~botr fla~
('OO(lsl ~- 100000}
0.8 r.4
0.7 B.O
39.3
'' J.r
r.o r.< 0.3
8.4 52.2
'" 4.0 24 3.5
SUMMARY 43
THE GLOBAL BURDEN OF DISEASE ANO INJURY
SERIES
l. THE GLOBAL BuRDEN OF DI SEAS E: a comprehensive assessmenr of morrality and disabiliry from diseases, injuries and risk facrors in 1990 and projected ro 2020.
11. GLOBAL HEALTH 5TATISTleS: a compendium of incidence, prevalence and mortality estimares conditions.
for o ver 200
III. HEALTH DIMENSIONS OF SEX AND REPRODUCTION: the global burden of sexually transmitted diseases, HIV, maternal conditions, perinatal disorders and con-genital anomalies.
IV. THE GLOBAL EPIDEMIOLOGY OF INFEeTIOUS 0JSEASES
V. GLOBAL PERSPECTIVES ON NONCOMMUNieABLE DISEASES : the epidemiology and burdens of cancers, cardiovascular diseases, diabetes mellirus, respiratory disorders and other major conditions.
WORKSHOP
The Burden of Disease Unir holds workshops periodically throughout the year. Workshops provide detailed instruction and pracrical experience in measuring burden of disease and undertaking analyses of che costeffectiveness of healrh interventions. They emphasize both conceptual and applied skills and will include the use of specialized compurer software. Please contact the Burden of Disease Unir for more information.
VI. N E u R o - P s Y e H 1 A T R 1 e 0ISORDERS AND GLOBAL HEALTH: The epidemiology and burdeos of schizophrenia, demenria, substance use, epilepsy and affective, neurotic and stressrelated disorders .
VII. THE GLOBAL BuRDEN OF INJURIES: mortaliry and disability from suicide, violence, war and unintenrional injuries.
VI!J. MALNUTRITION AND THE BURDEN OF DISEASE: the global epidemiology of protein-energy malnutririon, anaemias and vitamin deficiencies.
IX. QUANTIFYING GLOBAL HEALTH RISKS: the burden of disease artributable ro selected risk factors.
X. HEALTH PRIORITIES AND BURDEN OF D1SEASE ANALYSIS: methods and applications from global, narional and sub-nacional studies.
SoFTWARE PROGAMS
Software Programs for Windows. Developed by the Burden of Disease Unir to measure epidemiological indicators of diseases and injuries.
These programs can be purchased by calling 617 495 8498 or by email, [email protected].
For more informarion: Tcl : 617-495-8498; Fax: 617·496-3227; Email: [email protected]; Weh: hnp:flwww.hsph.harvard.edu/organizarionslbdu

ÜRDER FORM
0 PLEASE SEND
_copies ofG/obal Burden of Disease ($39.95 ea.) Sept. 6x9, 900pp. ISBN 0-674-35448-6 (MURGLO)
_copies of Global Health Statístics ($39.95 ea.) Sept. 6x9, 1010 pp. ISBN 0-674-35449-4 (MURGLH)
Name ______________________ _
Address ----------------------
Send to: Customer Service Harvard University 79 Garden Street Cambridge, MA 02138
Te!: 1-800-448-2242 Fax: 1-800-962-4983 Int'l Te!: 617-495-2480 lnt'l Fax: 617495-8924
Developing Country Price For residems of developing countries, copies of The Global Burden of Disease and Global Health Statistics are available at a price of US $23.00 each + postage (depending on location) by contacting: Attn: E. Gakidou Burden of Disease Unit 9 Bow Street Cambridge, MA 02138 USA Te!: 1-671-495-8498 Fax: 1-617-496-3227 Email: [email protected]
0 CHECK OR MONEY ORDER
ENCLOSED
payable to: Harvard University Press
0 PLEASE CHARGE TO MY
CREDIT CARD
O Visa D Amerícan Express D Mastercard
Card Number ----------------
Exp. Da:r( __________________ _
signature
Total Payment plus $4.50 posrage S _ _ _
UK/Europe/ Africallndia/Middle East contact: Harvard University Press, do Wlley & Sons Ltd. Southern Cross Trading Estate, 1 Oldlands Way, Bognor Regís, W. Sussex PP22 9SA United Kingdom '
Te!: 00-44-1243-779777 Fax: 00-44-1243-820250 Telex: 86111 WILEY email : [email protected]
Web ordcr form: hup://www.hup.harvard.cdu
36-200
~ WHO LIBRARY
1111111111m1 *OOOS02tS*

11111~~··1110 "000S02tS•