global capital markets perspective - deloitte us · pdf fileglobal capital markets perspective...
TRANSCRIPT

Issue 6
September 2014
Global Capital Markets Perspective

Table of contents
3 Foreword
4 Executive summary
5 Timeline of capital market events
6 Macro economic indicators
7 Investment Grade debt markets
10 Leveraged debt markets
14 Equity markets
17 Private Equity
20 Outlook
21 Deloitte Debt and Capital Advisory
23 Acknowledgement
24 End Notes

Global Capital Markets Perspective Issue 6 3
ForewordWelcome to the sixth issue of DTTL’s “Global Capital Markets Perspective”.
Most capital market instruments performed better in 1H14 than the previous half in the wake of improving macroeconomic fundamentals cross many economies. The period saw the U.S. capital markets stabilize as a result of continuity in the Federal Reserve’s (Fed’s) tapering program and the underlying expectation that the monetary stimulus which may be completely withdrawn in the near term. In Europe, measures implemented by the European Central Bank (ECB) coupled with improving economic factors, translated into heightened capital market activity across virtually all instruments. Asia Pacific saw improved issuance as a result of the economic regulations that many of the countries in the region implemented in the previous half.
1H14 also saw issuers take advantage of the conducive capital-raising conditions to issue cheaper debt for refinancing, funding acquisitions, and stocking up on cash reserves for future use. Another trend that emerged across securities during the period was valuation mismatch, with asset prices being much higher than their intrinsic values. There was also a surge in issuance of lower quality assets and this supply was met with robust investor demand in a globally-prevalent low interest rate environment. Regulators across many economies appear to be keeping an eye out for further deterioration of asset quality, thus trying to avoid a recap of the financial crisis of 2007 that had its roots in poor-quality financial securities.
Refinancing remained a key reason for issuance, with companies taking advantage of the current environment conducive to capital-raising for as long as it lasts. M&A-related financing contributed a greater share in the total capital raised by issuers across many economies, especially in Europe.
Analysts expect the recovery in capital markets to continue in 2H14, with a possibility of uneven growth across geographies and asset classes. While economic reforms seem to have lent some stability to the capital markets, they continue to be complex and dynamic in nature, making it essential to keep a constant watch on developments in order to gain insight into some of the most important trends shaping these markets.
Enjoy the read!
Robert Olsen Partner National Leader—Corporate Finance Deloitte Canada
James Douglas Partner Leader—Debt Advisory Deloitte UK
Global Capital Markets Perspective Issue 6 4
Executive summary
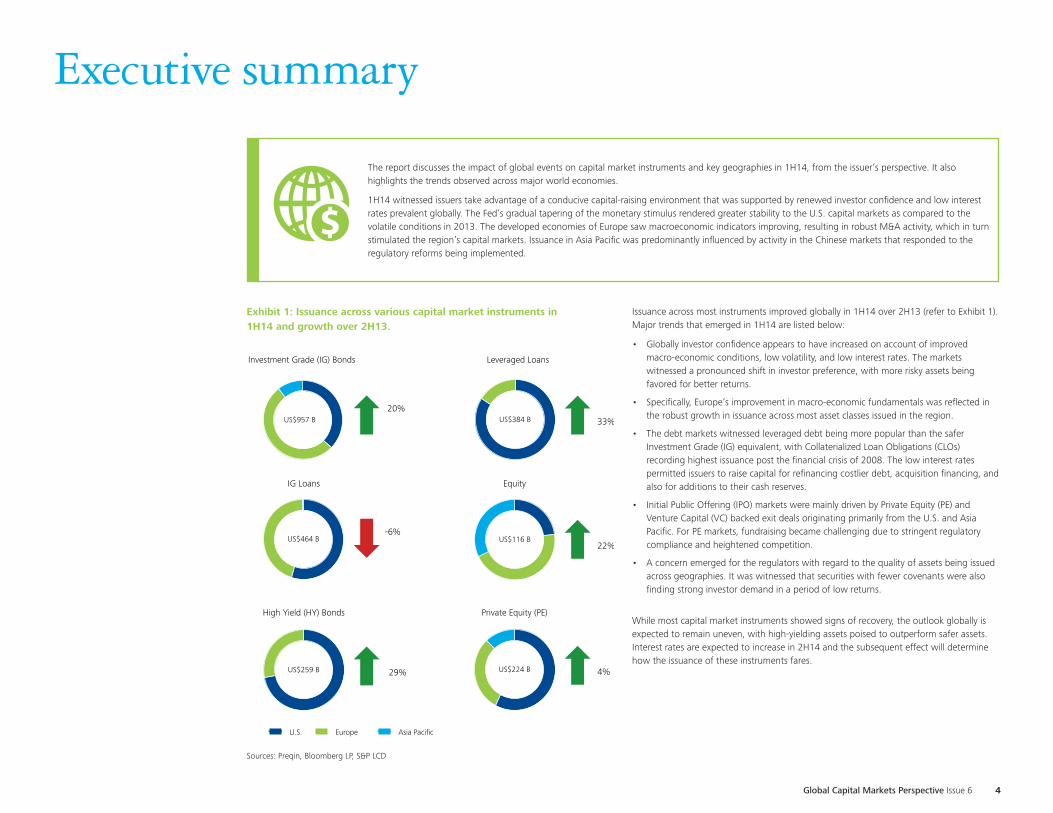
Exhibit 1: Issuance across various capital market instruments in 1H14 and growth over 2H13.
Issuance across most instruments improved globally in 1H14 over 2H13 (refer to Exhibit 1). Major trends that emerged in 1H14 are listed below:
• Globally investor confidence appears to have increased on account of improved macro-economic conditions, low volatility, and low interest rates. The markets witnessed a pronounced shift in investor preference, with more risky assets being favored for better returns.
• Specifically, Europe’s improvement in macro-economic fundamentals was reflected in the robust growth in issuance across most asset classes issued in the region.
• The debt markets witnessed leveraged debt being more popular than the safer Investment Grade (IG) equivalent, with Collaterialized Loan Obligations (CLOs) recording highest issuance post the financial crisis of 2008. The low interest rates permitted issuers to raise capital for refinancing costlier debt, acquisition financing, and also for additions to their cash reserves.
• Initial Public Offering (IPO) markets were mainly driven by Private Equity (PE) and Venture Capital (VC) backed exit deals originating primarily from the U.S. and Asia Pacific. For PE markets, fundraising became challenging due to stringent regulatory compliance and heightened competition.
• A concern emerged for the regulators with regard to the quality of assets being issued across geographies. It was witnessed that securities with fewer covenants were also finding strong investor demand in a period of low returns.
While most capital market instruments showed signs of recovery, the outlook globally is expected to remain uneven, with high-yielding assets poised to outperform safer assets. Interest rates are expected to increase in 2H14 and the subsequent effect will determine how the issuance of these instruments fares.
US$957 B
US$464 B
US$259 B
US$384 B
US$116 B
US$224 B
Investment Grade (IG) Bonds
20%
IG Loans
-6%
High Yield (HY) Bonds
29%
Leveraged Loans
33%
Equity
22%
Private Equity (PE)
4%
U.S. Europe Asia Pacific
The report discusses the impact of global events on capital market instruments and key geographies in 1H14, from the issuer’s perspective. It also highlights the trends observed across major world economies.
1H14 witnessed issuers take advantage of a conducive capital-raising environment that was supported by renewed investor confidence and low interest rates prevalent globally. The Fed’s gradual tapering of the monetary stimulus rendered greater stability to the U.S. capital markets as compared to the volatile conditions in 2013. The developed economies of Europe saw macroeconomic indicators improving, resulting in robust M&A activity, which in turn stimulated the region’s capital markets. Issuance in Asia Pacific was predominantly influenced by activity in the Chinese markets that responded to the regulatory reforms being implemented.
Sources: Preqin, Bloomberg LP, S&P LCD

Timeline of capital market eventsExhibit 2: Significant events that impacted capital markets in 1H14
01 JAN
19
MA
R
10 APR
11A
PR
17 MAY
01
JUN
27 JUN
27
JUN
Chinese authorities lift a ban on new market listingsAfter more than a year, the Chinese Securities Regulatory Commission (CSRC) lifted a ban on new stock market listings, introducing new rules to improve and streamline the IPO process.5a
The Fed Reserve scales back monetary stimulusIn the March Federal Open Market Committee (FOMC) meeting, the chairman announced a third US$10B reduction to quantitative easing, reducing its monthly bond purchases to US$55B5b. The Fed plans to make a US$15B final reduction in its October meeting, after trimming it by US$10B at each meeting up to that point.5c
Greece returned to the international markets with bond sale of US$4.2BThe Greek government reestablished its presence in the bond market, raising US$4.2B by selling five year bonds offering a yield of 4.95%5d.Low interest rates prevailing in the market attracted investors towards the bond issue and initiated the return of investor confidence in the country.5e
Cross border trading plan to be introduced for Shanghai and Hong Kong Stock exchangesAs a step to open up its capital markets, China introduced a plan to facilitate cross border trading between Hong Kong and Shanghai stock markets5f. The program is likely to start during 4Q14 and will allow investors to buy and sell up to 24.5B Yuan of stocks in companies listed on any of these exchanges.5g
Portugal leaves its bailout program with US$293B debt and lower GDPPortugal regained its economic sovereignty after leaving its international bailout program. However, things haven’t improved considerably as the country has a debt of US$293B, which is the third highest in the Eurozone. With the bailout, Portugal has raised its taxes on all consumer items and reduced its budget spending by USB12.4B since 2010.5h
China market re-opensAfter an abrupt closure in March 2014, China’s A-share IPO market re-opened in June 2014 kicking off a new round of IPOs. The CSRC’s interference in the markets has kept a lid on IPO activity leading to a pipeline of companies waiting to seek approval for listing, thereby affecting the overall development in the Chinese markets.5i
The ECB launches bold measures to boost Eurozone trailing economyThe ECB announced measures to enhance the functioning of the monetary policy transmission mechanism by supporting lending to the economy. The Governing council of the ECB has decided to conduct a series of targeted longer-term refinancing operations (TLTROs) aimed at improving bank lending. The ECB also cut the deposit rate for the region’s commercial banks to -0.1% from zero.5j
European Union (EU) signs trade pact with UkraineThe EU signed a free-trade and political cooperation agreement with Ukraine, in order to facilitate economic integration of the country with the other members of EU. This act has been strongly opposed by the Russian government as it further weakens its influence over former Soviet republics.5k
Global Capital Markets Perspective Issue 6 5

Macro economic indicators Improving macroeconomic conditions across the globe have stimulated the capital markets as investor confidence in various asset classes has been reinstated. Strong business dynamics are expected to continue in the near future.
Unemployment (%)
0
5
10
15
2007 2010 2013 2016
U.S. Eurozone UK
Germany China
0
5
10
15
2007 2010 2013 2016
U.S. UK Germany China
EIU macroeconomic environment rating (10=high)
-15
-5
5
15
2007 2010 2013 2016
U.S. Eurozone UK
Germany China
GDP growth (YoY%)
-2
-
2
4
6
8
2007 2010 2013 2016
U.S. Eurozone UK
Germany China
Inflation (%)
-
2
4
6
8
2007 2010 2013 2016
GBPUSD EURUSD USDCNY
Exchange rate (ratio)
0
0.5
1
1.5
2
2.5
3
2 Year 5 Year 10 Year
U.S U.K Eurozone
Swap
-
2
4
6
2007 2009 2011 2013 2015
U.S. Eurozone UK
Germany China
10 year treasury rates (%)
-
2
4
6
8
2007 2009 2011 2013 2015
U.S. Eurozone UK
Germany China
Interest rates (%)
Global Capital Markets Perspective Issue 6 6
Source: Bloomberg LP, August 2014Source: Bloomberg LP, August 2014
Source: Bloomberg LP, August 2014 Source: Danske Bank, yield forecast update
Source: Economic Intelligent Unit (EIU) Source: Bloomberg LP, August 2014
Source: Bloomberg LP, August 2014 Source: Bloomberg LP, August 2014
Exhibit 3: Macro-economic indicators improved across major economies in 1H14.

Investment Grade debt marketsExhibit 4: IG Issuance increased during the year, with companies leveraging the low interest rate environment prevalent globally. (US$B)
Exhibit 5: IG yield spreads have been tapering since 2H13. (bps)
550 537 329 492 464
864 904881
799 957
0
500
1000
1500
1H12 2H12 1H13 2H13 1H14
Loans Bonds
167
504
452
1Q14 2Q14
297
Jul-13 Sep-13 Nov-13 Jan-14 Mar-14 May-140
40
80
120
160
200
Global IG Index Europe IG Bond Index U.S. IG Bond Index
• 1H14 witnessed a 10% increase in IG debt issuance globally (refer to Exhibit 4) over 2H13, with companies taking advantage of the near historic low interest rates, before the anticipated hike in interest rates. The surge seems to have been driven by an improved performance by most of the regional bond markets, resulting in a 20% increase in global IG bond issuance.
• IG debt markets have been facing a demand-supply mismatch, with the demand for IG securities outpacing the supply by a considerable margin.7a
• Yield spreads have been tapering (refer to Exhibit 5) as a result of improving macroeconomic conditions in the U.S. and Europe that are reinstating confidence in investors and reducing risk perceptions.7b
• There was a marked rise in the level of M&A activity in global markets that contributed to increased acquisition-related financing through capital markets.7c The prevailing low interest rates has ensured availability of cheaper debt for IG issuers, thereby enhancing the value of M&A transactions for these companies.7d
• Hybrid bonds witnessed record issuance in 1H14 globally, mainly in the European and Asia Pacific debt markets. This trend was partly due to a shift in investor preference from safety to higher returns. However, these bond spreads widened considerably with the slightest change in interest rates, making the assets riskier than other forms of debt.7e
Source: Bloomberg LP, July 2014
Source: Bloomberg LP, July 2014
Exhibit 6: 1H14 did not witness any record sized deals that were predominant in 2H13.
Top five IG Loan issuances in 1H14—Global
Top five IG Bond issuances in 1H14—Global
Date IssuerAmount (US$B)
Sector Region
6/04/2014 Wal-Mart Stores Inc. 17.3 Retail U.S.
6/27/2014 Medtronic Inc. 16.3 Medical Device U.S.
5/13/2014 Depository Trust Co 15.3 Financial Services U.S.
4/03/2014 Glencore Xstrata PLC 15.3 Mining Europe
2/14/2014 Bouygues SA. 14.4 Conglomerate Europe
Date IssuerAmount (US$B)
Sector Region
4/30/2014 Apple Inc. 12.0 Consumer Electronics U.S.3/11/2014 Petroleo Brasileiro 8.5 Petroleum Brazil2/25/2014 Cisco Systems Inc. 8.0 IT Services U.S.1/15/2014 Petroleos Mexicanos 4.0 Petroleum Mexico1/17/2014 Electricite de France 2.2 Electric Utilities Europe
Source: Bloomberg LP, July 2014
Global Capital Markets Perspective Issue 6 7
IG debt issuance increased globally on account of bonds rallying across geographies. Refinancing existing debt and acquisition-related financing were the reasons for an increased issuance by IG companies.

Investment Grade debt markets (cont.)
• IG issuance in 1H14 witnessed a slight increase of 2.5% over 2H13, with bonds faring better than loans (refer to Exhibit 7). The rise was primarily due to the prevailing low interest rate environment that issuers wanted to take advantage of for raising cheaper debt. This trend is expected to continue in 2H14 for as long as the Fed maintains low interest rates.8a
• The growth in issuance could have been even more pronounced had the supply matched the high demand for these instruments that enabled lead managers to lower the yields accordingly. This trend was exhibited by companies, such as Actavis, that received US$17B worth of orders for its US$3.7B issue in June, enabling the company to raise debt at a rate 25 basis points cheaper than expected.8b
• Option Adjusted Spreads (OAS) for corporate IG bonds shrank to their lowest levels since 2007, with effective yields lower by 32 basis points since the start of 2014. This was primarily on account of flight-to-safety trend due to the Ukraine-Russia crisis and unstable conditions in Iraq.8c
• An underlying trend that emerged in the IG debt market in 1H14 was the preference for long term debt by issuers apparently looking to lock-in low yields over an extended duration. The demand for IG bonds among institutional buyers, such as pension funds and insurance companies, has remained healthy mainly due to their long-term nature and credit worthiness.8d
• Acquisitions and refinancing continued to be the primary drivers for issuance among IG companies in 1H14. In addition to these, some companies were also seen adding cash to their balance sheets for future use, since it has been available at historically low rates for some time now.8e
United StatesExhibit 7: Low interest rate environment in the U.S. ensured a slight increase in IG issuance.
196 173 162 258 255
300 369 363 340 358
$0B
$200B
$400B
$600B
$800B
1H12 2H12 1H13 2H13 1H14
Loans Bonds
85
171
177
182
1Q14 2Q14
Source: Bloomberg LP, July 2014
• IG debt issuance in Europe for 1H14 exhibited a growth of 16% over 2H13, with European IG bonds emulating their American equivalents by outpacing loans (refer to Exhibit 8). The increase can be attributed to European Central Bank’s (ECB’s) measures to reduce the key rates and keep them low over the long term.8f
• About 80% of the IG loans were raised in order to refinance existing debt by companies. Majority of these were revolving credit facilities which are inherently less lucrative than term loans for banks. This resulted in such loans losing favor with banks and consequently the issuance reducing for the period.8g
• IG yields have reduced by 15 basis points since the beginning of 2014, with spreads of peripheral European corporate bonds compressing sharply. Lower yields can be attributed to renewed investor confidence as the region’s economic fundamentals improved.8h
• IG issuers from emerging countries, such as India and South Korea, are looking at European markets to raise cheaper debt, given the low interest rate environment sustained by the ECB in 1H14. This trend is expected to continue in the later part of 2014 as well.8i
Europe
Exhibit 8: European IG market found favor with international issuers for its lucrative debt raising conditions and healthy investor appetite.
286 219 138 230 207
484 432
431 376 498
$0B
$200B
$400B
$600B
$800B
1H12 2H12 1H13 2H13 1H14
Loans Bonds
81
126
277
221
1Q14 2Q14
Source: Bloomberg LP, July 2014
Global Capital Markets Perspective Issue 6 8
Expert Speak — Key Trend and Outlook
• China’s offshore debt market has boomed in the first half of 2014. A total of RMB161.3B offshore bond issued in the first half of 2014 has surpassed the total issuance in 2013. The Asia, ex — Japan, US$ bond market experienced a 22% YoY growth in 2013. Corporate issuers accounted for approximately 78% of the total, IG issues accounted for approximately 58% and China/HK issuers accounted for approximately 56%.
Anthony WongDirector, Infrastructure & Capital Project Advisory (Deloitte-China, Hong Kong)
• The lack of transparency of the bond issuers and possible defaults may deter the confidence of some U.S. and European investors to a certain extent. However, the Chinese government is expected to implement new policies to help improve transparency in its bond market.
• Despite the slowdown in the economy and volatility in the Yuan, the outlook for 2014 is that China’s offshore debt market is expected to continue growing due to the Borrowers’ refinancing needs and rising funding costs onshore.

Investment Grade debt markets (cont.)
In 2H14, IG issuers across the globe are expected to focus on measures taken by central banks to revive their respective economies, depending upon the stage of economic recovery they are in. For instance, the impact of withdrawal of the monetary stimulus by the Fed—expected in October—will be a point of interest. Similarly, monetary easing by virtue of interest rate cuts by the ECB, will be instrumental in determining European IG debt issuance.
• IG issuance in the U.S. is expected to increase, with companies rushing to raise cheaper debt for as long as interest rates are kept low. However, this could be partially offset by the possibility that European companies move back to the domestic market to raise debt, given the more attractive capital raising conditions in effect there.9i
• Euro-denominated issuance is expected to be an emerging trend in the global debt markets, following rate cuts enforced by the ECB in June. However, it is expected that post an initial favorable phase for IG debt issuance, investor preference is bound to shift to higher yield securities.9j
• Asia Pacific IG debt market is expected to do well due to China’s — the principal contributor to the region’s issuance—measures to improve its growth figures that could spark an economic rebound in the country, thus increasing the scope for debt issuance.9k
• IG debt witnessed an 18% increase in 1H14 over 2H13 in Asia Pacific on account of the robust rally by bonds (refer to Exhibit 9). Asian companies have been issuing bonds denominated in foreign currencies and this trend was widely followed in case of Euro denominated issuances in light of the recent rate cuts by the ECB, making it cheaper to raise debt. European investors, especially institutional entities, were looking to diversify and have been opting for higher emerging-market yields from IG Asian issues, given the high returns they generated.9a
• IG lending appears to have been on a decline, with Asian banks struggling to issue long-term loans considering that their clients are issuing bonds to repay these liabilities. This is a diversion from the usual, since banks have traditionally been the cheapest source of capital for companies in the region.9b
• Banks in the region have been issuing more Basel III compliant hybrid securities to maintain their capital ratios above regulatory requirements.9c This is in line with an increased demand for more complex securities among Asian investors.9d
Asia Pacific
OutlookRegional Spotlight—China
• China has dominated the Asia Pacific IG bond market and is expected to continue doing the same in 2H14 following efforts by the Chinese central bank to ease monetary policy and revive the economy. These efforts appear to have ensured a substantial decrease in borrowing costs for Chinese companies, with IG bond yields falling to their lowest levels since 2007. The share of IG bonds in the Chinese bond market has risen from 10% in 2007 to 33% in 2014 due to these regulatory measures.9e
• The Chinese IG bond market saw property developers selling more debt than in any other economy, for the second year in a row.9f This was a result of a real estate market that is becoming more stable. Additionally, a greater number of real estate companies are being upgraded to investment grade, which is expected to ensure a healthy pipeline in 2H14.9g
• The Chinese government aims to attract global issuers by expanding the IG bond sector and implementing new policies to improve transparency in its bond market. These measures are expected to bolster China’s IG bond issuance in the near future.9h
69
145
29 4 2
80
103
87 83 101
$0B
$100B
$200B
$300B
1H12 2H12 1H13 2H13 1H14
Loans Bonds
1 1
51
1Q14 2Q14
50
Exhibit 9: Meagre loan issuance in Asia Pacific offset the rally by the IG bond market in 1H14.
Source: Bloomberg LP, July 2014
Global Capital Markets Perspective Issue 6 9

Leveraged debt markets
• Annual global leveraged debt issuance witnessed a growth of 31% in 1H14 over 2H13
(refer to Exhibit 10), with leveraged loans continuing to outperform HY bond issuance.
This upsurge in leveraged debt issuance was as a result of the demand for yield in the
globally prevalent low interest environment.10a
• The increased issuance of CLOs and covenant-lite loans implied a steady deterioration
in the quality of assets being issued. The development of frothy valuations—asset
prices not in line with their underlying value—and weak debt underwriting standards
have become points of concern for global monetary regulators.10b
• Refinancing and M&A related capital raising continued to be the major reasons for
increased issuance globally (refer to Exhibit 11) primarily due to issuers raising cheaper
debt before the imminent hike in rates. HY bonds were issued to refinance other forms
of debt and also support Leveraged Buy-Outs (LBOs).10c In 1H14, M&As and LBOs
appeared to have contributed to an increased volume of leveraged debt issuance as
compared to the same period last year.
• During 1Q14, leveraged debt issuance was bolstered by shrinking default rates
observed globally (refer to Exhibit 14). This trend was emulated by not just higher rated
debt, but also covenant-lite loans. In the later part of 1H14, the U.S. leveraged debt
market proved to be an exception to this with the default rate more than doubling on
account of the default by Energy Future Holdings.10d
Exhibit 10: Global leveraged debt issuance grew, driven by renewed investor demand for high yield. (US$B)
222 280 405
288 384
173 220
225
195
250
0
200
400
600
800
1H12 2H12 1H13 2H13 1H14
Loans Bonds
190
194
101
149
1Q14 2Q14
Source: Standard & Poor’s Financial Services LLC, July 2014Exhibit 11: Refinancing and M&A-related financing continued to be the key reasons for issuance of leveraged debt.
31 33 24 45 43
62 58 70 50 50
7 9 6 6 7
0%
20%
40%
60%
80%
100%
1H12 2H12 1H13 2H13 1H14
M&A Refinancing/Recapitalization Other
Source: Standard & Poor’s Financial Services LLC, July 2014
Exhibit 12: 1H14 witnessed the largest HY bond issue on record.
Top five Leveraged Loan issuances in 1H14—Global
Date Issuer Amount ($B) Sector Region
6/30/2014 Jacobs Douwe Egberts 10.4 Beverage Manufacturing Europe
6/19/2014 Texas Comp Electric Hold Co. 9.8 Utilities U.S.
1/27/2014 Community Health Systems 8.2 Healthcare U.S.
3/12/2014 Ally Financial 8.0 Financial Services U.S.
1/27/2014 Ziggo BV 5.9 Telecommunication Europe
Date Issuer Amount ($B) Sector Region
4/23/2014 Numericable 7.7 Telecommunication Europe
1/15/2014 Community Health Systems 4.0 Healthcare U.S.
3/03/2014 HCA Inc. 3.5 Healthcare U.S.
10/04/2014 Chesapeake Energy Corp 3.0 Oil and Gas U.S.
4/23/2014 Altice Group 2.9 Telecommunication Europe
Top five HY Bond issuances in 1H14—Global
Source: Standard & Poor’s Financial Services LLC, July 2014
Source: Bloomberg LP, Dealogic July 2014
Global Capital Markets Perspective Issue 6 10
Leveraged debt issuance improved in 1H14 due to globally-prevalent low interest rates and investors’ demand for higher yields. Increased issuance of CLOs and covenant-lite loans was the highlight of the global leveraged debt markets.

Leveraged debt markets (cont.)
• In 1H14, issuance in the leveraged debt market increased by 25% over 2H13 (refer to Exhibit 13). Sub-investment grade issuers took advantage of record low yields to raise debt, thus driving total issuance.11a
• Leveraged loan volume increased by 28% in 1H14 over 2H13, primarily due to record CLO issuance during the period, especially in June. These higher-risk securities were met with robust demand, since CLOs give investors the facility of choosing tranches according to their respective risk appetites.11b Covenant-lite loan volume grew as a percentage of the total number of leveraged loans issued in the U.S. The demand for these lower quality loans appears to have increased as investors look for higher returns in the prevailing low yield environment. Some analysts are wary of these easy lending conditions that are oddly similar to the ones that prevailed before the 2008 financial crisis. 11c
• HY bond issuance witnessed an increase of 19% in 1H14 over 2H13. This surge was primarily driven by renewed investor demand for higher yielding securities. Additionally, HY bonds appear to be less sensitive to interest rate changes as compared to their IG counterparts, making them a preferable investment option in the upcoming period of interest rate uncertainty. The default rates for these bonds dipped further during 1H14, thus increasing their attractiveness.11d
• LBOs amounting to US$52.7B were completed in 1H14, which was a new six-month record since the credit crisis. However, a cause of concern for the regulators is the increased levels of debt used to finance these buyouts. Approximately 40% of LBOs in 1H14 have used debt greater than 6x EBITDA, which is the limit deemed acceptable by regulators. This is the highest share of such LBOs, since the pre-financial crisis high of 52%.11e
• European leveraged debt issuance grew by 65% in 1H14 over 2H13 mainly on account of increased activity in the leveraged loan market. Institutional investors demonstrated strong appetite for leveraged loans in 2Q14, driven by increased repayments on existing loans. Covenant-lite loans and CLOs found favor with issuers, given the strong demand for these high yielding securities.11f
• Leveraged debt issuance was also bolstered by some major M&A transactions that took place in 1H14. Approximately one-third of the leveraged debt raised was for acquisition-related financing, an improvement over 12% in 2013.11g Refinancing continued to be the primary reason for issuance in 1H14.11h
United States
EuropeExhibit 15: Europe witnessed a record year for leveraged debt issuance.
20 17 53
36 61 21 26
52
44
70
$0B
$50B
$100B
$150B
1H12 2H12 1H13 2H13 1H14
Loans Bonds
20
41
26
44
1Q14 2Q14
Exhibit 13: Record CLO issuance bolstered the U.S. leveraged loan issuance in 1H14.
203 263
353 252
322
152
195
173
151
180
$0B
$200B
$400B
$600B
1H12 2H12 1H13 2H13 1H14
Loan Bond
170
75
105
1Q14 2Q14
153
Source: Standard & Poor’s Financial Services LLC, July 2014
Source: Standard & Poor’s Financial Services LLC, July 2014
Exhibit 14: European index delivered higher returns than the U.S. index, though hindered by higher default rates.
-1%
4%
9%
14%
2010 2011 2012 2013 1H14
U.S. LSTA returns Europe LLI Euro returns
0%
5%
10%
Jun-
11
Jun-
12
Jun-
13
Jun-
14
U.S. Default Rate (S&P/LSTA Loan Index)
Europe Default Rate (S&P European Loan Index)
Source: Standard & Poor’s Financial Services LLC, July 2014
Source: Standard & Poor’s Financial Services LLC, July 2014
Global Capital Markets Perspective Issue 6 11

• European HY bond market witnessed a 60% increase in issuance in 1H14 over 2H13 (refer to Exhibit 15), mainly driven by an increasingly liquid investor base. Companies in the region preferred bonds over bank lending due to lighter covenants and longer-dated funding options in the bond market.12a The depth of these markets became evident when Numericable—the French telecommunications company—raised US$10.9B in the biggest HY bond issue on record.12b
• The bond market rally was also driven by the surge in issuance in peripheral Europe due to all-time low yields in countries such as Spain and Italy.12c These found favor with investors who wanted higher yields but were averse to foreign currency risk.12d
• After the credit crisis, many European IG companies were downgraded and these “fallen angels” have continued to prefer the bond markets to raise capital, providing a more diversified supply of issuance during the current rally in the HY bond market.12e
• A trend that emerged in 1H14 was the growing proportion of first-time issuers with US$27B worth of such bonds coming to the market during the period. Continued high investor demand for riskier assets providing higher yields is the primary contributor to this trend.12f
Leveraged debt markets (cont.)Exhibit 16: Debt multiples increased in 2H13 for both the U.S. and Europe.
U.S. Europe
Europe (cont.)
Asia Pacific
• Asia Pacific leveraged debt markets witnessed stronger issuance driven by robust investor demand for higher yields. Out of the US$18B worth of HY bonds issued in Asia, approximately 60% have been by Chinese companies. The primary contributor to the Chinese bond rally has been the revival of the real estate market, that accounted for 46% of the total Asia HY bond volume.12g
• Asia’s HY bonds are now coming with lighter covenants, especially the ones being issued by Chinese companies. Yield seeking investors are willing to take on greater risks for higher returns. However, Asian HY bonds still have more restrictive covenants than the ones issued in the U.S. and Europe.12h
• A trend that surfaced in 1H14 in the Asian leveraged debt market was the inclusion of mezzanine financing for LBOs. Analysts are of the opinion that this is a welcome trend for Asian markets that lack the robust institutional investor base of the U.S. or Europe. This was predominantly seen in South Korea which boasts of strong credit ratings and a bigger institutional investor base than other Asian economies.12i
• 1H14 saw China’s corporate debt and leverage ratios rise, with analysts concentrating on the shadow banking sector that currently accounts for 30% of the total corporate debt of the country. These borrowings are not guaranteed by the state and meet low standards of risk, with low or no transparency.12j
Exhibit 18: CLO markets saw the highest issuances since 2007
1H14 witnessed post-credit crisis high levels of CLO issuance, with the year already looking to overtake 2013 for the instrument. In addition to offering better returns than HY bonds and leveraged loans, investors are favoring CLOs for the improved quality of the underlying assets.12k Investor preference for these securities was demonstrated when a major PE player issued a US$1.5B CLO in June that happened to be the biggest issue of its kind since the financial crisis.12l CLO issuance is expected to increase given that the Fed has extended the Volcker rule compliance deadline by two years. Under this regulation, there are restrictions on banks investing in CLOs.12m
54 82
61
0
10 9
$0B
$30B
$60B
$90B
$120B
2012 2013 1H14
U.S. Europe
Exhibit 17: Weighted Average New-Issue Institutional Spreads tightened globally.
0x 1x 2x 3x 4x 5x
2010 2011 2012 2013 1H14 0x 1x 2x 3x 4x 5x
2010 2011 2012 2013 1H14
L/E+0
L/E+500
L/E+1000
2Q10
4Q10
2Q11
4Q11
2Q12
4Q12
2Q13
4Q13
2Q14
Europe (Euribor +) U.S. (LIBOR+)
Source: Standard & Poor’s Financial Services LLC, July 2014
Source: Standard & Poor’s Financial Services LLC, July 2014
Source: Standard & Poor’s Financial Services LLC, July 2014
Global Capital Markets Perspective Issue 6 12
Total Debt/EBITDA EBITDA/cash interest

Leveraged debt markets (cont.)
Outlook
The course of the global leveraged markets will primarily depend upon how monetary policies are framed to alter interest rates. If the yields are hiked, investors will have other avenues besides leveraged debt for higher returns without incurring as much risk. Moreover, it is expected that regulators will monitor the asset quality of leveraged debt issues closely in order to avoid a repeat of the financial crisis, thus impacting global issuance.
• In the U.S., the timing of the Fed’s decision to increase rates will be key in determining how the leveraged debt markets will fare in the region for 2H14.
• The European leveraged debt markets are expected to perform better, given the recent rate cuts by the ECB that could make investors favor riskier assets for higher returns. The effects of the additional liquidity infused due to the Targeted Longer Term Refinancing Operation (TLTRO), introduced by the ECB in June, will be of essence in determining how the European debt markets fare in 2H14.13d
• In Asia, China is expected to dominate the Asian leveraged debt market in 2H14. Some analysts are of the opinion that HY bonds issued by the Chinese property firms offer high risk adjusted returns and if the global low yield environment were to continue, these securities will be preferred by investors. However, this will depend largely on whether the Chinese real estate market continues its good run or whether the growth flattens in 2H14.13e
• Italian HY bond issuance—excluding financial institutions—increased by 32% in 1H14 as compared to the same period last year, thus becoming one of the primary contributors to the growth of the European market. The sharp increase was due to strong demand for yield in addition to improving market sentiment and macroeconomic indicators in the region.13a
• High value HY bond issues by companies were the highlight of the period. These issuers seem to have taken advantage of tightening credit spreads to raise cheaper capital to primarily to refinance their existing costlier debt. The decline in spreads has led to weaker asset quality, with higher leverage and loose covenants, coming to the market.13b
• Smaller and unlisted companies in Italy have the option of raising capital by issuing ‘minibonds’, securities that combine features of bank lending and public bonds. These securities are being incentivized by elimination of the withholding tax on them.13c
Regional Spotlight—ItalyExpert Speak—Key Trend and Outlook
As a result, the market is continuing to experience skinny spreads and relatively loose covenants. This dynamic can be seen across all segments of the leveraged debt market and across all geographies, although the popularity of the CLO market in North America has fueled even greater interest in leveraged loan activity in that region.
These market fundamentals, that were in place in 2013 and have continued into the first half of 2014, look set to stay the course into the foreseeable future. However, there are already signs of subtle shifts in the market. There has been an uptick in M&A activity and at least the beginning of signs of increased capital expenditure. This has already started to manifest in the debt markets as proceeds from financings are being used less for straight refinancings and more for new-money transactions. If the overall market continues to improve, this increased demand for new issuance will begin to address the imbalance and start to bring back spreads and covenants more in line with historical norms. Likewise, as the global economic recovery gathers steam, there will be increased upward pressure on interest rates, creating an end to the current perfect storm of investors’ search for yield during a time when issuers costs are historically low.
Andrew LuetchfordPartner, Financial Advisory (Deloitte-Canada, Toronto)
Global Capital Markets Perspective Issue 6 13
The excess of supply over demand for issuance continues to impact the leveraged debt markets. With institutional investors constantly seeking yield, competition to fund the relatively few deals in the marketplace remains intense.

Equity markets
• Signs of economic recovery and renewed confidence in equity markets apper to have kept IPO activity buoyant during 1H14. PE & VC-backed IPOs rose to the highest levels ever. With the IPO markets wide open, Limited Partners (LPs) seemed to have preferred monetizing their assets rather than refinancing their risk. However, amid this surge in IPO activity, investors remained cautious regarding valuations and were highly selective about their investments.14a
• Global IPO aftermarket performance remained consistent during 1H14 (refer to Exhibit 22) and were driven by the U.S and Asia Pacific ensuring a steady pipeline. However, the global market staggered a little in the months of March and April due to the sudden increase in the sale of highly valued stocks.14b
• The financial services sector led global IPO issuance, accounting for 25% of the total volume. With the boost given by the JOBS Act, healthcare companies in the U.S.—notably biotech and pharmaceuticals—dominated deal activity.14c However, in Europe, a more traditional sector, Retail, accounted for a large share of IPOs.14d
• With strong economic fundamentals, the U.S. exchanges remained the most active in 1H14. Chinese internet and e-commerce companies, which listed on the U.S. stock market, posted the best returns as there was a huge demand for them.14e However, with the volatility index at an all time low and equity markets nearing record highs, global IPO markets exhibited similar characteristics to pre-financial crisis levels.14f
• Asia Pacific saw most of its markets surge in terms of funds raised, except China missed market expectations. The Chinese mainland appears to have been stifled by reforms in its IPO regime, resulting in lesser IPO activity on the Shenzhen and Shanghai Stock Exchange. Hong Kong raised HK$81.3B from 48 IPOs reporting the highest number of IPOs over the same periods in the last decade.14g
Exhibit 20: Financial services sector led IPO volume globally.
Exhibit 19: Global IPO markets see highest proceeds in 1H14, with 2Q14 outperforming 1Q14.
70 70 89 103
123
584 545
469
636 655
1H12 2H12 1H13 2H13 1H14
Aggregate Capital raised (US$ B) No of Funds
49 74
273
382
1Q14 2Q14
Financial
Consumer Ncycl
Industrial
Communications
Energy
Consumer Cycl
Utilities
Technology
Basic Materials
Diversified
25%
20%
13%
11%
10%
7%
4%
4% 3%
2%
Source: Bloomberg LP, July 2014
Exhibit 22: FTSE Renaissance Global IPO Index (US$)
0
50
100
150
200
Jul-1
3
Sep-
13
Nov
-13
Jan-
14
Mar
-14
May
-14
Source: Bloomberg LP, July 2014
Source: Bloomberg LP, July 2014
Exhibit 21: Volatility Index (US$)
0 5
10 15 20 25
Jan-
13
Mar
-13
May
-13
Jul-1
3
Sep-
13
Nov
-13
Jan-
14
Mar
-14
May
-14
Source: Chicago Board Options Exchange (CBOE)
Source: Bloomberg LP, July 2014
1H14
655 deals US$123B Capital raised
2H13
638 deals US$104B Capital raised
Global Capital Markets Perspective Issue 6 14
Global IPO proceeds in 1H14 increased by 18% over 2H13, and were driven primarily by financial sponsors. Better economic fundamentals and revived investor confidence enhanced activity.

• The U.S. equity market witnessed an 4% increase in IPO activity in 1H14 over 2H13 (refer to Exhibit 23) due to a decline in volatility and interest rates, leading to a muted renewal in investor optimism. Activity benefited from the JOBS Act—enforced in 2012—incentivizing listing for smaller companies, with more than 85% of them leveraging the Act in 1H14. In addition, IPO activity was driven by financial sponsors, who found a conducive environment to exit their investments15a.
• Despite the heightened activity, total issuance decreased in the absence of mega deals. Valuation pressures forced companies to reduce their listing prices, thereby leading to a reduction in proceeds15b.
• IPOs of healthcare and technology companies, grew in 1H14. 2Q14 saw other sectors, such as energy, financial and consumer business emulating the same trend. However, aftermarket performance was weak with shares of bigger players, plunging downwards following their listing on the stock exchanges15c.
• The U.S. stock exchanges, continued being the most sought after with NASDAQ and NYSE accounting for approximately 28% of global IPO activity (refer to Exhibit 24). Cross border listing on these exchanges gained momentum from countries such as China, UK, Canada, and Israel15d.
United States
• In 1H14, the European equity market exhibited a 50% increase in proceeds over 2H13 (refer to Exhibit 23), as volatility remained relatively low amid improving macroeconomic fundamentals15e. 2Q14 recorded the highest level of proceeds in Europe since 2007, raising US$34.9B primarily due to an increase in PE backed IPOs. Additionally, there was a robust risk appetite of investors who continue to have a positive outlook toward the market despite the prevailing geopolitical tensions.15f
• IPO activity in the retail sector surged in 1H14, with 11 listings contributing US$3.6B to total issuance. This was partly driven by recovering consumer confidence as well as the growth of e-commerce and changing shopping habits15g.
• The London Stock Exchange (LSE) continued to dominate IPO issuance in Europe, raising 10 times as much as during 1H13. A combination of improved sentiment in the equity markets and a fading Eurozone crisis reinvigorated several historically less active exchanges, such as the Spanish Exchange, Bolsa de Madrid (US$2.0B) and the Italian exchange, Borsa Italiana (US$2.6 B) (refer to Exhibit 24)15h.
• Even though deal activity returned to Europe in 1H14, it appears investor fatigue crept in toward the end of June, as investors became more selective about where to place their money. Some companies, struggled to find investor demand and had to either postpone or withdraw their listings15i.
Europe
Exhibit 23: In light of the recovering economy and improving investor confidence, Europe dominated the issuance in 1H14.
36 36 27 12
25
52 25
34 37
108 125
130
71
105
157
192
321 303
1H13 2H13 1H14 1H13 2H13 1H14 1H13 2H13 1H14 Proceeds (US$B) No. of funds
U.S. Europe Asia Pacific
Source: Bloomberg LP, July 2014
Exhibit 24: NYSE & NASDAQ represented 28% of global IPO capital raised.
Others
NYSE
LSE Main
Hong Kong Exchange
NASDAQ
Australian Exchange
Euronext/Amsterdam
Bolsa de Madrid
Euronext/Paris
Borsa Italiana
Toronto Stock Exchange
22%
19%
15%
10%
9%
4%
4%
3%
3%
3%
2%
Source: Renaissance Capital, Greenwich, CT (www.renaissancecapital.com)Note: Global statistics include IPOs with a deal size of at least US$100M and exclude closed-end funds and special purpose acquisition companies (SPACs).
Exhibit 25: Stock markets across the globe failed to generate the anticipated returns during 1H14.
-20%
-10%
0%
10%
Jan-1
4
Feb-
14
Mar-
14
Apr-1
4
May
-14
Jun-
14
FTSE 100 Index (^FTSE) — Index Value S&P 500 Index (^SPX) — Index Value MSCI Europe (MXEU) — Index Value TOPIX 100 Index (^TOPIX100) — Index Value Hang Seng Index (^HSI) — Index Value
Source: S&P Capital IQ
Global Capital Markets Perspective Issue 6 15
Equity markets (cont.)

Outlook
The global IPO market is expected to continue growing at an active pace in 2H14 as positive returns combined with low volatility have ensured a robust pipeline. Notable companies expected to list in 2H14 include China’s largest e-commerce firm Alibaba Group, British mobile network Everything Everywhere, and Chinese commercial lender Bank of Beijing. In spite of improved investor confidence, there is demand for deals that are not only effectively priced but also offer a good growth story.
• In U.S., PE activity is expected to continue as investors appear eager to take advantage of the ideal conditions. While biotech companies dominated most of the IPO activity, sector issuance is expected to broaden in 2H14. However, as the Fed is in the midst of tapering its quantitative easing policy, market sentiment is expected to change.16k
• Given the large number of IPOs listed in Europe, investor caution has increased, which seems to have resulted in rigorous testing of deals for their growth potential as well as their valuation. This may pull back IPO activity in the region as it may be tough to attract investor demand.16l
• IPO activity is expected to increase in Asia Pacific on account of the re-opening of Chinese A-share and the CSRC granting faster approvals to companies listing on the exchanges.16m With the new sponsor regulation regime introduced in Hong Kong, IPO activity is set to increase in the region as well.16n
• With Spain coming out of recession last year, investor appetite for investment in the country has grown in 1H14. The country has emerged as a hub for real estate investments. In 2013, Spain reduced the tax burden for REITs in an attempt to boost investment as home and commercial real estate prices fell sharply. Low interest rates, set by the ECB, helped fuel Spain’s housing boom.16h
• In 1H14, Merlin Proprties Socimi, a Spanish REIT made its debut on the Spanish Stock exchange raising €1.25B.This was the largest IPO in Spain since the Spanish lender Bankia raised about €3B in 2011. The firm is well placed to take advantage of long-term potential across many areas of the Spanish property market.16i
• Additionally, large private equity firms have been purchasing blocks of homes in Madrid, to rent ahead of their anticipated price increase due to rise in demand.
• Although Spain appears to be in its nascent stage of economic recovery, real estate investors have been flocking the country. Midsize investment banks in Spain and global banks in London are bustling with investors looking for different ways to play in Spain’s real estate market. However, there are fears that prices may escalate as the competition for certain assets becomes stiffer.16j
Regional Spotlight—Spain
• Asia Pacific recorded the highest number of IPOs compared to any other region in
1H14 (refer to Exhibit 23). However, there was a 5% decrease in deal activity from
2H13. Strong investor confidence across Japan, Hong Kong, and Australia partially
offset the volatile markets, and the effects of slow economic growth and an uneven
regulatory climate in China.
• Regulatory issues continued to dominate the Chinese market with IPO activity
suspended for almost two months in 1H14. The CSRC opened the mainland exchanges
in January, allowing 48 companies to be listed in the first two months.16a However,
IPOs were put on hold in March when authorities stopped granting approvals because
of loopholes in the listing rules. During this period, Chinese companies looked to list
overseas, such as e-commerce company JD.com, which raised US$1.7B on NASDAQ.
The markets re-opened in June with the CSRC providing approvals to ten companies
seeking to list on the mainland exchanges.16b
• Hong Kong’s share market had a strong start to 1H14 with the listing of HK Electric,
raising US$3.1B.16c However, it appears the market could not sustain the momentum,
with companies such as Alibaba opting to list on other stock exchanges and a major
pork producer withdrawing its listing due to the lack of investor demand. Conditions
improved in 2Q14, with new firms beginning to list at lower valuations.16d
• Australia and New Zealand witnessed a surge in new listings, helped in part by the sale
of government assets in 1H14.16e In contrast, IPOs in Singapore had a slow start due
to increased competition from other stock exchanges in Asia Pacific, however the IPO
of PACC Offshore Services Holdings in April 2014, that raised US$376M, was able to
provide temporary relief.16f 16g
Asia Pacific
Global Capital Markets Perspective Issue 6 16
Equity markets (cont.)

91 89 155 116 129 28 19 32 14 24
178 208 155 220 213
374 365 356 400 357
1H12 2H12 1H13 2H13 1H14
Trade Sale Sale to GP Restructuring IPO
49 80 13 11
101 112
168 189
1Q14 2Q14
183 204 237 275 231
522 592 514 583 407
1H12 2H12 1H13 2H13 1H14
Aggregate Capital Raised (US$B) No. of Funds
220 187
104 127
1Q14 2Q14
104 127
Private EquityExhibit 26: A challenging deal making environment led to a decline in fundraising in 1H14.
• Global PE funds raised a total of US$236B in 1H14, witnessing a 16% decrease over 2H13. Heightened competition and increased regulatory compliance led to a tougher deal making environment, thereby scaling back the number of funds closed. Also, the period saw fewer mega funds as compared to 2H13, that resulted in a decline in fundraising. Led by mid-market, the U.S. remained the hub for PE activity and surpassed all other regions in fundraising.
• With dry powder at an all-time high of US$1.2T and intense competition for quality platforms, PE firms have shifted their investment focus toward the middle market where growth opportunities remain vast and valuations lie within an acceptable range.17a
• Stronger IPO markets and an increase in M&A activity appear to have provided opportunities for PE firms to make exits and return capital to investors, thereby restoring confidence toward the asset class.
• Cross-border transactions in Asia Pacific have been increasing as investment opportunities appear to be growing in various emerging economies in the region.
• Given Europe’s large share of buyout activity, it continues to attract significant foreign investment. LPs are actively seeking co-investment rights when making commitments to PE funds in the region.17b
• Increase in regulatory scrutiny over PE funds has emerged as the biggest challenge faced by LPs. With the Securities Exchange Commission (SEC) in the U.S. closely monitoring the amount of fees and expenses PE firms charge and the enactment of Alternative Investment Fund Managers Directive (AIFMD) in the EU, the compliance costs of PE firms has increased.17c
Exhibit 27: Amid growing equity and debt markets, global PE-backed IPO exits increased in 1H14 over 2H13. (US$B)
Exhibit 28: Majority of capital raised in 1H14 was through buyout deals.99
70 70
26 15
26 9 11 8 8
19 20
87
39
13 11 8 17
5 5 13 6
0
20
40
60
80
100
120
Vent
ure
Cap
ital
Buyo
ut
Real
Est
ate
Gro
wth
Dis
tres
sed
Priv
ate
Equi
ty
Fund
of F
unds
Infr
astr
uctu
re
Mez
zani
ne
Nat
ural
Res
ourc
es
Seco
ndar
ies
Oth
er
No. of Funds Closed
Aggregate Capital Raised (US$B)
Private Equity Dry Powder (US$T)
Average Time taken for Funds to Achieve in a
Final Close by (in months)
Private equity Funds in market (US$B)
2H13 1.11H14 1.2
2H13 181H14 16
2H13 5831H14 417
Source: Preqin, July 2014
Source: Preqin, July 2014
Source: Preqin, July 2014
Source: Preqin, July 2014
Global Capital Markets Perspective Issue 6 17
1H14 saw a decline in the aggregate capital raised globally as lack of quality targets and high valuation continued to hinder deal activity. Growing regulatory compliance and due diligence requirements led to a delay in closing funds.

Private Equity (cont.)United States
• Strong macro-economic factors and favorable investor optimism toward the U.S. appear to make it the most active region for PE activity. However, LPs’ preference for quick returns has resulted in a challenging deal making environment for General Partners (GPs) due to intense competition for investment opportunities.18a
• U.S. saw its fundraising decline by 18% in 1H14 over 2H13 (refer to Exhibit 29), as unlike the previous period, only a handful of mega-funds (greater than US$5B) closed during 1H14. Most of the deal activity was concentrated around its middle market (US$100M to US$1B), that requires lesser commitment toward funds.18b
• With large quality targets attracting competition leading to seemingly exorbitant valuations, GPs shifted their attention toward smaller investments, particularly add-ons. These investments accounted for a majority of the buyouts as they are relatively cheaper and easier to pursue.18c
• GPs faced a tougher landscape for the first time as LPs preferred allocating capital to more experienced fund managers. Also, transaction time increased as investors’ consideration for due diligence increased.18d
• There appears to have been a decline in market share of the U.S. public pension funds toward global PE commitments. The proportion of aggregate capital held by Sovereign Wealth funds has doubled to 10% in 1H14 from 2009. These fund managers are giving priority to creating an uncorrelated pool of investors, thus making the fund resilient toward national or regional crisis.18e
Europe
• PE fundraising in Europe saw an increase of 22% in 1H14 over 2H13, mainly due to the return of investor confidence in the region (refer to Exhibit 29) . A stronger IPO market and availability of cheaper debt contributed to an increase in investment opportunities. Several PE transactions took place even in peripheral regions such as Italy and Spain, that were comparatively less active in 2H13.18f
• Funds focusing specifically on buyouts declined with only two funds raising more than US$1B in 1H14. This downward trend was partially offset by an increase in fundraising by growth equity, restructuring, and debt funds.18g
• Although fundraising was high in 1H14, overall investment by PE firms appears to have been moderate in the region. European buyouts maintained a consistent share of overall deal activity in 1H14 with bolt-on acquisitions accounting for almost half of the buyout deals.18h Also, European mid-market businesses continued to draw attention from the U.S. PE players, as they face a saturated market at home.18i
• Secondary and trade sales continued to be popular sources of exit. However, there was a sharp rise in exits via the IPO route as the opening up of the European equity market prompted PE firms to sell their shares.18j
Exhibit 29: PE fundraising was dominated by the U.S. owing to a favorable investor climate. (US$B)
Exhibit 31: Top five funds to hold a Final Close in 2H13
Fund Firm TypeFinal size (US$B)
Firm country
Fund focus
Ardian Secondary Fund VI
Ardian Secondaries 9 France Global
Bain Capital Fund XI Bain Capital Buyout 7.3 U.S. GlobalClayton Dubilier & Rice IX
Clayton Dubilier & Rice Buyout 6.4 U.S. Europe
Permira V Permira Buyout 5.5 UK GlobalOnex Partners IV Onex Corporation Buyout 5.1 Canada North
America
Exhibit 30: Aggregate value of PE-backed buyout deals was highest in North America. (US$B)
61 95 106
72 88
32
40 45
35 41 11
16 8
17 21
7
4 6
5 7
IH12 2H12 1H13 2H13 1H14 North America Europe Asia Rest of World
Source: Preqin, July 2014
Source: Preqin, July 2014
Source: Preqin, July 2014
147 159
130
61 55 67
19 18 27
1H13 2H13 1H14 1H13 2H13 1H14 1H13 2H13 1H14
U.S. Europe Asia Pacific
Global Capital Markets Perspective Issue 6 18

Expert Speak—Key Trend and Outlook
• “Where to play” — As funds control more capital, they will notice they lack attractive deals which will ultimately force them into diversification. This will encompass new strategies for talent, deal types, sectors and ultimately geographies.
Mehmet SamiPartner, M&A and Debt Advisory, (Deloitte-Turkey, Istanbul)
• This strategic shift will result in emergence of new challenges and will make sustainable results harder to achieve. To highlight a few, funds need to pay more attention to shifting sands like “macro challenges” (macroeconomic and regulatory changes), in addition to understanding business microeconomics. Also, cross-border deals will become the norm when exiting. Funds therefore, need to rely on advisors with network powers and local talent to assist in investments and exits.
• All in all, “where PE funds play” will require new strategies. Those expanding geographies and utilizing deeper pools of local talent to discover and control diverse investment opportunities will earn respect.
Private Equity (cont.)Asia Pacific
Outlook
With an apparent increased appetite for investments, PE activity is expected to maintain a good pace in 2H14. However, with record amount of dry powder, GPs may have to pay higher prices for quality assets as competition for them is expected to remain intense. Robust IPO markets and recovery in corporate M&A activities strengthened exit channels, thereby increasing liquidity in the market. LPs are committed to increasing their allocations toward the asset class and are tapping growth opportunities beyond their domestic boundaries in order to diversify their portfolios.
• Fundraising in the U.S. is expected to grow as investors demand more PE exposure, although the average fund size will continue to drop as LPs pursue smaller and less competitive deals. Secondary buyouts continue being an active channel used by GPs for deal activity as such transactions are relatively easier to complete as compared to the acquisition of publically traded companies.19e
• The outlook for the European PE market appears to be promising as large players continue to invest in the region owing to its economic recovery. Small and mid-market European buyout funds are expected to attract more interest as competition and valuations for large targets remain high.19f
• With growing investment opportunities, new capital is set to flow into the Asia Pacific region. However, investors are being highly selective and are streamlining their allocations to PE players with a strong distribution history.19g
• In 1H14, PE activity witnessed an uptick in Asia Pacific as it steadily evolved into a maturing market. With an increase in deal value and improvement in exit activity, LPs appeared willing to increase their commitments toward PE firms. However, heightened competition for quality targets and steep valuations made them selective about investments as they sought safety of their funds along with good distributions.19a
• With record amount of unspent capital in the region, GPs are focusing on highly structured minority investments and buyouts in profitable companies that generate suitable returns for investors.19b
• The re-opening of the mainland China stock exchanges was a positive development as the region saw several exits via IPOs. PE backed M&A activity also gained momentum.19c This favorable exit environment enabled return of capital to investors who had money piled up in PE funds.19d
• The growing investment opportunities in emerging economies of Asia have resulted in a lot of cross border investments. With an increase in potential exit options, PE firms seem to be becoming more confident about their investments in the region.
Global Capital Markets Perspective Issue 6 19

Outlook
Some of the asset classes are expected to exhibit uneven performances, with high yielding securities poised to outperform low yielding safer ones. The imminent rate hikes expected toward the end of 2H14 or early 2015 could affect issuance as companies rush to raise cheaper capital while they can. Issuers are expected to favor fixed income securities to raise capital only till interest rates remain low. Improving macroeconomic fundamentals, especially in Europe, are expected to bolster total issuance across instruments. Heightened M&A activity has also been witnessed in most economies, thus virtually ensuring promising capital market activity in 2H14. Asset valuations may attract regulatory scrutiny, since questions have been raised with regard to the intrinsic value of securities of late.20a
In the short term, it will be important to observe the impact of the following on capital markets:
• Fed’s winding down of the monetary stimulus in October20b
• Recent violence in Iraq and the subsequent effect on the supply of crude oil20c
• The ongoing Palestine-Israel crisis20d
• Russia-Ukraine political standoff20e
Recognizing the most suitable instruments and geographies to ensure continued access to adequate low cost funding is crucial. Exhibit 32 provides possible options—financial instruments and geographies—for companies to consider when raising capital based on expected growth rates and the short-term outlook.
Growth 2H13 to 1H14 Forecast 2H14
Financial InstrumentUnited States
Europe Asia PacificUnited States
Europe Asia Pacific
IG bonds
HY bonds
IG loans
Leveraged loans
Equity
Private equity
Note: Definition of Emerging Markets/Asia Pacific differs across instruments; CLO, Private Placement and Sukuk are not included;
Sources: Preqin, Standard & Poor’s Financial Services LLC, Leverage Commentary & Data, Bloomberg
Exhibit 32: Potential instruments and geographies in which to raise capital in the short-term
Market Range Symbol
High-growth market
30% and higher
Low- to moderate-growth market
5% to 30%
Neutral -5% to 5%
Declining market Below -5%
Insignificant market
–
Legend
Global Capital Markets Perspective Issue 6 20

Deloitte Debt and Capital AdvisoryGlobal debt financing expertise
Global Capital Markets Perspective Issue 6 21
Autogrill/WDFSpin-off and Refinancing
€1.25bn
Italy
GEMS EducationRefinancing
US$545m
UAE
Garda World SecurityRefinance & HY bond issue
C$700m
Canada
ENVIEM/GulfRefinancing
€200m
Netherlands
ShanksRefinancing & bond issue
€280m
UK
Tanga CementGrowth debt capital
$161m
S.Africa/Tanzania
KNV GroupDevelopment financing
€200m
Germany
Virutex IlkoHY private placement
US$25m
Chile
TTPCBond refinancing
MYR1.375bn
China
Cathay/Emirates Aircraft backed lease
$25m
S.Korea
Hatco Stetson ResistolRefinancing
$NDm
US
PT BUMALT debt rescheduling
US$800m
Singapore
Cone ArtuDevelopment financing
R$270m
Brazil
FargaDebt advisory restructuring
€87m
Spain
Manx TelecomUnitranche finance
£127m
UK
Australian Rail TrackDebt raising CAPEX facility
A$500m
Australia
Deloitte Debt Advisory has advised on over US$100.0B of debt financing over the last 5 years

Deloitte Debt and Capital Advisory (cont.)One of the most successful Debt and Capital Advisory teams
Global Capital Markets Perspective Issue 6 22
• The Deloitte Debt Advisory group is an network of 130 debt advisory professionals in over 25 countries
• We provide independent advice and world-class execution resource to a wide range of public, private and institutional borrowers across the full spectrum of debt markets
• Our expertise ranges from the provision of strategic advice on the optimum capital structure and available sources of finance through to the provision of highly experienced execution resources
• Where appropriate, the Debt Advisory group will involve other service lines within Deloitte including Corporate Finance Advisory, Tax, Transaction Services, Restructuring Services, Forensic and Dispute Services and Consulting
Global senior team
Australia Brazil Chile China Czech Rep. Denmark France
Katherine Howard +61 293 223 428 [email protected]
Carlos Rebelatto +5 5813 464 8125 [email protected]
Jaime Retamal +5 622 729 8784 [email protected]
Patrick Fung +852 22387400 [email protected]
Lukas Brych+42 024 604 [email protected]
Lars Munk+4 536 103 [email protected]
Olivier Magnin+33 1 4088 2885 [email protected]
Germany Hungary India Ireland Italy Mexico Netherlands
Christian Ukens+49 (69) 75695 6323 [email protected]
Bela Seres+36 428 [email protected]
Gordon Smith+ 9 122 618 [email protected]
Michael Flynn+353 1 417 2515 [email protected]
Mario Casartelli+39 02833 [email protected]
Jorge Schaar+5 255 5080 [email protected]
Alexander Olgers+31 88 288 631 [email protected]
Norway Portugal Singapore South Africa South Korea Spain Sweden
Andreas Enger+4 723 279 [email protected]
Jose Gabriel Chimeno+35 121 042 [email protected]
Robert [email protected]
Fredre Meiring+27 1 1209 [email protected]
Kenneth Kang+82 2 6676 [email protected]
Jordi Llido+ 34 93.280.41.61 [email protected]
Johan Gileus+46 752 462 231 [email protected]
Switzerland Turkey UAE UK USA
Benjamin Lechuga+41 582 798 [email protected]
Mehmet Sami+90 212 366 60 49 [email protected]
Hamid Khan+9 714 506 [email protected]
Fenton Burgin+44 (0) 20 7303 [email protected]
John Deering+1 704 333 [email protected]
Co-heads
UK
James Douglas +44 20 7007 4380 [email protected]
Canada
Robert Olsen +1 416 601 5900 [email protected]

Acknowledgement
Global Capital Markets Perspective Issue 6 23
This report is a joint effort of the Debt & Capital Advisory practices of the Deloitte member firms. This edition relies on client experience and marketplace insight of Nedim X Music, Ashley Horn, Andrew Luetchford, Mehmet Sami, and Anthony Wong. Amol Shet, Satyajit Saha, Purti Trehan, Aditi Kaul, Ankita Batish, and Nikita Nijhawan were instrumental in the research, analysis, designing, and writing of this report. The leaders of the Debt & Capital Advisory practices of the member firms and their affiliates wish to thank all who have contributed to the development of Global Capital Markets Perspective, Issue 6.

End notes5a WSJ—Stock Investors Position for China's Overhauls—January 1, 20145b Forbes—Fed Cuts Monthly Asset Purchases To $55 Billion Maintaining Taper Pace, Market Awaits Yellen Remarks—March 19, 20145c Market Watch—Fed plans to end taper in October: minutes—July 9, 20145d Reuters—Greece returns to bond markets, says end of bailout nears—April 10, 20145e Bloomberg—Greek Bond Sale Tops $4 Billion in Return to Markets—April 10, 20145f China Daily—Shanghai-HK stock exchanges link soon—April 11, 20145g China Daily—Shanghai, HK unveil cross-border trading plan for stocks—April 11, 20145h RT Question More—Portugal leaves bailout program with 214bn euro debt, 4% lower GDP—May 17, 20145i Forbes—China's Market Finally Looks Like A Buy—July 25, 20145j European Central Bank—Press Release—June 5, 20145k Reuters—Ukraine signs trade agreement with EU, draws Russian threat—June 27, 20147a Income Intelligence.co.uk—Singing in the Rain: Investment grade corporate bonds have hit all the right notes—June 19, 20147b Market Realist—Why yields on investment-grade corporate bonds continued to fall—June 17, 2014 7c Income Intelligence.co.uk—Singing in the Rain: Investment grade corporate bonds have hit all the right notes—June 19, 20147d J P Morgan—2014 M&A Horoscope—May 21, 20147e WSJ—Hybrid Bonds: A Trap for Yield Hunters—June 20, 20148a WSJ—Renewed Embrace of Bonds Sparks Boom—March 7, 20148b Business Recorder—Busy high-grade week ends with signs of fatigue—June 14, 20148c Market Realist—Investment-grade issuers want intermediates and perpetual bonds—June 24, 20148d Market Realist—Investment-grade issuers want intermediates and perpetual bonds—June 24, 20148e Institutional Investor—U.S. corporate bond issuance offers easy financing—June 20, 20148f Lazard Net—Outlook on European Fixed Income—July 7, 20148g Bloomberg—M&A Boom Eludes Loan Desks as European Deals Favor Stock—July 3, 20148h Pramerica—3rd Quarter Outlook—July 10, 20148i Bloomberg—Euro Lures Asia After Record Dollar Debt Splurge: Credit Markets—May 26, 20149a Bloomberg—Euro Lures Asia After Record Dollar Debt Splurge: Credit Markets—May 26, 20149b Financial Times—Asian bond surge hits bank loan books—June 8, 20149c IFR Asia—Banking Asia’s Blue-Chips—Raising the bar—May 24, 20149d Asia News Net—More hybrid securities seen in Asia-Pacific on stricter capital rules—July 20, 20149e Bloomberg—PBOC Cuts Corporate Yield Spread Most Since Crisis: China Credit—May 26, 20149f WSJ—China Leads Global Property Bond Sales—February 13, 20149g South China Morning Post—China developers return to bond market—May 30, 20149h S&P Dow Jones Indices—The Rise of China’s Corporate Bond Market—June 20149i WSJ—Renewed Embrace of Bonds Sparks Boom—March 7, 20149j Bloomberg—Euro Lures Asia After Record Dollar Debt Splurge: Credit Markets—May 26, 20149k S&P Dow Jones Indices—The Rise of China’s Corporate Bond Market—June 201410a Guggenheim Investments—High-Yield and Bank Loan Outlook High Quality High-Yield in a Maturing Bull Market—July 201410b Bloomberg—Yellen Sees Risk of Bubbles in Leveraged Loan Market—July 16, 201410c Market Realist—Refinancing deals continue to top the high yield bond scoreboard—March 28, 201410d Barron’s—Junk-Bond Default Rate Will Double After TXU Bankruptcy Filing—Fitch—April 29, 201411a Market Realist—Why the high-yield debt issuance in 2014 overtook 2013 levels—July 10, 2014
Global Capital Markets Perspective Issue 6 24

11b Market Realist—Why leverage loan issuance surged in the primary market—July 10, 201411c WSJ—More Loans Come With Few Strings Attached—June 12, 201411d Forbes—Reasons To Fear and Love Junk Bonds—May 8, 201411e WSJ—Debt Rises in Leveraged Buyouts Despite Warnings—May 20, 201411f Forbes—Leveraged Loans: European Volume Grows Thanks To Covenant-Lite, Second-Lien—June 23,201411g Financial Times—High-yield bonds boost Europe M&A hopes—May 5, 201411h Bloomberg Briefs—Leveraged Capital Q2 Supplement—July 201412a Financial News—European high-yield bond market hits its stride—June 24, 201412b Forbes—Numericable Wraps Record High Yield Bond Financing—April 23, 201412c WSJ—ECB Rate Cuts Fail to Tame Strong Euro—For Now—June 6, 201412d CNBC—ECB triggers explosive rise in emerging market euro borrowing—June 13, 201412e Financial News—European high-yield bond market hits its stride—June 24, 201412f Bloomberg—Debut Bond Sales Swell in Europe as Risks Mount: Credit Markets—June 25, 201412g IFLR—Asia high yield covenants buck global trend—July 31, 201412h WSJ—Asian Borrowers Gaining Upper Hand in Bond Sales—July 30, 201412i IFR Asia—Mezz debt to boost Asian LBOs—March 8, 201412j The Diplomat—China’s gargantuan corporate debt—June 18, 201412k IFR Asia—Non-bank boost for Asia loans—June 7, 201412l Reuters—Apollo issues post-crisis record CLO—June 13, 201412m Reuters—Fed gives banks more time on Volcker rule detail—April 7, 201413a Financial Times—European junk bond issuance outstrips U.S. for first time—August 7, 201413b Fitch Ratings—Italy, Spain Drive Record European HY Corporate Issuance—July 2, 201413c Global Capital—Italy innovates with minibonds to fill SME lending vacuum—March 3, 201413d Market Watch—ECB needs a better plan to boost Europe’s economy—July 9, 201413e South China Morning Post—Banking Asia’s Blue-Chips—Raising the bar—May 24, 201414a New Financial—Making Markets Work Better—July 2014 14b CBS Money Watch—So far,2014 is setting IPO records globally—July 3, 201414c Renaissance Capital—Renaissance Capital's 2Q 2014 Global IPO Market Review—June 27, 201414d Bloomberg—U.K. Retailers Cast Off Five-Year IPO Lull as Outlook Brightens—February 20, 201414e Reuters—U.S. STOCKS-Jobs report lifts market, volatility index at lowest since June 6–7, 201414f The Gate—Chinese Companies on U.S. Exchanges: Is this time different?—May 5, 201415a Investors & Media—PRESS RELEASE DETAILS—July 1, 201415b 2014 BDO IPO Outlook 15c Renaissance Capital—Renaissance Capital's 2Q 2014 U.S. IPO Market Review—July 1, 201415d Renaissance Capital—Renaissance Capital's 2Q 2014 U.S. IPO Market Review—July 1, 201415e The Telehraph—Private equity IPOs reach highest ever level—June 29, 201415f CNN Money—European IPOs boom as bull market runs—March 20, 201415g Bloomberg—U.K. Retailers Cast Off Five-Year IPO Lull as Outlook Brightens—February 20, 201415h Renaissance Capital—Renaissance Capital's 2Q 2014 Global IPO Market Review—June 27, 201415i Bloomberg—Europe’s IPO Market Cooling as Investor Fatigue Spreads—July 2, 201416a Bloomberg—China’s First IPOs in Four Months Surge by Daily Limit—June 26, 2014
Global Capital Markets Perspective Issue 6 25

16b WSJ—China Unveils List of 28 Companies Planning IPOs—April 19, 201416c WSJ—Hong Kong Keeps Luring Chinese IPOs—May 2, 201416d WSJ—String of Chinese Companies Seek Hong Kong Listing—June 23, 201416e Reuters—Lotte REIT becomes second big Asia IPO to be pulled this week—May 2, 201416f Reuters—SINGAPORE PRESS-No relief yet to IPO drought—Business Times—May 11,201416g The Economic Times—Australian IPO market sizzles with big deals still to come—June 2, 201416h Before It’s New—IPO Indicates Bottom of Spanish Property Market—June 16, 201416i The New York Times—Merlin Properties of Spain Slips in Trading Debut—June 30, 201416j The New York Times—Global Investors Looking for Real Estate Bargains Flock to Spain—May 29, 201416k Renaissance Capital—2Q 2014 US IPO Market Review—July 1, 201416l WSJ—European IPOs reaching record levels—July 27, 201416m Asia Review—Hong Kong sees IPO surge ahead of new sponsor regulation—June 28, 201416n WSJ—Chinese IPOs Begin With a Bang—July 20, 201417a Preqin Report—Quarterly Aggregate PE Fundraising Exceeds$100bn for Fourth Consecutive Quarter—July 1, 201417b Forbes—Co-Investment Catching On In European Private Equity—June 4, 201417c Duff & Phelps—Global PE Outlook—201418a Preqin Report—Dry Powder Available to North America-Based Private Equity Firms—March 201418b Ptchbook Report—Pitchbook 3Q 2014_U.S._PE Breakdown—201418c Preqin Report—Private Equity-Backed Add-on Deals—201418d PitchBook Report—PitchBook Highlights Growing Trend—Add-Ons—May 21, 201418e Bloomberg—Private-Equity Scrutiny Deepens as SEC Finds Illegal Fees—May 8, 201418f Forbes—Radical Change is Wrought in Private Equity by a Race Among Fund Managers for Non-U.S. Capital—July 16, 201418g Reuters—Private equity returns hit 11.8 percent in Europe on buyout frenzy—May 15, 201418h Preqin Report—201418i Ptchbook Report—Pitchbook 3Q 2014_Europe_PE Breakdown—201418j Baird—Looking Across the Pond: U.S. private equity targets European assets—201419a WSJ—European Private Equity Exits Hit a Fresh Record—May 6, 201419b Forbes—Is Asia-Pacific Private Equity On The Rebound?—July 23, 201419c Reuters—Private equity buyouts in Asia take old risks with new money—June 18, 201419d WSJ—Deals Getting Done at Record Pace in Asia Pacific—July 8, 201419e WSJ—Buyout Shops Look to Rivals for Deals—July 30, 201419f Financial News—Fundraising boost as U.S. investors return to Europe—January 7, 201419g WSJ—Asian Private Equity Fund Face Pressure to Invest Capital Hoard—May 14, 201420a IFR—Outlook for capital markets—January 201420b Financial Times—Federal Reserve set to hold course with $10bn paper—July 27, 201420c Bloomberg—$120 Oil Flagged as Danger Point for Global Economy on Iraq Crisis—June 18, 201420d The Guardian—IDF's Gaza assault is to control Palestinian gas, avert Israeli energy crisis—July 9, 201420e CBS News—Flaring Ukraine crisis could affect global economy—July 18, 2014
Global Capital Markets Perspective Issue 6 26

About Deloitte and this publication Deloitte refers to one or more of Deloitte Touche Tohmatsu Limited, a UK private company limited by guarantee, and its network of member firms, each of which is a legally separate and independent entity. Please see www.deloitte.com/about for a detailed description of the legal structure of Deloitte Touche Tohmatsu Limited and its member firms.
Deloitte provides audit, tax, consulting, and financial advisory services to public and private clients spanning multiple industries. With a globally connected network of member firms in more than 150 countries, Deloitte brings world-class capabilities and high-quality service to clients, delivering the insights they need to address their most complex business challenges. Deloitte’s approximately 195,000 professionals are committed to becoming the standard of excellence.
This briefing contains general information only and none of Deloitte Touche Tohmatsu Limited, its member firms, or their related entities (collectively, the “Deloitte Network”) is, by means of this publication, rendering professional advice or services. It is not intended to be comprehensive, is not a substitute for such professional advice and should not be relied upon or used as a basis for any decision or action that may affect you, your finances or your business. This briefing is not directed to, or intended for distribution or use in, any jurisdiction where such distribution or use would be prohibited. To the extent permitted by law, no entity in the Deloitte Network accepts a duty of care or liability for any loss occasioned to any person acting or refraining from acting as a result of any material in this publication.
© 2014 Deloitte Global Services Limited