global cement - cembrgroup.com
TRANSCRIPT

Global and regional data and insights
Global cement
2020 updates and forecasts summary to 2025
The ultimate “intelligence” provider in the global cement sector
cembrgroup.com

CemBR coverage universe
CemBR Forecasts & The CGC™
The largest 90 cement marketsin the world representingapproximately 95% of globalcement consumption.
Detailed data on:1865 cement producing plants1350 clinker producing plants2,300 individual kilns
* All above plant data is ex-China
The ultimate “intelligence” provider in the global cement sector
cembrgroup.com

Historical global cement consumption and the impact of China
0
500
1000
1500
2000
2500
3000
3500
4000
4500
2010 2011 2012 2013 2014 2015 2016 2017 2018 2019 2020
Cement consumption in m tonnes
Global ex-China China
2.0%
2.4%2.2%
0.0%
0.5%
1.0%
1.5%
2.0%
2.5%
3.0%
Global ex-China China Global total
CAGR 2010-2020
275 504
35%
65%
0%
20%
40%
60%
80%
0
100
200
300
400
500
600
Global ex-China China
2010 – 2020 additional volumes in m tonnes
2010-2020 2010-2020Source:
China had the lion share of the global cement growth in the lastdecade. 65% of volume growth was taken by China. However, theinfluence of China on the global cement sector is currently limiteddue to minimal interaction between China and the rest of theWorld. China’s influence in world cement is more evident in theerection of new cement plants.

China – interaction with the Rest of the World
0.0%
1.0%
2.0%
3.0%
4.0%
5.0%
6.0%
7.0%
2016 2017 2018 2019 2020
China global interaction - trading as a %ge of total exports
0.0
5.0
10.0
15.0
20.0
25.0
30.0
35.0
40.0
2016 2017 2018 2019 2020
China global interaction - clinker trading
China imports China exports
18.6
3.8
11.0
Imported clinker into China in m tonnes - 2020
Vietnam Indonesia Others
20%
4%
0% 0%
13%
0%
5%
10%
15%
20%
25%
Indonesia Vietnam Japan SouthKorea
Thailand
%age of capacity in international hands
Cement trading betweenChina and the rest of theWorld has been decliningto meaningless levels.
Clinker imports into Chinahave been increasing inthe last four years, ascoastal Chinese capacityis inadequate.
Five industries accountfor almost the entireclinker imports into China:Indonesia, Japan,Thailand, South Korea,Vietnam.
Presence of majorinternational companiesin these industries islimited.
Source:

Global cement data 2010 – 2020 & 2020 manufacturing data
Cement consumptionCAGR (2010-2020)
Manufacturing data 2020 incl. China
Regional cement capacity & utilisation
Number of cement plants 5,023
Cement capacity (MT) 6,605
Cement capacity growth rate (CAGR 10yr) 3.6%
Cement utilisation rate (%) - Global 60%
Cement utilisation rate (%) - ex-China 57%
Legend
385
5,048
1,248
234515
177 246
65%
61%
57%
62%
51% 50%
54%
40%
45%
50%
55%
60%
65%
70%
0
1,000
2,000
3,000
4,000
5,000
6,000
AM
ER
ICA
S
AS
IA &
OC
EA
NIA
wit
h C
HIN
A
AS
IA &
OC
EA
NIA
ex-
CH
INA
EA
ST
ER
N E
UR
OP
E &
CE
NT
RA
L A
SIA
ME
NA
& T
HE
GU
LF
SU
B-S
AH
AR
AN
AF
RIC
A
WE
ST
ER
N E
UR
OP
E
CEMENT MILLING CAPACITY (MT)
CEMENT UTILISATION RATE (%)
Source: NB: Chinese cement capacity and plants is an estimate for 2020 only. No detailed record of cement plants in China
exists in CemBR’s databases.

Global cement data – forecasts to 2025
Cement consumption forecast CAGR (2020A-2025E)
X > 8%
6% < X < 8%
4% < X < 6%
2% < X < 4%
0% < X < 2%
Global ex-China 2019A 2020A 2021E 2022F 2023F 2024F 2025F
Cement consumption (MT) 1,606 1,549 1,648 1,698 1,744 1,790 1,836
Consumption growth rate (%) 0.2% -3.5% 6.4% 3.0% 2.7% 2.6% 2.6%
Consumption per capita (KG) 300 286 301 307 313 318 323
Cement supply (MT) 2,758 2,805 2,885 2,924 2,987 3,047 3,060
DCUF™ (%) 58% 55% 57% 58% 58% 59% 60%
Excess supply (MT) 1,151 1,256 1,237 1,226 1,243 1,257 1,224
Source:
NB: DCUF™ stands for Domestic Capacity Utilisation Factor. This is theratio of domestic consumption divided by domestic capacity of cement.In other words, there is no allowance for international trading (importsand exports are excluded). This metric indicates the propensity of amarket to import/export cement. It is expressed in percentage.
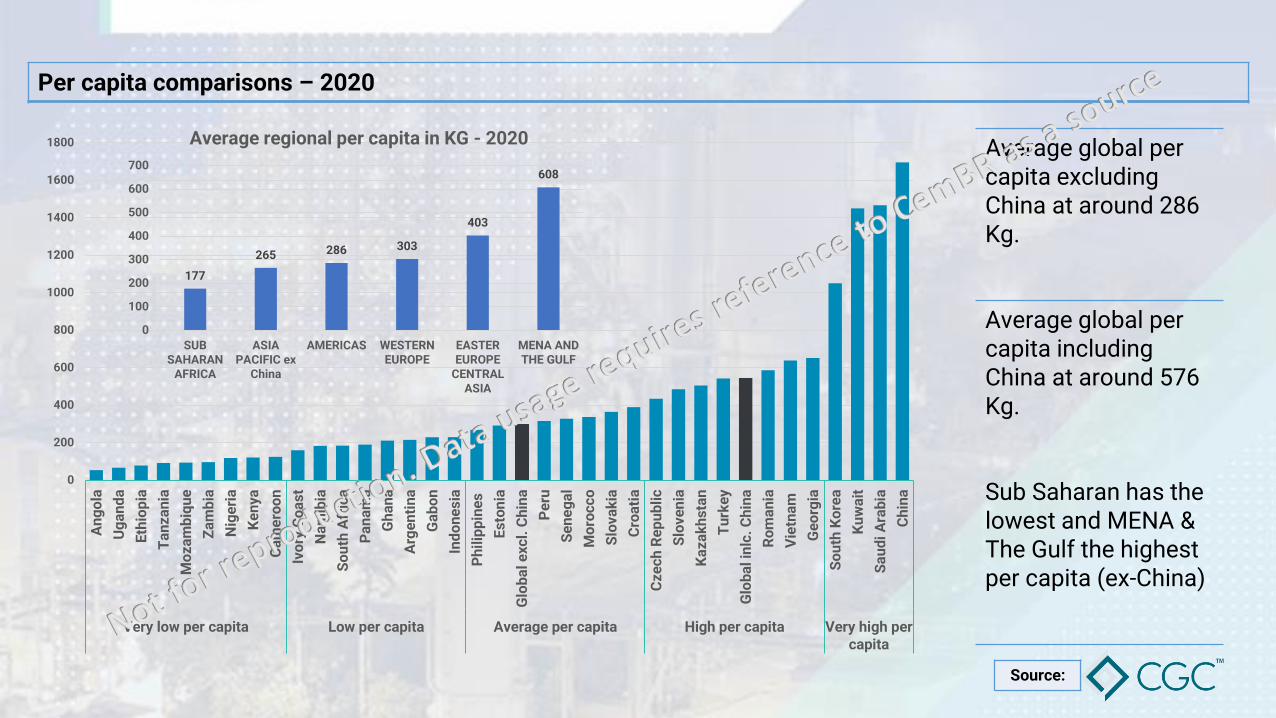
Per capita comparisons – 2020
Average global per capita excluding China at around 286 Kg.
Average global per capita including China at around 576 Kg.
Sub Saharan has the lowest and MENA & The Gulf the highest per capita (ex-China)
Source:
0
200
400
600
800
1000
1200
1400
1600
1800
An
go
la
Ug
an
da
Eth
iop
ia
Ta
nz
an
ia
Mo
za
mb
iqu
e
Za
mb
ia
Nig
eri
a
Ke
ny
a
Ca
me
roo
n
Ivo
ry C
oa
st
Na
mib
ia
So
uth
Afr
ica
Pa
na
ma
Gh
an
a
Arg
en
tin
a
Ga
bo
n
Ind
on
es
ia
Ph
ilip
pin
es
Es
ton
ia
Glo
ba
l e
xcl.
Ch
ina
Pe
ru
Se
ne
ga
l
Mo
roc
co
Slo
va
kia
Cro
ati
a
Cz
ec
h R
ep
ub
lic
Slo
ve
nia
Ka
za
kh
sta
n
Tu
rke
y
Glo
ba
l in
lc.
Ch
ina
Ro
ma
nia
Vie
tna
m
Ge
org
ia
So
uth
Ko
rea
Ku
wa
it
Sa
ud
i A
rab
ia
Ch
ina
Very low per capita Low per capita Average per capita High per capita Very high percapita
177
265 286 303
403
608
0
100
200
300
400
500
600
700
SUBSAHARAN
AFRICA
ASIAPACIFIC ex
China
AMERICAS WESTERNEUROPE
EASTEREUROPE
CENTRALASIA
MENA ANDTHE GULF
Average regional per capita in KG - 2020
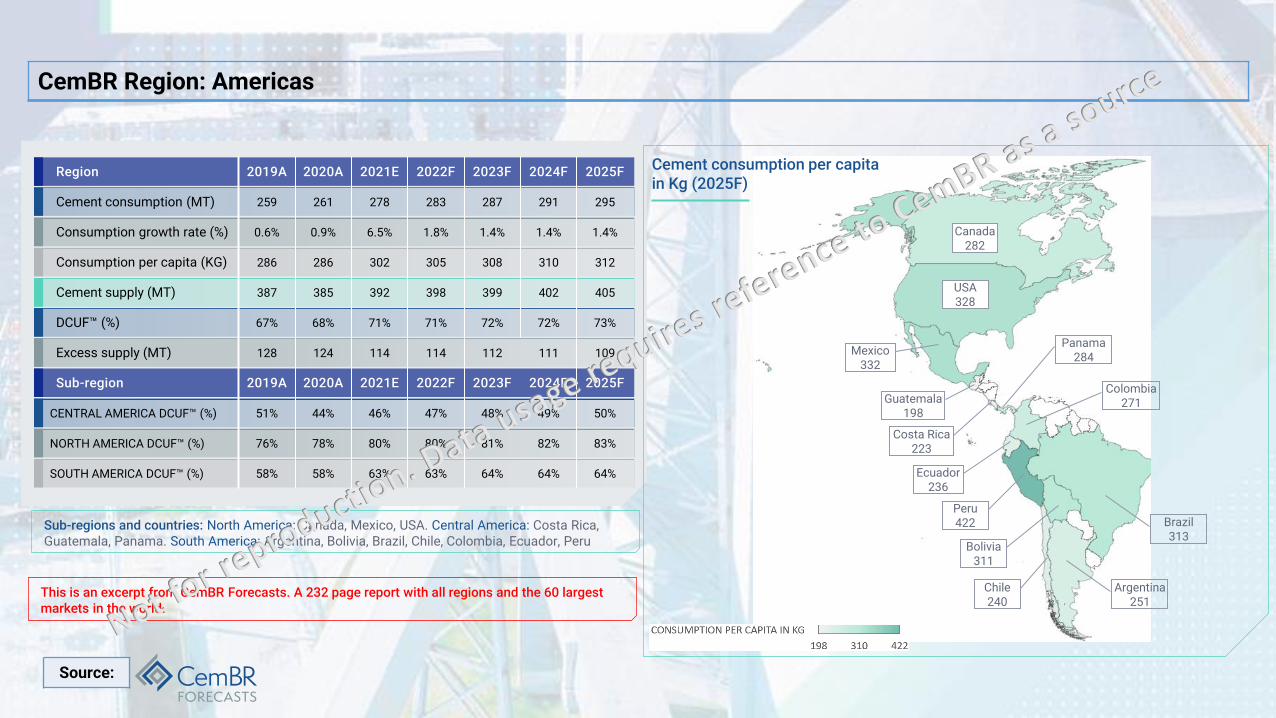
CemBR Region: Americas
Region 2019A 2020A 2021E 2022F 2023F 2024F 2025F
Cement consumption (MT) 259 261 278 283 287 291 295
Consumption growth rate (%) 0.6% 0.9% 6.5% 1.8% 1.4% 1.4% 1.4%
Consumption per capita (KG) 286 286 302 305 308 310 312
Cement supply (MT) 387 385 392 398 399 402 405
DCUF™ (%) 67% 68% 71% 71% 72% 72% 73%
Excess supply (MT) 128 124 114 114 112 111 109
Sub-region 2019A 2020A 2021E 2022F 2023F 2024F 2025F
CENTRAL AMERICA DCUF™ (%) 51% 44% 46% 47% 48% 49% 50%
NORTH AMERICA DCUF™ (%) 76% 78% 80% 80% 81% 82% 83%
SOUTH AMERICA DCUF™ (%) 58% 58% 63% 63% 64% 64% 64%
Cement consumption per capita in Kg (2025F)
Canada282
Bolivia311
Argentina251
Brazil313
Chile240
Colombia271
Costa Rica223
Ecuador236
Peru422
Guatemala198
Mexico332
Panama284
USA328
Source:
Sub-regions and countries: North America: Canada, Mexico, USA. Central America: Costa Rica, Guatemala, Panama. South America: Argentina, Bolivia, Brazil, Chile, Colombia, Ecuador, Peru
This is an excerpt from CemBR Forecasts. A 232 page report with all regions and the 60 largest markets in the world.
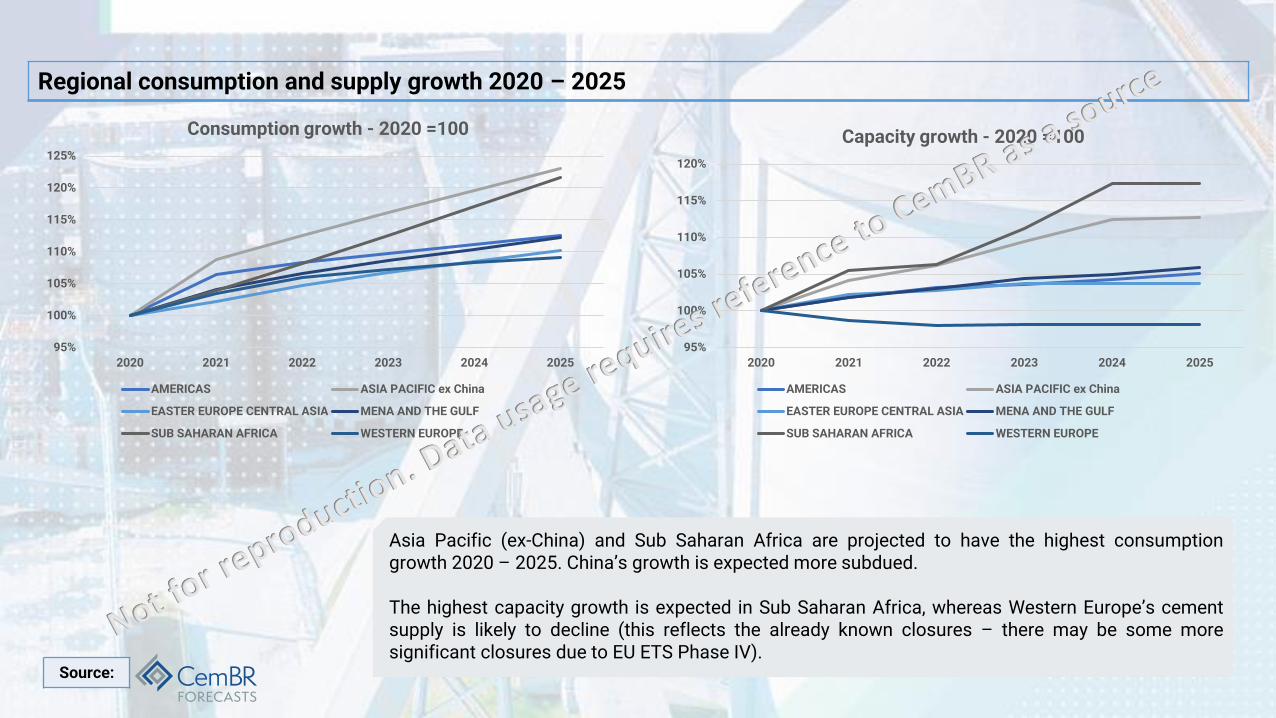
Regional consumption and supply growth 2020 – 2025
95%
100%
105%
110%
115%
120%
125%
2020 2021 2022 2023 2024 2025
Consumption growth - 2020 =100
AMERICAS ASIA PACIFIC ex China
EASTER EUROPE CENTRAL ASIA MENA AND THE GULF
SUB SAHARAN AFRICA WESTERN EUROPE
95%
100%
105%
110%
115%
120%
2020 2021 2022 2023 2024 2025
Capacity growth - 2020 =100
AMERICAS ASIA PACIFIC ex China
EASTER EUROPE CENTRAL ASIA MENA AND THE GULF
SUB SAHARAN AFRICA WESTERN EUROPE
Source:
Asia Pacific (ex-China) and Sub Saharan Africa are projected to have the highest consumptiongrowth 2020 – 2025. China’s growth is expected more subdued.
The highest capacity growth is expected in Sub Saharan Africa, whereas Western Europe’s cementsupply is likely to decline (this reflects the already known closures – there may be some moresignificant closures due to EU ETS Phase IV).

Regional consumption and supply growth 2020 – 2025, resultant Utilisation rates (DCUF™)
2.5%
4.6%
2.0%
2.4%
4.3%
1.8%
1.0%
2.5%
0.7%
1.2%
3.4%
-0.4%
-1.0%
0.0%
1.0%
2.0%
3.0%
4.0%
5.0%
AMERICAS ASIA PACIFIC exChina
EASTER EUROPECENTRAL ASIA
MENA AND THEGULF
SUB SAHARANAFRICA
WESTERNEUROPE
Consumption and supply CAGR 2020-2025
Consumption 2020-2025 CAGR Supply 2020-2025 CAGR
90%
95%
100%
105%
110%
115%
2020 2021 2022 2023 2024 2025
DCUF™ 2020-2025
AMERICAS ASIA PACIFIC ex China
EASTER EUROPE CENTRAL ASIA MENA AND THE GULF
SUB SAHARAN AFRICA WESTERN EUROPE
Source:
Western Europe is expected to show the strongest growth in DCUF™, with Asia Pacific (ex-China)following closely.
All regions are expected to show an increase in DCUF™, but Sub Saharan Africa exhibits the lowestgrowth due to significant new capacity additions.


The ultimate “intelligence” provider in the global cement sector
Our websites:
For CemBR Forecasts
cembrgroup.com
For the CGC:
cembrcgc.com
t