global chlor-alkali market outlook · european chlor-alkali market: refreshed by new, modern...
TRANSCRIPT
© 2018 IHS MarkitTM. All Rights Reserved.Confidential. © 2018 IHS MarkitTM. All Rights Reserved.© 2018 IHS MarkitTM. All Rights Reserved.
Global Chlor-alkali Market OutlookClorosur Technical Conference15 November, 2018│Monterrey, Mexico
Ana LopezAssociate Director, Chlor-alkali / Vinyls

© 2018 IHS MarkitTM. All Rights Reserved.
Did you know?
IHS Markit is: CMAI, SRI Consulting, CERA, Chemical Week, OPIS & Petrochem Wire
IHS Markit has the singular ability to look across complex industries, financial markets, and government actions that drive the global economy and provide our customers with insights, perspective and solutions for what really matters.

Confidential. © 2018 IHS MarkitTM. All Rights Reserved.
OverviewThe big picture
3

© 2018 IHS MarkitTM. All Rights Reserved.
Chlor-alkali Market Outlook…strong demand growth combined with lack of capacity expansions will drive higher asset utilization and increased profitability through 2023.
4

© 2018 IHS MarkitTM. All Rights Reserved.
2018 Chlor-alkali capacity: Approximately 90 million metric tons Chlorine basis
47.4
13.3
15.5
4.33.4
2.6
2.4
Source: IHS Markit Chlor-alkali World Analysis 2018 © IHS Markit
1.0
Intercontinental Caustic Soda Trade = 9.3 Million DMT
5

© 2018 IHS MarkitTM. All Rights Reserved.
• Chlor-Alkali capacity
> Mercury-cell conversion is complete in Europe
> New capacity announcements emerging for Europe and US
• Caustic soda
> Prices moved higher, although excess product in regional spot markets has stalled upward momentum
> Alumina producers are optimizing bauxite vs. caustic price
> Limited uncontracted volume heightens spot market sensitivity
• Chinese environmental policy expanded
> Renewed inspections are impacting chlorine and caustic demand
> Chinese economy has cooled a bit
> Production from carbide-based PVC capacity is stalled … at least for now
What’s changed since last year?
6

© 2018 IHS MarkitTM. All Rights Reserved.
7
7
Four key drivers support strong market conditions in the global caustic soda market
• Strong economic activity is supporting caustic demand in all segments
• Key consumption segments are exploring optimization alternatives for caustic soda cost mitigation
• E-commerce is changing the comparative structure of pulp consumption segments
• Chinese production and consumption dominates global market structure, magnifying impacts of changes underway in the domestic market
Strong Economy
Cost Optimization efforts
E-commerce driving pulp
China environmental impact

Confidential. © 2018 IHS MarkitTM. All Rights Reserved.
Americas
8

© 2018 IHS MarkitTM. All Rights Reserved.
South America caustic and chlorine demand continue to diverge
0
1
2
3
4
5
2013 2014 2015 2016 2017 2018 2019 2020 2021 2022 2023
Chlorine demand Caustic demand Capacity
SAM Chlorine and Caustic Soda Demand Forecast
Ch
lori
ne
/ C
au
stic s
od
aM
illio
n m
etr
ic to
ns/D
MT
Source: IHS Markit World Analysis 2019 © 2018 IHS Markit
9
© 2018 IHS MarkitTM. All Rights Reserved.
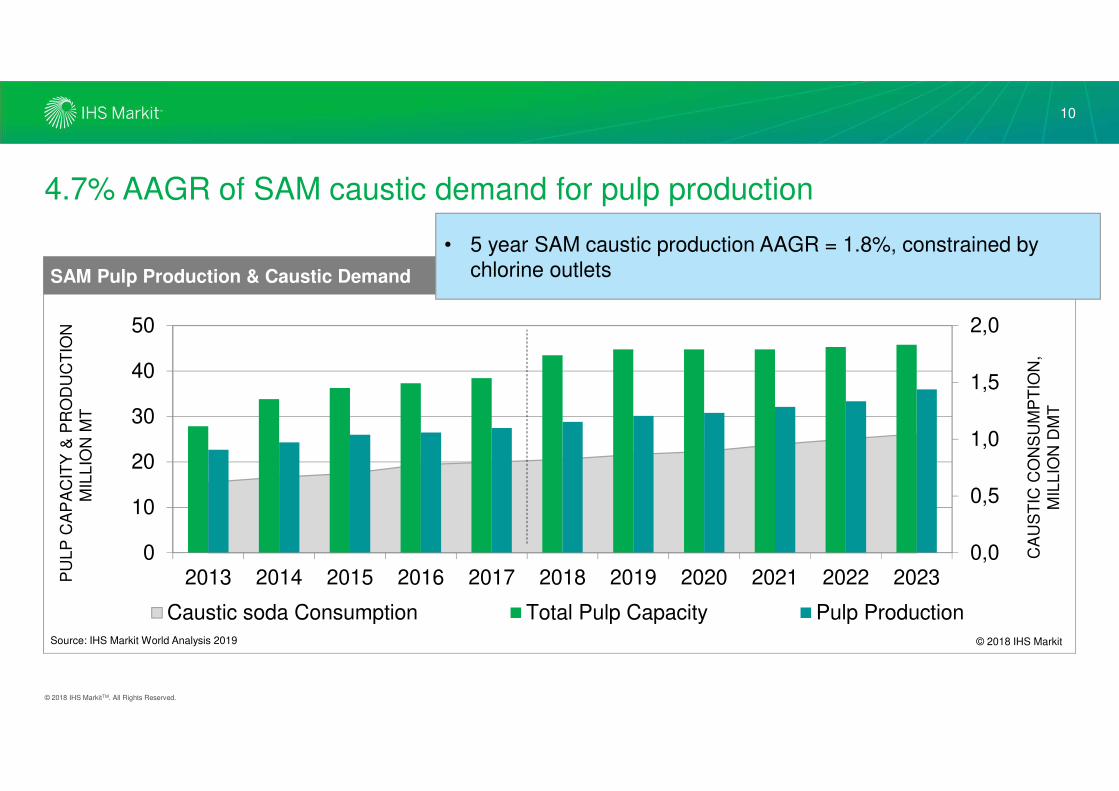
4.7% AAGR of SAM caustic demand for pulp production
0,0
0,5
1,0
1,5
2,0
0
10
20
30
40
50
2013 2014 2015 2016 2017 2018 2019 2020 2021 2022 2023
Caustic soda Consumption Total Pulp Capacity Pulp Production
PU
LP
CA
PA
CIT
Y &
PR
OD
UC
TIO
N
MIL
LIO
N M
T
CA
US
TIC
CO
NS
UM
PT
ION
, M
ILL
ION
DM
T
SAM Pulp Production & Caustic Demand
Source: IHS Markit World Analysis 2019 © 2018 IHS Markit
• 5 year SAM caustic production AAGR = 1.8%, constrained by chlorine outlets
10

© 2018 IHS MarkitTM. All Rights Reserved.
SAM caustic demand for alumina production continues to grow
0,0
0,5
1,0
1,5
2,0
0
5
10
15
20
25
2013 2014 2015 2016 2017 2018 2019 2020 2021 2022 2023
Alumina Production Alumina Capacity Forecast Alumina Capacity Caustic soda Consumption
AL
UM
INA
CA
PA
CIT
Y &
P
RO
DU
CT
ION
M
ILL
ION
MT
CA
US
TIC
CO
NS
UM
PT
ION
, M
ILL
ION
DM
T
SAM Alumina Production & Caustic Demand
Source: IHS Markit World Analysis 2019 © 2018 IHS Markit
• 5 year SAM caustic demand growth for ALA = 4.5%, net of projected Alunorte refinery operating rate recovery
11
© 2018 IHS MarkitTM. All Rights Reserved.
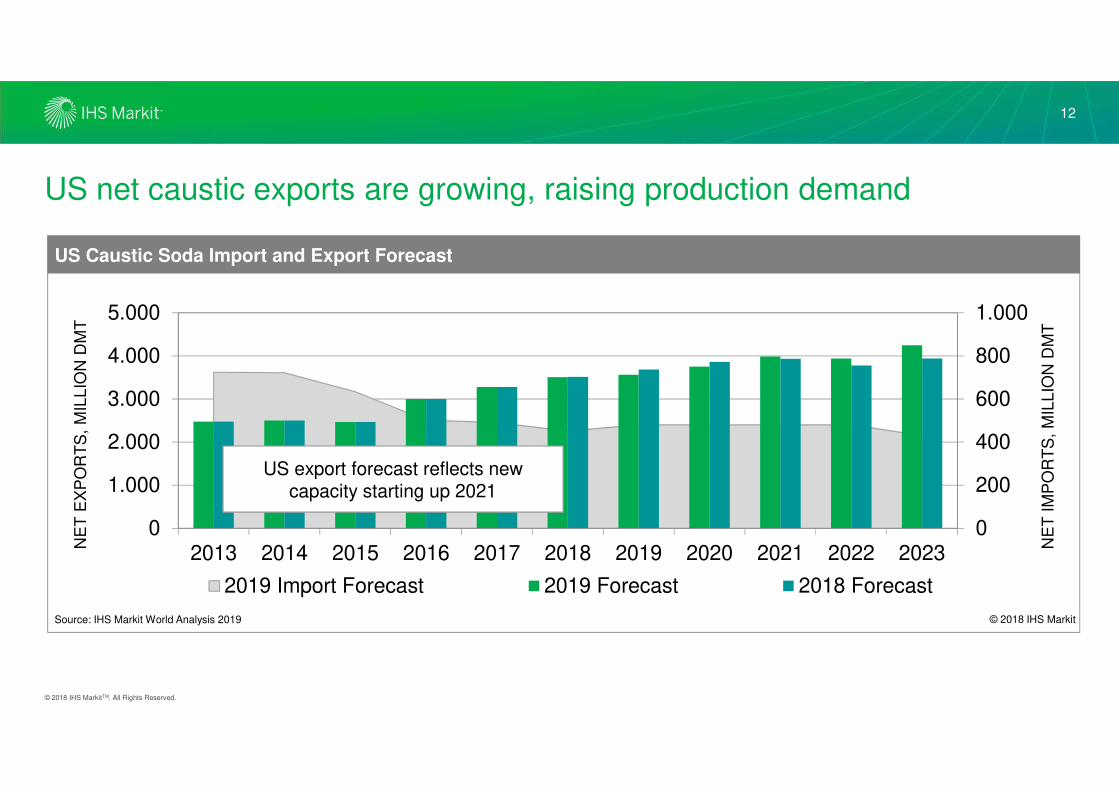
US net caustic exports are growing, raising production demand
0
200
400
600
800
1.000
0
1.000
2.000
3.000
4.000
5.000
2013 2014 2015 2016 2017 2018 2019 2020 2021 2022 2023
2019 Import Forecast 2019 Forecast 2018 Forecast
US export forecast reflects new capacity starting up 2021
NE
T E
XP
OR
TS
, M
ILL
ION
DM
T
NE
T I
MP
OR
TS
, M
ILL
ION
DM
T
US Caustic Soda Import and Export Forecast
Source: IHS Markit World Analysis 2019 © 2018 IHS Markit
12
© 2018 IHS MarkitTM. All Rights Reserved.
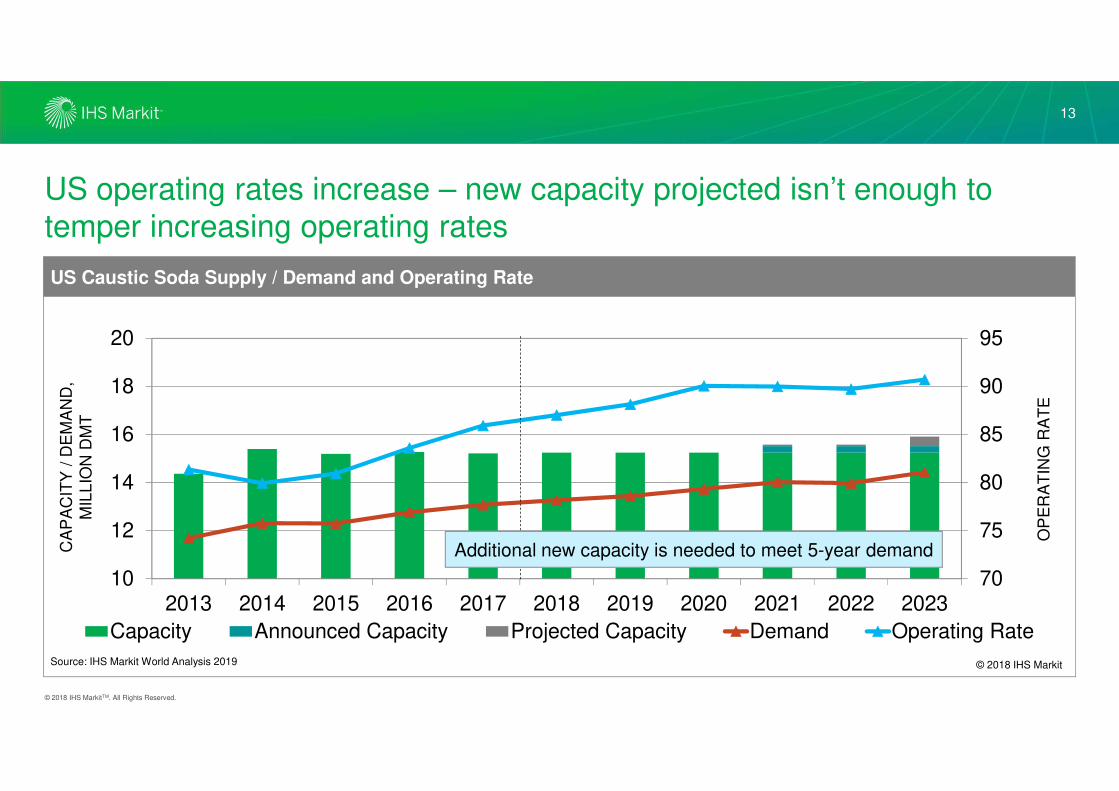
US operating rates increase – new capacity projected isn’t enough to temper increasing operating rates
70
75
80
85
90
95
10
12
14
16
18
20
2013 2014 2015 2016 2017 2018 2019 2020 2021 2022 2023
Capacity Announced Capacity Projected Capacity Demand Operating Rate
CA
PA
CIT
Y /
DE
MA
ND
,
MIL
LIO
N D
MT
OP
ER
AT
ING
RA
TE
US Caustic Soda Supply / Demand and Operating Rate
Additional new capacity is needed to meet 5-year demand
Source: IHS Markit World Analysis 2019 © 2018 IHS Markit
13

© 2018 IHS MarkitTM. All Rights Reserved.
North America market outlook summary
DomesticDemand
Production & Trade
Operating Rates
• Shintech adds 270 kdmta in 2021; additional hypo capacity assumed in 2023
• South American pulp growth and alumina rebound fuel USGC export growth
• Average operating rates climb to 90% in 2021 – new Shintech capacity moderates rise until 2023
• Strong domestic demand through 2023; Vinyls and MDI are stand out chlorine growth segments; inorganic chemicals, organic chemicals and pulp are standout caustic growth segments
• 2018 caustic exports slightly lag 2017 exports due to Alunorte; 2019 – 2023 caustic exports grow in spite of Australian producers optimizing bauxite grade
Net Exports
Prices&
Margins
• Prices rise modestly to peak as global market awaits Asia recovery
• Low natural gas prices support continued globally advantaged economics
14

Confidential. © 2018 IHS MarkitTM. All Rights Reserved.
Europe
15
© 2018 IHS MarkitTM. All Rights Reserved.
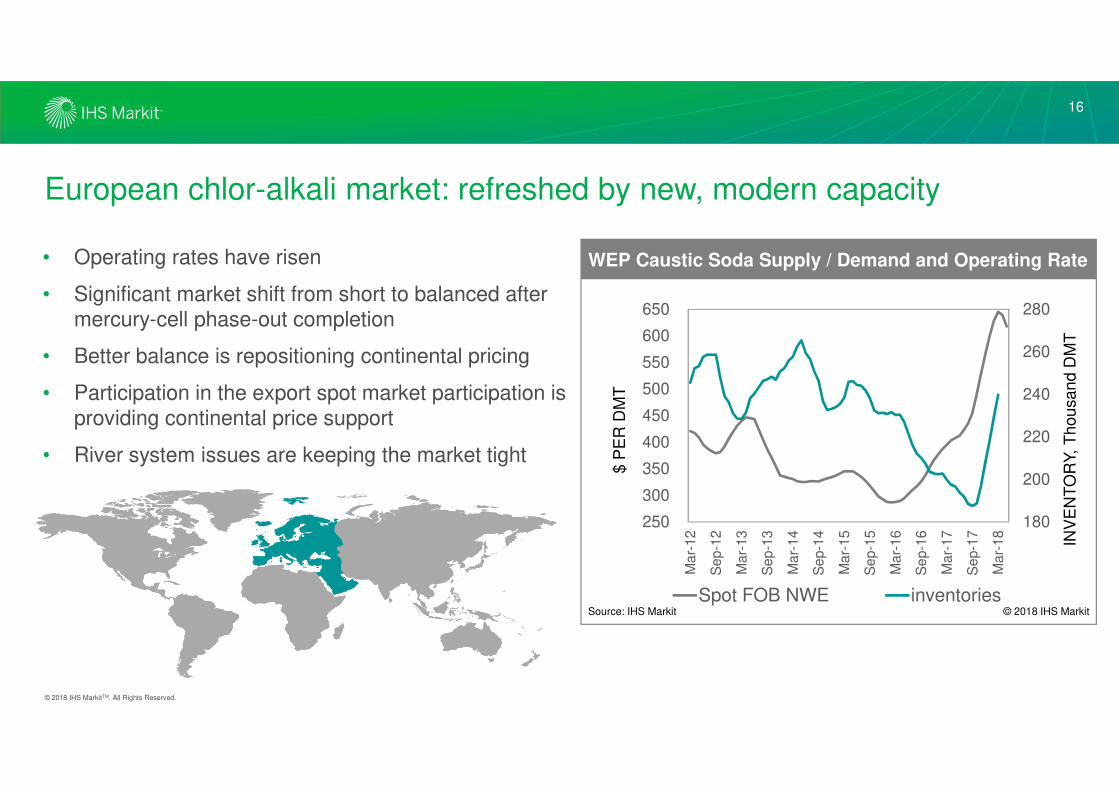
European chlor-alkali market: refreshed by new, modern capacity
• Operating rates have risen
• Significant market shift from short to balanced after mercury-cell phase-out completion
• Better balance is repositioning continental pricing
• Participation in the export spot market participation is providing continental price support
• River system issues are keeping the market tight
16
180
200
220
240
260
280
250
300
350
400
450
500
550
600
650
Ma
r-1
2
Se
p-1
2
Ma
r-1
3
Se
p-1
3
Ma
r-1
4
Se
p-1
4
Ma
r-1
5
Se
p-1
5
Ma
r-1
6
Se
p-1
6
Ma
r-1
7
Se
p-1
7
Ma
r-1
8
Spot FOB NWE inventories
Europe Caustic Spot Price vs Inventory levels
Source: IHS Markit © 2018 IHS Markit
WEP Caustic Soda Supply / Demand and Operating Rate
INV
EN
TO
RY,
Th
ou
sa
nd
DM
T
$ P
ER
DM
T
© 2018 IHS MarkitTM. All Rights Reserved.
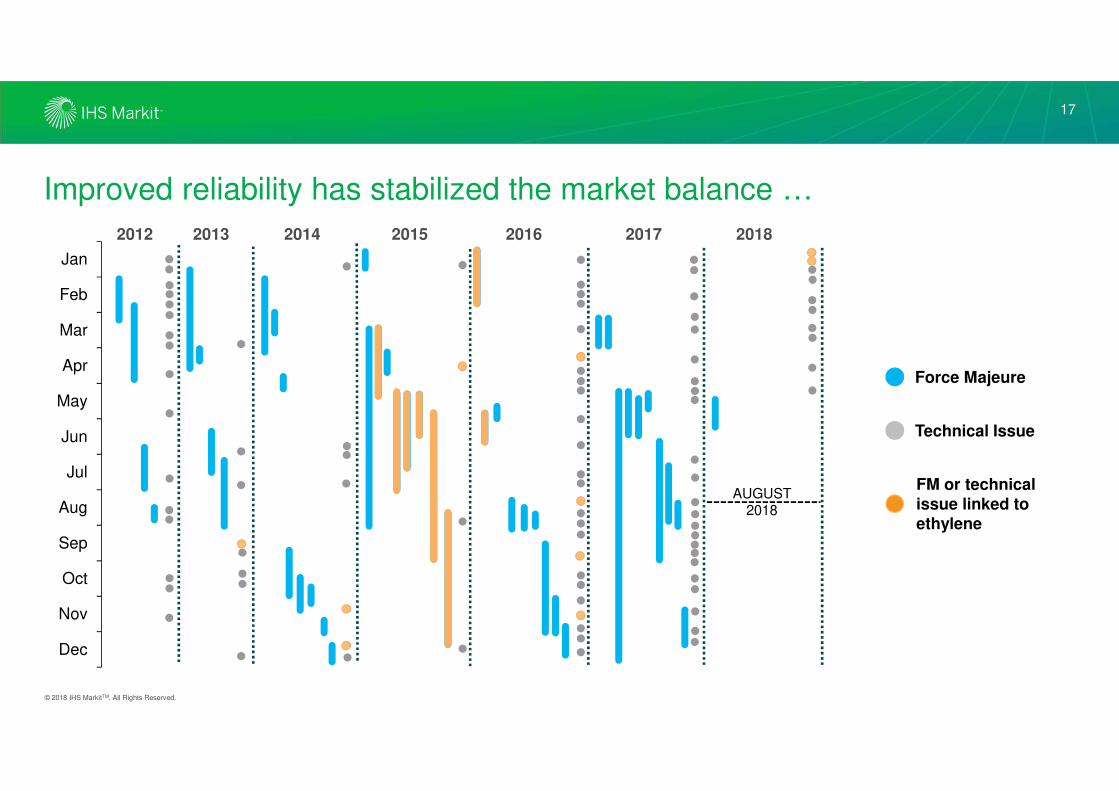
Improved reliability has stabilized the market balance …
17
Force Majeure
FM or technical
issue linked to
ethylene
AUGUST 2018
Jan
Feb
Mar
Apr
May
Jun
Jul
Aug
Sep
Oct
Nov
Dec
2012 2013 2014 2015 2016 2017 2018
Technical Issue
© 2018 IHS MarkitTM. All Rights Reserved.
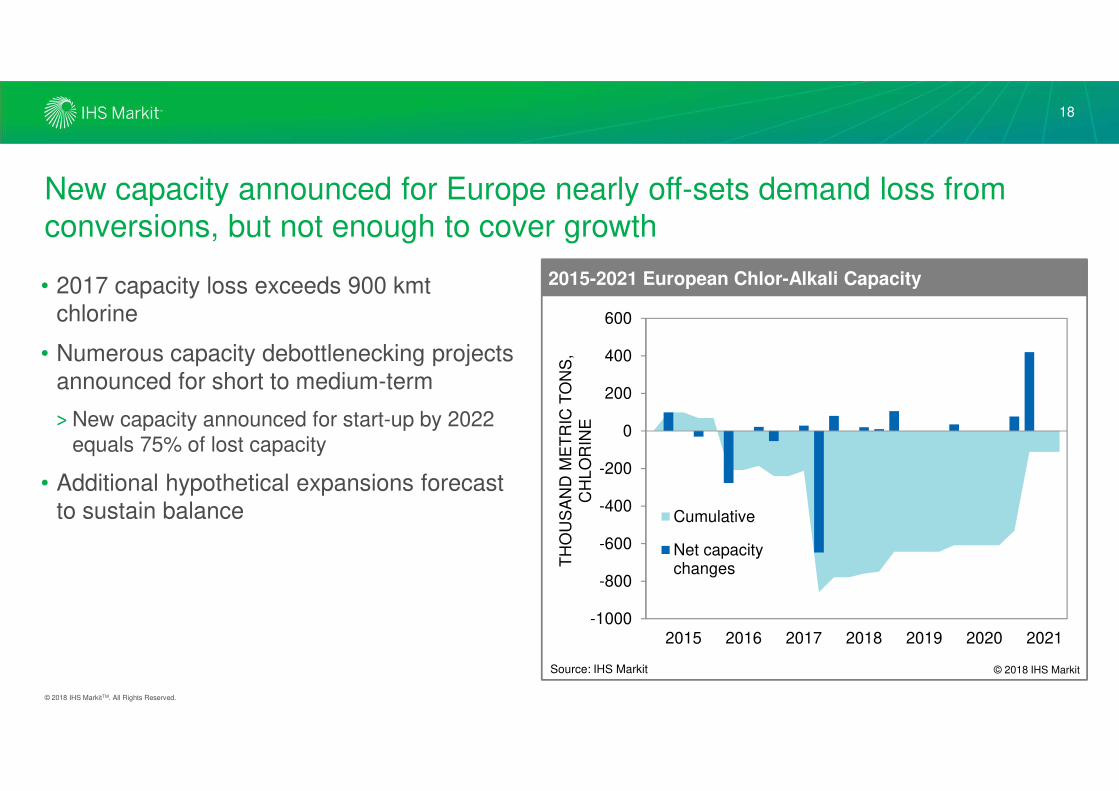
New capacity announced for Europe nearly off-sets demand loss from conversions, but not enough to cover growth
• 2017 capacity loss exceeds 900 kmtchlorine
• Numerous capacity debottlenecking projects announced for short to medium-term
> New capacity announced for start-up by 2022 equals 75% of lost capacity
• Additional hypothetical expansions forecast to sustain balance
18
-1000
-800
-600
-400
-200
0
200
400
600
2015 2016 2017 2018 2019 2020 2021
Cumulative
Net capacitychanges
2015-2021 European Chlor-Alkali Capacity
TH
OU
SA
ND
ME
TR
IC T
ON
S,
CH
LO
RIN
E
Source: IHS Markit © 2018 IHS Markit
© 2018 IHS MarkitTM. All Rights Reserved.
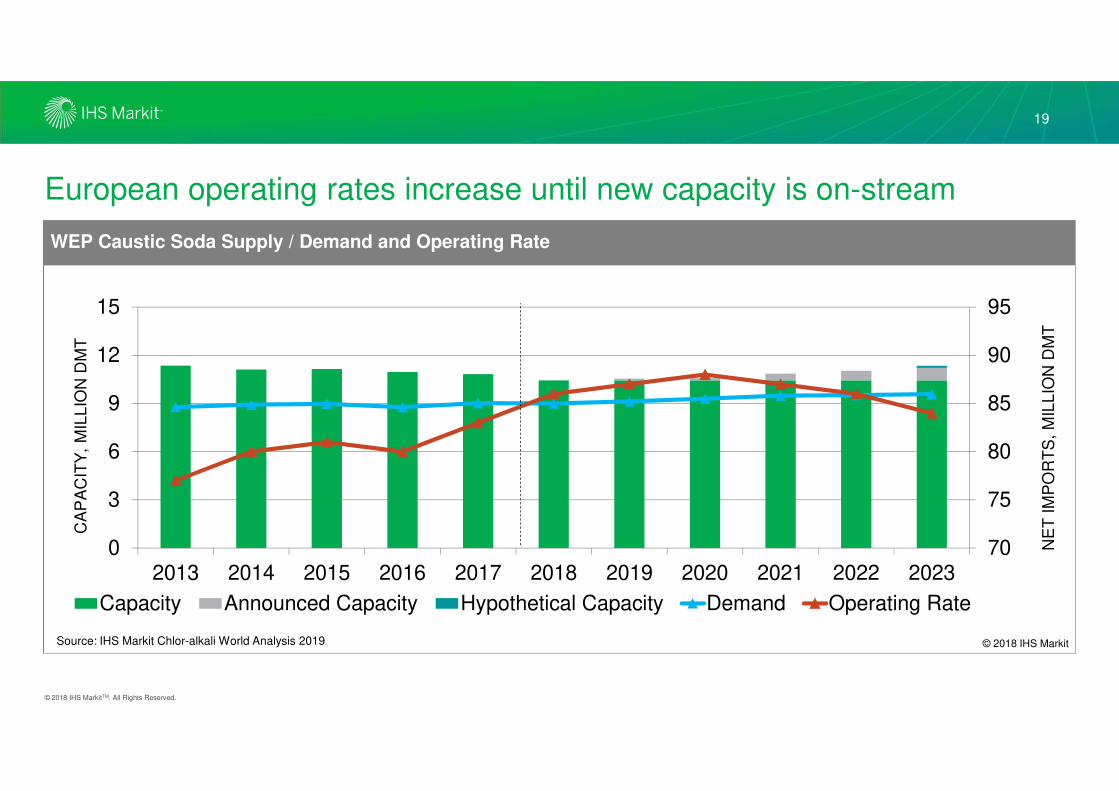
European operating rates increase until new capacity is on-stream
70
75
80
85
90
95
0
3
6
9
12
15
2013 2014 2015 2016 2017 2018 2019 2020 2021 2022 2023
Capacity Announced Capacity Hypothetical Capacity Demand Operating Rate
CA
PA
CIT
Y,
MIL
LIO
N D
MT
NE
T I
MP
OR
TS
, M
ILL
ION
DM
T
WEP Caustic Soda Supply / Demand and Operating Rate WEP Caustic Soda Supply / Demand and Operating Rate
Source: IHS Markit Chlor-alkali World Analysis 2019 © 2018 IHS Markit
19
© 2018 IHS MarkitTM. All Rights Reserved.
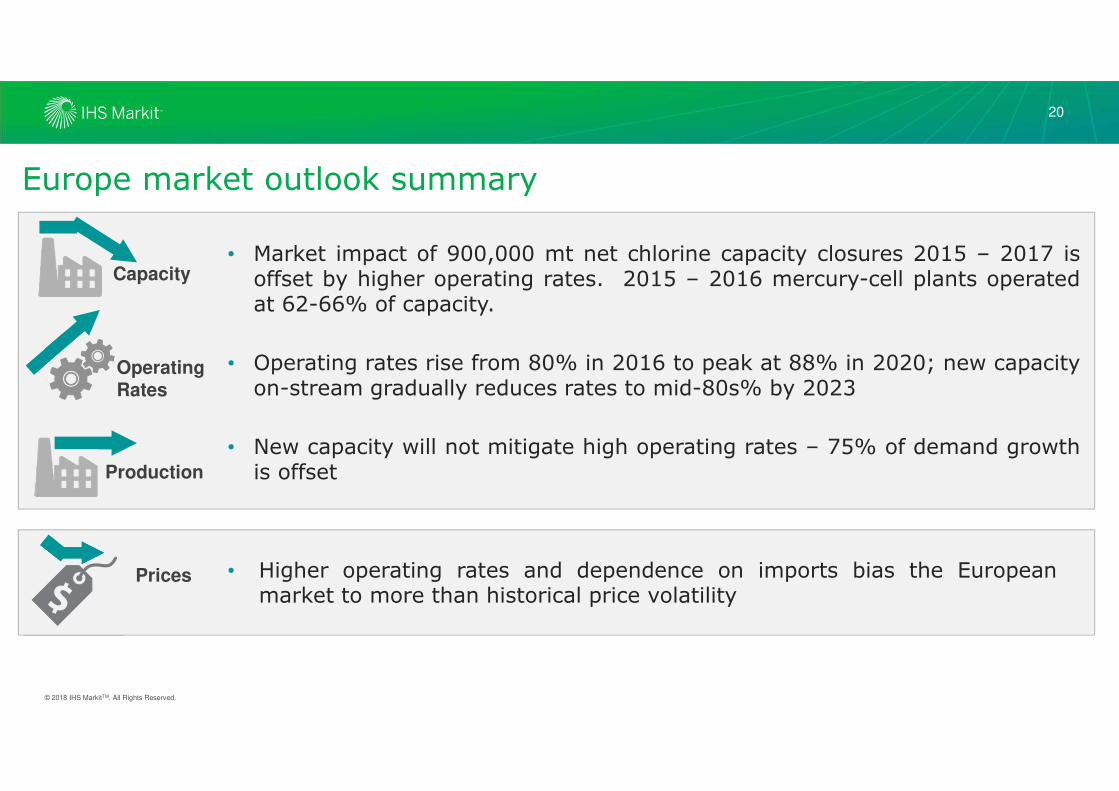
Europe market outlook summary
Capacity
Production
Operating Rates
• Market impact of 900,000 mt net chlorine capacity closures 2015 – 2017 isoffset by higher operating rates. 2015 – 2016 mercury-cell plants operatedat 62-66% of capacity.
• Operating rates rise from 80% in 2016 to peak at 88% in 2020; new capacityon-stream gradually reduces rates to mid-80s% by 2023
• New capacity will not mitigate high operating rates – 75% of demand growthis offset
Prices • Higher operating rates and dependence on imports bias the Europeanmarket to more than historical price volatility
20

Confidential. © 2018 IHS MarkitTM. All Rights Reserved.
Asia
21

© 2018 IHS MarkitTM. All Rights Reserved.
Asia leads the world in per capita caustic soda consumption growth rate …
• Chinese per capita consumption increases by almost 60% over the next 10 years
• Korean and Japanese per capita caustic consumption exceeds that of West Europe
• Chinese per capita caustic consumption approaches that of US by 2028
0
5
10
15
20
25
30
35
2013 2015 2017 2019 2021 2023 2025 2027
CHINA PC Caustic SEA PC Caustic MDE PC Caustic AFR PC Caustic
WEP PC Caustic CEP PC Caustic FSU PC Caustic SAM PC Caustic
US PC Caustic CHINA PC Caustic INDIA PC Caustic JAPAN PC Caustic
KOREA PC Caustic
PE
R C
AP
ITA
CA
US
TIC
US
E
KG
/PE
RS
ON
YE
AR
Per Capita Caustic Consumption
Source: IHS Markit Chlor-alkali World Analysis 2019 © 2018 IHS Markit
22
© 2018 IHS MarkitTM. All Rights Reserved.
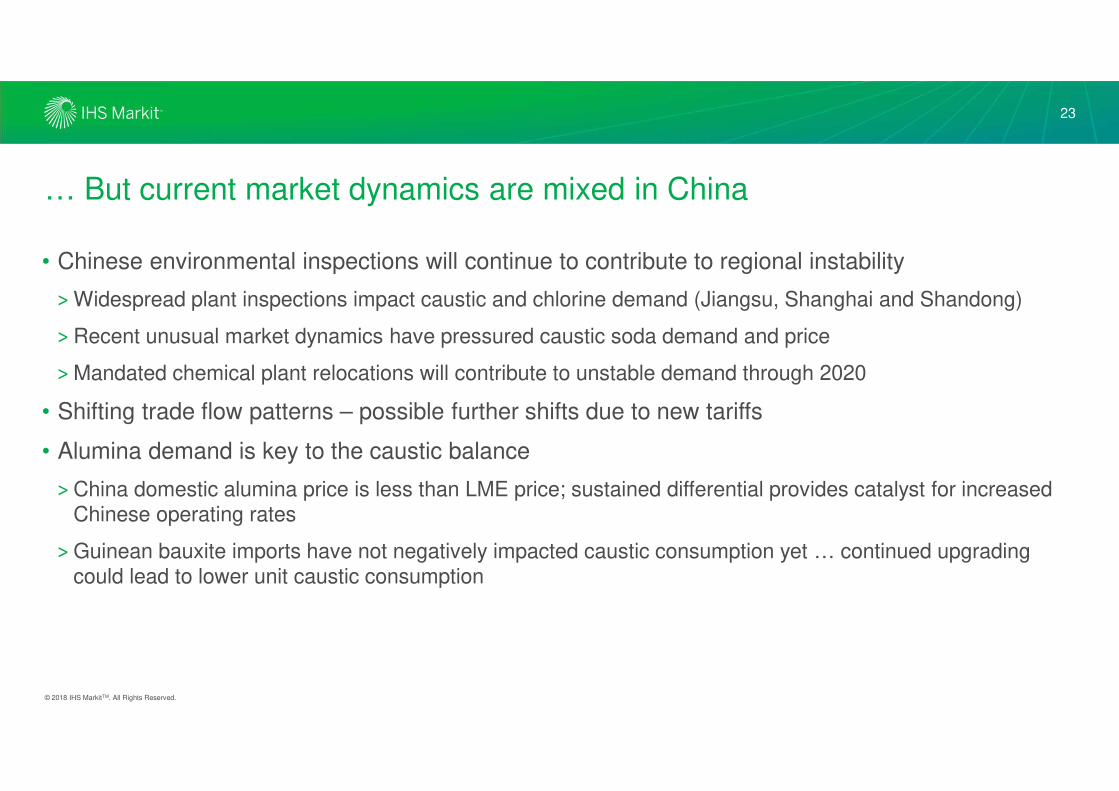
… But current market dynamics are mixed in China
• Chinese environmental inspections will continue to contribute to regional instability
> Widespread plant inspections impact caustic and chlorine demand (Jiangsu, Shanghai and Shandong)
> Recent unusual market dynamics have pressured caustic soda demand and price
> Mandated chemical plant relocations will contribute to unstable demand through 2020
• Shifting trade flow patterns – possible further shifts due to new tariffs
• Alumina demand is key to the caustic balance
> China domestic alumina price is less than LME price; sustained differential provides catalyst for increased Chinese operating rates
> Guinean bauxite imports have not negatively impacted caustic consumption yet … continued upgrading could lead to lower unit caustic consumption
23
© 2018 IHS MarkitTM. All Rights Reserved.
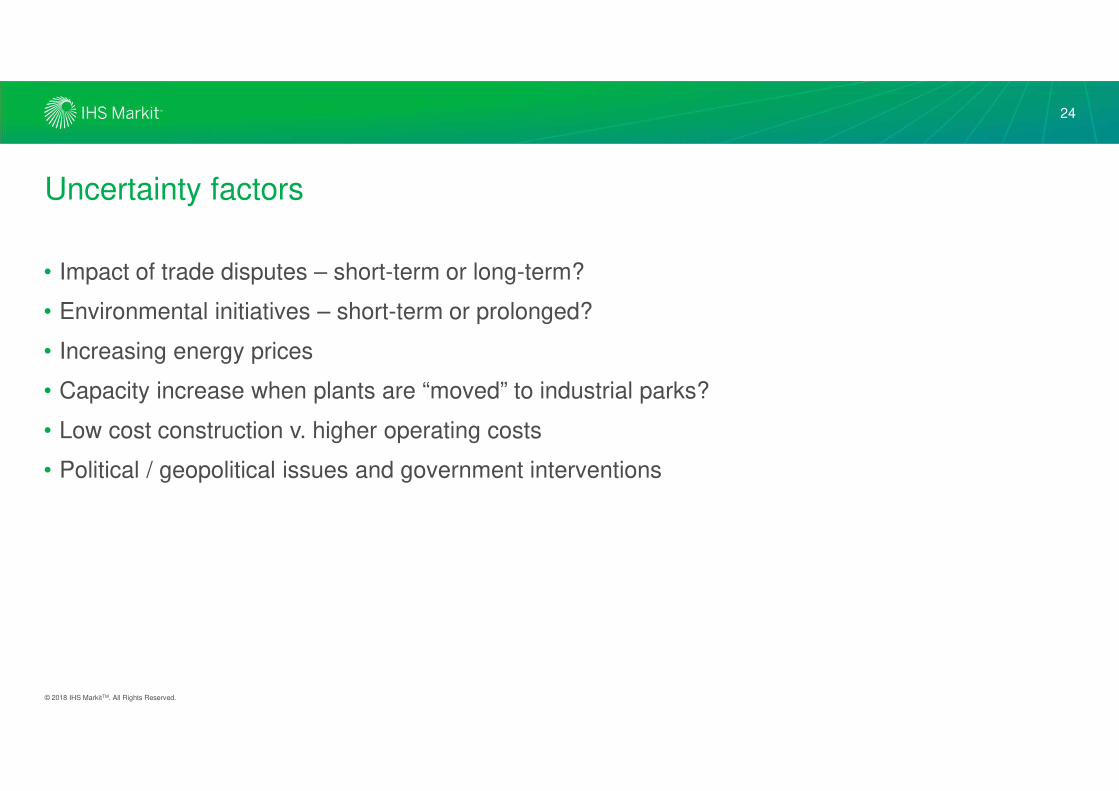
Uncertainty factors
• Impact of trade disputes – short-term or long-term?
• Environmental initiatives – short-term or prolonged?
• Increasing energy prices
• Capacity increase when plants are “moved” to industrial parks?
• Low cost construction v. higher operating costs
• Political / geopolitical issues and government interventions
24

© 2018 IHS MarkitTM. All Rights Reserved.
Northeast Asia caustic demand for alumina production continues to grow
0,0
4,0
8,0
12,0
16,0
20,0
0
20
40
60
80
100
2013 2014 2015 2016 2017 2018 2019 2020 2021 2022 2023
Alumina Production Alumina Capacity Forecast Alumina Capacity Caustic soda Consumption
AL
UM
INA
CA
PA
CIT
Y &
P
RO
DU
CT
ION
M
ILL
ION
MT
CA
US
TIC
CO
NS
UM
PT
ION
, M
ILL
ION
DM
T
NEA Alumina Production & Caustic Demand
Source: IHS Markit Chlor-alkali World Analysis 2019 © 2018 IHS Markit
• New alumina capacity must be added to meet global aluminum demand growth
• Forecast new alumina capacity adds 2.7 Million dmt caustic demand
25

© 2018 IHS MarkitTM. All Rights Reserved.
NEA caustic exports rise in 2019, then decline as Chinese operating rates increase
0
1
2
3
4
5
2013 2014 2015 2016 2017 2018 2019 2020 2021 2022 2023
China Japan Korea Taiwan
NEA Caustic Soda Export Volume
Source: IHS Markit Chlor-alkali World Analysis 2019 © 2018 IHS Markit
EX
PO
RT
, M
ILL
ION
DM
T
26

© 2018 IHS MarkitTM. All Rights Reserved.
Northeast Asia operating rates rise to unprecedented levels
70
75
80
85
90
95
0
15
30
45
60
75
2013 2014 2015 2016 2017 2018 2019 2020 2021 2022 2023
Capacity Projected Capacity Demand Operating Rate
CA
PA
CIT
Y,
MIL
LIO
N D
MT
OP
ER
AT
ING
RA
TE
NEA Caustic Soda Supply / Demand and Operating Rate
Source: IHS Markit Chlor-alkali World Analysis 2019 © 2018 IHS Markit
27

© 2018 IHS MarkitTM. All Rights Reserved.
Capacity
Production
Operating Rates
• Potential for small plant closures in China; some increase in India
• Seasonal variations in operating rates; Northeast Asia operating rates go from 86% in2018 to 94% in 2022
• Production rises with operating rates
• Exports rise, but then decrease when constrained by high operating rates needed toaccommodate domestic growth
Prices&
Margins
• Increasing demand, especially as caustic consumption rises faster than chlorine with nosignificant capacity increases, will push prices up. Some seasonality of caustic pricingmay occur.
• ECU margin increase is countered by energy cost increases
Scoreboard
•
DomesticDemand,
AAGR
NEA SEA ISC
Chlorine 2.9% 0.7% 5.8%
Caustic 3.1% 2.2% 5.1%
Asia market outlook summary
• Overall caustic demand growth rate exceeds chlorine demand growth rate
28
Confidential. © 2018 IHS MarkitTM. All Rights Reserved.
Summary
29

© 2018 IHS MarkitTM. All Rights Reserved.
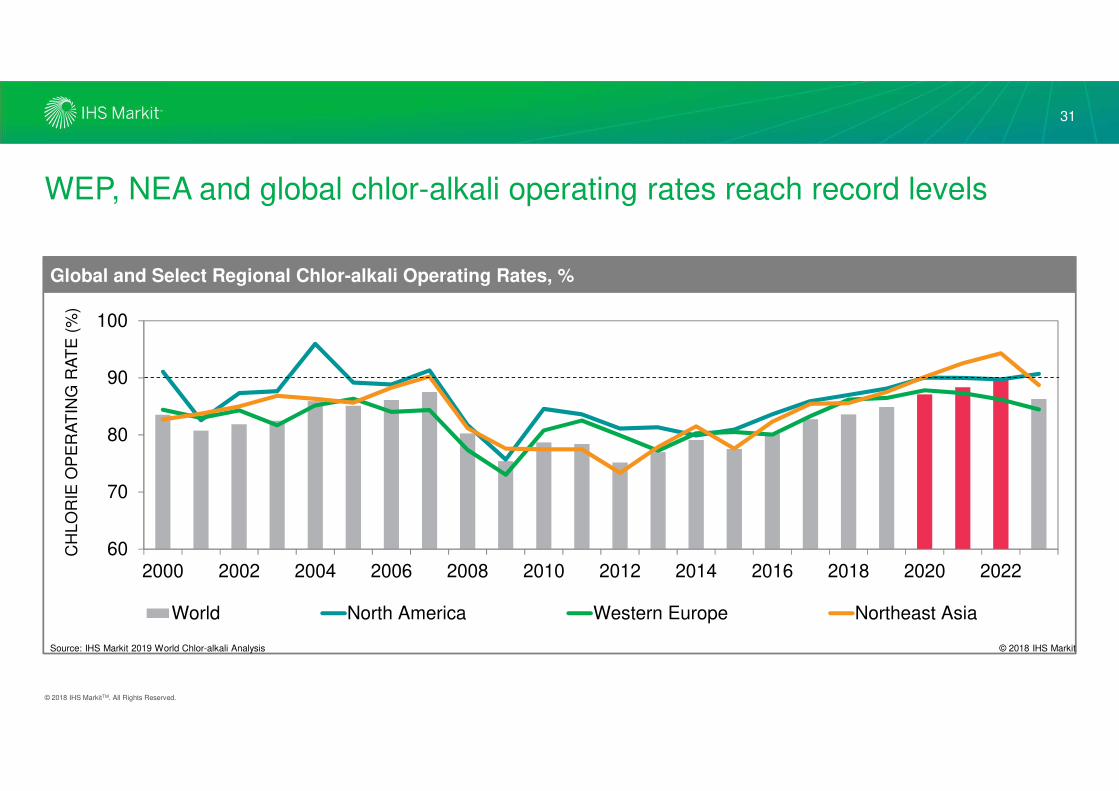
Globally, the 5-year demand growth trajectory continues to support increasing operating rates
• GDP growth rate > 2.9 AAGR through 2020 supports healthy manufacturing and key consumables demand growth
• IHS Markit projects ~ 2.3-2.4% global demand AAGR for chlorine and caustic through 2020
• 2018 global chlor-alkali operating rate is ~ 84%, with significant differences by region
• Cycle peak operating rates are still projected in 2021-2022
• Global cycle peak operating rate exceeds all prior global operating rates since 1990, including historic 2007 peak of 89%.
30
50%
60%
70%
80%
90%
100%
0,0
25,0
50,0
75,0
100,0
125,0
13 14 15 16 17 18 19 20 21 22 23 28
Demand (3.3/2.2) Total Capacity (1.4/1.7) Operating Rate
World: Caustic Soda Supply & Demand
Source: IHS Markit World Analysis 2019 © 2018 IHS Markit
Forecast
OP
ER
AT
ING
RA
TE
MIL
LIO
N D
RY
ME
TR
IC T
ON
S
© 2018 IHS MarkitTM. All Rights Reserved.
WEP, NEA and global chlor-alkali operating rates reach record levels
60
70
80
90
100
2000 2002 2004 2006 2008 2010 2012 2014 2016 2018 2020 2022
World North America Western Europe Northeast Asia
Global and Select Regional Chlor-alkali Operating Rates, %
© 2018 IHS Markit
CH
LO
RIE
OP
ER
AT
ING
RA
TE
(%
)
Source: IHS Markit 2019 World Chlor-alkali Analysis
31

© 2018 IHS MarkitTM. All Rights Reserved.
Relative investment costs influence capacity addition geography
Construction Location Factors (2016)
USGC
1.00
NAM (ex UGGC)
1.03 - 1.16
SAM
0.91 - 1.15
CEP
0.75-0.82WEP
0.99-1.04
FSU
1.05 - 1.25
AFR
0.90 - 0.95
MDE
0.75 - 1.19
China
0.53 to 0.68?
NEA (ex. China)
0.82 – 0.95
SEA
0.85 - 1.10
Source: IHS Markit 2016 © 2018 IHS Markit
32
© 2018 IHS MarkitTM. All Rights Reserved.
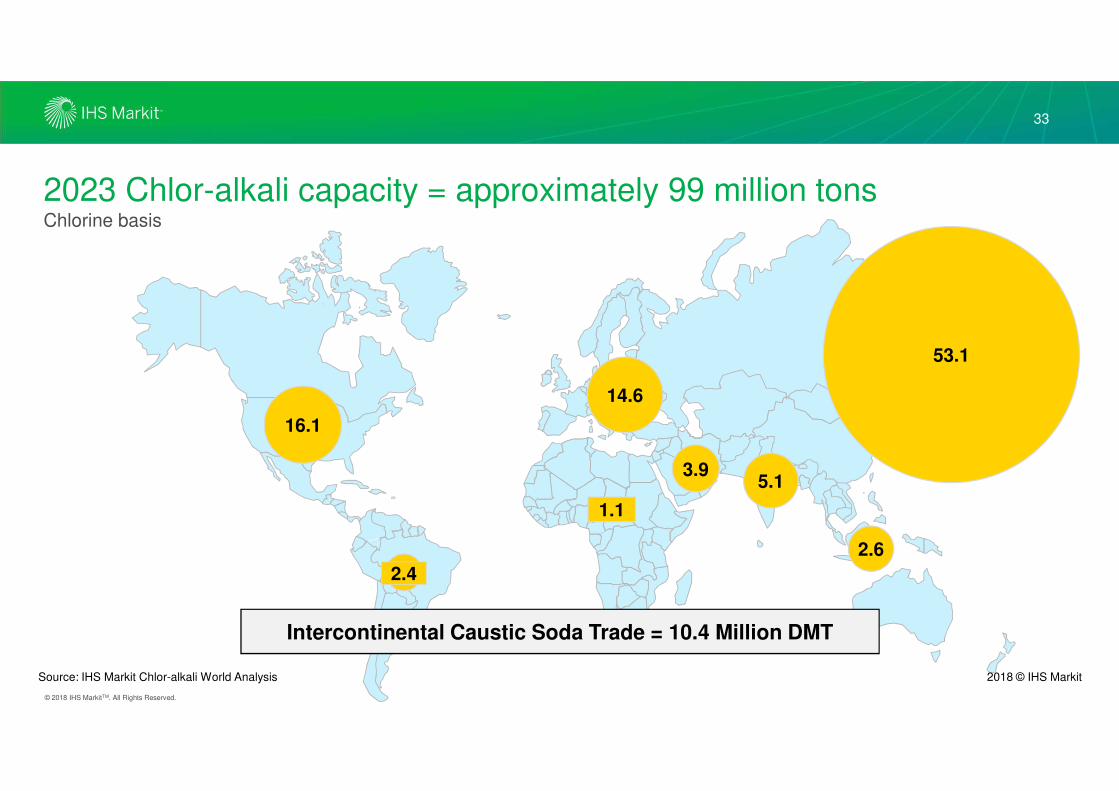
2023 Chlor-alkali capacity = approximately 99 million tons Chlorine basis
53.1
14.6
5.13.9
2.6
2.4
Source: IHS Markit Chlor-alkali World Analysis 2018 © IHS Markit
1.1
Intercontinental Caustic Soda Trade = 10.4 Million DMT
16.1
33
IHS Markit Customer Care
Americas: +1 800 IHS CARE (+1 800 447 2273)
Europe, Middle East, and Africa: +44 (0) 1344 328 300
Asia and the Pacific Rim: +604 291 3600
DisclaimerThe information contained in this presentation is confidential. Any unauthorized use, disclosure, reproduction, or dissemination, in full or in part, in any media or by any means, without the prior written permission of IHS Markit Ltd. or any of its affiliates ("IHS Markit") is strictly prohibited. IHS Markit owns all IHS Markit logos and trade names contained in this presentation that are subject to license. Opinions, statements, estimates, and projections in this presentation (including other media) are solely those of the individual author(s) at the time of writing and do not necessarily reflect the opinions of IHS Markit. Neither IHS Markit nor the author(s) has any obligation to update this presentation in the event that any content, opinion, statement, estimate, or projection (collectively, "information") changes or subsequently becomes inaccurate. IHS Markit makes no warranty, expressed or implied, as to the accuracy, completeness, or timeliness of any information in this presentation, and shall not in any way be liable to any recipient for any inaccuracies or omissions. Without limiting the foregoing, IHS Markit shall have no liability whatsoever to any recipient, whether in contract, in tort (including negligence), under warranty, under statute or otherwise, in respect of any loss or damage suffered by any recipient as a result of or in connection with any information provided, or any course of action determined, by it or any third party, whether or not based on any information provided. The inclusion of a link to an external website by IHS Markit should not be understood to be an endorsement of that website or the site's owners (or their products/services). IHS Markit is not responsible for either the content or output of external websites. Copyright © 2018, IHS MarkitTM. All rights reserved and all intellectual property rights are retained by IHS Markit.