global climate change and energy systems - center improve system operations (e.g., respond quickly...
TRANSCRIPT
Global Climate Change and Energy SystemsWorkshop for the Riverside Unified School District
Agenda:
Thursday, October 156:15pm Kawai Tam, Department of Chemical & Environmental Engineering: Sustainability
6:45pm Mirvat Ebrik, Sustainable Energy Systems Group at CE-CERT: Cellulosic Biomass to Ethanol
7:15pm Matthew Barth, Department of Electrical Engineering: Solar Energy Systems
7:45pm Tour of CE-CERT Labs
Thursday, October 226:15pm Matthew Barth, Transportation Systems Research Group at CE-CERT: Transportation
6:45pm David Cocker, Department of Chemical & Environmental Engineering: Atmospheric Particles
7:15pm Akua Asa-Awuku, Department of Chemical & Environmental Engineering: Climate
7:45pm Tour of CE-CERT Labs

“Green” Transportation SystemsMatthew Barth
Professor and DirectorCollege of Engineering-Center for Environmental Research and Technology
University of California-Riverside
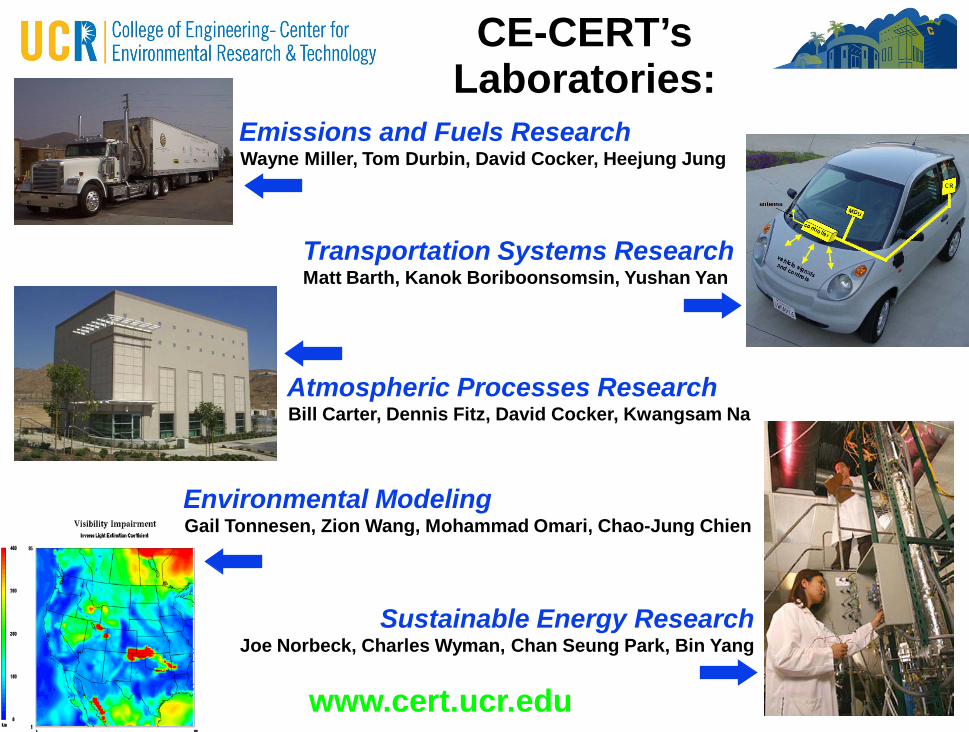
CE-CERT’sLaboratories:
Emissions and Fuels ResearchWayne Miller, Tom Durbin, David Cocker, Heejung Jung
Atmospheric Processes ResearchBill Carter, Dennis Fitz, David Cocker, Kwangsam Na
Transportation Systems Research Matt Barth, Kanok Boriboonsomsin, Yushan Yan
Sustainable Energy ResearchJoe Norbeck, Charles Wyman, Chan Seung Park, Bin Yang
Environmental ModelingGail Tonnesen, Zion Wang, Mohammad Omari, Chao-Jung Chien
www.cert.ucr.edu
0
50
100
150
200
250
19
76
19
77
19
78
19
79
19
80
19
81
19
82
19
83
19
84
19
85
19
86
19
87
19
88
19
89
19
90
19
91
19
92
19
93
19
94
19
95
19
96
19
97
19
98
19
99
Num
ber
of E
xcee
danc
es
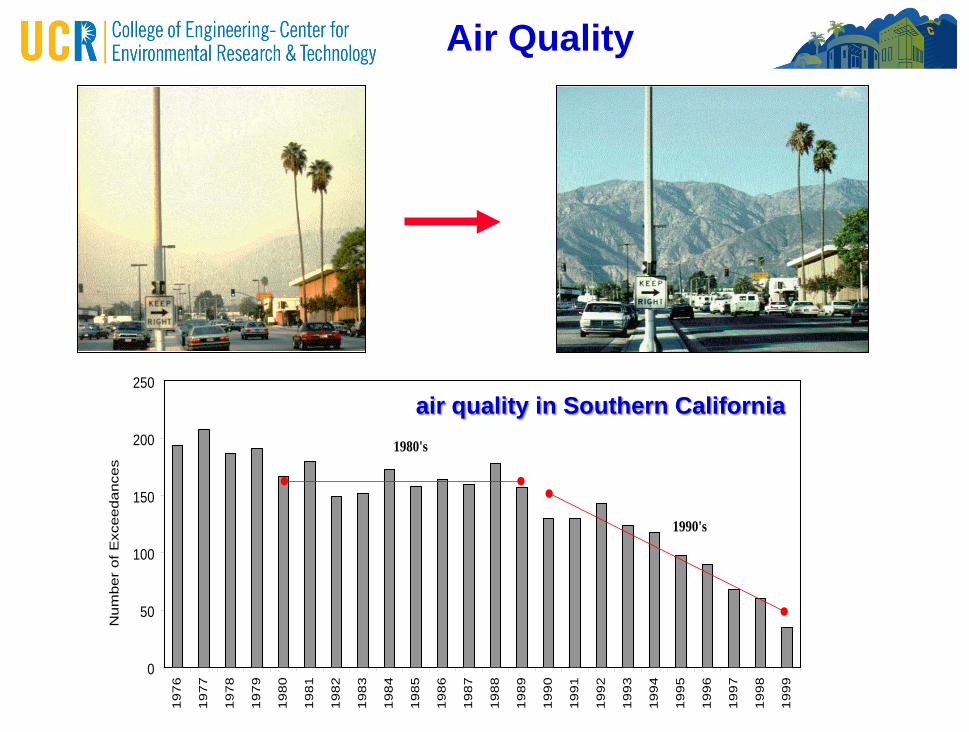
1980's
1990's
Air Quality
air quality in Southern California
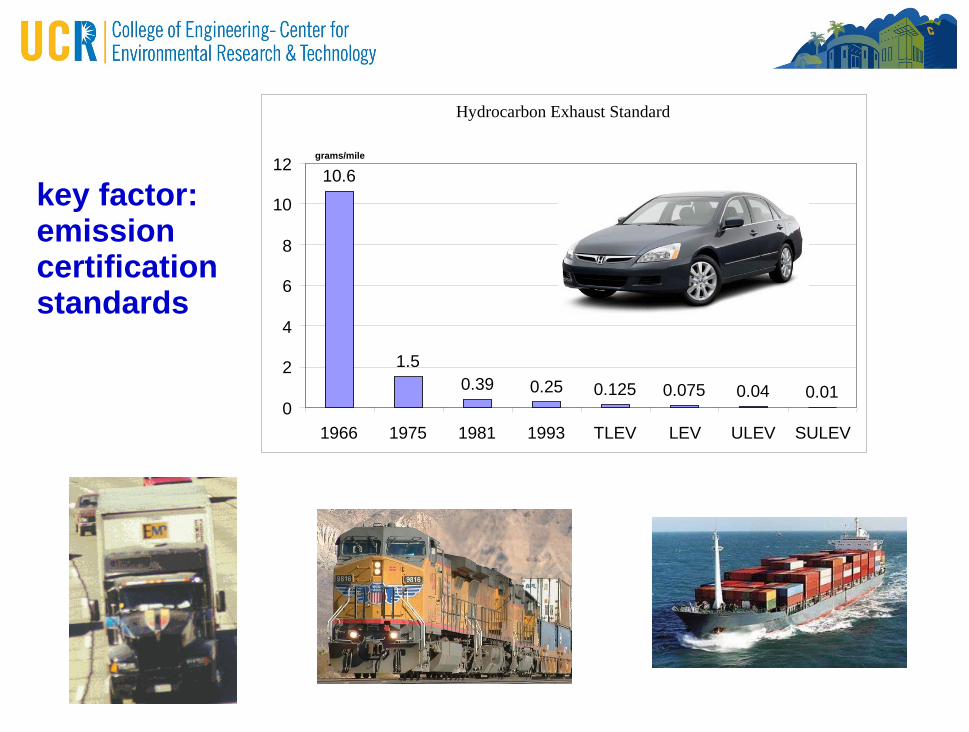
Hydrocarbon Exhaust Standard
10.6
1.50.39 0.25 0.125 0.075 0.04 0.01
0
2
4
6
8
10
12
1966 1975 1981 1993 TLEV LEV ULEV SULEV
grams/milegrams/mile
key factor:emission certification standards
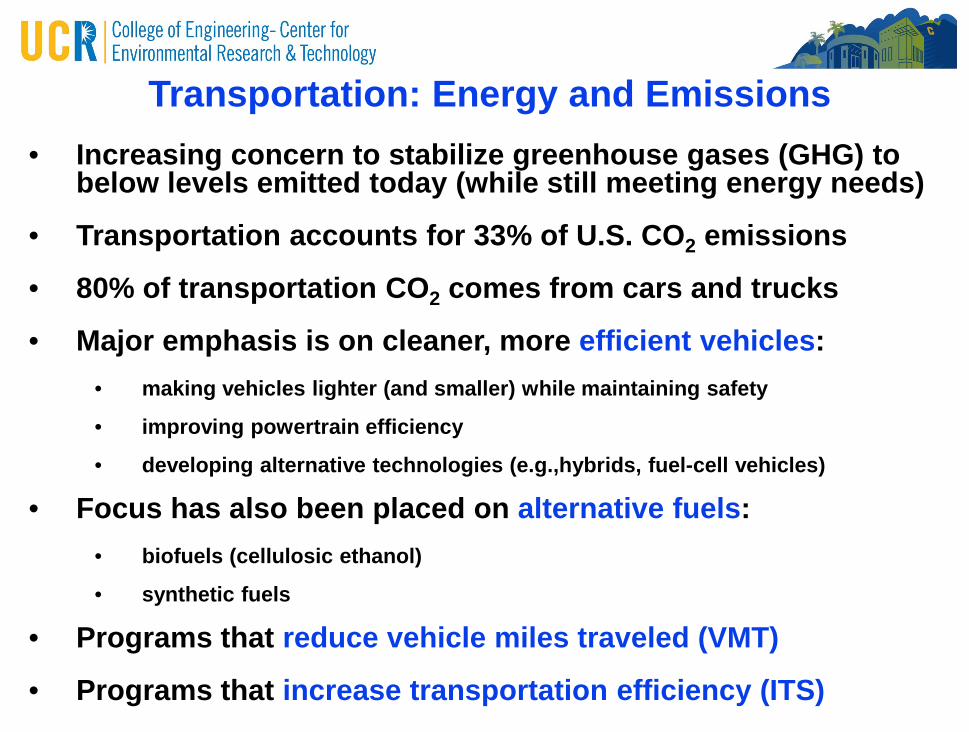
Transportation: Energy and Emissions• Increasing concern to stabilize greenhouse gases (GHG) to
below levels emitted today (while still meeting energy needs)
• Transportation accounts for 33% of U.S. CO2 emissions
• 80% of transportation CO2 comes from cars and trucks
• Major emphasis is on cleaner, more efficient vehicles:• making vehicles lighter (and smaller) while maintaining safety
• improving powertrain efficiency
• developing alternative technologies (e.g.,hybrids, fuel-cell vehicles)
• Focus has also been placed on alternative fuels:• biofuels (cellulosic ethanol)
• synthetic fuels
• Programs that reduce vehicle miles traveled (VMT)
• Programs that increase transportation efficiency (ITS)
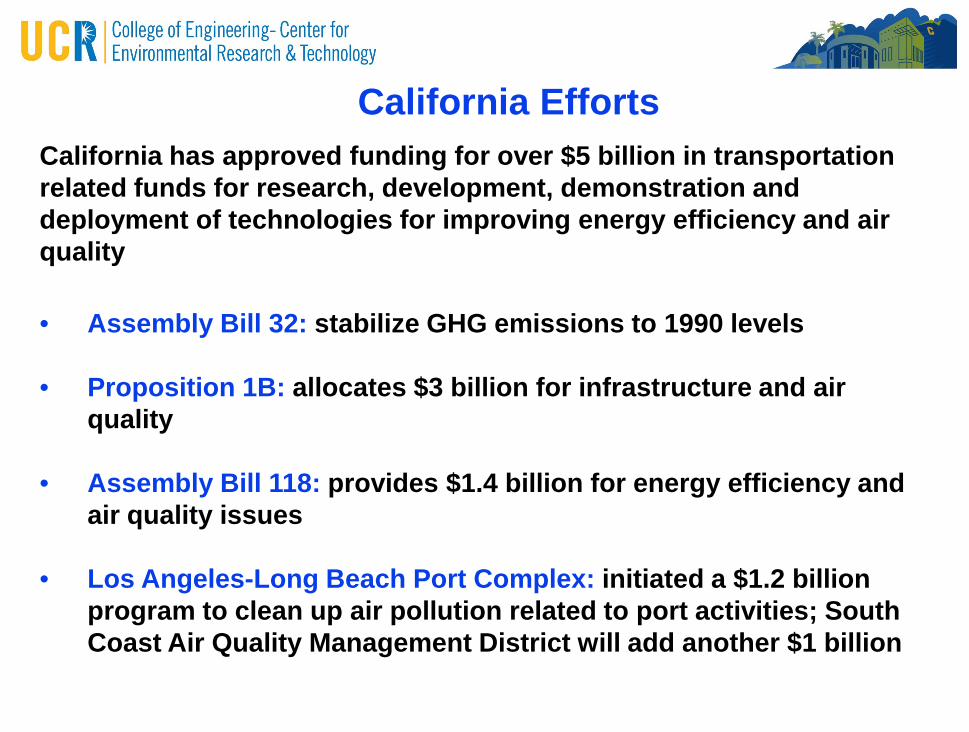
California has approved funding for over $5 billion in transportation related funds for research, development, demonstration and deployment of technologies for improving energy efficiency and air quality
• Assembly Bill 32: stabilize GHG emissions to 1990 levels
• Proposition 1B: allocates $3 billion for infrastructure and air quality
• Assembly Bill 118: provides $1.4 billion for energy efficiency and air quality issues
• Los Angeles-Long Beach Port Complex: initiated a $1.2 billion program to clean up air pollution related to port activities; South Coast Air Quality Management District will add another $1 billion
California Efforts

New Vehicle Technology
fuel cell vehicles (example: Honda Clarity)
battery electric vehicles (example: Mitsubishi)
hybrid vehicles (example: Ford Escape) plug-in hybrid vehicles (example: Chevy Volt)
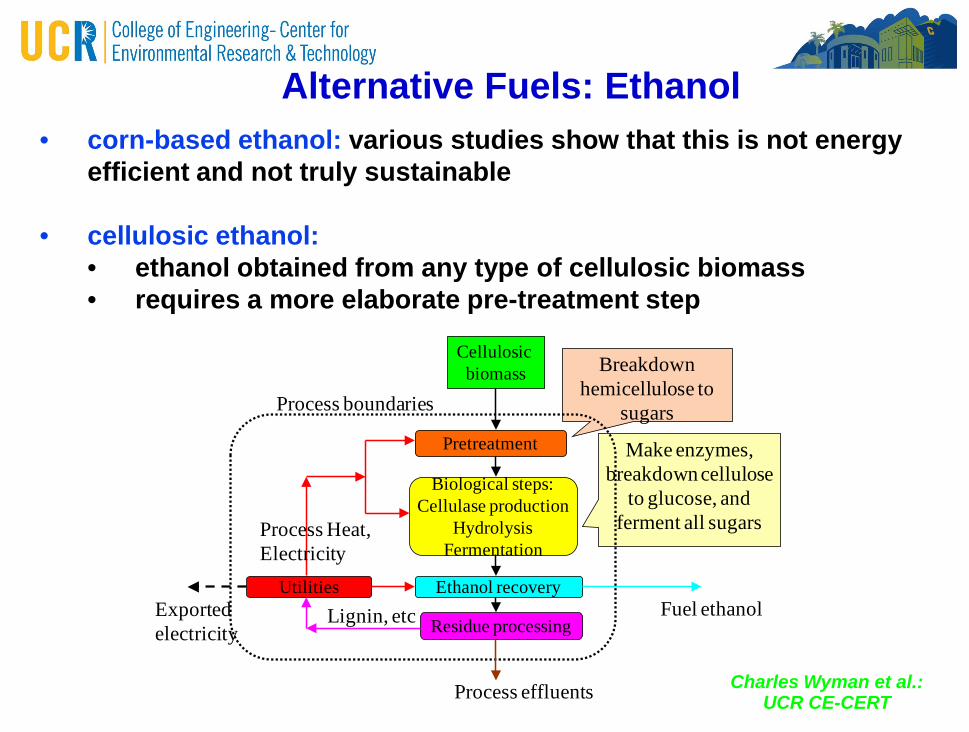
Alternative Fuels: Ethanol• corn-based ethanol: various studies show that this is not energy
efficient and not truly sustainable
• cellulosic ethanol:• ethanol obtained from any type of cellulosic biomass• requires a more elaborate pre-treatment step
Breakdown hemicellulose to
sugars
Make enzymes, breakdown cellulose
to glucose, and ferment all sugars
Biological steps:Cellulase production
HydrolysisFermentation
Cellulosic biomass
Pretreatment
Ethanol recovery
Residue processing
UtilitiesFuel ethanol
Process effluents
Exportedelectricity
Process boundaries
Lignin, etc
Process Heat, Electricity
Charles Wyman et al.:UCR CE-CERT
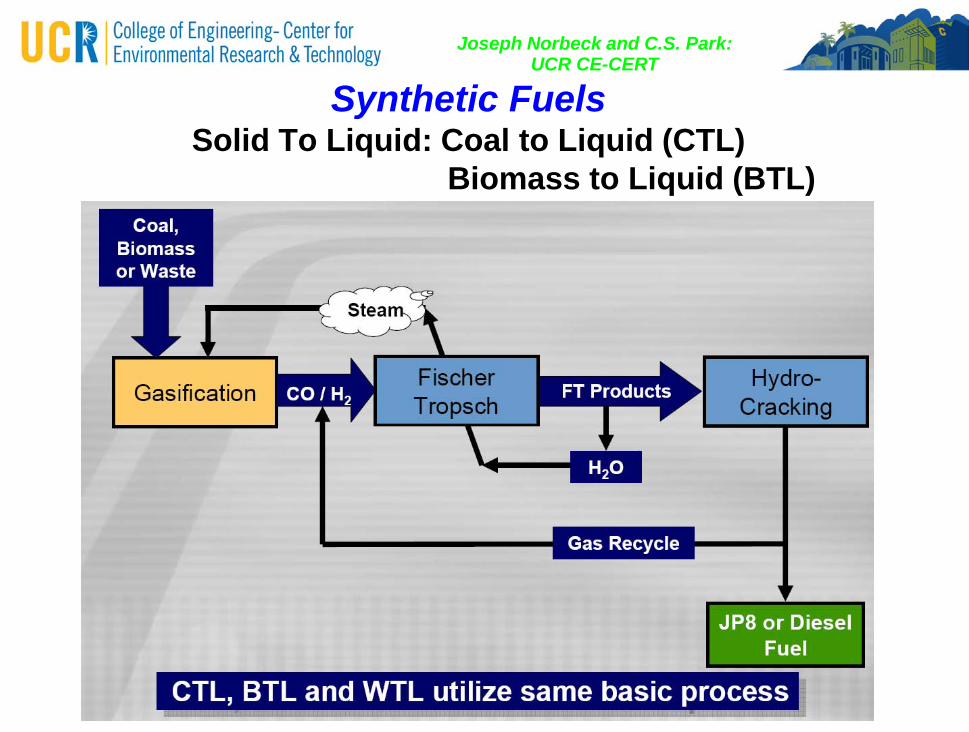
Synthetic FuelsSolid To Liquid: Coal to Liquid (CTL)
Biomass to Liquid (BTL)
Joseph Norbeck and C.S. Park:UCR CE-CERT
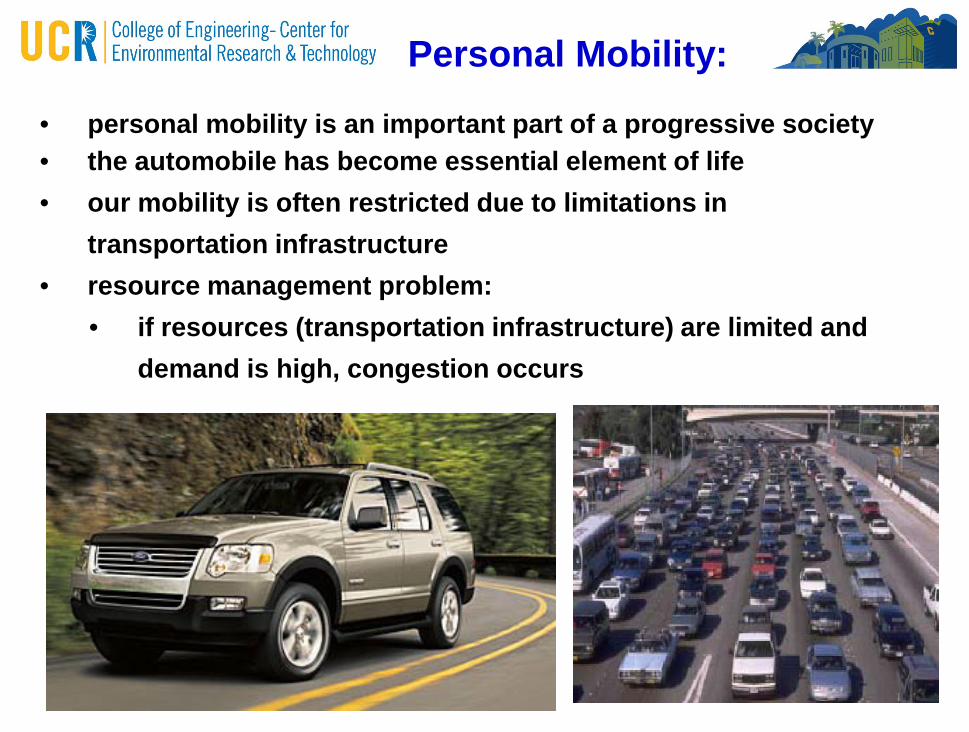
Personal Mobility:
• personal mobility is an important part of a progressive society• the automobile has become essential element of life• our mobility is often restricted due to limitations in
transportation infrastructure• resource management problem:
• if resources (transportation infrastructure) are limited and demand is high, congestion occurs

Roadway Congestion: impacts on energy and emissions
• Texas Transportation Institute Annual Mobility Study:• http://mobility.tamu.edu/ums• congestion has grown everywhere in areas of all sizes• congestion occurs during longer portions of the day and delays more travelers
and goods than ever before• billions of gallons of fuel are wasted every year, more emissions
“slow speeds caused by heavy traffic and/or narrow roadways due to construction, incidents, or too few lanes for the demand”
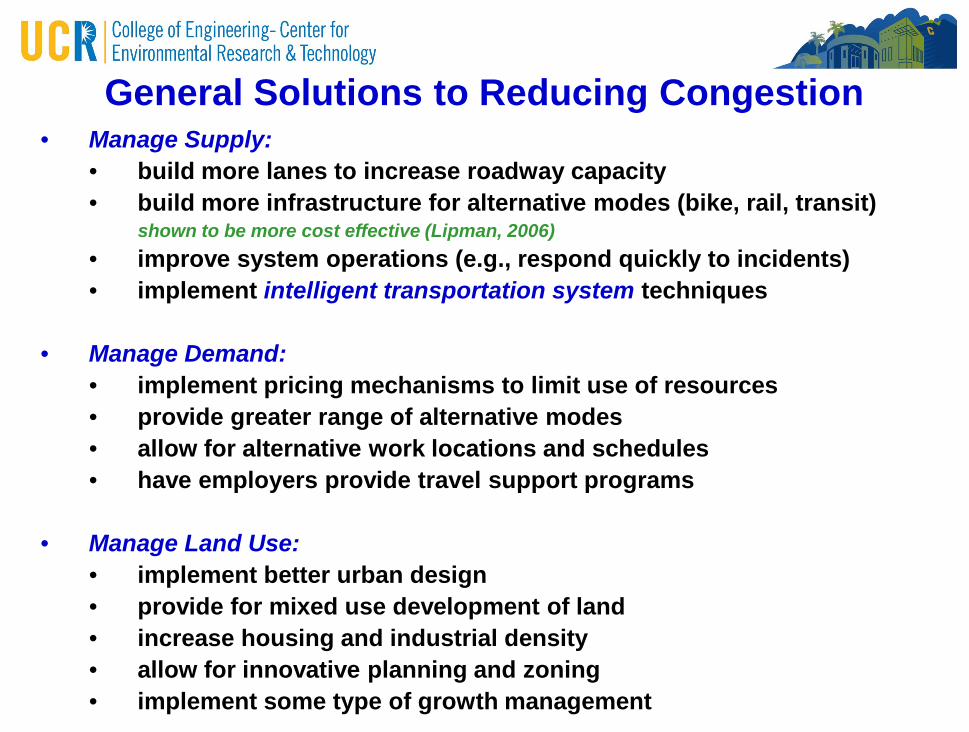
General Solutions to Reducing Congestion• Manage Supply:
• build more lanes to increase roadway capacity• build more infrastructure for alternative modes (bike, rail, transit)
shown to be more cost effective (Lipman, 2006)• improve system operations (e.g., respond quickly to incidents)• implement intelligent transportation system techniques
• Manage Demand:• implement pricing mechanisms to limit use of resources• provide greater range of alternative modes• allow for alternative work locations and schedules• have employers provide travel support programs
• Manage Land Use:• implement better urban design• provide for mixed use development of land• increase housing and industrial density• allow for innovative planning and zoning• implement some type of growth management
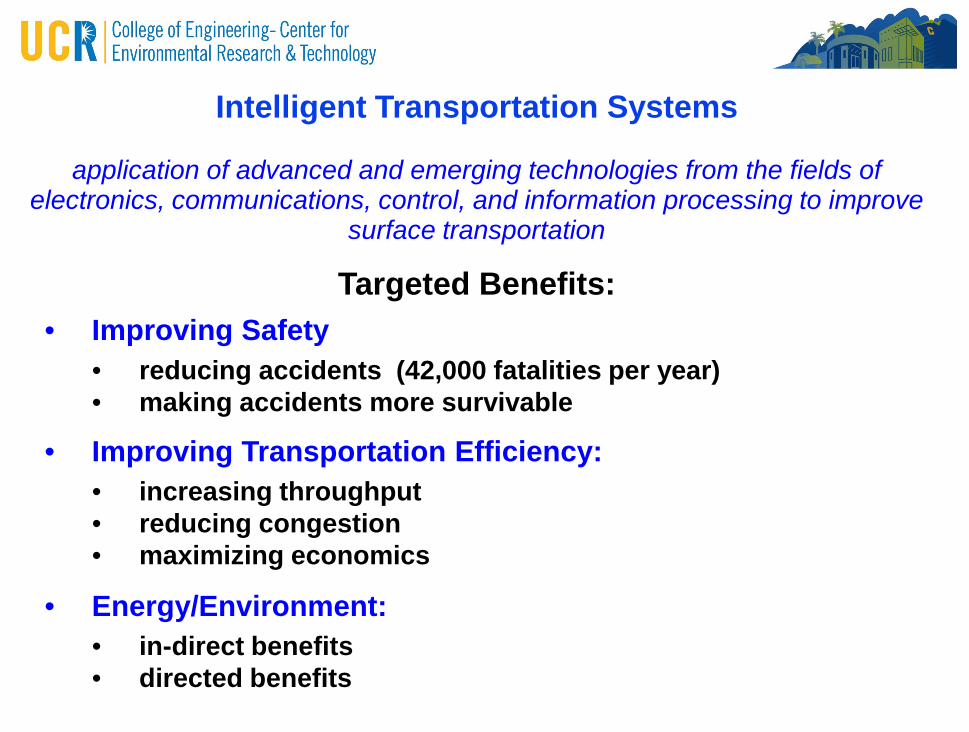
Intelligent Transportation Systems
application of advanced and emerging technologies from the fields of electronics, communications, control, and information processing to improve
surface transportation
Targeted Benefits:• Improving Safety
• reducing accidents (42,000 fatalities per year)• making accidents more survivable
• Improving Transportation Efficiency:• increasing throughput• reducing congestion• maximizing economics
• Energy/Environment:• in-direct benefits• directed benefits
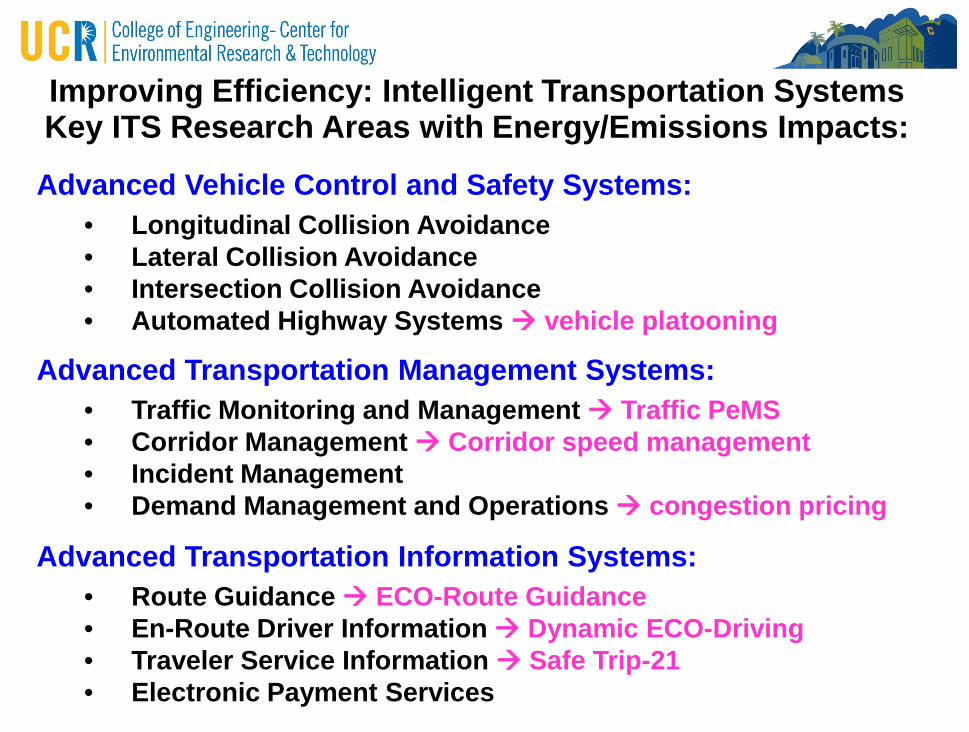
Improving Efficiency: Intelligent Transportation SystemsKey ITS Research Areas with Energy/Emissions Impacts:
Advanced Vehicle Control and Safety Systems:• Longitudinal Collision Avoidance• Lateral Collision Avoidance• Intersection Collision Avoidance• Automated Highway Systems vehicle platooning
Advanced Transportation Management Systems:• Traffic Monitoring and Management Traffic PeMS• Corridor Management Corridor speed management• Incident Management• Demand Management and Operations congestion pricing
Advanced Transportation Information Systems:• Route Guidance ECO-Route Guidance• En-Route Driver Information Dynamic ECO-Driving• Traveler Service Information Safe Trip-21• Electronic Payment Services
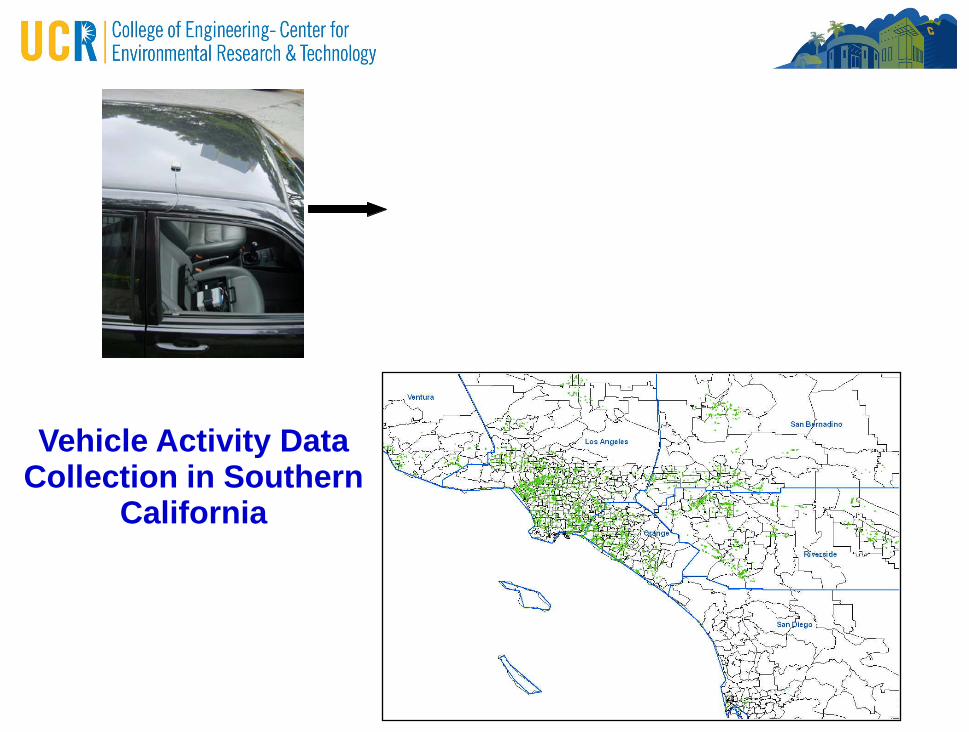
Vehicle Activity Data Collection in Southern
California
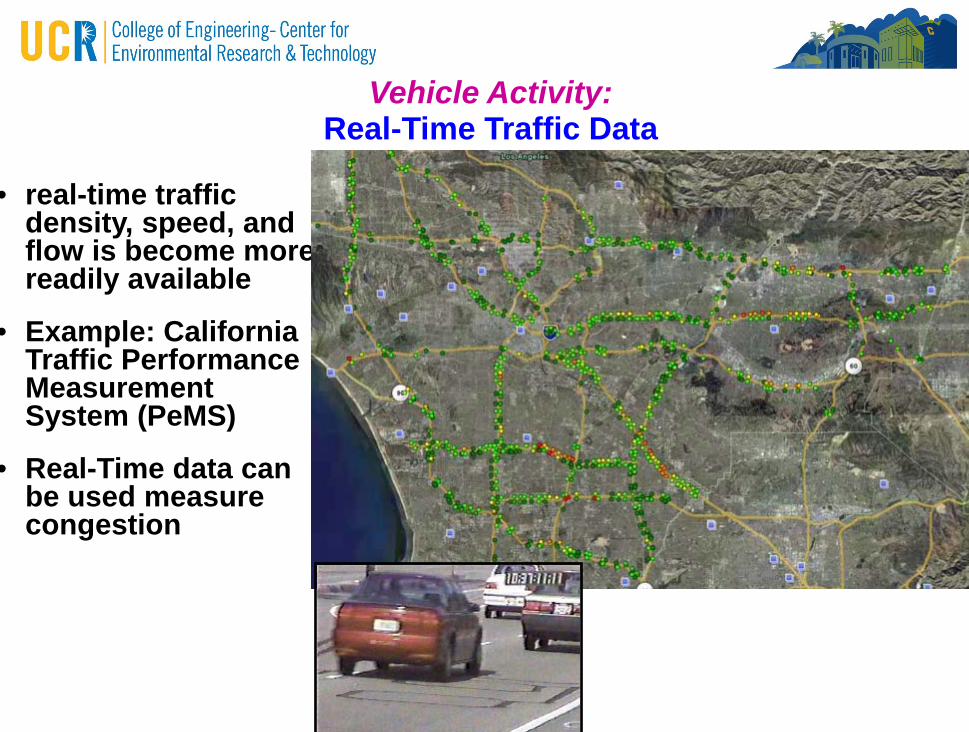
Vehicle Activity:Real-Time Traffic Data
• real-time traffic density, speed, and flow is become more readily available
• Example: California Traffic Performance Measurement System (PeMS)
• Real-Time data can be used measure congestion

CO2 Emissions as a Function of Average Traffic Speed
velvel
timetime
Vehicle Activity Vehicle Activity Database containing Database containing
sample vehicle velocity sample vehicle velocity trajectoriestrajectories
CMEMCMEM(microscopic fuel (microscopic fuel
consumption/emissions consumption/emissions model)model)
vehicle/technology vehicle/technology category selectioncategory selection
0
200
400
600
800
1000
1200
1400
1600
1800
2000
0 5 10 15 20 25 30 35 40 45 50 55 60 65 70 75 80 85 90
Average Speed (mph)
CO
2 (g/
mi)
Real-world activity
Steady-state activity
ln(y) = b0 + b1·x + b2·x2 + b3·x3 + b4·x4
Methodology:
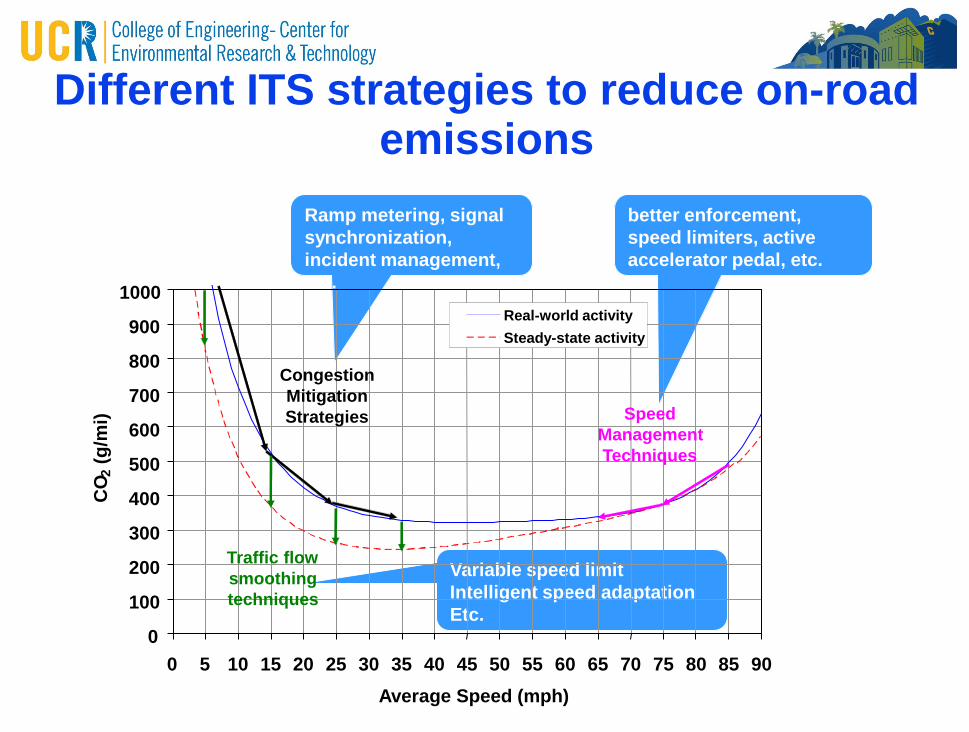
Different ITS strategies to reduce on-road emissions
Ramp metering, signal synchronization, incident management, etc.
better enforcement, speed limiters, active accelerator pedal, etc.
Variable speed limitIntelligent speed adaptationEtc.
0
100
200
300
400
500
600
700
800
900
1000
0 5 10 15 20 25 30 35 40 45 50 55 60 65 70 75 80 85 90Average Speed (mph)
CO 2
(g/m
i)
Real-world activitySteady-state activity
Congestion Mitigation Strategies
Traffic flow smoothing techniques
Speed Management Techniques
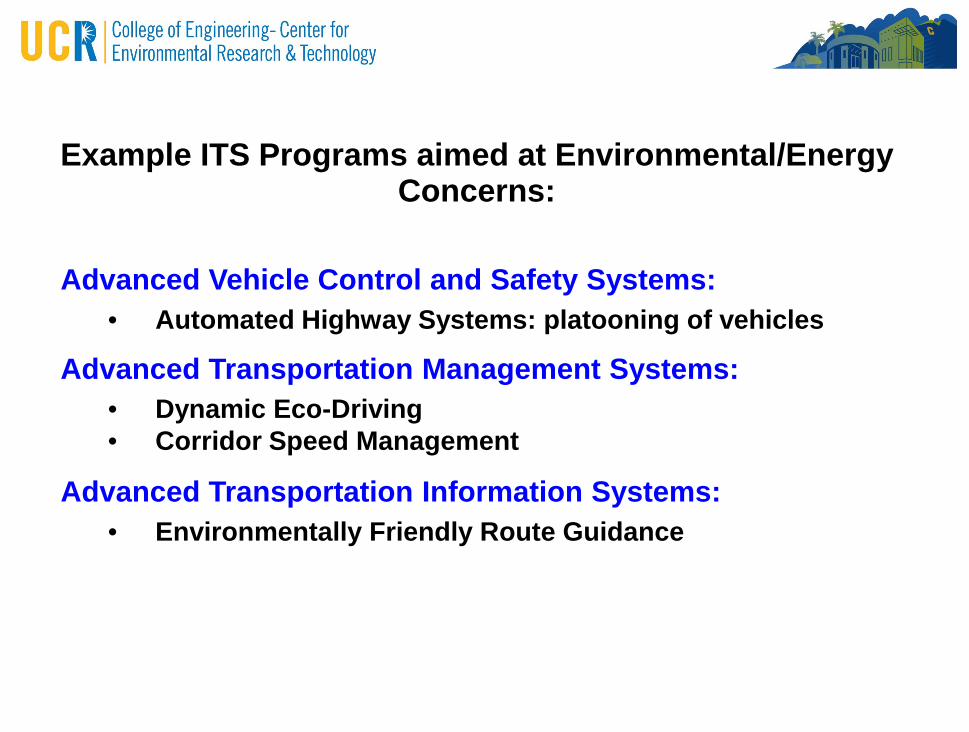
Example ITS Programs aimed at Environmental/Energy Concerns:
Advanced Vehicle Control and Safety Systems:• Automated Highway Systems: platooning of vehicles
Advanced Transportation Management Systems:• Dynamic Eco-Driving• Corridor Speed Management
Advanced Transportation Information Systems:• Environmentally Friendly Route Guidance
0
20
40
60
80
100
120
140
160
180
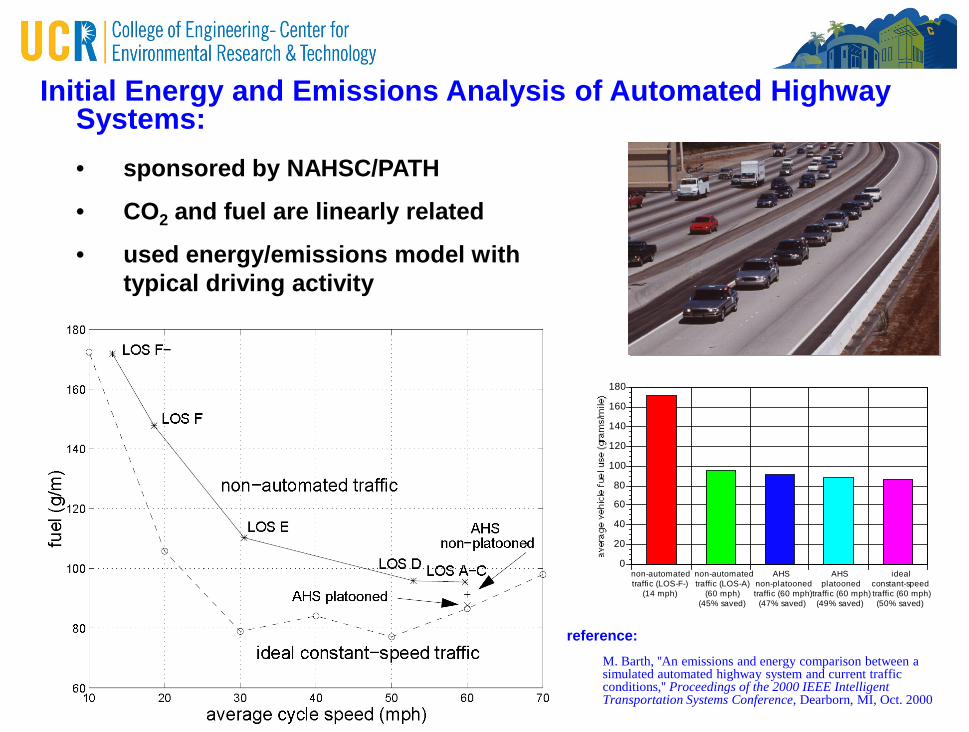
non-automatedtraffic (LOS-F-)
(14 mph)
non-automatedtraffic (LOS-A)
(60 mph)(45% saved)
AHSnon-platoonedtraffic (60 mph)
(47% saved)
AHSplatooned
traffic (60 mph)(49% saved)
idealconstant-speedtraffic (60 mph)(50% saved)
Initial Energy and Emissions Analysis of Automated Highway Systems:• sponsored by NAHSC/PATH
• CO2 and fuel are linearly related
• used energy/emissions model withtypical driving activity
reference:M. Barth, ''An emissions and energy comparison between a simulated automated highway system and current traffic conditions,'' Proceedings of the 2000 IEEE Intelligent Transportation Systems Conference, Dearborn, MI, Oct. 2000
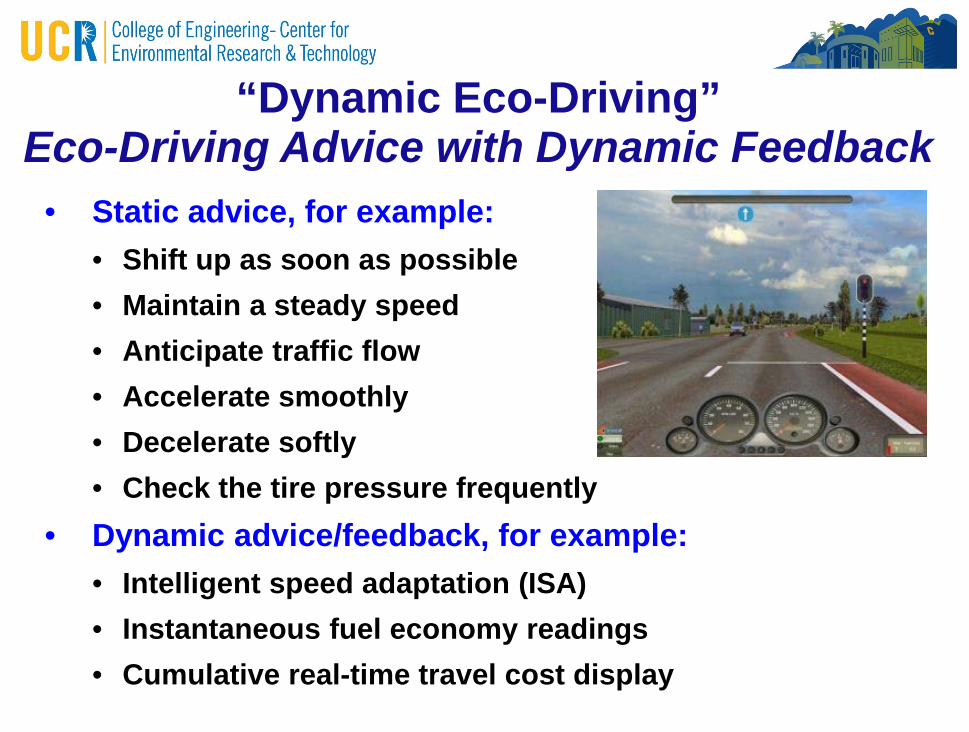
“Dynamic Eco-Driving”Eco-Driving Advice with Dynamic Feedback
• Static advice, for example:• Shift up as soon as possible• Maintain a steady speed• Anticipate traffic flow• Accelerate smoothly• Decelerate softly• Check the tire pressure frequently
• Dynamic advice/feedback, for example:• Intelligent speed adaptation (ISA)• Instantaneous fuel economy readings• Cumulative real-time travel cost display
0
20
40
60
80
100
120
0 1 2 3 4 5 6 7 8 9 10 1
Distance Traveled, km
Veh
icle
Spe
ed, k
m/h
Non-ISA ISA ISA Maximum Recommended Speed
1 12 13 14 15 16 17 18 19 20 21 22
Distance Traveled, km
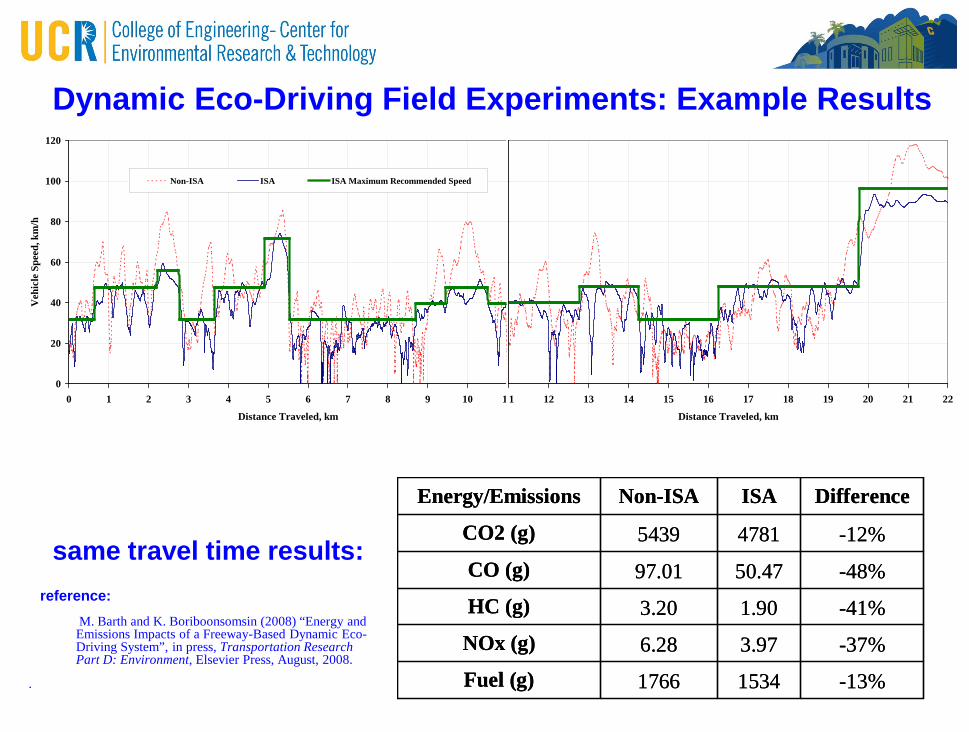
Dynamic Eco-Driving Field Experiments: Example Results
same travel time results:
-13%15341766Fuel (g)-37%3.976.28NOx (g)-41%1.903.20HC (g)-48%50.4797.01CO (g)-12%47815439CO2 (g)
DifferenceISANon-ISAEnergy/Emissions
-13%15341766Fuel (g)-37%3.976.28NOx (g)-41%1.903.20HC (g)-48%50.4797.01CO (g)-12%47815439CO2 (g)
DifferenceISANon-ISAEnergy/Emissions
reference:M. Barth and K. Boriboonsomsin (2008) “Energy and Emissions Impacts of a Freeway-Based Dynamic Eco-Driving System”, in press, Transportation Research Part D: Environment, Elsevier Press, August, 2008.
.
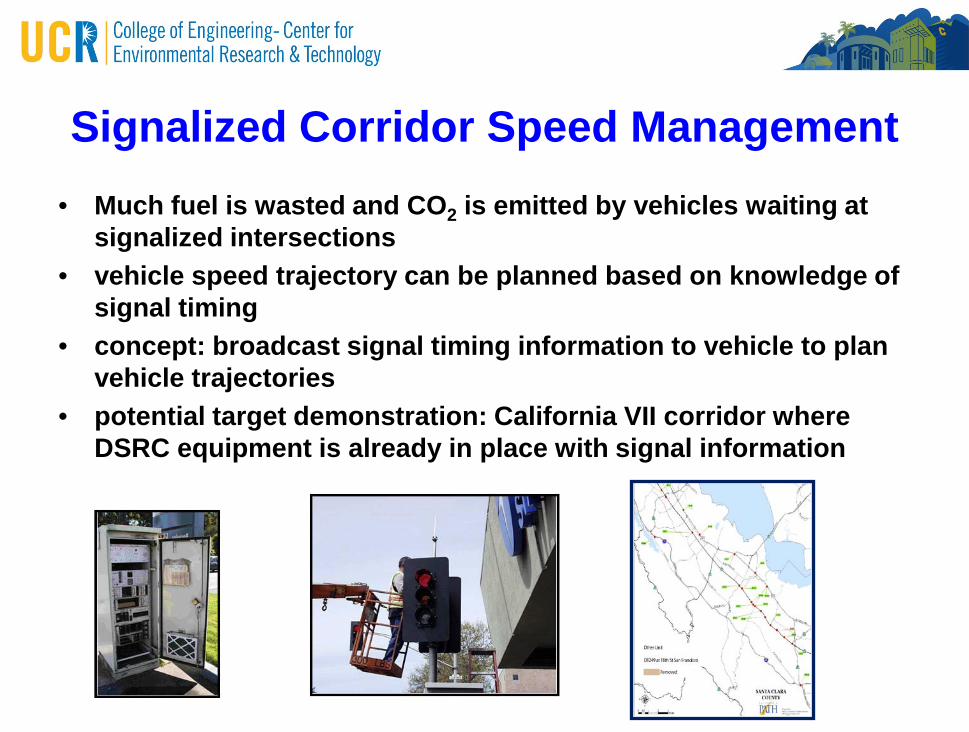
Signalized Corridor Speed Management• Much fuel is wasted and CO2 is emitted by vehicles waiting at
signalized intersections• vehicle speed trajectory can be planned based on knowledge of
signal timing• concept: broadcast signal timing information to vehicle to plan
vehicle trajectories• potential target demonstration: California VII corridor where
DSRC equipment is already in place with signal information

Single Intersection Optimization with Signal Phase and Timing Information
Distance
Speed
Vehicle 1 Vehicle 2
Vehicle 3 Vehicles
2 & 3
Phase 1 Accelerating
Phase 3 Decelerating
Phase 5 Accelerating
Phase 2 Cruising
Phase 4 Idling
Analysis boundary
DSRC Range (r)
LDV24 Fuel CO2 CO HC NOx
Vehicle 1 27.8 87.5 0.378 0.013 0.011 Vehicle 2 70.6 222.4 0.990 0.045 0.063 Vehicle 3 64.5 203.1 0.873 0.034 0.067 % 3 vs 2 -8.7 -8.7 -11.8 -24.8 +6.4
(2-1) 42.9 134.9 0.612 0.032 0.052 (3-1) 36.7 115.6 0.496 0.021 0.056
% (3-1) vs (2-1) -14.3 -14.3 -19.0 -34.7 +7.8
advanced signal information can help reduce intersection-influenced fuel consumption by 14% for cars and 12% for trucks
reference:M. Li et al., “Traffic Energy and Emission Reductions at Signalized Intersections: A Study of the Benefits of Advanced Driver Information”, submitted to International Journal on ITS, January, 2009.
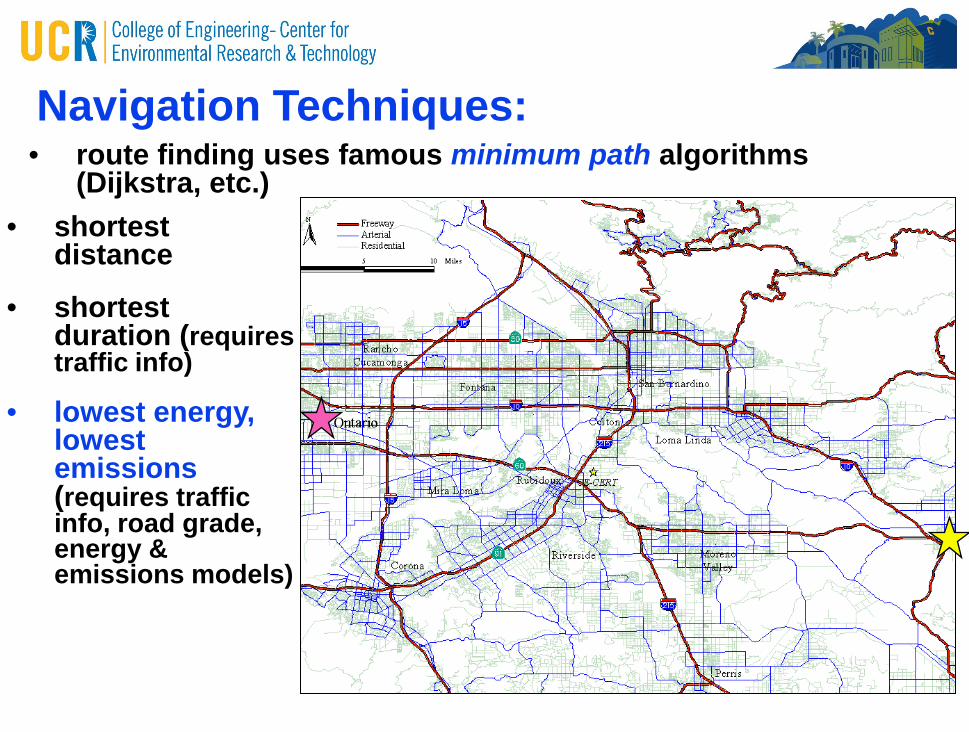
Navigation Techniques:• route finding uses famous minimum path algorithms
(Dijkstra, etc.)• shortest
distance
• shortest duration (requires traffic info)
• lowest energy, lowest emissions (requires traffic info, road grade, energy & emissions models)

New Navigation Tool: ECO-Routing:• shortest-distance or shortest-duration path will often
be the path that minimizes energy use or emissions• roadway congestion and other factors (e.g. grade) create scenarios where
minimum-energy and minimum-emissions path may be different than shortest duration or distance
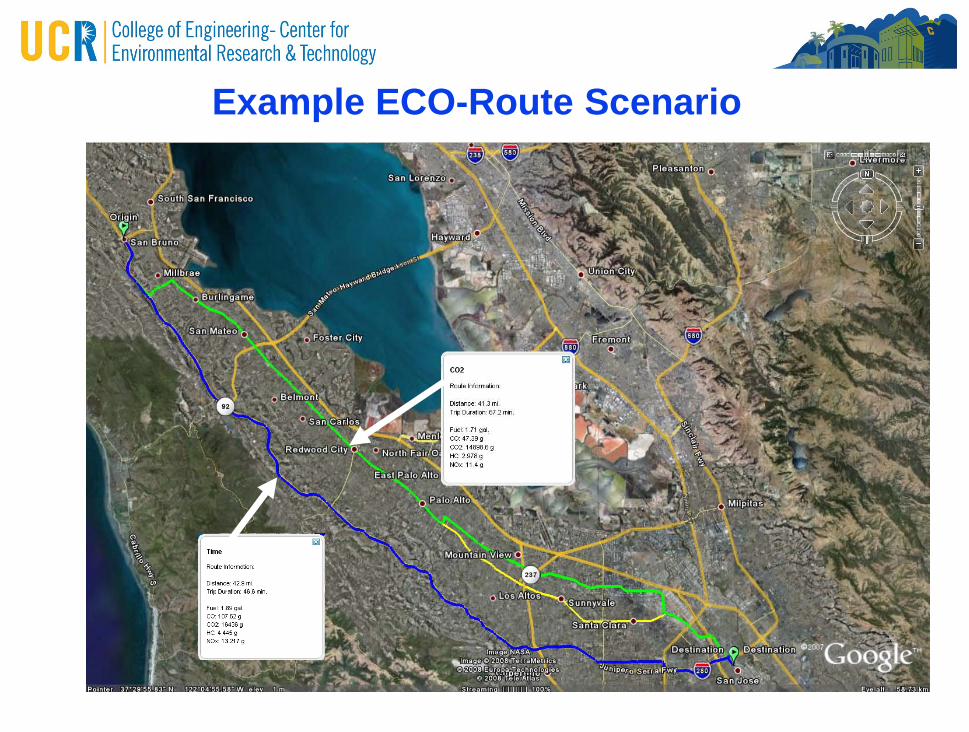
Example ECO-Route Scenario
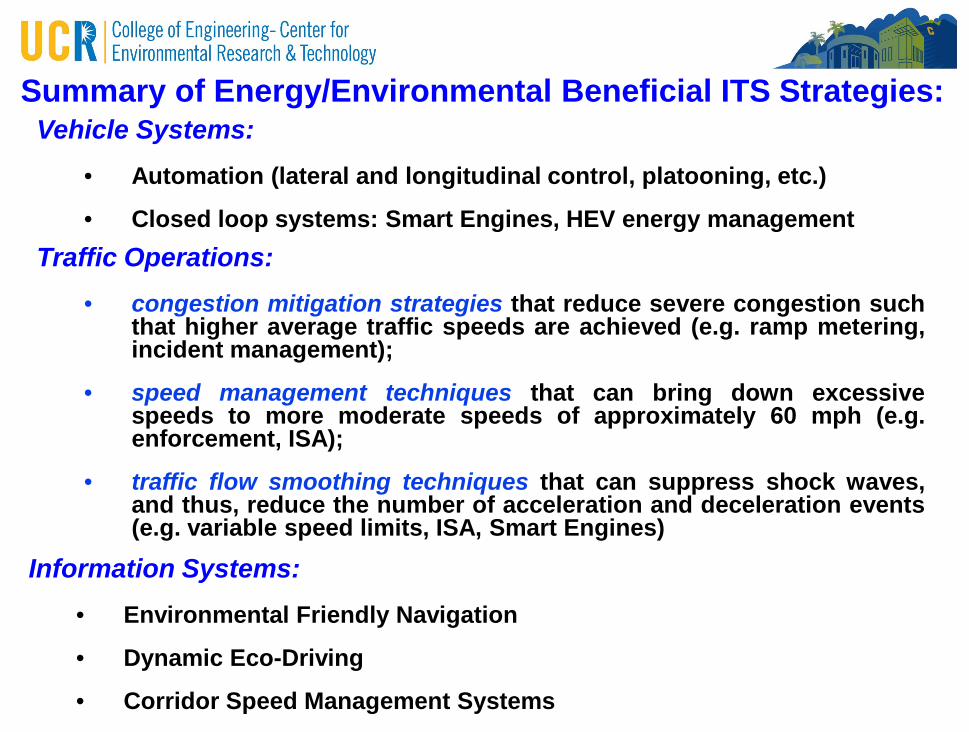
Summary of Energy/Environmental Beneficial ITS Strategies:
Traffic Operations:• congestion mitigation strategies that reduce severe congestion such
that higher average traffic speeds are achieved (e.g. ramp metering,incident management);
• speed management techniques that can bring down excessivespeeds to more moderate speeds of approximately 60 mph (e.g.enforcement, ISA);
• traffic flow smoothing techniques that can suppress shock waves,and thus, reduce the number of acceleration and deceleration events(e.g. variable speed limits, ISA, Smart Engines)
Information Systems:• Environmental Friendly Navigation
• Dynamic Eco-Driving
• Corridor Speed Management Systems
Vehicle Systems:• Automation (lateral and longitudinal control, platooning, etc.)
• Closed loop systems: Smart Engines, HEV energy management