global cruise market development trend and asia … · global cruise market development trend and...
TRANSCRIPT
GLOBAL CRUISE MARKET DEVELOPMENT
TREND AND ASIA CRUISE MARKET
SIMON WEIR
Chief Operations Officer
China and North APAC

History of the Asian Market
2008 to 2016

‘CRUISE FROM THE FUTURE’ – Quantum Class

PROPERTY OF ROYAL CARIBBEAN INTERNATIONAL 4

CHINA DEPLOYMENT 2016
Quantum of the Seas
Voyager of the Seas
SperStar Virgo
Legend of the Seas
Legend of the Seas
Ovation of the Seas
Mariner of the Seas
Ovation of the Seas
DALIAN & QINDAO Legend of the Seas
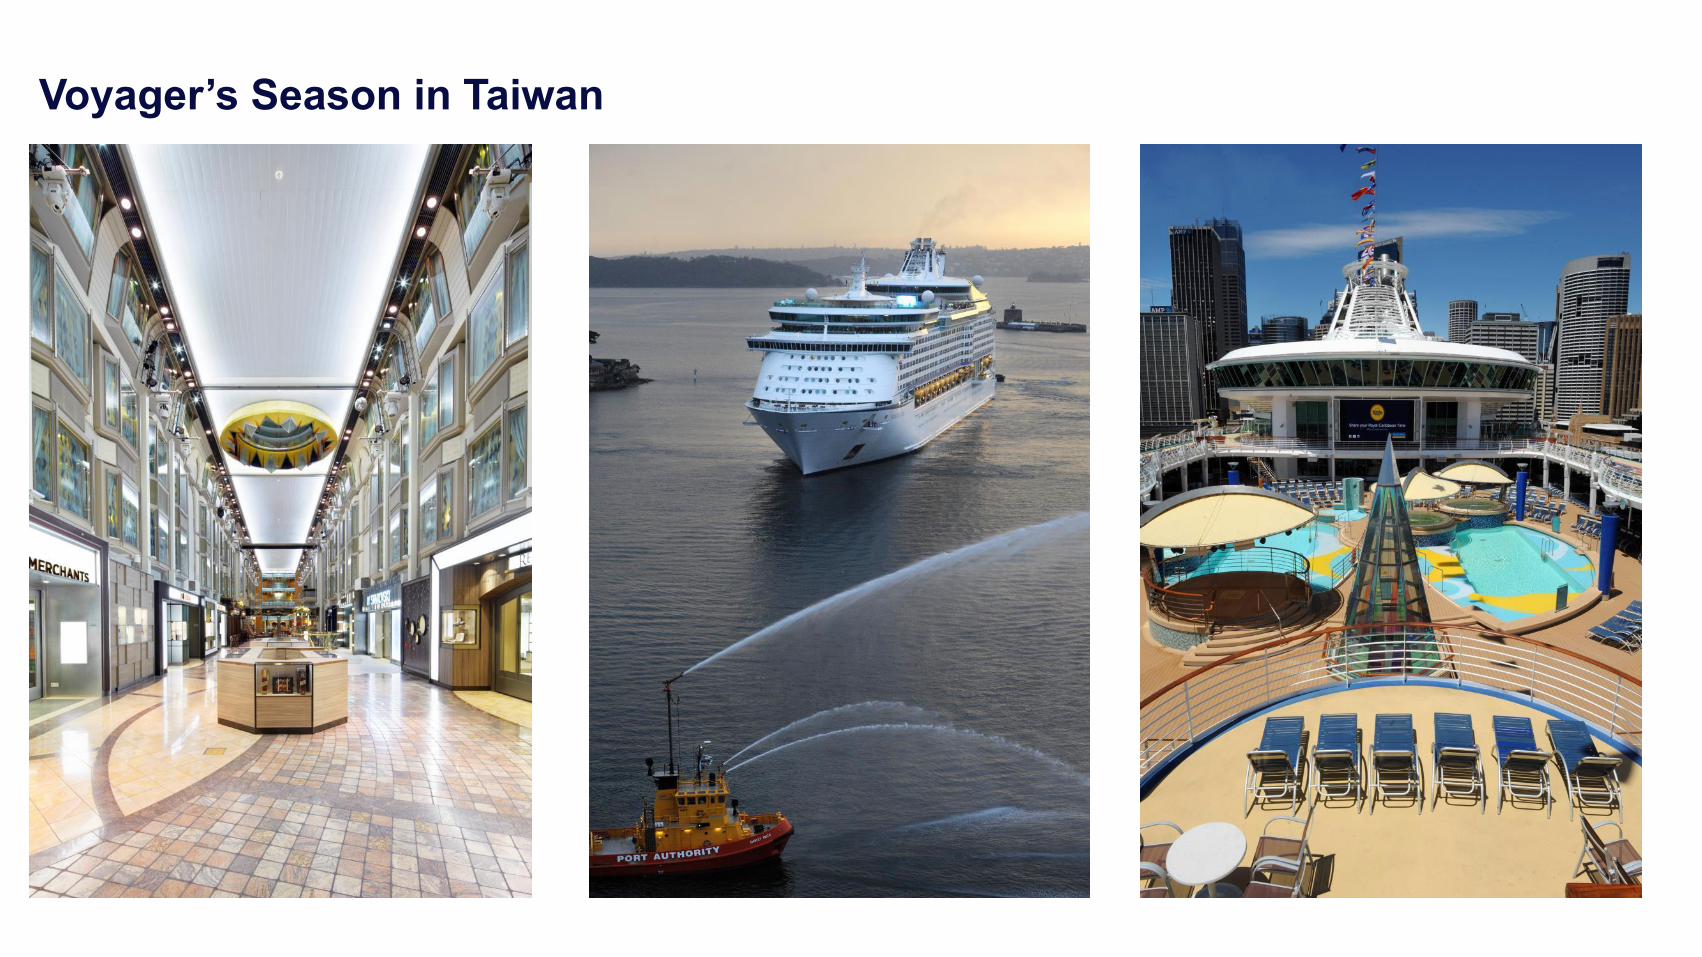
Voyager’s Season in Taiwan
DALIAN & QINDAO
Voyager of the Seas

PROPERTY OF ROYAL CARIBBEAN INTERNATIONAL
7
The Demographics

PROPERTY OF ROYAL CARIBBEAN INTERNATIONAL
• Food
• Restaurant
• Service
Product Adaption to the Market

9
WORLDWIDE DISTRIBUTION OF GUEST VOLUME &
PENETRATION RATIO
Source: United Nations World Urbanization Prospects, IMF, CLIA
% GDP Share GDP per Capita
Population
(trillions)
Cruise Guest
Volume (m)1
Penetration
Ratio3
27% $32,077
0.5 11.82 3.33%
1. All data are as of 2013; 2. Only include East Asia, Southeast Asia, and South Asia; 3. Only calculate core markets. Data are as of 2013
33% $25,434
0.7 6.40 1.65%
25% $2,941
4.1 2.052 0.12%

PROPERTY OF ROYAL CARIBBEAN INTERNATIONAL
POTENTIAL MARKET SIZE
SH/ TJ/ HK Sydney Singapore MIA/ FLL
27.9 million 8.7 million 3.7 million 5.9 million
13 ships 9 ships 6 ships 38 ships
Population • Living in key
catchment area*
• w/ > $40k annual
household income
# of Ships • Being deployed
for > 3 months in
2016
Source: C-GIDD data
10
*within 3 hours transportation to homeport

2009 2010 2011 2012 2013 2014 2015
17.8M
19.1M 20.5M 20.9M
21.3 22.04M 23M
2016 Passenger Capacity Snapshot
2016 = 24 Million Passengers Expected to Cruise
11 p = projected
2016
24M

Caribbean Mediterranean All Other Europe
w/o Med
Australia/
NZ/Pac
Alaska South
America
Asia
33.7%
18.7% 13.8%
11.7% 9.2%
6.1% 4.1% 2.7%
Regional Deployment
2016 Cruise Line Deployment, by Region – % ALBD*
12 * Available Lower Berth Day

Thank you