global distribution of chlorophyll estimated from ocean ... · dissolved oxygen in seawater units...
TRANSCRIPT
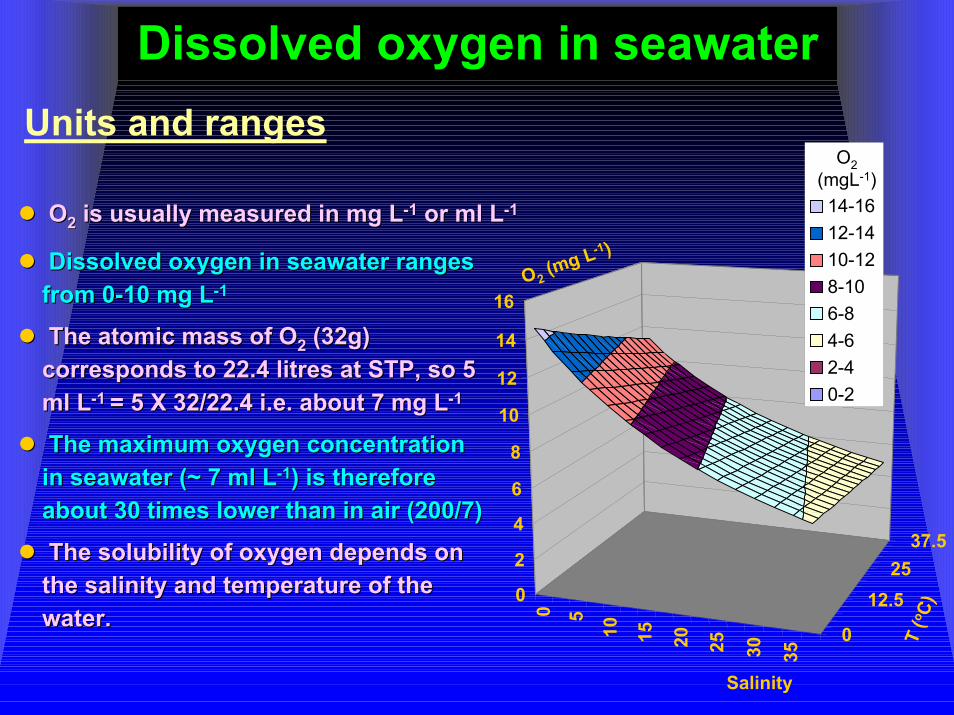
Dissolved oxygen in seawaterDissolved oxygen in seawaterUnits and ranges
Dissolved oxygen in seawater ranges Dissolved oxygen in seawater ranges from 0from 0--10 mg L10 mg L--11
The atomic mass of OThe atomic mass of O22 (32g) (32g) corresponds to 22.4 litres at STP, so 5 corresponds to 22.4 litres at STP, so 5 ml Lml L--1 1 = 5 X 32/22.4 i.e. about 7 mg L= 5 X 32/22.4 i.e. about 7 mg L--11
The maximum oxygen concentration The maximum oxygen concentration in seawater (~ 7 ml Lin seawater (~ 7 ml L--11) is therefore ) is therefore about 30 times lower than in air (200/7)about 30 times lower than in air (200/7)
The solubility of oxygen depends on The solubility of oxygen depends on the salinity and temperature of the the salinity and temperature of the water. 0 5
10 15 20 25 30 35
0
12.525
37.5
0
2
4
6
8
10
12
14
16
14-1612-1410-128-106-84-62-40-2
O2(mgL-1)
T (o C)
O2(mg L-1)
OO22 is usually measured in mg Lis usually measured in mg L--11 or ml Lor ml L--11
water.
Salinity
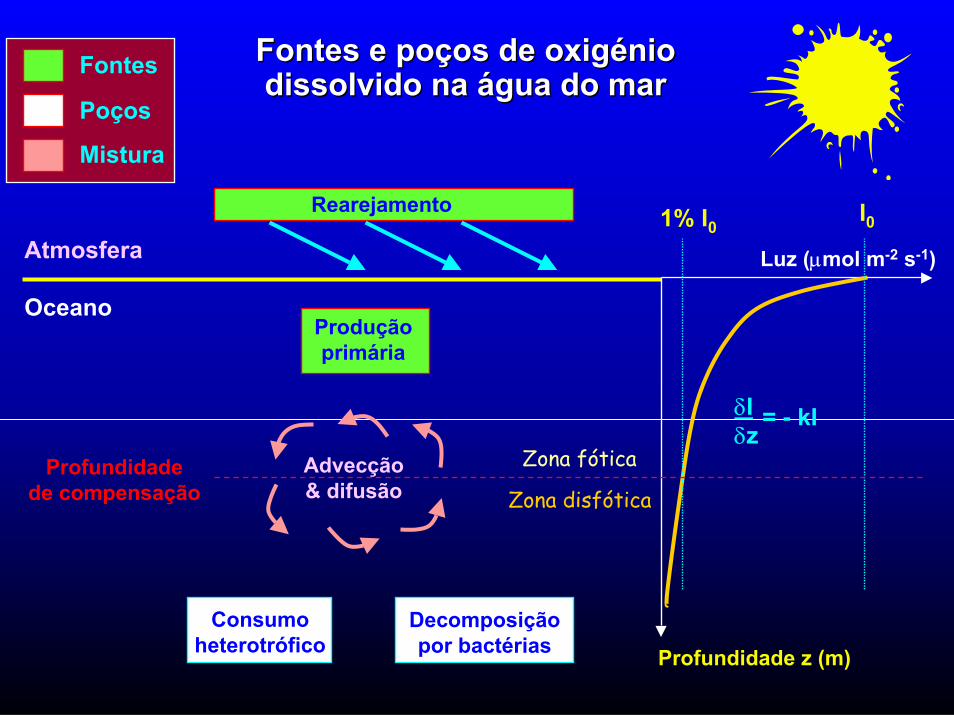
Fontes e poços de oxigénio Fontes e poços de oxigénio dissolvido na água do mar
Fontes
Poços
Mistura
dissolvido na água do mar
Rearejamento I0
Oceano
Atmosfera
δIδz
= - kI
1% I0Luz (µmol m-2 s-1)
Produçãoprimária
Advecção& difusão
Zona fóticaProfundidadede compensação Zona disfótica
Consumo heterotrófico
Decomposição por bactérias Profundidade z (m)
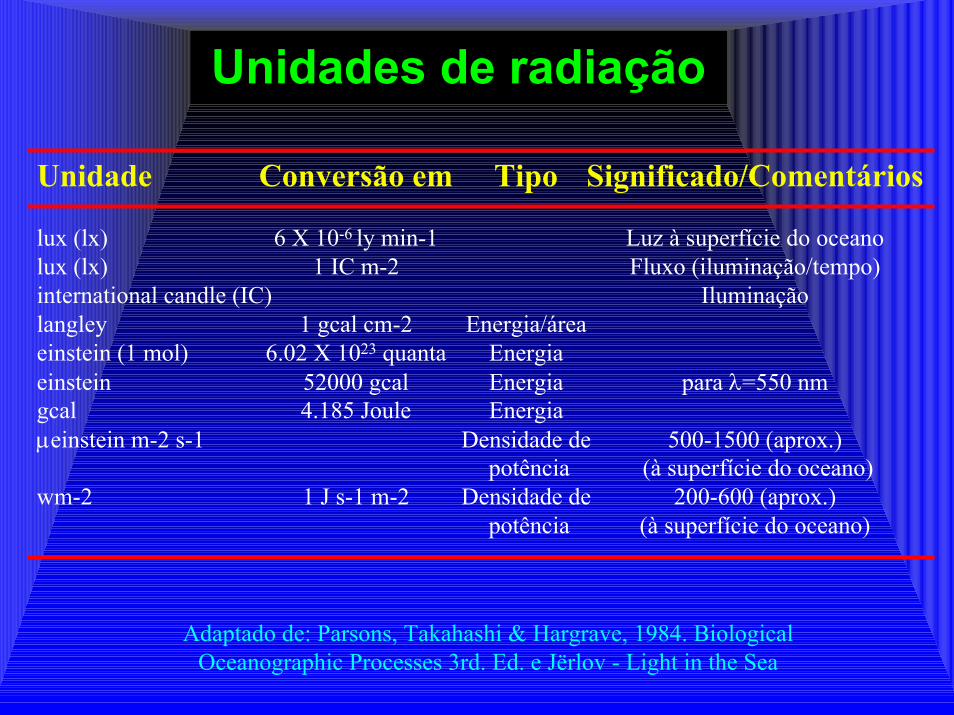
Unidades de radiaçãoUnidades de radiação
Unidade Conversão em Tipo Significado/Comentários
lux (lx) 6 X 10⁻⁶ ly min-1 Luz à superfície do oceanolux (lx) 1 IC m-2 Fluxo (iluminação/tempo)international candle (IC) Iluminaçãolangley 1 gcal cm-2 Energia/áreaeinstein (1 mol) 6.02 X 10²³ quanta Energiaeinstein 52000 gcal Energia para λ=550 nmgcal 4.185 Joule Energiaµeinstein m-2 s-1 Densidade de 500-1500 (aprox.)
potência (à superfície do oceano)wm-2 1 J s-1 m-2 Densidade de 200-600 (aprox.)
potência (à superfície do oceano)
Adaptado de: Parsons, Takahashi & Hargrave, 1984. Biological Oceanographic Processes 3rd. Ed. e Jërlov - Light in the Sea
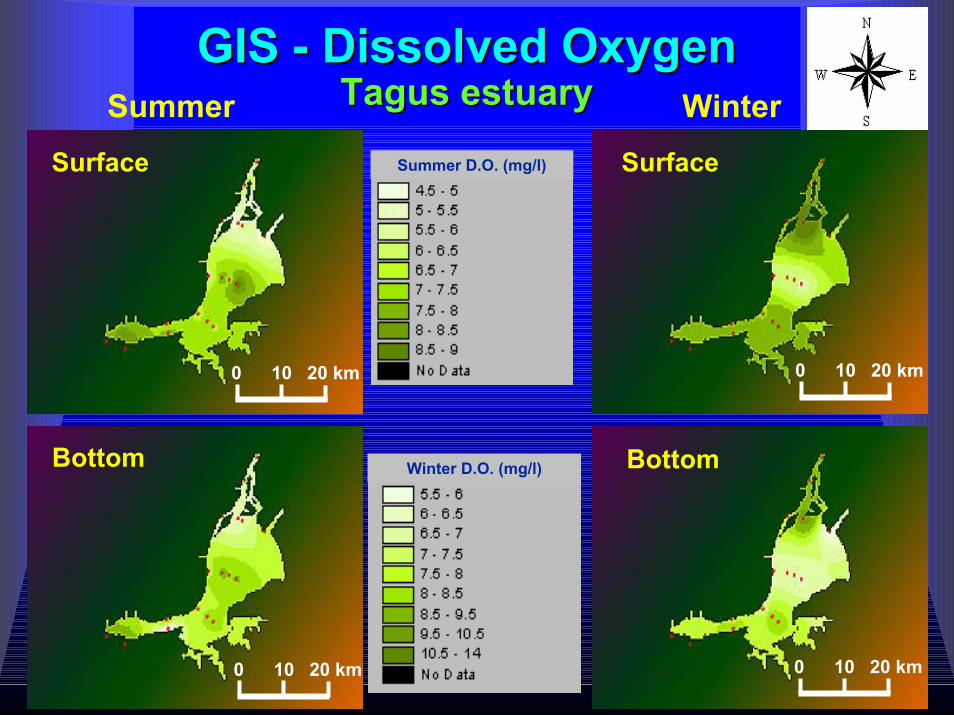
Surface
0 10 20 km
GISGIS -- Dissolved OxygenDissolved OxygenTagusTagus estuaryestuarySummer Winter
Surface
0 10 20 km
Summer D.O. (mg/l)
Bottom Winter D.O. (mg/l)
0 10 20 km
Bottom
0 10 20 km
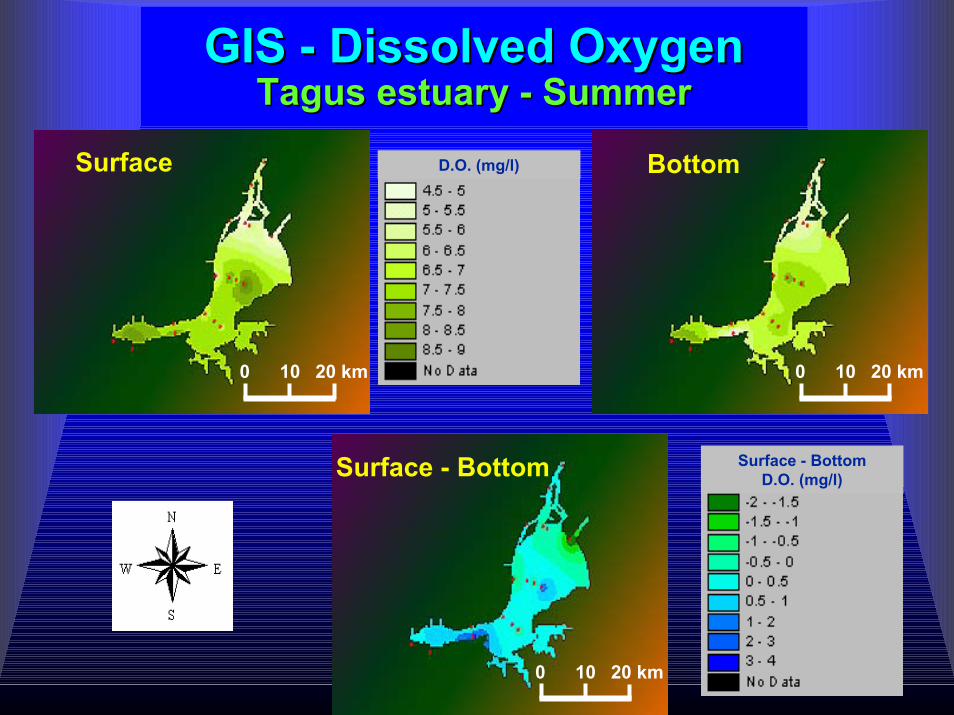
GISGIS -- Dissolved OxygenDissolved OxygenTagusTagus estuary estuary -- SummerSummer
Surface
0 10 20 km
Bottom
0 10 20 km
D.O. (mg/l)
Surface - Bottom
0 10 20 km
Surface - BottomD.O. (mg/l)
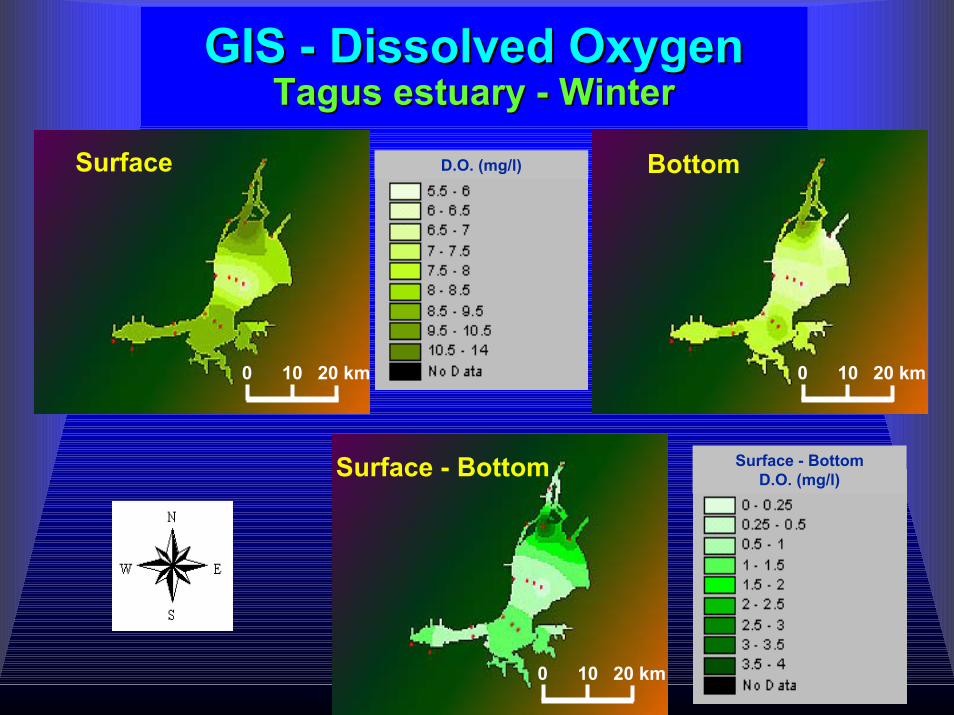
GISGIS -- Dissolved OxygenDissolved OxygenTagusTagus estuary estuary -- WinterWinter
Surface D.O. (mg/l)
0 10 20 km
Bottom
0 10 20 km
Surface - Bottom
0 10 20 km
Surface - BottomD.O. (mg/l)
Surface
0 10 20 km
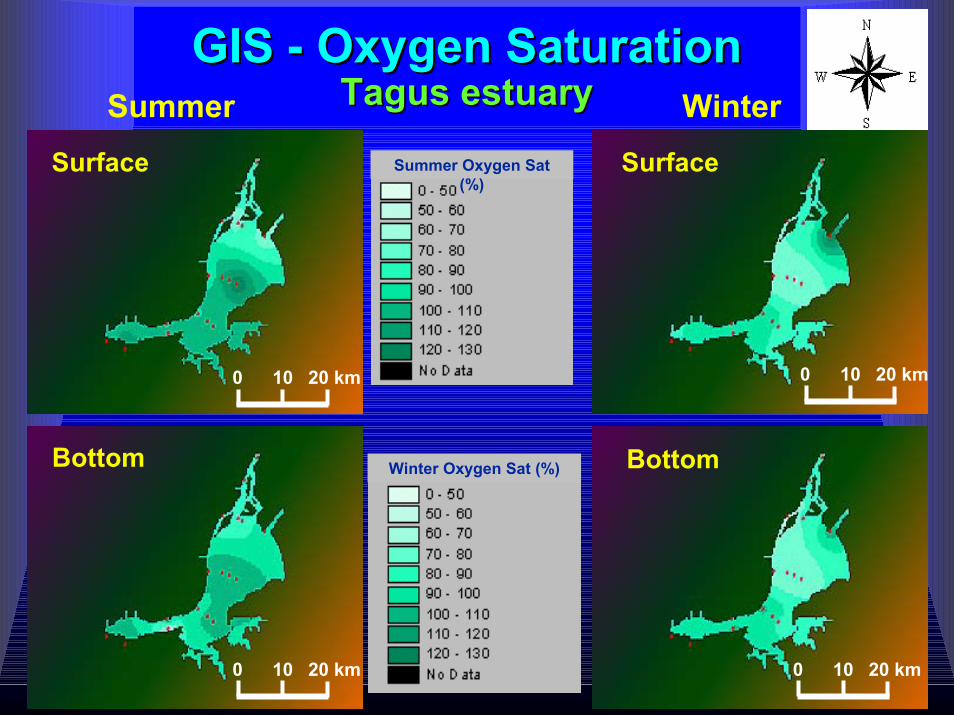
GISGIS -- Oxygen SaturationOxygen SaturationTagusTagus estuaryestuarySummer Winter
Surface
0 10 20 km
Summer Oxygen Sat (%)
Bottom Winter Oxygen Sat (%)
0 10 20 km
Bottom
0 10 20 km
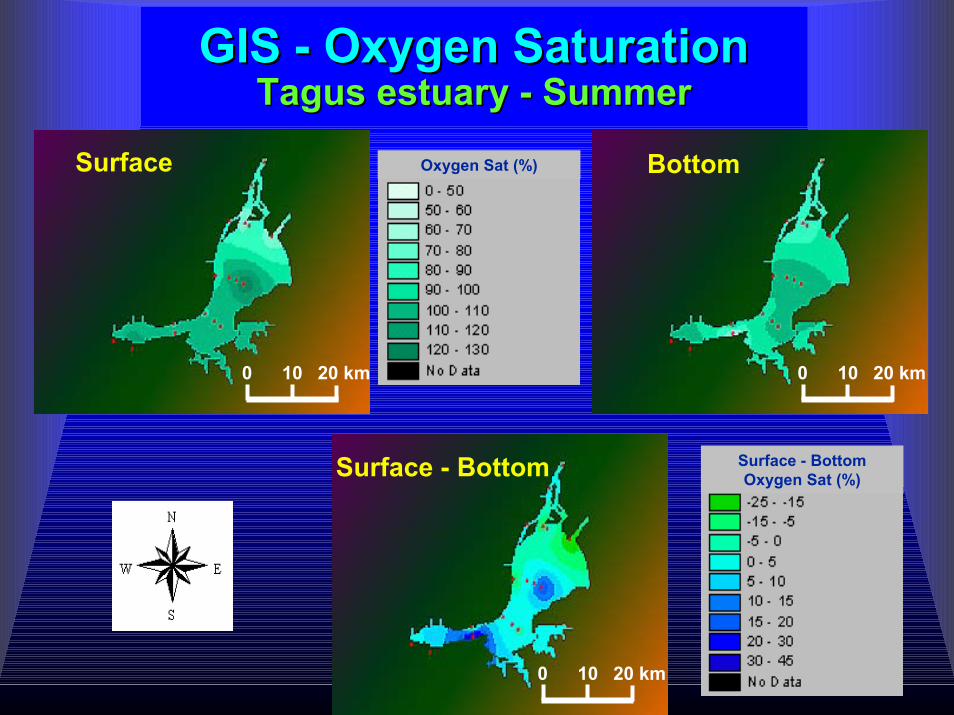
GISGIS -- Oxygen SaturationOxygen SaturationTagusTagus estuary estuary -- SummerSummer
Surface Oxygen Sat (%)
0 10 20 km
Bottom
0 10 20 km
Surface - Bottom
0 10 20 km
Surface - BottomOxygen Sat (%)
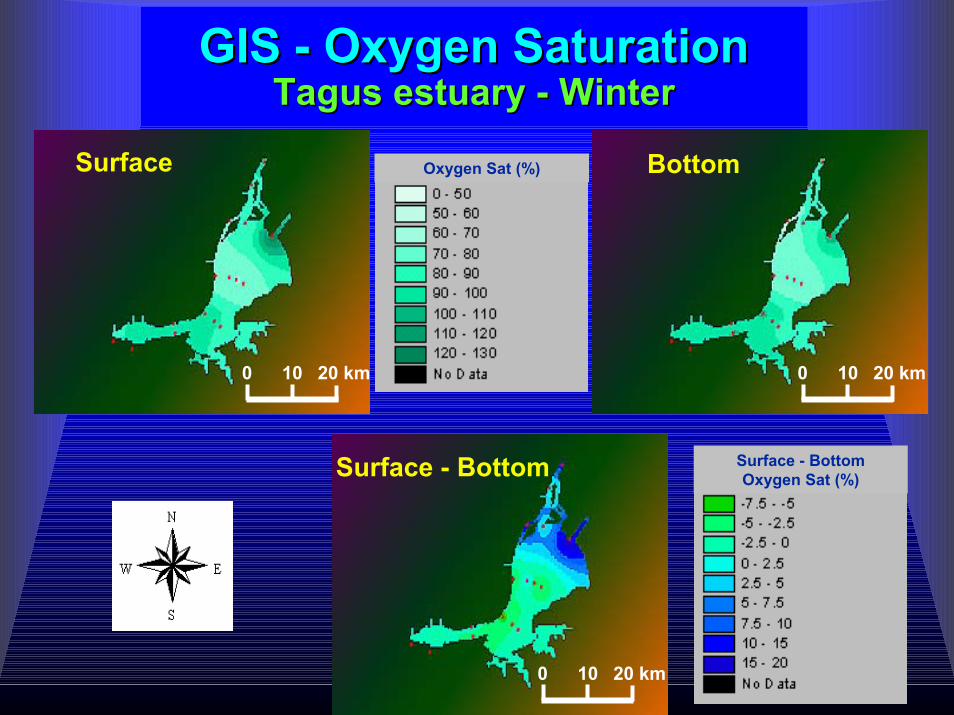
GISGIS -- Oxygen SaturationOxygen SaturationTagusTagus estuary estuary -- WinterWinter
Surface Oxygen Sat (%)
0 10 20 km
Bottom
0 10 20 km
Surface - Bottom
0 10 20 km
Surface - BottomOxygen Sat (%)
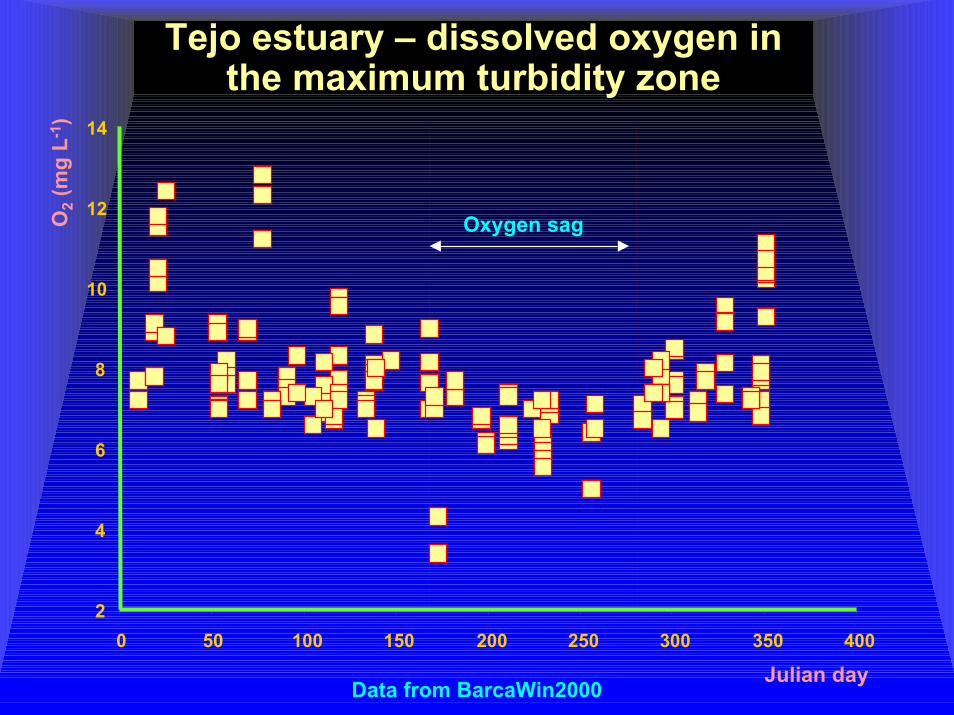
Tejo estuary Tejo estuary –– dissolved oxygen in dissolved oxygen in the maximum turbidity zonethe maximum turbidity zone
Data from BarcaWin2000
2
4
6
8
10
12
14
O2
(mg
L-1)
Oxygen sag
0 50 100 150 200 250 300 350 400
Julian day
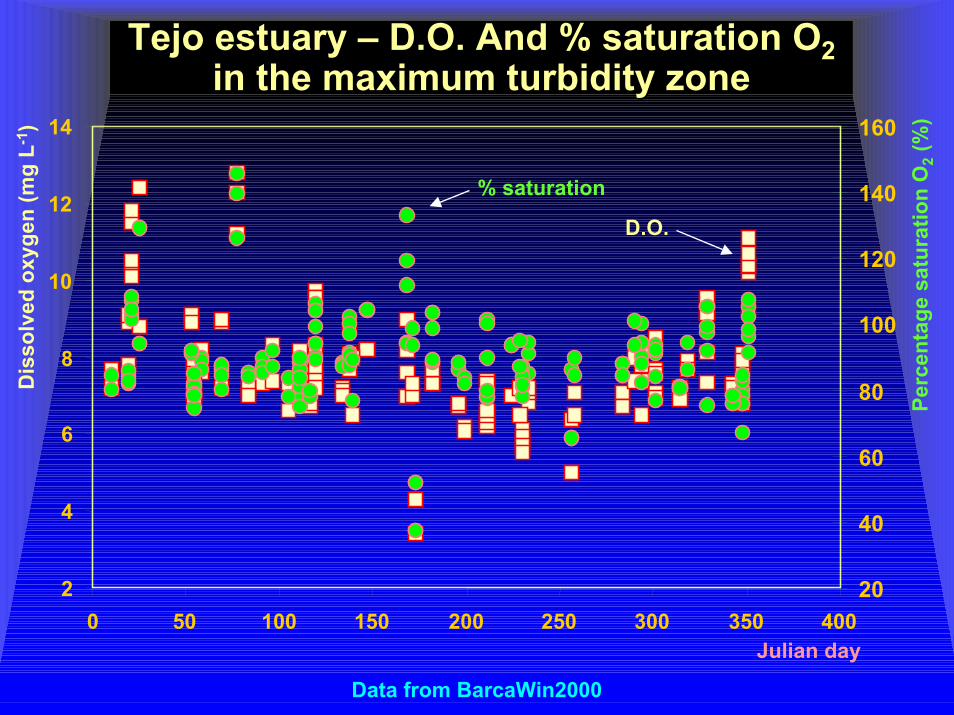
Tejo estuary Tejo estuary –– D.O. And % saturation OD.O. And % saturation O22in the maximum turbidity zonein the maximum turbidity zone
Dis
solv
ed o
xyge
n (m
g L-1
)
2
4
6
8
10
12
14
20
40
60
80
100
120
140
160
Perc
enta
ge s
atur
atio
n O
2(%
)
% saturation
D.O.
0 50 100 150 200 250 300Julian day
350 400
Data from BarcaWin2000
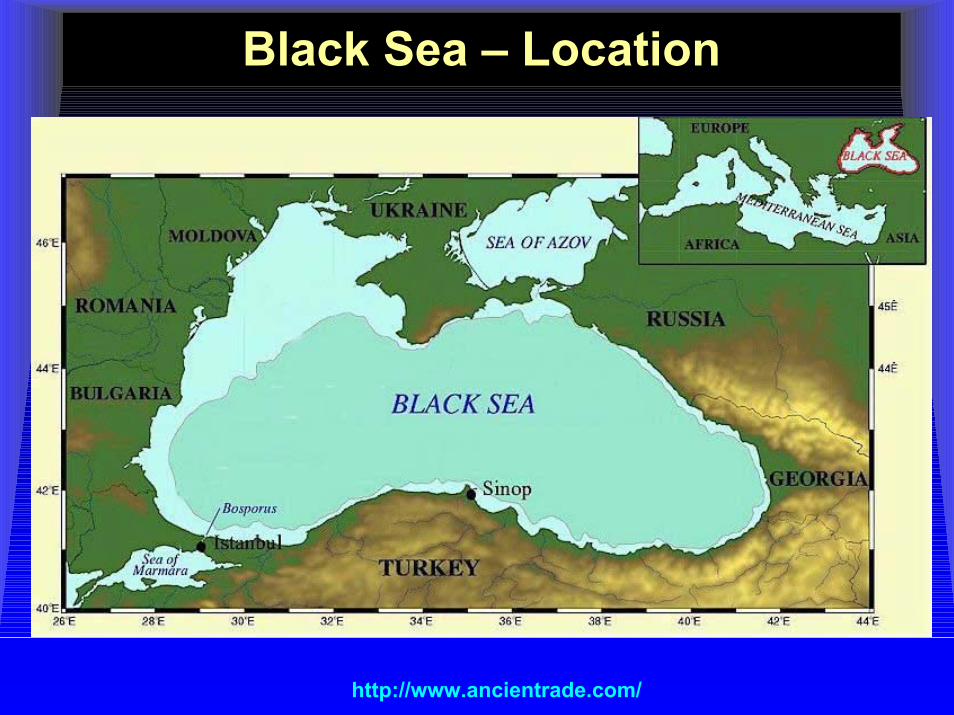
Black Sea Black Sea –– Location Location
http://www.ancientrade.com/
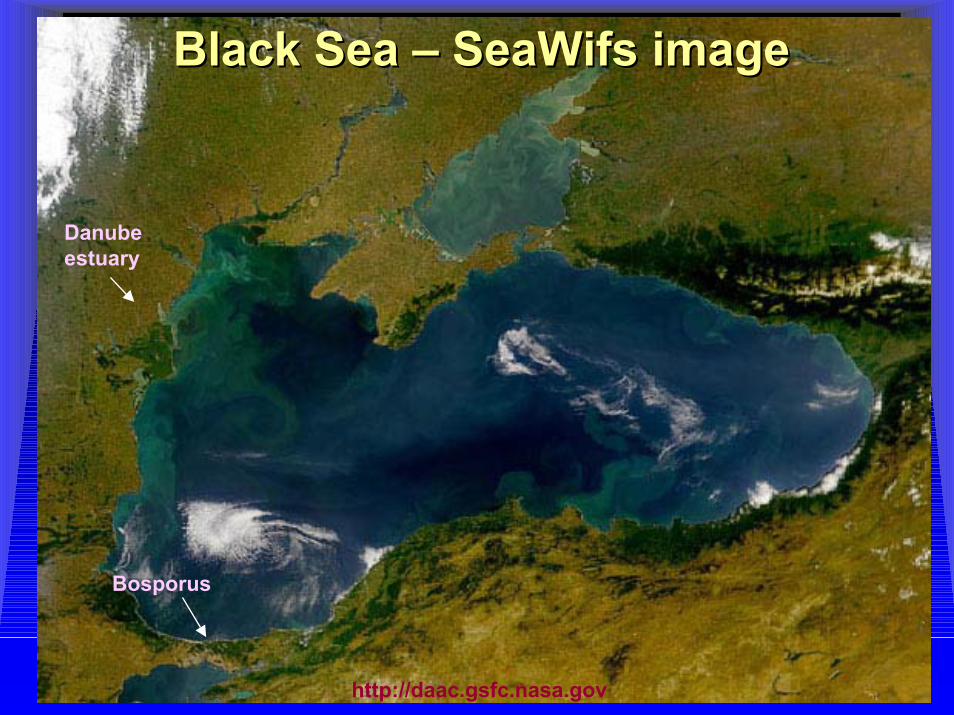
Black Sea Black Sea –– SeaWifs image SeaWifs image
http://daac.gsfc.nasa.gov
Bosporus
Danube estuary
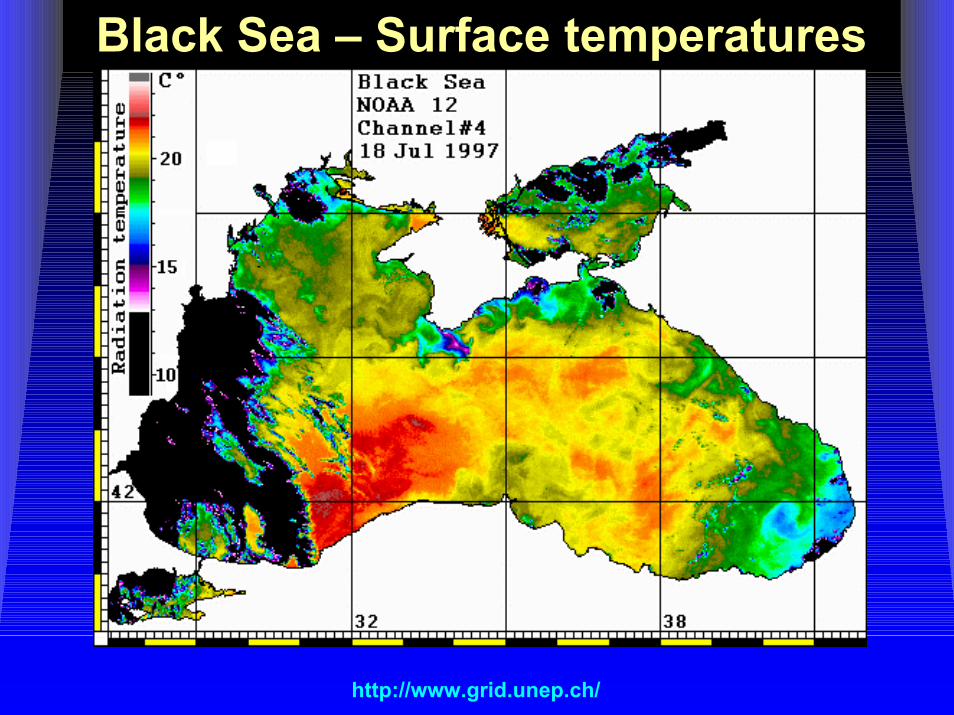
Black Sea Black Sea –– Surface temperaturesSurface temperatures
http://www.grid.unep.ch/
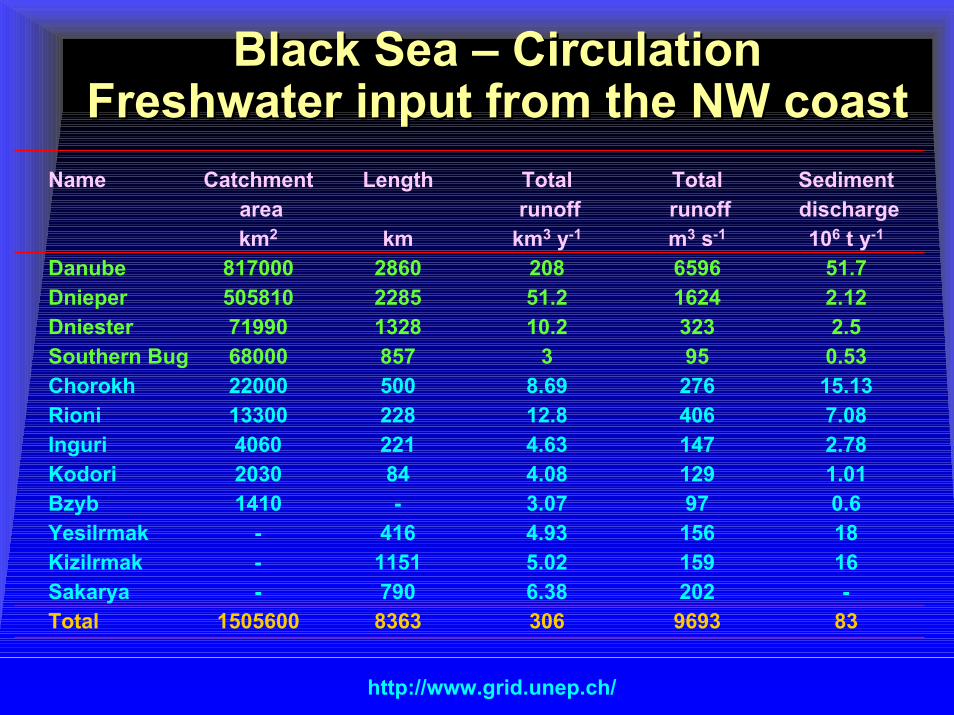
Black Sea Black Sea –– CirculationCirculationFreshwater input from the NW coastFreshwater input from the NW coast
Name Catchment Length Total Total Sediment area runoff runoff dischargekm2 km km3 y-1 m3 s-1 106 t y-1
Danube 817000 2860 208 6596 51.7Dnieper 505810 2285 51.2 1624 2.12Dniester 71990 1328 10.2 323 2.5Southern Bug 68000 857 3 95 0.53Chorokh 22000 500 8.69 276 15.13Rioni 13300 228 12.8 406 7.08Inguri 4060 221 4.63 147 2.78Kodori 2030 84 4.08 129 1.01Bzyb 1410 - 3.07 97 0.6Yesilrmak - 416 4.93 156 18Kizilrmak - 1151 5.02 159 16Sakarya - 790 6.38 202 -Total 1505600 8363 306 9693 83
http://www.grid.unep.ch/
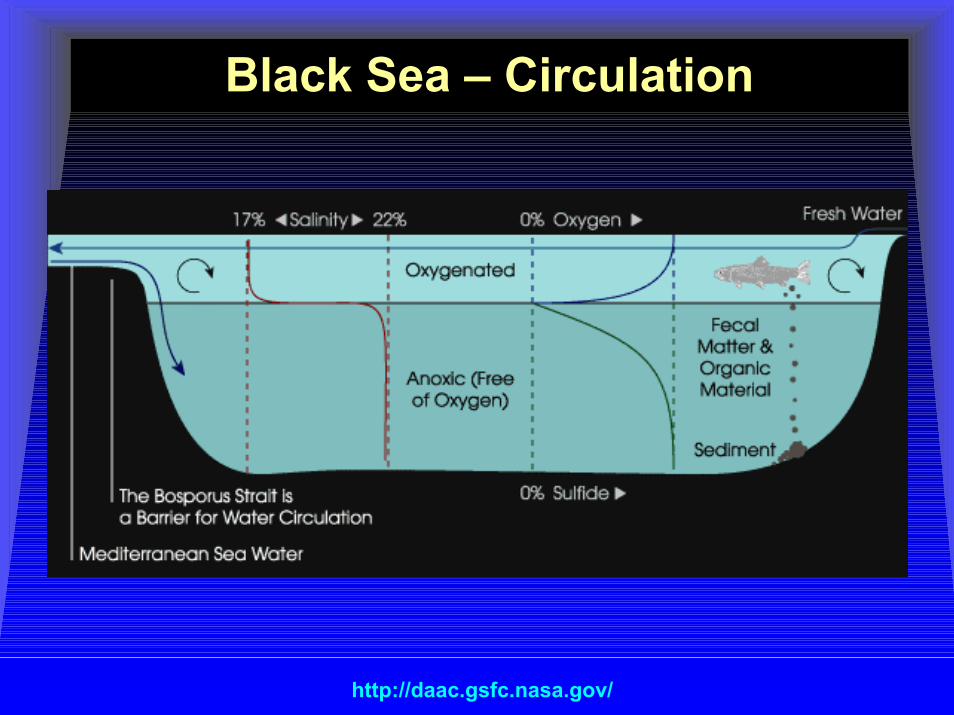
Black Sea Black Sea –– CirculationCirculation
http://daac.gsfc.nasa.gov/