global ecology composite satellite image (“blue marble 2012”) from wikimedia commons
TRANSCRIPT

Global Ecology
Composite satellite image (“Blue Marble 2012”) from Wikimedia Commons

Global Carbon Cycle
Cain, Bowman & Hacker (2014), Fig. 25.3
Boxes = major pools or reservoirs; petagrams (1 Pg = 1015 g)Arrows = fluxes or rates of movement; Pg/yr
Orange arrows = anthropogenic fluxes
Main pools = atmosphere, oceans, land surface (soils &
veg.), rocks & sediments
Terrestrial pool exchanges C with
atmosphere mostly via photosynthesis &
respiration
Post-Industrial Revolution
anthropogenic inputs have dramatically
increased

Global Nitrogen Cycle
Cain, Bowman & Hacker (2014), Fig. 25.7
Boxes = major pools or reservoirs; teragrams (1 Tg = 1012 g)Arrows = fluxes or rates of movement; Tg/yr
Orange arrows = anthropogenic fluxes
Main pool = atmosphere (N2)
Biological fluxes predominate
Human activity has altered the global N
cycle even more than the global C cycle!

Global Phosphorus Cycle
Cain, Bowman & Hacker (2014), Fig. 25.9
Boxes = major pools or reservoirs; teragrams (1 Tg = 1012 g)Arrows = fluxes or rates of movement; Tg/yr
Orange arrows = anthropogenic fluxes
Main pools = terrestrial soils & marine
sediments
Mining releases 4x more P than weathering of rock (apparently not shown)
Eutrophication can result from
anthropogenic oversupply of P or N(e.g., linked to Gulf
“Dead Zone”)
Geochemical fluxes predominate

Global Sulfur Cycle
Cain, Bowman & Hacker (2014), Fig. 25.10
Boxes = major pools or reservoirs; teragrams (1 Tg = 1012 g)Arrows = fluxes or rates of movement; Tg/yr
Orange arrows = anthropogenic fluxes
Main pools = rocks, sediments, ocean
Anthropogenic emissions have
quadrupled since the Industrial Revolution
Atmospheric deposition is a cause
of acid rain

Image from Wikimedia Commons
Global Change
Climate change – a shift of average weather across a region
E.g., Eocene temperature was 4 – 6 °C warmer than today

Images from www.thecanadianencyclopedia.com
Eocene on Ellesmere Island, far north Canada
Modern day on Ellesmere Island, far
north Canada
Global Change
E.g., Eocene temperature was 4 – 6 °C warmer than today
Climate change – a shift of average weather across a region

Image from www.thecanadianencyclopedia.com
E.g., Eocene seas were 100 - 150 m higher than today
Global Change
Climate change – a shift of average weather across a region

E.g., Milankovitch Cycles – Earth’s changing orbit influences temperature with ~41,000 & ~100,000 yr periodicities
Global Change
Image from Wikimedia Commons
Climate change – a shift of average weather across a region

E.g., Pleistocene glacial and inter-glacial periods
Global Change
Then relative stability during pre-Industrial Revolution Holocene
Image from Wikimedia Commons
Climate change – a shift of average weather across a region

Image from NOAA
Global Change
Do you recognize this curve?
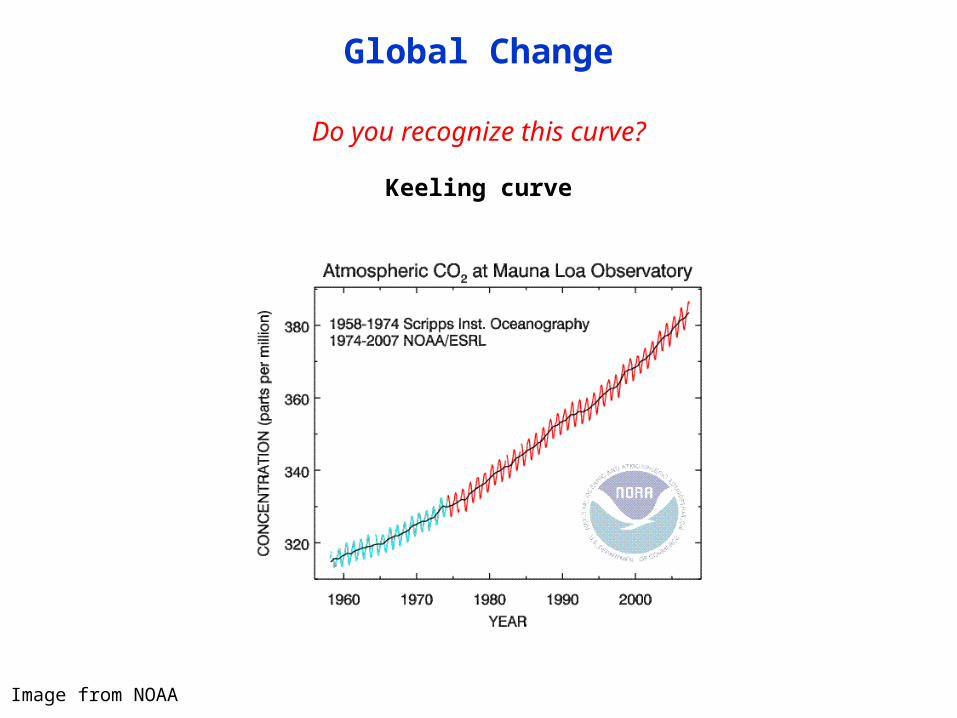
Image from NOAA
Global Change
Do you recognize this curve?
Keeling curve
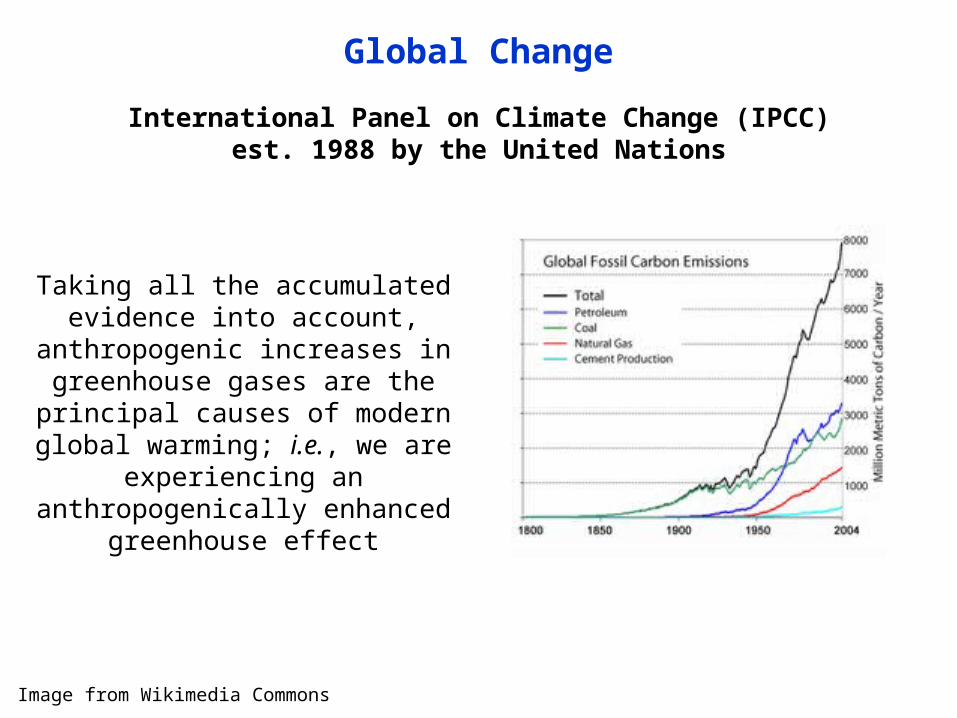
Taking all the accumulated evidence into account, anthropogenic increases in greenhouse gases are the principal
causes of modern global warming; i.e., we are experiencing an anthropogenically enhanced
greenhouse effect
Image from Wikimedia Commons
Global Change
International Panel on Climate Change (IPCC)est. 1988 by the United Nations

Image from www.epa.gov
IPCC predictions are for [CO2] by 2100:500 to 1000 ppm;
with concomitant global temperatures 1.1 to 6.4 °C higher
Global Change

Image from: www.grida.no
Earth’s avg. temp. = 14 °C
(57 °F)
Without the atmosphere’s greenhouse
effect it would be about -18 °C
(-0.4 °F)
Global Change

Photo of glacial retreat on Mount Kilimanjaro (Feb. 1993 to Feb. 2000) from Wikimedia Commons; Map of Africa from www.admin.uio.no
Feb. 17, 1993
Feb. 21, 2000
Global Change – Physical Consequences
Global reduction in ice

Photo from Wikimedia Commons; figs. from Wootton et al. (2008) PNAS
Decreasing oceanic pH
Tatoosh Island, Washington
CO2 + H2O H2CO3 (carbonic acid) H+ + HCO3-
(bicarbonate) 2 H+ + CO32- (carbonate)
Global Change – Physical Consequences
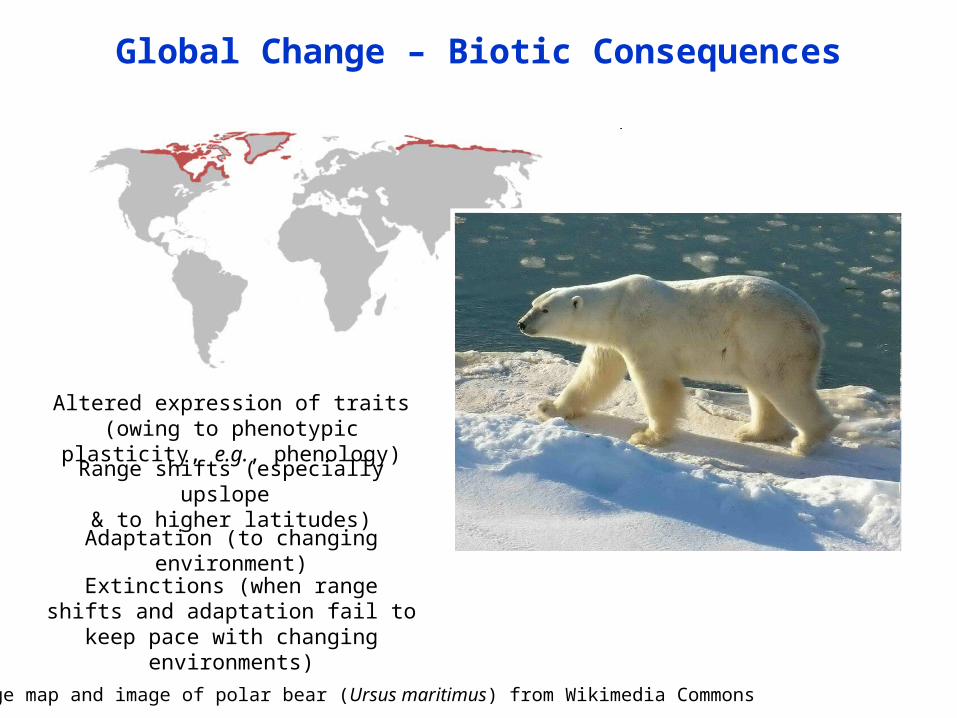
Range map and image of polar bear (Ursus maritimus) from Wikimedia Commons
Global Change – Biotic Consequences
Altered expression of traits (owing to phenotypic plasticity, e.g., phenology)
Range shifts (especially upslope & to higher latitudes)
Adaptation (to changing environment)
Extinctions (when range shifts and adaptation fail to keep pace with
changing environments)
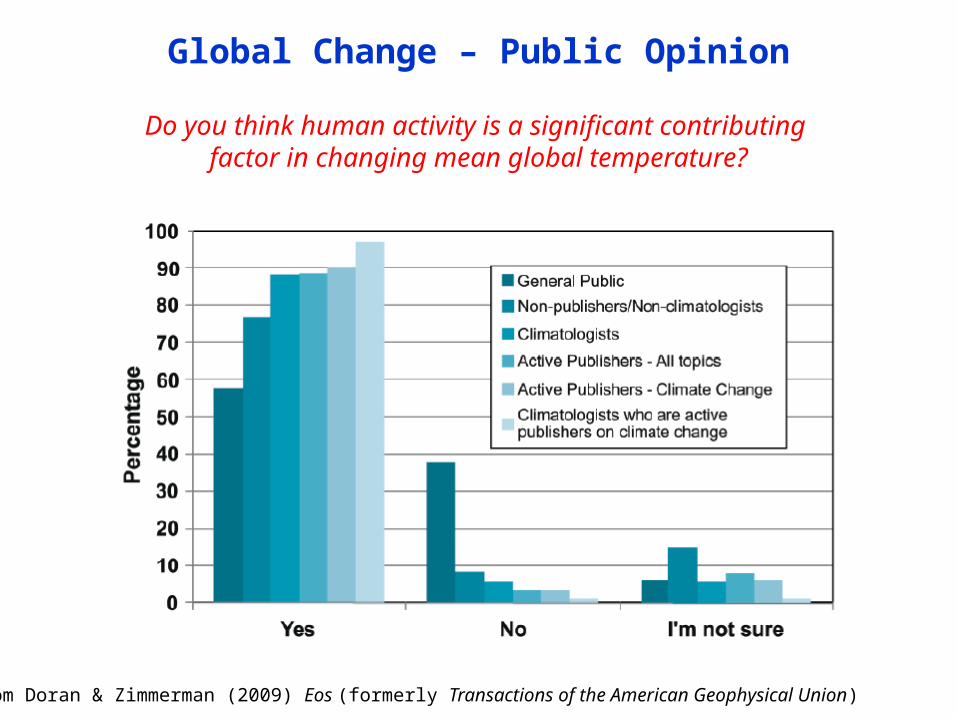
From Doran & Zimmerman (2009) Eos (formerly Transactions of the American Geophysical Union)
Do you think human activity is a significant contributing factor in changing mean global temperature?
Global Change – Public Opinion

Treaty to enact resolutions from the United Nations’ Vienna Convention on the Protection of the Ozone Layer (1985) to “protect the ozone layer by
taking precautionary measures to control equitably total global emissions of substances that deplete it [e.g., CFCs], with the
ultimate objective of their elimination”
Montreal Protocol (1987)
Image from Wikimedia Commons – NASA image of largest Antarctic ozone hole ever recorded
September 2006
Global Change
Has generally been effective![Strong political will]

Legally binding treaty through 2012 (when ratified by states) intended to enact resolutions from the United Nations’ Framework Convention on Climate
Change (1992) to achieve “stabilization of greenhouse gas concentrations in the atmosphere at a level that would prevent dangerous anthropogenic
interference with the climate system”
Image from Wikipedia (see “Kyoto Protocol”)
Green = signed & ratified
Red = signed, but not ratified
Grey =non-signatory
Kyoto Protocol (1997)
Global Change
Has NOT been effective![Weak political will]