global economic prospects for sub-saharan africa · pdf fileover 2016-30 and to 4.6 percent in...
TRANSCRIPT

reflecting lower exposure to the commodity slowdown, and tailwinds from large-scale infrastructure investment.
Following their sharp decline in 2014, commodity prices weakened further in 2015 (Figure 2.6.1A). The prices of oil and metals, such as iron ore, copper, and platinum, declined substantially. Those of some agricultural commodities, such as coffee, fell moderately, although the prices of cocoa and tea showed small gains. The region’s pattern of exports makes it particularly vulnerable to commodity price shocks. Fuels, ores, and metals accounted for more than 60 percent of the region’s total exports in 2010-14 compared with 16 percent for manufactured goods (Figure 2.6.1B).
Lower commodity prices obliged a fiscal tightening in several commodity exporters, which caused a sharp slowdown. Angola and Nigeria are heavily dependent on oil for fiscal revenues and reserves—oil accounts for more than 60 percent of their fiscal revenues and more than 80 percent of exports. Governments in the two countries reduced expenditures sharply, which adversely impacted other areas of their economies. The decline in metal prices hit Mauritania and Zambia
Economic activity in Sub-Saharan Africa slowed to 3.4 percent in 2015 from 4.6 percent the previous year. A
combination of external and domestic factors was responsible for the slowdown. External factors included lower
commodity prices, a slowdown in major trading partners, and tightening borrowing conditions. Domestic
factors included political instability and con@ict, and electricity shortages. In 2016, GDP growth is projected to
pick up to 4.2 percent, as commodity prices stabilize and supply constraints ease. Nonetheless, risks remain tilted
to the downside. Domestic risks include political uncertainty associated with upcoming elections and the Boko
Haram insurgency. In addition, power shortages might not ease as the forecast assumes. External risks include
the possibilities of a further drop in commodity prices, a faster than expected slowdown in China, and a decline
in capital @ows as the United States normalizes monetary policy. Rising Ascal and external vulnerabilities, and
domestic constraints to growth, pose challenges for policy, particularly among commodity exporters, where
extreme poverty rates remain very high.
Recent developments
Economic activity in Sub-Saharan Africa (SSA) decelerated from 4.6 percent in 2014 to 3.4 percent in 2015, the weakest performance since 2009, due to a combination of external shocks and domestic constraints (Table 2.6.1). The slowdown was most pronounced among oil exporters. In Nigeria, the region’s largest economy and oil exporter, growth slowed to 3.3 percent, down from 6.3 percent in 2014. Growth moderated in several mineral and metal exporters – including Mauritania, South Africa, and Zambia (Table 2.6.2). In South Africa, the economy expanded by 1.3 percent, compared with 1.5 percent in 2014. With the Ebola crisis receding, activity rebounded somewhat in Liberia, but remained weak in the other affected countries (Guinea, Sierra Leone) with GDP falling sharply in Sierra Leone as mining production contracted. Activity weakened substantially in Burundi and South Sudan amid political instability and civil strife. However, in other countries, including low-income ones and some fragile states—Côte d’Ivoire, Rwanda, and Tanzania—growth remained robust,
Note: Me author of this section is Gerard Kambou. Research assis-tance was provided by Xinghao Gong.

CHAPTER 2. 6 GLOBAL ECONOMIC PROSPECTS | JANUARY 2016 154
hard, as low prices of copper and iron ore prompted mining companies to reduce production and to delay planned investments; exports, employment, and domestic spending fell. Exporters of agricultural commodities, which include many of the region’s low-income countries, experienced a less pronounced slowdown in activity as a result of the relatively moderate decline in the price of their exports.
Low commodity prices reflected weak global demand for raw materials, including from large developing countries where growth has continued to slow. Most importantly, the region has had to deal with a pronounced slowdown in major trading partners. SSA’s external trade has undergone a shift in direction towards China and away from traditional advanced country trading partners, driven by China’s demand for primary commodities (Box 2.6.1). As SSA’s largest national trading partner, China’s rebalancing away from raw material-intensive sectors has direct implications for the region. In addition, foreign direct investment flows from China have grown rapidly in recent years and are important for several countries (e.g., Zambia and South Africa), although the United States and the Euro Area still remain the largest sources of FDI in the region. Spillovers from China’s slowdown are likely to be transmitted to countries in SSA through trade and financial channels. World Bank estimates suggest
that these effects could be sizeable and have likely contributed to the ongoing slowdown in the region.1
Capital flows to the region slowed in 2015, as cross-border bank lending declined (Figure 2.6.2A). Many countries tapped the international bond market to finance their investment programs, taking advantage of the global low-interest-rate environment, and investors’ search for yield. Côte d’Ivoire’s sovereign bond issuance in February was followed by five other countries – Gabon, Zambia, Ghana, Angola, and Cameroon – with Angola and Cameroon issuing maiden 10-year bonds. Yields were higher than in previous issuances, however. They exceeded 9 percent in several countries and 10 percent in Ghana. Sovereign spreads rose across the region (Figure 2.6.2B). This indicates a re-assessment of risk among sovereign-debt investors as global headwinds, and the expectation of a rate hike by the U.S. Federal Reserve that materialized in December, weigh on the region. Increased foreign exchange liabilities, which leave many countries vulnerable to the risk that future currency depreciation could pressure debt servicing costs, would be a factor in this re-assessment.
The external headwinds of low commodity prices, of a slowdown in major emerging markets, and rising borrowing costs were compounded by domestic problems. These included severe infrastructure constraints, especially power supply, in several countries. The slowdown in Nigeria was accounted for by non-oil sectors (Figure 2.6.3A). A large part of the slowdown in manufacturing was oil-related as oil refining recorded a steep decline. However, the pronounced contraction of manufacturing in the first half of 2015 also reflected Nigeria’s huge infrastructure and electricity deficits, which are impairing factory operations. In South Africa, power supply bottlenecks, compounded by a severe drought and difficult labor relations, weighed heavily on growth (Figure 2.6.3B). Insufficient power supply
Following sharp declines in 2014, commodity prices weakened further in
2015. Expectations of slower global growth and abundant supplies led to
a renewed plunge in the price of oil. The prices of ores and metals, such
as iron ore, copper, and platinum, also declined substantially. With fuels,
ores, and metals accounting for more than 60 percent of its exports, the
region is particularly vulnerable to commodity price shocks.
Source: World Bank, World Integrated Trade Solutions database, 2015.
FIGURE 2.6.1 Commodity market developments
A. Commodity prices B. Share of commodities in SSA exports
1A recent World Bank study (Lakatos et al. 2015) Inds that a slowdown in China’s GDP growth to an average of 6 percent per year over 2016-30 and to 4.6 percent in 2030 could result in a GDP loss in Sub-Saharan Africa of 1.1 percent compared with the baseline by 2030.

SUB- SAHARAN AFRICA GLOBAL ECONOMIC PROSPECTS | JANUARY 2016 155
emerged as a leading constraint to activity in a number of frontier markets, including Botswana, Ghana, and Zambia. In some countries (Botswana, Zambia), shortages of hydroelectric power were due to drought; in others, they were driven by underinvestment in new capacity (South Africa), and lack of reforms to encourage private investment (Ghana, Nigeria).
The growth slowdown was associated with mounting fiscal vulnerabilities in a number of countries. Fiscal deficits widened in oil exporters (Republic of Congo, Gabon, Nigeria) due to falling revenues. In other countries, the widening deficits reflected increased government spending, including on arrears (Zambia), infrastructure projects (Kenya), and subsidies (Malawi). Some countries (Angola, Ghana) implemented expenditure measures – including removing fuel subsidies and freezing public sector hiring – that reduced the deficits. In many countries, fiscal deficits are larger relative to GDP than they were at the onset of the global financial crisis (Figure 2.6.4A). As a result, government debt ratios have continued to rise (Figure 2.6.4B). While debt-to-GDP ratios remain manageable in most low-income countries, they rose rapidly in several frontier markets, led by non-concessional borrowing. By contrast, Nigeria’s sovereign debt has remained low, at less than 15 percent of GDP.
External imbalances widened across the region. Current account balances turned sharply negative in Angola and Nigeria due to lower oil prices. Deficits remained large among oil importers because of low commodity prices and rising non-oil imports. In Kenya, the current account deficit remained high as security concerns weighed on tourism earnings. In South Africa, in contrast, the current account deficit narrowed on the back of export growth. In addition, the depreciation of the rand partly offset the decline in commodity prices. In Ghana, Kenya, and Namibia, the twin fiscal and current account deficits have remained large.
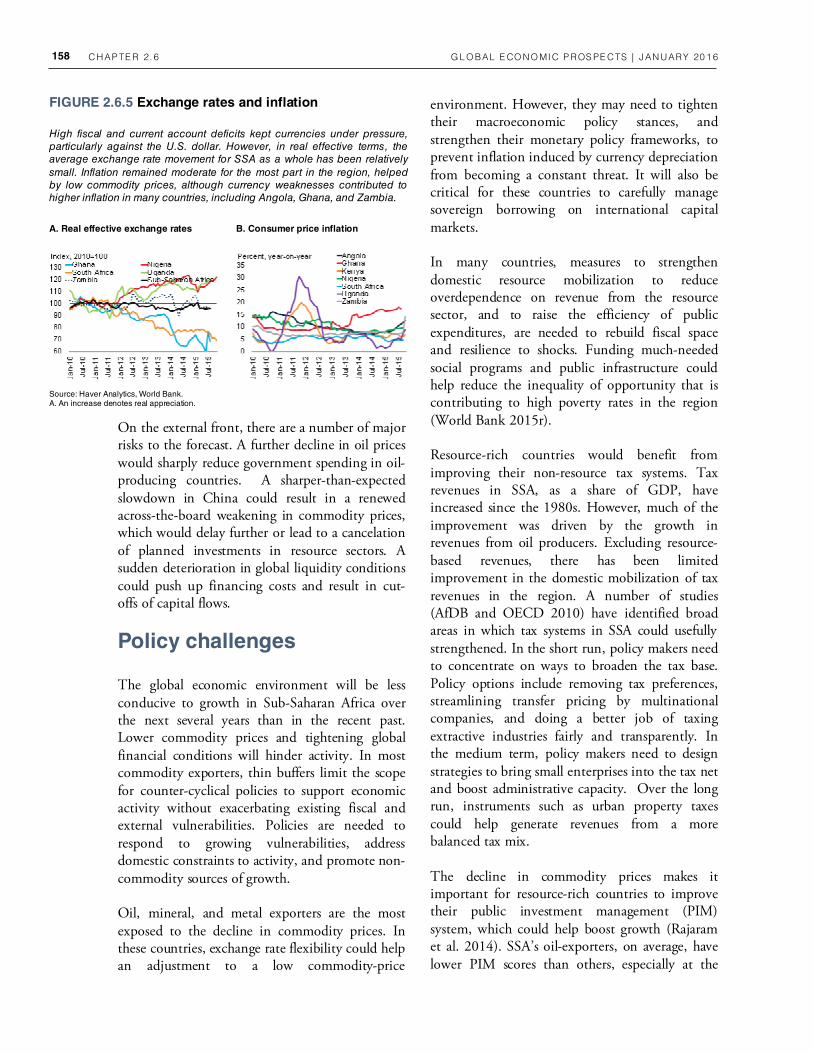
High fiscal and current account deficits, combined with strong demand for the U.S. dollar, kept currencies under pressure. Currencies of commodity exporters and frontier-market economies saw sharp depreciations against the U.S. dollar. However, because of inflation, the
average movement in real effective exchange rates across the entire region was relatively small (Figure 2.6.5A). The Ghanaian cedi weakened the most, by more than 30 percent, in large part because of loose monetary and fiscal policies, followed by the South African rand. The Nigerian naira was about 5 percent stronger than its 2014 average. Early in 2015, the Central Bank of Nigeria introduced a range of administrative measures to stem the demand for foreign currencies. These measures have hampered private sector activities. A severe liquidity squeeze emerged in the interbank market in the second half of 2015, prompting the central bank to reduce the cash reserve ratio.
Consumer price inflation remained moderate across the region, except in Ghana, Angola, and Zambia, where it was in the double digits (Figure 2.6.5B). Low fuel prices helped keep inflation down. However, currency weaknesses contributed to higher inflation in many countries. In Angola and Nigeria, inflation exceeded the central bank’s target. Concerns about inflation led central banks in several countries to hike interest rates (Angola, Ghana, Kenya, Mozambique, South Africa, Uganda, Zambia). The Central Bank of Nigeria, in contrast, cut the benchmark interest rate in an attempt to stimulate growth. In CFA franc countries, the peg to the euro kept inflation low, and underpinned greater economic stability.
Source: Dealogic, Bloomberg. A. Data for 2015 are from January to September.
A. Capital flows B. Sovereign bond spreads
FIGURE 2.6.2 Capital market developments
Capital flows to the region slowed in 2015, led by reduced cross-border
bank lending. Several countries tapped the international bond market,
taking advantage of the global low-interest rate environment and investors’
search for yield. However, yields were higher, as sovereign spreads rose,
reflecting a re-assessment of risk by investors as headwinds, and
expectations of interest rate increases in the U.S., weighed on the region.

CHAPTER 2. 6 GLOBAL ECONOMIC PROSPECTS | JANUARY 2016 156
Outlook
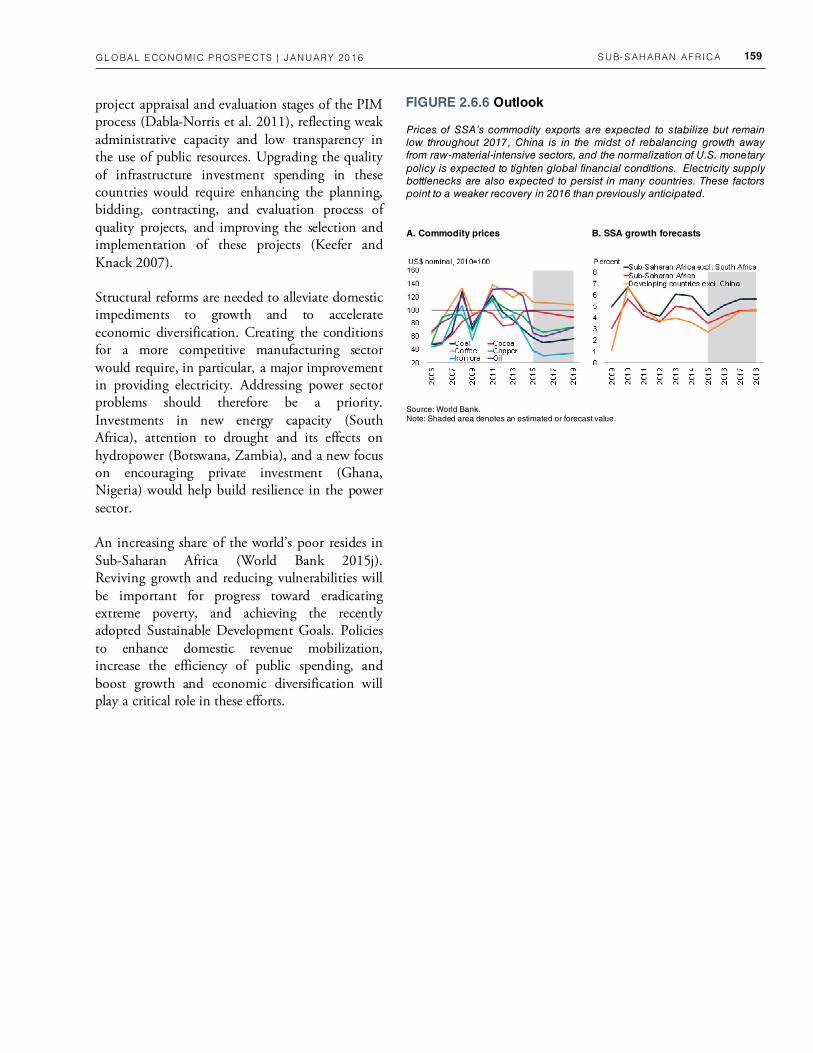
Sub-Saharan Africa faces a challenging near-term outlook. Commodity prices are expected to stabilize but remain low through 2017 (Figure 2.6.6A). The normalization of U.S. monetary policy is expected to tighten global financial conditions. Although governments are taking steps to resolve power issues, electricity supply bottlenecks are expected to persist. These factors point to a somewhat weaker recovery in 2016 than previously anticipated. After slowing to 3.4 percent in 2015, activity is expected to pick up to 4.2 percent in 2016 and to 4.7 percent in 2017-18 (Figure 2.6.6B). This projection assumes that commodity prices stabilize and electricity constraints ease (Table 2.6.1). There are, however, considerable variations within the region.
Consumption dynamics will continue to differ for oil exporters and importers. Private consumption growth is expected to remain weak in oil exporters as the removal of subsidies to alleviate pressure on budgets results in higher fuel costs, and as currency depreciation weigh on consumers’ purchasing power. By contrast, lower inflation in oil importers, owing in part to lower fuel prices, should help boost consumer spending. The price level impact of currency depreciation combined with interest rate increases could, however, moderate these effects.
Investment dynamics will also differ among SSA commodity exporters. The slowdown in major emerging markets, low commodity prices, and deteriorating growth prospects in many commodity exporters, are expected to result in lower FDI flows. Exploration and development activity is expected to be curtailed in oil and gas. Continuing fiscal consolidation in oil-exporting countries is expected to result in further capital expenditure cuts, as governments seek to limit cuts in public-sector wages and protect social spending. However, in a number of low-income, non-oil commodity exporters, governments are expected to continue to invest heavily in energy and transport infrastructure in a bid to improve the operational environment for growth, drawing in part on the proceeds from previous bond issuances (Ethiopia), public-private partnerships (Mozambique, Rwanda, Tanzania), donor aid (Rwanda) and, in some cases, financing from Chinese entities (Ethiopia, Tanzania). Although debt levels may rise, they remain manageable in most low-income countries as growth has been robust.
The fiscal policy stance in commodity exporters is expected to ease gradually as commodity prices stabilize. In Nigeria, ongoing efforts to rationalize the management and operation of the Nigeria National Petroleum Corporation should also help enhance revenue mobilization. However, with oil prices projected to remain below their recent peaks, fiscal revenues are expected to remain low in Angola and Nigeria. As a result, fiscal deficits are likely to increase in these countries, despite efforts to restrain spending. Fiscal deficits are also expected to remain elevated in oil importers, as spending on goods and services, wages, and physical infrastructure continues to expand.
Net exports are expected to make a negative contribution to real GDP growth in the near term, despite currency depreciations. Still-low commodity prices will depress export receipts, especially among oil exporters, even as export volumes rise. The pull from advanced economies is expected to stay modest, given their moderate prospects for medium-term growth. Among oil importers, current account balances are expected to deteriorate in many countries on account of strong import growth, driven by capital goods imports for infrastructure projects.
Source: Nigeria National Bureau of Statistics, Statistics South Africa.
A. Growth in Nigeria’s non-oil sectors B. Electricity supply in South Africa
FIGURE 2.6.3 Domestic constraints
The headwinds of low commodity prices and higher borrowing costs were
compounded by severe infrastructure constraints in many countries. In
Nigeria, the pronounced contraction of the manufacturing sector reflected
huge electricity deficits. In South Africa, power supply bottlenecks,
compounded by difficult labor relations, weighed heavily on growth.

SUB- SAHARAN AFRICA GLOBAL ECONOMIC PROSPECTS | JANUARY 2016 157
In this context:
• Activity is expected to remain subdued in the region’s three largest economies (Table 2.6.2). In Nigeria, power and fuel shortages, and fiscal consolidation, which weighed on activity in 2015, are expected to diminish gradually. Growth is expected to remain weak in South Africa, as inadequate power supply, weak business confidence, difficult labor relations, and policy tightening slow activity. In Angola, government spending remains constrained, and elevated inflation has weakened consumer spending.
• Among the region’s frontier markets, rising oil production and diminishing fiscal and current account imbalances are expected to help lift growth in Ghana. However, in Zambia, low copper prices, compounded by regulatory uncertainty and electricity shortages, will curtail copper production, export, and investment. Meanwhile, despite pressure on the shilling, Kenya is expected to grow at a robust pace, supported by large-scale infrastructure projects, including the expansion of the railway system, which should help boost domestic trade, and a new port.
• The region’s low-income countries are expected to continue to sustain high GDP growth. Many of these countries have limited exposure to the commodities that are experiencing the most severe decline in prices. Meanwhile, large-scale investment projects in energy and transport are ongoing, consumer spending remains robust, boosted by lower fuel prices, and despite low minerals prices, mining output is set to rise in several countries. Public investment, consumer spending, and mining production will help Côte d'Ivoire, Ethiopia, Mozambique, Rwanda, and Tanzania sustain rapid growth in 2016 and beyond. Several low-income countries in the West African Economic and Monetary Union (WAEMU)2 region are
expected to see steady growth, helped in part by the stable currency peg to the euro.
Risks
The balance of risks to the outlook remains tilted to the downside. On the domestic front, political upheavals and conflicts in Burundi, Burkina Faso, and South Sudan suggest that political risks associated with the electoral process will remain a key issue for the region in 2016. Security risks tied to Boko Haram insurgencies are significant for Cameroon, Chad, Niger, and Nigeria; while terrorist threats remain a concern for Kenya and Mali. These events could generate greater political instability for the region if they were to escalate, hurting growth. The assumption that electric power constraints will ease might prove too optimistic. The power supply crisis may worsen, as a result of a lack of reforms, which would hold economic activity back in many countries.
Many countries of the region have domestic macroeconomic weaknesses that leave them vulnerable to shocks. In these countries, fiscal and current account deficits are sizeable and debt levels are rising. If these conditions were to deteriorate significantly, shocks could manifest themselves in substantial currency pressures, higher inflation, and lower business confidence.
Source: IMF Fiscal Monitor, IMF World Economic Outlook.
A. Fiscal balance B. Government debt
FIGURE 2.6.4 Fiscal deficits and government debt
Fiscal deficits widened across the region. In oil exporters, it was due to
falling oil revenues. In other countries, the widening deficits reflected
higher government spending, including on wages, infrastructure projects,
and subsidies and transfers. In a few countries, measures were
implemented that reduced the deficits. In many countries, fiscal deficits are
now larger than at the onset of the financial crisis. As a result, government
debt has continued to rise, especially in frontier markets.
2WAEMU countries are Benin, Burkina Faso, Côte d’Ivoire, Guinea Bissau, Mali Niger, Senegal, and Togo. Mey share the same currency, the CFA franc, which is pegged to the euro.
CHAPTER 2. 6 GLOBAL ECONOMIC PROSPECTS | JANUARY 2016 158
On the external front, there are a number of major risks to the forecast. A further decline in oil prices would sharply reduce government spending in oil-producing countries. A sharper-than-expected slowdown in China could result in a renewed across-the-board weakening in commodity prices, which would delay further or lead to a cancelation of planned investments in resource sectors. A sudden deterioration in global liquidity conditions could push up financing costs and result in cut-offs of capital flows.
Policy challenges
The global economic environment will be less conducive to growth in Sub-Saharan Africa over the next several years than in the recent past. Lower commodity prices and tightening global financial conditions will hinder activity. In most commodity exporters, thin buffers limit the scope for counter-cyclical policies to support economic activity without exacerbating existing fiscal and external vulnerabilities. Policies are needed to respond to growing vulnerabilities, address domestic constraints to activity, and promote non-commodity sources of growth.
Oil, mineral, and metal exporters are the most exposed to the decline in commodity prices. In these countries, exchange rate flexibility could help an adjustment to a low commodity-price
environment. However, they may need to tighten their macroeconomic policy stances, and strengthen their monetary policy frameworks, to prevent inflation induced by currency depreciation from becoming a constant threat. It will also be critical for these countries to carefully manage sovereign borrowing on international capital markets.
In many countries, measures to strengthen domestic resource mobilization to reduce overdependence on revenue from the resource sector, and to raise the efficiency of public expenditures, are needed to rebuild fiscal space and resilience to shocks. Funding much-needed social programs and public infrastructure could help reduce the inequality of opportunity that is contributing to high poverty rates in the region (World Bank 2015r).
Resource-rich countries would benefit from improving their non-resource tax systems. Tax revenues in SSA, as a share of GDP, have increased since the 1980s. However, much of the improvement was driven by the growth in revenues from oil producers. Excluding resource-based revenues, there has been limited improvement in the domestic mobilization of tax revenues in the region. A number of studies (AfDB and OECD 2010) have identified broad areas in which tax systems in SSA could usefully strengthened. In the short run, policy makers need to concentrate on ways to broaden the tax base. Policy options include removing tax preferences, streamlining transfer pricing by multinational companies, and doing a better job of taxing extractive industries fairly and transparently. In the medium term, policy makers need to design strategies to bring small enterprises into the tax net and boost administrative capacity. Over the long run, instruments such as urban property taxes could help generate revenues from a more balanced tax mix.
The decline in commodity prices makes it important for resource-rich countries to improve their public investment management (PIM) system, which could help boost growth (Rajaram et al. 2014). SSA’s oil-exporters, on average, have lower PIM scores than others, especially at the
Source: Haver Analytics, World Bank. A. An increase denotes real appreciation.
FIGURE 2.6.5 Exchange rates and inflation
High fiscal and current account deficits kept currencies under pressure,
particularly against the U.S. dollar. However, in real effective terms, the
average exchange rate movement for SSA as a whole has been relatively
small. Inflation remained moderate for the most part in the region, helped
by low commodity prices, although currency weaknesses contributed to
higher inflation in many countries, including Angola, Ghana, and Zambia.
A. Real effective exchange rates B. Consumer price inflation
SUB- SAHARAN AFRICA GLOBAL ECONOMIC PROSPECTS | JANUARY 2016 159
project appraisal and evaluation stages of the PIM process (Dabla-Norris et al. 2011), reflecting weak administrative capacity and low transparency in the use of public resources. Upgrading the quality of infrastructure investment spending in these countries would require enhancing the planning, bidding, contracting, and evaluation process of quality projects, and improving the selection and implementation of these projects (Keefer and Knack 2007).
Structural reforms are needed to alleviate domestic impediments to growth and to accelerate economic diversification. Creating the conditions for a more competitive manufacturing sector would require, in particular, a major improvement in providing electricity. Addressing power sector problems should therefore be a priority. Investments in new energy capacity (South Africa), attention to drought and its effects on hydropower (Botswana, Zambia), and a new focus on encouraging private investment (Ghana, Nigeria) would help build resilience in the power sector.
An increasing share of the world’s poor resides in Sub-Saharan Africa (World Bank 2015j). Reviving growth and reducing vulnerabilities will be important for progress toward eradicating extreme poverty, and achieving the recently adopted Sustainable Development Goals. Policies to enhance domestic revenue mobilization, increase the efficiency of public spending, and boost growth and economic diversification will play a critical role in these efforts.
Source: World Bank. Note: Shaded area denotes an estimated or forecast value.
A. Commodity prices B. SSA growth forecasts
FIGURE 2.6.6 Outlook
Prices of SSA’s commodity exports are expected to stabilize but remain
low throughout 2017, China is in the midst of rebalancing growth away
from raw-material-intensive sectors, and the normalization of U.S. monetary
policy is expected to tighten global financial conditions. Electricity supply
bottlenecks are also expected to persist in many countries. These factors
point to a weaker recovery in 2016 than previously anticipated.

CHAPTER 2. 6 GLOBAL ECONOMIC PROSPECTS | JANUARY 2016 160
TABLE 2.6.1 Sub-Saharan Africa forecast summary (Annual percent change unless indicated otherwise)
(Percentage point difference
from June 2015 projections)
2013 2014 2015e 2016f 2017f 2018f 2015e 2016f 2017f
Developing SSA, GDPa 4.9 4.6 3.4 4.2 4.7 4.7 -0.8 -0.3 -0.3
(Average including countries with full national accounts and balance of payments data only)b Developing SSA, GDPb 4.8 4.6 3.5 4.2 4.7 4.7 -0.7 -0.4 -0.3
GDP per capita (U.S. dollars) 2.0 1.9 0.8 1.5 2.0 2.0 -0.9 -0.6 -0.5
PPP GDP 5.0 4.9 3.7 4.4 4.9 5.0 -0.7 -0.4 -0.3
Private consumptionc 9.9 3.2 3.1 3.7 4.0 4.1 -0.9 -0.5 -0.5
Public consumption 1.9 3.9 3.2 3.5 3.7 3.8 -0.4 -0.2 -0.1
Fixed investment 9.6 8.7 6.2 6.6 7.1 7.2 -0.5 -0.7 -0.7
Exports, GNFSd -2.2 5.0 2.1 2.6 2.9 2.9 -0.7 -0.5 -0.4
Imports, GNFSd 6.8 3.0 3.0 3.1 3.2 3.2 0.0 0.0 0.0
Net exports, contribution to growth -2.8 0.5 -0.3 -0.2 -0.2 -0.2 -0.2 -0.1 -0.2
Memo items: GDP
Broader geographic regione 4.8 4.5 3.3 4.2 4.6 4.7 -0.7 -0.3 -0.4
SSA excluding South Africa 5.8 5.7 4.1 5.1 5.7 5.7 -0.8 -0.3 -0.2
Oil exportersf 5.5 5.4 3.3 4.5 5.2 5.2 -0.8 -0.3 -0.3
CFA countriesg 4.6 5.5 4.4 5.7 6.0 5.9 0.3 0.2 0.0
South Africa 2.2 1.5 1.3 1.4 1.6 1.6 -0.7 -0.7 -0.8
Nigeria 5.4 6.3 3.3 4.6 5.3 5.3 -1.2 -0.4 -0.2
Angola 6.8 3.9 3.0 3.3 3.8 3.8 -1.5 -0.6 -1.3
Source: World Bank.
World Bank forecasts are frequently updated based on new information and changing (global) circumstances. Consequently, projections presented here may differ from those contained in other Bank documents, even if basic assessments of countries’ prospects do not differ at any given moment in time.
a. GDP at market prices and expenditure components are measured in constant 2010 U.S. dollars. Excludes Somalia, Central African Republic, and São
Tomé and Principe.
b. Sub-region aggregate excludes Liberia, Somalia, Central African Republic, São Tomé and Principe, and South Sudan, for which data limitations prevent the
forecasting of GDP components. c. The sudden surge in private consumption in the region in 2013 is driven by the revised and rebased NIA data of Nigeria in 2014.
d. Exports and imports of goods and non-factor services (GNFS).
e. Includes developing SSA and the following high-income countries: Equatorial Guinea and Seychelles.
f. Includes Angola; Côte d’Ivoire; Cameroon; Congo, Rep.; Gabon; Nigeria; Sudan; Chad; and Congo, Dem. Rep.
g. Includes Benin; Burkina Faso; Central African Republic; Côte d’Ivoire; Cameroon, Congo, Rep.; Gabon; Equatorial Guinea; Mali; Niger; Senegal; Chad; and Togo.

SUB- SAHARAN AFRICA GLOBAL ECONOMIC PROSPECTS | JANUARY 2016 161
TABLE 2.6.2 Sub-Saharan Africa country forecastsa (Real GDP growth at market prices in percent, unless indicated otherwise)
(Percentage point difference
from June 2015 projections)
2013 2014 2015e 2016f 2017f 2018f 2015e 2016f 2017f
Angola 6.8 3.9 3.0 3.3 3.8 3.8 -1.5 -0.6 -1.3 Benin 5.6 5.4 5.7 5.3 5.1 5.1 1.1 0.7 0.4
Botswanab 9.3 4.4 3.0 4.0 4.2 4.2 -1.3 -0.2 0.0
Burkina Faso 6.7 4.0 4.4 6.0 7.0 7.0 -0.6 -0.2 0.5
Burundi 4.6 4.7 -2.3 3.5 4.8 4.8 -7.1 -1.5 -0.4
Cabo Verde 1.0 1.8 2.9 3.5 4.1 4.1 -0.1 0.1 0.6
Cameroon 5.6 5.9 6.3 6.5 6.5 6.4 2.3 1.9 1.5
Chad 5.7 7.3 4.1 4.9 6.1 6.5 -4.9 0.2 0.5
Comoros 3.5 3.0 2.3 2.5 3.1 3.1 -1.1 -1.2 -0.7
Congo, Dem. Rep. 8.5 9.0 8.0 8.6 9.0 9.0 0.0 0.1 0.0
Côte d'Ivoire 9.2 8.5 8.4 8.3 8.0 8.0 0.4 0.6 0.5
Eritrea 1.3 1.7 0.9 2.0 2.2 2.2 -0.6 0.0 0.0
Ethiopiab 10.5 9.9 10.2 10.2 9.0 9.0 0.7 -0.3 0.5
Gabon 4.3 4.3 4.1 5.1 5.3 5.3 0.1 -0.1 -0.2
Gambia, The 4.8 -0.2 4.0 4.5 5.3 5.3 1.0 -0.6 -0.8
Ghana 7.3 4.0 3.4 5.9 8.2 8.2 -0.1 0.0 0.4
Guinea 2.3 -0.3 0.4 3.5 4.0 4.2 0.7 1.2 1.5
Guinea-Bissau 0.3 2.5 4.4 4.9 5.3 5.3 0.2 1.0 1.3
Kenya 5.7 5.3 5.4 5.7 6.1 6.1 -0.6 -0.9 -0.4
Lesotho 4.6 2.0 2.6 2.8 4.5 4.5 -1.4 -1.7 0.0
Liberia 8.7 1.0 3.0 5.7 6.8 6.8 .. .. .. Madagascar 2.4 3.0 3.2 3.4 3.6 3.6 -1.4 -1.4 -1.4
Malawi 5.2 5.7 2.8 5.0 5.8 5.8 -2.3 -0.6 -0.1
Mali 1.7 7.2 5.0 5.0 5.0 5.0 -0.6 -0.1 -0.2
Mauritania 5.5 6.9 3.2 4.0 4.0 4.0 -2.3 -1.7 -1.6
Mauritius 3.3 3.6 3.5 3.7 3.7 3.7 0.0 0.0 0.0
Mozambique 7.3 7.4 6.3 6.5 7.2 7.2 -0.9 -0.8 -0.1
Namibia 5.7 6.4 5.0 5.5 5.9 5.9 -0.5 0.2 0.8
Niger 4.6 6.9 4.4 5.3 9.3 5.7 -0.1 -0.2 1.6
Nigeria 5.4 6.3 3.3 4.6 5.3 5.3 -1.2 -0.4 -0.2
Rwanda 4.7 7.0 7.4 7.6 7.6 7.6 0.4 0.6 0.1
Senegal 3.5 3.9 5.0 5.3 5.3 5.3 0.2 0.3 0.1
Sierra Leone 20.1 7.0 -20.0 6.6 5.3 5.3 -7.2 -1.8 -3.6
South Africa 2.2 1.5 1.3 1.4 1.6 1.6 -0.7 -0.7 -0.8
South Sudan 13.1 3.4 -5.3 3.5 7.0 7.0 .. .. .. Sudan 3.3 3.1 3.5 3.4 3.9 3.9 0.9 -0.1 0.0
Swaziland 2.8 2.5 1.3 0.8 0.8 0.8 -0.7 -1.0 -0.8
Tanzania 7.3 7.0 7.2 7.2 7.1 7.1 0.0 0.1 0.0
Togo 5.1 5.7 5.1 4.9 4.7 4.7 0.0 0.0 0.0
Ugandab 3.6 4.0 5.0 5.0 5.8 5.8 -0.5 -0.7 0.0
Zambia 6.7 5.6 3.5 3.8 5.4 6.0 -2.1 -2.4 -1.5
Zimbabwe 4.5 3.2 1.0 2.8 3.0 3.0 0.0 0.3 -0.5
Recently transitioned to high-income countriesc Equatorial Guinea -4.8 -3.1 -9.3 2.3 -0.4 -0.2 6.1 -1.3 -4.1
Seychelles 6.6 2.8 3.5 3.7 3.6 3.6 0.0 0.0 -0.1
Source: World Bank.
World Bank forecasts are frequently updated based on new information and changing (global) circumstances. Consequently, projections presented here may differ from those contained in other Bank documents, even if basic assessments of countries’ prospects do not significantly differ at any given moment in time.
a. Central African Republic, São Tomé and Principe, and Somalia are not forecast due to data limitations.
b. Fiscal-year based numbers.
c. Based on the World Bank’s reclassification from 2004 to 2015.

CHAPTER 2. 6 GLOBAL ECONOMIC PROSPECTS | JANUARY 2016 162
Introduction
SSA is an open region, with diversified trade partners and sources of finance (Figure 2.6.1.1). Much of Sub-Saharan African trade takes place with countries outside the region. Advanced economies remain the largest destinations of Sub-Saharan Africa’s exports. However, China and other developing countries in Asia are increasingly prominent. Intraregional trade and financial linkages within the region have expanded in recent years and look set to expand faster in the years ahead.
This box examines the extent of regional integration. In particular, it takes a closer look at linkages between SSA’s two largest economies—Nigeria and South Africa—and the rest of the region to assess the potential significance of intra-regional growth spillovers. The box addresses the following questions:
• How open is Sub-Saharan Africa to global and regional trade and financial flows?
• How large are the potential intra-regional spillovers from the region’s two largest economies, Nigeria and South Africa?
The region is highly open to the world economy, with a diverse group of trade and financial partners, and intra-regional ties have grown rapidly since the mid-2000s. Nevertheless, estimated growth spillovers from South Africa and Nigeria to the rest of SSA are statistically insignificant. This may reflect the globally diversified nature of SSA’s global trade and financial partners. It may also reflect inadequate data for countries most closely integrated with South Africa and Nigeria.
How open is Sub-Saharan Africa to global and
regional trade and financial flows?
SSA’s integration into global trade networks has increased remarkably over the past three decades (UNCTAD 2013). Advanced economies remain the main trading partners for SSA. However, recent years have seen a fundamental shift in the direction of SSA trade towards China and away
from the traditional advanced country markets. The export exposure of SSA countries to advanced-economies has halved over the decade ending 2014. The fall in the share of the region’s exports to the United States, to about 1 percent of GDP in 2014 from its peak of 8 percent in 2005, was particularly pronounced (Figure 2.6.1.2). This reflected in part a sharp decline in Nigeria’s oil exports as U.S. oil shale production expanded. More broadly, the anemic recovery in Euro Area countries and other advanced economies following the global financial crisis underpinned the decline in the share of SSA’s exports to advanced economies.
China’s trade with Sub-Saharan Africa has been driven by China’s fast growth of investment in capital goods that require intensive inputs of primary commodities, notably oil and metals (Drummond and Liu 2013). By 2012, China had become SSA’s single largest national trading partner. Angola, Democratic Republic of Congo, Equatorial Guinea, Republic of Congo, and South Africa account for about 75 percent of SSA’s exports to China (oil, metals, and mineral fuels). Similarly, Angola, Benin, Ghana, Liberia, Nigeria, and South Africa account for more than 80 percent of SSA’s total imports from China (mainly machinery, chemicals, and manufactured goods).
Financial linkages between SSA and the rest of the world have grown considerably in the last decade, with some shift in composition towards flows into regional capital markets and direct investment.
• The stock of private external claims on SSA represented 40 percent of the region’s GDP in 2013, slightly lower than its peak of 45 percent of GDP in 2010. Although most SSA countries have limited or no access to international capital markets, portfolio investment claims on the region—originating mostly from the U.S. and Euro Area—more than doubled between 2001 and 2010. South Africa, with its highly developed financial markets, has been the main recipient of portfolio investments. Cross-border banking claims on SSA, which before the global financial crisis had risen above portfolio claims, have since moderated. European banks have deleveraged and oriented their activities toward developing countries in Asia. Cross-border bank lending flows originate mainly from U.K. and Euro Area lenders,
BOX 2.6.1 Regional integration and spillovers: Sub-Saharan Africa
Note: This box was prepared by Gerard Kambou and Jesper Hanson, with contributions from Raju Huidrom.
Over the past decade, regional integration in Sub-Saharan Africa (SSA) has expanded. Though still low, intraregional trade represents a growing share of the region’s trade. Cross-border financing flows within Sub-Saharan Africa have increased rapidly. Nevertheless, shocks to growth in the two largest economies – Nigeria and South Africa – appear to have no measurable effects on other countries in the region.

SUB- SAHARAN AFRICA GLOBAL ECONOMIC PROSPECTS | JANUARY 2016 163
with Angola, Botswana, Mozambique, Tanzania, and Zambia among the largest recipients. Foreign direct investments are the largest capital inflows to the region. FDI liabilities represented more than 15 percent of SSA’s GDP in 2013. While the Euro Area remains an important source of FDI in the region, FDI flows from China have grown rapidly in recent years, and are mostly allocated to the natural resource and infrastructure sectors (World Bank 2015a).
• Remittances and official development assistance amounted to 2 percent and 1.5 percent of GDP in 2014 and 2013, respectively, lower than their levels in 2010. Official development assistance and remittances from advanced economies have been on a declining trend in recent years, reflecting weak growth and austerity budgets in these economies.
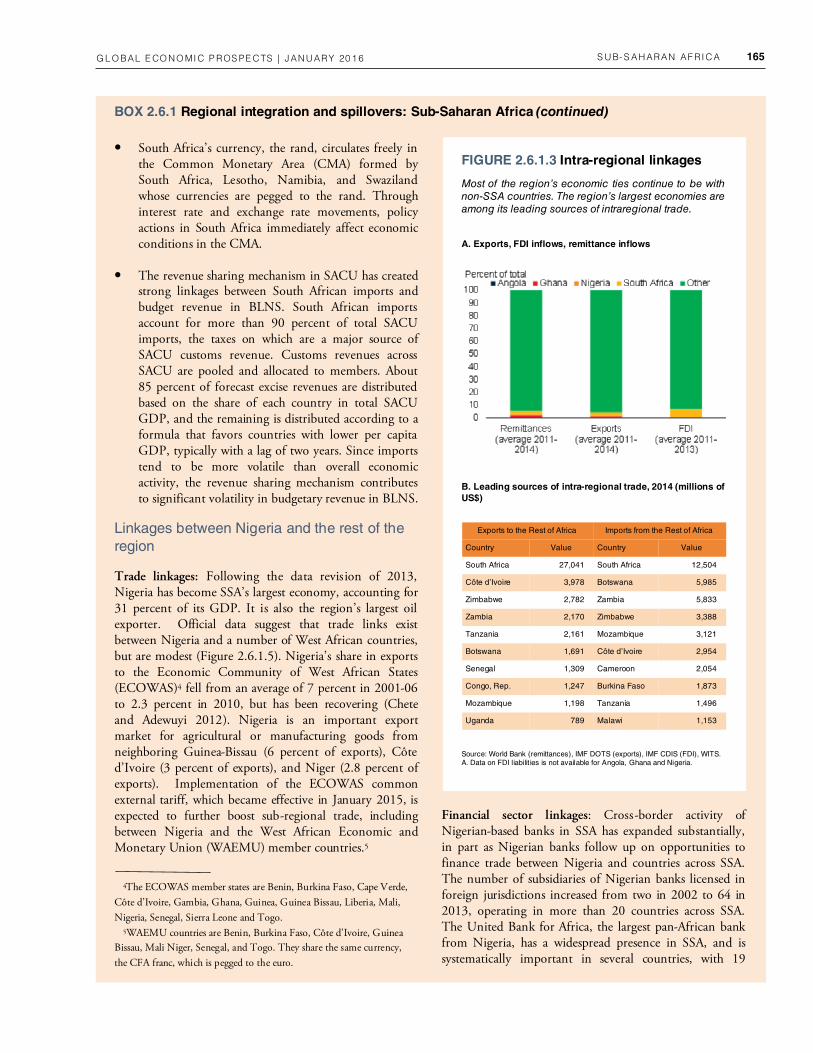
While most economic ties of SSA are to non-SSA countries, intraregional trade, foreign direct investment, cross-border banking flows, and remittances have risen in recent years (Figure 2.6.1.3). The number of Pan-African banking groups has increased rapidly across the region, partly influenced by rising trade flows (IMF 2015l). Furthermore, trade linkages between the region’s largest economies (Nigeria and South Africa) and the rest of the region have been growing and look set to deepen.
Linkages between South Africa and the rest of the region
Trade linkages: South Africa, the region’s second largest economy, accounting for 21 percent of its GDP, is an important export market for its immediate neighbors (Figure 2.6.1.4). In 2011, exports to South Africa accounted for over 80 percent of trade within the South African Customs Union, or SACU (Canales-Kriljenko, Gwenhamo and Thomas et al. 2013).1 Exports to South Africa are particularly large for Swaziland (25 percent of GDP) and Lesotho (10 percent of GDP). Exports from SACU countries consist mostly of agricultural goods; they also include some manufacturing products, chemicals and metals. South Africa is also an important export market for countries in the 15-member Southern African Development Community (SADC) region, especially Mozambique (10 percent of GDP) and Zimbabwe (5 percent of GDP). Fuels dominate Mozambique’s exports to South Africa, while Zimbabwe’s exports consist mainly of agricultural goods and metals. By contrast, exports to
South Africa account for less than 5 percent of GDP in West African countries such as Ghana and Nigeria.
Financial linkages: South Africa is the largest source of foreign direct investment for Botswana, Lesotho, Namibia, and Swaziland (BLNS) (Figure 2.6.1.4), accounting for up to 80 percent of total inward FDI in these countries. South African firms (e.g. Massmart, Nampak, MTN Group) also have a strong presence in the SADC region
BOX 2.6.1 Regional integration and spillovers: Sub-Saharan Africa (continued)
FIGURE 2.6.1.1 Cross-region comparison
The region is open to global trade and finance. It
accounts for about 2 percent of global GDP and trade.
In relation to GDP, the levels of external trade,
investment, and remittances for the average SSA
economy are similar to other developing regions.
Sources: IMF October 2015 World Economic Outlook, IMF International Financial Statistics, IMF Direction of Trade Statistics, UNCTAD FDI/TNC database, World Bank Remittance and Migration Database, World Bank World Development
Indicators. B. The red bar denotes exports, imports, trade, remittance inflows, portfolio liabilities, and FDI inflows in percent of GDP on average across SSA countries. The vertical line denotes the range of averages for all six developing country regions.
A. SSA: Share of global activity, trade, and finance, 2014
B. SSA: Trade and finance in regional comparison, 2014
1SACU member countries are Botswana, Lesotho, Namibia, South Africa, and Swaziland.

CHAPTER 2. 6 GLOBAL ECONOMIC PROSPECTS | JANUARY 2016 164
(Mozambique, Zimbabwe), East African Community (Kenya, Uganda, and Tanzania) and countries in West Africa (Nigeria, Ghana). South Africa-based banks (Standard Bank, First Rand Bank, Nedbank) and other financial institutions are active across the continent, and are systemically important in neighboring countries, as gauged by deposit shares.2 Remittances from South Africa to neighboring countries are also significant—for Lesotho,
they average more than 20 percent of GDP (2011-2014), reflecting the large number of migrant workers employed in South African mines.3
Institutional linkages: South Africa’s monetary and exchange rate policies and the revenue sharing arrangements under SACU are significant sources of linkages.
BOX 2.6.1 Regional integration and spillovers: Sub-Saharan Africa (continued)
FIGURE 2.6.1.2 Linkages between Sub-Saharan Africa and the rest of the world
Countries in Sub-Saharan Africa increasingly participate in international trade. The region’s trade has undergone a shift in
direction towards China and away from traditional advanced country trading partners. Foreign direct investment liabilities have
increased considerably, while remittances and official development assistance from advanced countries have declined.
Relative to GDP, bilateral development assistance has halved over the last ten years to 1.5 percent of regional GDP.
Source: IMF Direction of Trade Statistics, Coordinated Portfolio Investment Survey, Coordinated Direct Investment Survey; Bank for International Sett lements Consolidated Banking Statistics; World Bank Remittances and Migration database, OECD. B: Coordinated Direct Investment Survey (CDIS) is not available for 2001 and 2005; Coordinated Portfolio Investment Survey (CPIS) is not available for 2001. Liabilit ies to banks stand
for claims of BIS-reporting banks on SSA countries. BIS stands for Bank for International Sett lements.
A. Exports B. Financial liabilities
C. Remittances by source country D. Bilateral official development assistance
2Operations are deemed systematically important if the share of their deposits in total banking system deposits exceeds 10 percent; or if their asset share exceeds 7 percent of GDP (IMF 2015l).
3Though still sizeable, remittances to Lesotho have steadily declined in line with the long-term decline in South Africa’s gold production.
SUB- SAHARAN AFRICA GLOBAL ECONOMIC PROSPECTS | JANUARY 2016 165
• South Africa’s currency, the rand, circulates freely in the Common Monetary Area (CMA) formed by South Africa, Lesotho, Namibia, and Swaziland whose currencies are pegged to the rand. Through interest rate and exchange rate movements, policy actions in South Africa immediately affect economic conditions in the CMA.
• The revenue sharing mechanism in SACU has created strong linkages between South African imports and budget revenue in BLNS. South African imports account for more than 90 percent of total SACU imports, the taxes on which are a major source of SACU customs revenue. Customs revenues across SACU are pooled and allocated to members. About 85 percent of forecast excise revenues are distributed based on the share of each country in total SACU GDP, and the remaining is distributed according to a formula that favors countries with lower per capita GDP, typically with a lag of two years. Since imports tend to be more volatile than overall economic activity, the revenue sharing mechanism contributes to significant volatility in budgetary revenue in BLNS.
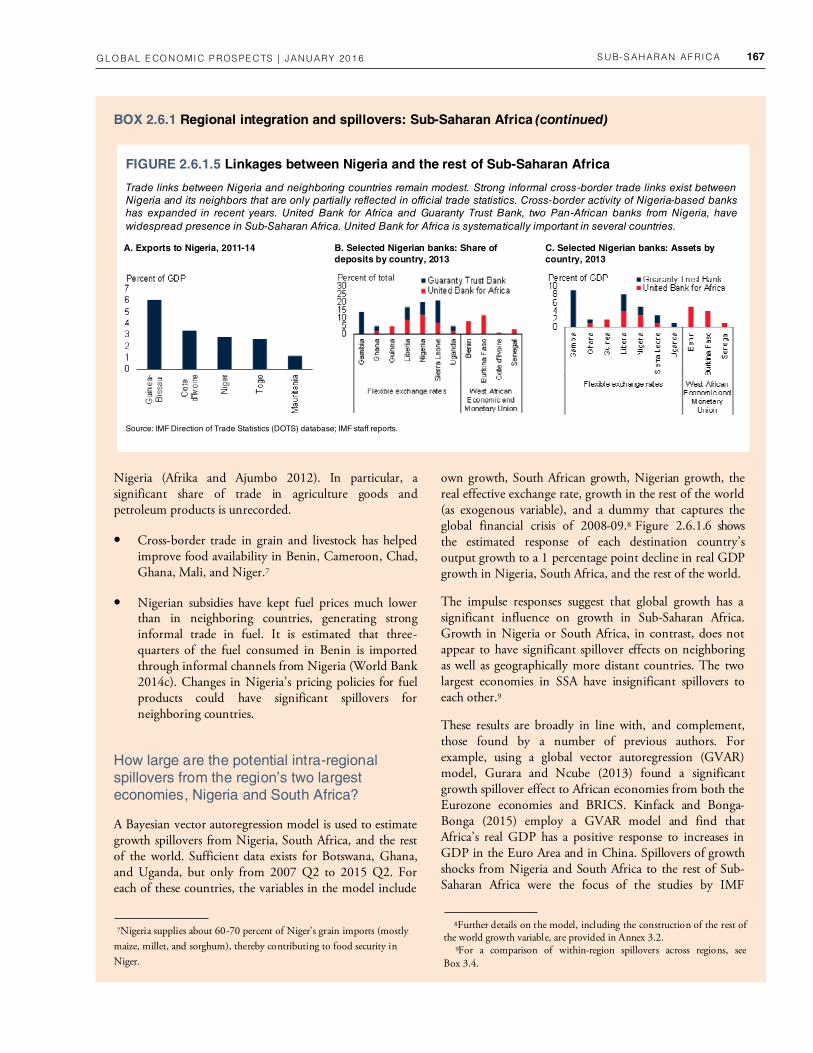
Linkages between Nigeria and the rest of the
region
Trade linkages: Following the data revision of 2013, Nigeria has become SSA’s largest economy, accounting for 31 percent of its GDP. It is also the region’s largest oil exporter. Official data suggest that trade links exist between Nigeria and a number of West African countries, but are modest (Figure 2.6.1.5). Nigeria’s share in exports to the Economic Community of West African States (ECOWAS)4 fell from an average of 7 percent in 2001-06 to 2.3 percent in 2010, but has been recovering (Chete and Adewuyi 2012). Nigeria is an important export market for agricultural or manufacturing goods from neighboring Guinea-Bissau (6 percent of exports), Côte d’Ivoire (3 percent of exports), and Niger (2.8 percent of exports). Implementation of the ECOWAS common external tariff, which became effective in January 2015, is expected to further boost sub-regional trade, including between Nigeria and the West African Economic and Monetary Union (WAEMU) member countries.5
Financial sector linkages: Cross-border activity of Nigerian-based banks in SSA has expanded substantially, in part as Nigerian banks follow up on opportunities to finance trade between Nigeria and countries across SSA. The number of subsidiaries of Nigerian banks licensed in foreign jurisdictions increased from two in 2002 to 64 in 2013, operating in more than 20 countries across SSA. The United Bank for Africa, the largest pan-African bank from Nigeria, has a widespread presence in SSA, and is systematically important in several countries, with 19
BOX 2.6.1 Regional integration and spillovers: Sub-Saharan Africa (continued)
FIGURE 2.6.1.3 Intra-regional linkages
Most of the region’s economic ties continue to be with
non-SSA countries. The region’s largest economies are
among its leading sources of intraregional trade.
Source: World Bank (remittances), IMF DOTS (exports), IMF CDIS (FDI), WITS. A. Data on FDI liabilit ies is not available for Angola, Ghana and Nigeria.
A. Exports, FDI inflows, remittance inflows
B. Leading sources of intra-regional trade, 2014 (millions of US$)
4The ECOWAS member states are Benin, Burkina Faso, Cape Verde,
Côte d’Ivoire, Gambia, Ghana, Guinea, Guinea Bissau, Liberia, Mali,
Nigeria, Senegal, Sierra Leone and Togo. 5WAEMU countries are Benin, Burkina Faso, Côte d’Ivoire, Guinea
Bissau, Mali Niger, Senegal, and Togo. They share the same currency,
the CFA franc, which is pegged to the euro.
Exports to the Rest of Africa
Country Value Country Value
South Africa 27,041 South Africa 12,504
Côte d’Ivoire 3,978 Botswana 5,985
Zimbabwe 2,782 Zambia 5,833
Zambia 2,170 Zimbabwe 3,388
Tanzania 2,161 Mozambique 3,121
Botswana 1,691 Côte d’Ivoire 2,954
Imports from the Rest of Africa
Senegal 1,309 Cameroon 2,054
Congo, Rep. 1,247 Burkina Faso 1,873
Mozambique 1,198 Tanzania 1,496
Uganda 789 Malawi 1,153

CHAPTER 2. 6 GLOBAL ECONOMIC PROSPECTS | JANUARY 2016 166
subsidiaries contributing 15 percent to total assets.6. This rapid cross-border expansion increases the potential for financial sector shocks in Nigeria to be transmitted across the region. Other potential spillover channels appear limited. In particular, remittances from Nigeria to
neighboring countries are small relative to GDP; and foreign direct investment from Nigeria in the region, outside the financial sector, is negligible.
Informal sector linkages: Strong informal cross-border trade links exist between Nigeria and neighboring countries that are only partially captured in official statistics. Estimates of informal cross-border trade in West Africa show that it could represent 20 percent of GDP in
BOX 2.6.1 Regional integration and spillovers: Sub-Saharan Africa (continued)
A. Exports to South Africa, 2011-14 B. FDI inflows and remittances from South Africa, 2011-13
C. Selected South Africa banks: share of deposits by country, 2013
D. Selected South Africa banks: assets by country, 2013
FIGURE 2.6.1.4 Linkages between South Africa and the rest of Sub-Saharan Africa
South Africa is an important market destination for immediate neighboring countries, as well as for countries in the broader
Southern African Development Community region. South Africa is the largest source of FDI for Botswana, Namibia,
Lesotho, and Swaziland. It remains an important source of remittances for many countries in the Southern Africa region.
South Africa-based banks are active across SSA and systematically important in neighboring countries.
Source: IMF Direction of Trade Statistics, Coordinated Direct Investment Survey, World Bank Migration and Remittances Database, IMF staff reports.
Note: BNLS denotes Botswana, Namibia, Lesotho, and Swaziland.
A: Chart shows countries with exports to South Africa higher than 2 percent of GDP.
B: Chart shows countries with FDI from South Africa higher than 2 percent of GDP.
6Ecobank, a full service bank based in Togo, is one of the region’s
largest pan-Africa Banks with operations in 36 African countries.
SUB- SAHARAN AFRICA GLOBAL ECONOMIC PROSPECTS | JANUARY 2016 167
Nigeria (Afrika and Ajumbo 2012). In particular, a significant share of trade in agriculture goods and petroleum products is unrecorded.
• Cross-border trade in grain and livestock has helped improve food availability in Benin, Cameroon, Chad, Ghana, Mali, and Niger.7
• Nigerian subsidies have kept fuel prices much lower than in neighboring countries, generating strong informal trade in fuel. It is estimated that three-quarters of the fuel consumed in Benin is imported through informal channels from Nigeria (World Bank 2014c). Changes in Nigeria’s pricing policies for fuel products could have significant spillovers for neighboring countries.
How large are the potential intra-regional spillovers from the region’s two largest economies, Nigeria and South Africa?
A Bayesian vector autoregression model is used to estimate growth spillovers from Nigeria, South Africa, and the rest of the world. Sufficient data exists for Botswana, Ghana, and Uganda, but only from 2007 Q2 to 2015 Q2. For each of these countries, the variables in the model include
own growth, South African growth, Nigerian growth, the real effective exchange rate, growth in the rest of the world (as exogenous variable), and a dummy that captures the global financial crisis of 2008-09.8 Figure 2.6.1.6 shows the estimated response of each destination country’s output growth to a 1 percentage point decline in real GDP growth in Nigeria, South Africa, and the rest of the world.
The impulse responses suggest that global growth has a significant influence on growth in Sub-Saharan Africa. Growth in Nigeria or South Africa, in contrast, does not appear to have significant spillover effects on neighboring as well as geographically more distant countries. The two largest economies in SSA have insignificant spillovers to each other.9
These results are broadly in line with, and complement, those found by a number of previous authors. For example, using a global vector autoregression (GVAR) model, Gurara and Ncube (2013) found a significant growth spillover effect to African economies from both the Eurozone economies and BRICS. Kinfack and Bonga-Bonga (2015) employ a GVAR model and find that Africa’s real GDP has a positive response to increases in GDP in the Euro Area and in China. Spillovers of growth shocks from Nigeria and South Africa to the rest of Sub-Saharan Africa were the focus of the studies by IMF
BOX 2.6.1 Regional integration and spillovers: Sub-Saharan Africa (continued)
A. Exports to Nigeria, 2011-14 B. Selected Nigerian banks: Share of deposits by country, 2013
C. Selected Nigerian banks: Assets by country, 2013
FIGURE 2.6.1.5 Linkages between Nigeria and the rest of Sub-Saharan Africa
Trade links between Nigeria and neighboring countries remain modest. Strong informal cross-border trade links exist between
Nigeria and its neighbors that are only partially reflected in official trade statistics. Cross-border activity of Nigeria-based banks
has expanded in recent years. United Bank for Africa and Guaranty Trust Bank, two Pan-African banks from Nigeria, have
widespread presence in Sub-Saharan Africa. United Bank for Africa is systematically important in several countries.
Source: IMF Direction of Trade Statistics (DOTS) database; IMF staff reports.
7Nigeria supplies about 60-70 percent of Niger’s grain imports (mostly
maize, millet, and sorghum), thereby contributing to food security in
Niger.
8Further details on the model, including the construction of the rest of the world growth variable, are provided in Annex 3.2. 9For a comparison of within-region spillovers across regions, see Box 3.4.

CHAPTER 2. 6 GLOBAL ECONOMIC PROSPECTS | JANUARY 2016 168
(2012b) and Canales-Kriljenko et al.(2013), with the latter focusing on the BLNS countries. Both studies used vector autoregression models. They find that shocks to South Africa’s growth have no significant spillover effects on the BNLS countries, or the rest of the continent. Similarly, spillovers from Nigerian growth to neighboring countries were found to be insignificant, suggesting that Nigeria still has weak links with the rest of the region.
The finding that developments in Nigeria and South Africa have limited effects on growth in other countries in the region could be due to a number of factors. The first is the possibility that the economies of South Africa and those of the rest of SSA may have decoupled in the 1990s following the removal of international sanctions as apartheid ended and South Africa re-integrated into the world economy (Basdevant et al. 2014). As SSA countries integrated rapidly with the rest of the world during the 2000s, external shocks became the predominant cause of fluctuations in SSA activity (Kabundi and Loots 2007). Second, those countries that are most deeply integrated with Nigeria and South Africa—for example, Benin, Ghana, Lesotho, Namibia, Swaziland—do not have sufficiently long time series of data to estimate spillovers.
Conclusion and policy implications
While the region’s main economic partners are outside the region, intraregional trade and financial links in Sub-Saharan Africa have expanded in recent years. Trade, financial, and institutional linkages between Nigeria and
South Africa, the region’s two largest economies, and the rest of the region have been growing. Notwithstanding this development, the quantitative analysis suggests that growth in Nigeria and South Africa has negligible spillover effects on their neighbors as well as more distant countries.
While intra-African trade has increased in recent years, it remains low. Formal barriers to trade, including tariff and quotas, inefficient customs procedures, and the inadequate state of transport infrastructure within the region are among the major reasons for low trade flows between SSA countries (World Bank 2012b). These are several areas in which policy can make a difference. Reductions in tariff, streamlining customs procedures, and investments in infrastructure—especially for landlocked countries—would raise the prospects for mutually beneficial growth spillovers.
Policy actions are also needed to stem the rise of informality in the region by facilitating the transition of firms from the informal to the formal economy. This would require intensifying ongoing efforts to improve the business climate across the region, including simplified procedures for obtaining permits for business registration, simplified tax systems, and reduced compliance costs for laws and regulations. A strengthened capacity of government agencies to administer laws and to improve the quality and efficiency of regulations would help in making such reforms effective (World Bank 2015f).
BOX 2.6.1 Regional integration and spillovers: Sub-Saharan Africa (continued)
B. Impact of 1 percentage point decline in Nigeria’s growth
FIGURE 2.6.1.6 Regional spillovers in SSA
Events that affect world growth spill over into SSA. Growth shocks in Nigeria and South Africa do not appear to have significant
spillovers to neighboring countries.
Source: World Bank.
Note: The results show the cumulative change in growth after two years in response to 1 percentage point change in the rest of the world, Nigerian and South African growth
based on Bayesian vector autoregression, using data for 2007Q2-2015Q2. Bars are the median estimates and the error bands represent the 33-66 percent confidence
bands. SSA refers to the cross sectional median estimates across BWA, GHA, NGA, UGA, and ZAF. BWA = Botswana; GHA = Ghana; NGA = Nigeria; UGA = Uganda; ZAF
= South Africa; SSA = Sub-Saharan Africa.
A. Impact of 1 percentage point decline in growth in the rest of the world
C. Impact of 1 percentage point decline in South Africa’s growth

REFERENCES GLOBAL ECONOMIC PROSPECTS | JANUARY 2016 169
Arteta, C., M. A. Kose, F. Ohnsorge, and M. Stocker. 2015. “The Coming U.S. Interest Rate Tightening Cycle: Smooth Sailing or Stormy Waters?” Policy Research Note 15/02, World Bank, Washington, DC.
Asian Development Bank. 2015. Asian Development Outlook 2015 Update – Enabling Women, Energizing Asia. Manila, Philippines: Asian Development Bank.
Baffes, J., M. A. Kose, F. Ohnsorge, and M. Stocker. 2015. “The Great Plunge in Oil Prices: Causes, Consequences, and Policy Responses.” Policy Research Note 15/01, World Bank, Washington, DC.
Baier, S. L., and J. H. Bergstrand. 2009. “Estimating the Effects of Free Trade Agreements on International Trade Flows using Matching Econometrics.” Journal o f International Economics 77(1):63-76.
Basdevant, O., M. A. W. Jonelis, M. B. Mircheva, and M. S. T. Slavov. 2014. "The Mystery of Missing Real Spillovers in Southern Africa: Some Facts and Possible Explanations." African Department Working Paper 14/03, International Monetary Fund, Washington, DC.
Bayoumi, T., and F. Ohnsorge. 2013. “Do Inflows or Outflows Dominate? Global Implications of Capital Account Liberalization in China.” IMF Working Paper 13/189, International Monetary Fund, Washington. DC.
Balli, F., S. A. Basher, and R. J. Louis. 2013. “Risk Sharing in the Middle East and North Africa.” Economics o f Transition 21 (1): 135-55.
Balli, F., H. R. Hajhoj, S. A. Basher, and H. B. Ghassan. 2015. “An Analysis of Returns and Volatility Spillovers and their Determinants in Emerging Asian and Middle Eastern Countries.” International Review of Economics & Finance 39 (September): 311-25.
Behar, A., and J. Espinosa-Bowen. 2014. “Export Spillovers from Global Shocks for the Middle East and Central Asia.” IMF Working Paper 14/80, International Monetary Fund, Washington, DC.
References
Abdih Y., A. Barajas, R. Chami, and C. Ebeke. 2012. “Remittances Channel and Fiscal Impact in the Middle East, North Africa and Central Asia.” IMF Working Papers 12/104, International Monetary Fund, Washington, DC.
Acharya, V., S. Cecchetti, J. De Gregorio, S. Kalemli-Özcan, P. Lane, and U. Panizza. 2015. “Corporate Debt in Emerging Economies: A Threat to Financial Stability?” Brookings Institution, Washington, DC.
Adler, G., and S. Sosa. 2014. “Intraregional Spillovers in South America: Is Brazil Systemic After All?” The World Economy 37 (3): 456-80.
African Development Bank and Organization for Economic Cooperation and Development. 2010. “Public Resource Mobilization and Aid in Africa.” In African Economic Outlook. Paris: Organization for Economic Cooperation and Development; Tunis: African Development Bank.
Afrika, J-G., and G. Ajumbo. 2012. “Informal Cross Border Trade in Africa: Implications and Policy Recommendations.” Africa Economic Brief 3 (10), African Development Bank, Abidjan, Côte d'Ivoire.
Ahmed, S., and E. Ghani, eds. 2007. South Asia: Growth and Regional Integration. New Delhi: Macmillan.
______. 2008. “Making Regional Cooperation Work for South Asia's Poor.” Policy Research Working Paper 4736, World Bank, Washington, DC.
Ahmed, S., S. Kelegama, and E. Ghani. 2010. Promoting Economic Cooperation in South Asia: Beyond SAFTA. New Delhi: Sage Publications.
Ahuja, A., and M. Nabar. 2012. “Investment-Led Growth in China: Global Spillovers.” IMF Working Paper 12/267, International Monetary Fund, Washington, DC.
Aiolfi, M., L. A. V. Catão, and A. Timmermann. 2011. “Common Factors in Latin America’s Business Cycles.” Journal o f Development Economics 95 (2): 212-28.

CHAPTER 2 GLOBAL ECONOMIC PROSPECTS | JANUARY 2016 170
the World Economy and Business Cycles in Latin America.” Economía 12 (2): 1-75.
Chishti, M., and F. Hipsman. 2015. “In Historic Shift, New Migration Flows from Mexico Fall Below Those From China and India.” Migration Policy Institute Policy Beat. May 21, 2015.
Chete, N. L., and A. O. Adewuyi. 2012. “Dynamics of Trade between Nigeria and other ECOWAS Countries.” In Accelerating Growth Through Improved Intra-African Trade. Washington, DC: Brookings Institution.
China Outbound Tourism Research Institute. 2015. Chinese Outbound Tourism 2.0. Hamburg: China Outbound Tourism Research Institute.
Chinn, M. and H. Ito. 2006. “What Matters for Financial Development? Capital Controls, Institutions, and Interactions.” Journal o f Development Economics 81(1): 163–92.
Clinton, K., M. Johnson, J. Benes, D. Laxton, and T. Matheson. 2010. “Structural Models in Real Time.” IMF Working Papers 10/56, International Monetary Fund, Washington, DC.
Connolly, M. P., and J. Gunther. 1999. “Mercosur: Implications for Growth in Member Countries.” Current Issues in Economics and Finance 5(7).
Cuevas, A., M. Messmacher, and A. Werner. 2002. “Changes in the Patterns of External Financing in Mexico Since the Approval of NAFTA.” Working Paper, Central Bank of Mexico, Mexico City.
______. 2003 “Macroeconomic Synchronization Between Mexico and its NAFTA Partners.” Working Paper 2003-01, Banco de México, Mexico City.
Dabla-Norris, E., J. Brumby, A. Kyobe, Z. Mills, and C. Papageorgiou. 2011. “Investing in Public Investment: An Index of Public Investment Efficiency.” IMF Working Paper 11/37, International Monetary Fund, Washington, DC.
De la Torre, A., T. Dider, A. Ize, D. Lederman, and S. L. Schmukler. 2015. Latin America and the Rising South: Changing World, Changing Priorities. Washington, DC: World Bank.
Blanchard, O. 2014. “Where Danger Lurks.” Finance & Development 51 (3): 28-31.
Boschi M., and A. Girardi. 2011. “The Contribution of Domestic, Regional and International Factors to Latin America’s Business Cycle.” Economic Modelling 28: 1235–46.
Camacho, M. and G. Perez-Quiros. 2013. “Commodity Prices and the Business Cycle in Latin America: Living and Dying by Commodities?” Working Paper 1304, Bank of Spain, Madrid.
Calì, M., W. Harake, F. Hassan, and C. Struck. 2015. “The Impact of the Syrian Conflict on Lebanese Trade.” Working Paper 96087, World Bank, Washington, DC.
Canales Kriljenko, J., F. Gwenhamo, and S. Thomas. 2013. “Inward and Outward Spillovers in the SACU Area.” IMF Working Paper 13/31, International Monetary Fund, Washington, DC.
Canales Kriljenko, J., M. Hosseinkouchack, and A. M. Cirkel. 2014. “Global Financial Transmission into Sub-Saharan Africa—A Global Vector Autoregression.” IMF Working Paper 14/241, International Monetary Fund, Washington, DC.
Canova F., and P. Dallari. 2013. “How Important is Tourism for the International Transmission of Cyclical Fluctuations? Evidence from the Mediterranean.” European Central Bank Working Paper 1553, European Central Bank, Frankfurt.
Caporale, G. M., and A. Girardi. 2012. “Business Cycles, International Trade and Capital Flows: Evidence from Latin America.” Empirical Economics (February): 1-22.d
Cashin, P., K. Mohaddes, and M. Raissi. 2012. “The Global Impact of the Systemic Economies and MENA Business Cycles.” IMF Working Paper 12/255, International Monetary Fund, Washington, DC.
CBO (Congressional Budget Office). 2003. “The Effects of NAFTA on U.S.-Mexican Trade and GDP.” A CBO Paper, Congressional Budget Office, Washington, DC.
Cesa-Bianchi, A., M. H. Pesaran, A. Rebucci, T. Xu, and R. Chang. 2012. “China's Emergence in
REFERENCES GLOBAL ECONOMIC PROSPECTS | JANUARY 2016 171
Economic Commission for Latin America and the Caribbean.
Eichengreen, B., and A. Rose. 2003. “Does It Pay to Defend against a Speculative Attack?” In Managing Currency Crises in Emerging Markets, edited by M. Dooley and J. Frankel. Chicago, IL: University of Chicago Press.
EIU (Economist Intelligence Unit). 2015. “Americas Economy: A Looming El Niño Poses Severe Risks to Latin America.” October. London.
Estevadeordal, A. 2012. “Economic Integration in the Americas: An Unfinished Agenda.” In The Road to Hemispheric Cooperation: Beyond the Cartagena Summit of the Americas. Washington, DC: The Brookings Institution.
EBRD (European Bank for Reconstruction and Development). 2015a. Transition Report 2015-2016: Rebalancing Finance. London: European Bank for Reconstruction and Development.
______. 2015b. “Regional Economic Prospects in EBRD Countries of Operations: May 2015; In the Cross-currents of Diverging Monetary Policies and Russia's Recession.” European Bank for Reconstruction and Development, London.
European Commission (EC). 2015. “European Economic Forecast.” Institutional Paper 011, European Commission, Brussels.
Fagan, C. 2011. “Evidence of Illegal Cross-Border Flows of Funds, Goods and Services in South Asia and their Impact on Corruption.” U4 Anti-Corruption Resource Centre, CMI, Bergen, Norway.
Fajnzylber, P., and J. H. López. 2008. Remittances and Development: Lessons from Latin America. Washington, DC: World Bank.
Fiess, N. 2007. “Business Cycle Synchronization and Regional Integration: A Case Study for Central America.” World Bank Economic Review 21 (1): 49–72.
Fracasso, A. 2015. “Economic Rebalancing and Growth: The Japanese Experience and China’s Prospects.” Discussion Papers, Department of Economics and Management, University of Trento, Italy.
De la Torre, A., D. Lederman, and S. Pienknagura. 2015. “Doing it Right.” Finance and Development (September): 28-30.
De, P., S. Raihan, and E. Ghani. 2013. “What Does MFN Trade Mean for India and Pakistan? Can MFN be a Panacea?” Policy Research Working Paper 6483, World Bank, Washington, DC.
De, P., Raihan, S., and S. Kathuria. 2012. “Unlocking Bangladesh-India Trade: Emerging Potential and the Way Forward.” Policy Research Working Paper 6155, World Bank, Washington, DC.
Del Caprio, X. V., and M. Wagner. 2015. “The Impact of Syrian Refugees on the Turkish Labor Market.” Policy Research Working Paper 7402, World Bank, Washington, DC.
Ding, D. and I. Masha. 2012. “India's Growth Spillovers to South Asia.” IMF Working Paper No. 12/56, International Monetary Fund, Washington, DC.
Dobbs, R., S. Lund, J. Woetzel, and M. Mutafchieva. 2015. “Debt and (Not Much) Deleveraging.” McKinsey Global Institute.
Dollar, D., and A. Kraay. 2003. “Institutions, Trade, and Growth.” Journal o f Monetary Economics 50 (1): 133–62.
Drummond, P. F. N., and G. Ramirez. 2009. "Spillovers from the Rest of the World into Sub-Saharan African Countries." IMF Working Paper 09/155, International Monetary Fund, Washington, DC.
Duval, R. A., M. K. C. Cheng, K. H. Oh, R. Saraf, and M. D. Seneviratne. 2014. “Trade Integration and Business Cycle Synchronization: A Reappraisal with Focus on Asia.” IMF Working Paper 14/52, International Monetary Fund, Washington, DC.
Easterly, W., N. Fiess, and D. Lederman. 2003. “NAFTA and Convergence in North America: High Expectations, Big Events, Little Time.” Economia 4(1): 1-53.
ECLAC. 2014. Regional Integration: Towards an Inclusive Value Chain Strategy. Santiago, Chile:

CHAPTER 2 GLOBAL ECONOMIC PROSPECTS | JANUARY 2016 172
Economy.” In World Economic Outlook (Chapter 4). Washington, DC: International Monetary Fund.
_______. 2011a. “Japan: Spillover Report for the 2011 Article IV Consultation and Selected Issues.” International Monetary Fund, Washington, DC.
______. 2012a. Regional Economic Outlook: Western Hemisphere; Rebuilding Strength and Flexibility. Washington, DC: International Monetary Fund.
______. 2012b. “Nigeria and South Africa: Spillovers to the Rest of Sub-Saharan Africa.” In Regional Economic Outlook: Sub-Saharan Africa. Washington, DC: International Monetary Fund.
______. 2012c. “Saudi Arabia: Selected Issues.” IMF Country Report No 12/272, International Monetary Fund, Washington, DC.
______. 2013. “Output Synchronicity in the Middle East, North Africa, Afghanistan, and Pakistan and in the Caucasus and Central Asia.” In World Economic Outlook (Box 3.1). Washington, DC: International Monetary Fund.
______. 2014a. World Economic Outlook: Recovery Strengthens, Remains Uneven. Washington, DC: International Monetary Fund.
______. 2014b. “IMF Multilateral Policy Issues Report; Spillover Report.” IMF Policy Paper, International Monetary Fund, Washington, DC.
______. 2014c. Regional Economic Outlook Update: Middle East and Central Asia (May). International Monetary Fund, Washington, DC.
______. 2014d. “Potential Spillovers from Remittances from the Cooperation Council for the Arab States of the Gulf (GCC) and Russia.” In Spillover Report (Box 8). Washington, DC: International Monetary Fund.
______. 2014e. “India – Selected Issues.” IMF Country Report No 14/58. International Monetary Fund, Washington, DC.
______. 2014f. “Nigeria 2013 Article IV Consultation—Staff Report.” International Monetary Fund, Washington, DC.
______. 2015a. Regional Economic Outlook:
Freund, C., and M. Jaud. 2015. Champions Wanted: Promoting Exports in the Middle East and North Africa. Washington, DC: World Bank.
Gill, I. S., I. Izvorski, W. Van Eeghen, and D. De Rosa. 2014. Diversified Development: Making the Most of Natural Resources in Eurasia. Washington, DC: World Bank.
Gurara, D. Z., and M. Ncube. 2013. "Global Economic Spillovers to Africa: A GVAR Approach." Working Paper Series 183, African Development Bank, Tunis.
Husabø, E. 2014. “Spillovers to Europe from the Crisis in Russia and Ukraine.” Economic Commentaries Series 6, Norges Bank.
Hooley, J. 2013. “Bringing Down the Great Wall? Global Implications of Capital Account Liberalisation in China.” Quarterly Bulletin 2013, Q4. Bank of England, London.
Husain, A., R. Arezki, P. Breuer, V. Haksar, T. Helbling, P. Medas, and M. Sommer. 2015. “Global Implications of Lower Oil Prices.” IMF Staff Discussion Note 15/15, International Monetary Fund, Washington, DC.
Ianchovichina, E., S. Devarajan, and C. Lakatos. Forthcoming. “The Lifting of Sanctions on Iran: Global Effects and Strategic Responses.” Working Paper, World Bank, Washington, DC.
Ianchovichina, E., and M. Ivanic. 2014. “Economic Effects of the Syrian War and the Spread of the Islamic State on the Levant.” Policy Research Working Paper 7135, World Bank, Washington, DC.
Ilahi, N., F. M. Alturki, and J. Espinosa-Bowen. 2009. “How Russia Affects the Neighborhood: Trade, Financial, and Remittance Channels.” IMF Working Paper 09/277, International Monetary Fund, Washington, DC.
IDB (Inter-American Development Bank). 2015. The Labyrinth: How Can Latin America and the Caribbean Navigate the Global Economy. Washington, DC: Inter-American Development Bank.
International Monetary Fund. 2007. “Decoupling the Train? Spillovers and Cycles in the Global

REFERENCES GLOBAL ECONOMIC PROSPECTS | JANUARY 2016 173
Izquierdo, A., R. Romero, and E. Talvi. 2008. “Booms and Busts in Latin America: The Role of External Factors.” Working Paper 631, Inter-American Development Bank, Washington, DC.
Jelassi, T., A. B. Zeghal, and T. Malzy. 2015. “Fundamentally Changing the Way We Educate Students in the Middle East and North Africa (MENA) Region.” Working Paper, North Africa Policy Series, African Development Bank, Abidjan.
Kabundi, A., and E. Loots. 2007. “Co-movement Between South Africa and the Southern African Development Community: An Empirical Analysis.” Economic Modelling 24 (5): 737-48.
Kathuria, S., S. Sohaib, and M. J. Ferrantino. 2015. “How has Regional Integration Taken Place in Other Regions? Lessons for South Asia.” SARConnect Issue 2. World Bank, Washington, DC.
Keefer, P., and S. Knack. 2007. “Boondoggles, Rent-Seeking, and Political Checks and Balances: Public Investment under Unaccountable Governments.” Review of Economics and Statistics 89 (3): 566-72.
Kemal, A. R., 2005, “SAFTA and Economic Cooperation.” http://www.southasianmedia.net/conference/Regional_Conference/safta.htm
Khalifa, A., S. Hammoudeh, and E. Otranto. 2013. “Patterns of Volatility Transmission Within Regime Switching Across GCC and Global Markets.” International Review of Economics and Finance 29: 512-24.
Kim, M., Le Lesle, V., F. Ohnsorge, and S. Seshadri. 2014. “Why Complementarity Matters for Stability—Hong Kong SAR, China and Singapore as Asian Financial Centers.” IMF Working Paper 14/119, International Monetary Fund, Washington, DC.
Kinfack, C. E., and L. Bonga-Bonga. 2015. “Trade Linkages and Business Cycle Co-movement: An Empirical Analysis of Africa and its Main Trading Partners using Global VAR.” Economic Research Southern Africa (ESRA) Working Paper 512, Johannesburg.
Asia and Pacific. Washington, DC: International Monetary Fund.
______. 2015b. “2015 Spillover Report.” International Monetary Fund, Washington, DC.
______. 2015c. “People’s Republic of China: Staff Report for the 2015 Article IV Consultation.” International Monetary Fund, Washington, DC.
______. 2015d. “Malaysia 2015 Article IV Consultation—Staff Report.” International Monetary Fund, Washington, DC.
______. 2015e. “Thailand Article IV Consultations—Staff Report.” International Monetary Fund, Washington, DC.
______. 2015f. “Central, Eastern, and Southeastern Europe: Reconciling Fiscal Consolidation and Growth.” Regional Economic Issues series. November. International Monetary Fund, Washington, DC.
______. 2015g. Regional Economic Outlook: Middle East and Central Asia. (October). Washington, DC: International Monetary Fund.
______. 2015h. Regional Economic Outlook: Western Hemisphere; Northern Spring, Southern Chills. April. Washington, DC: International Monetary Fund.
______. 2015i. World Economic Outlook: Adjusting to Lower Commodity Prices Washington, DC: World IMF.
______. 2015j. Global Financial Stability Report: Vulnerabilities, Legacies, and Policy Challenges. Washington, DC: International Monetary Fund.
______. 2015k. “Spillovers from Surges in Global Financial Market Volatility: India.” IMF Country Report 15/62, International Monetary Fund, Washington, DC.
______. 2015l. Pan-African Banks: Opportunities and Challenges for Cross-Border Oversight. Washington, DC: International Monetary Fund.
Inoue, T., D. Kay, and H. Ohshige. 2015. “The Impact of China’s Slowdown on the Asia Pacific Region: An Application of the GVAR Model.” Policy Research Working Paper 7442, World Bank, Washington, DC.
CHAPTER 2 GLOBAL ECONOMIC PROSPECTS | JANUARY 2016 174
“Regional Integration: What in It for CARICOM?” BID-INTAL Working Paper 29.
Obiora, K. 2009. “Decoupling from the East Toward the West? Analyses of Spillovers to the Baltic Countries.” IMF Working Paper, 09/125, International Monetary Fund, Washington, DC.
OECD. 2009, “Participation in Global Value Chains (GVC).” http://www.oecd-ilibrary.org/trade/interconnected-economies/gvc-participation-index-2009_9789264189560-graph5-en.
______. 2015. “Participation in Global Value Chains (GVC).” https://data.oecd.org/trade/participation-in-global-value-chains-gvc.htm. Accessed on November 1, 2015.
Österholm, P., and J. Zettelmeyer. 2008. “The Effect of External Conditions on Growth in Latin America.” IMF Staff Papers 55 (4): 595-623.
Park, D., and K. Shin. 2015. “Financial Integration in Asset and Liability Holdings in East Asia.” ADB Economic Working Paper 444, Asian Development Bank, Manila, Philippines.
Palit, A., and G. Spittel, eds. 2013. South Asia in the New Decade: Challenges and Prospects. Singapore: World Scientific Singapore.
Piccio, L. 2015. “India's 2015-16 Foreign Aid Budget: Where the Money is Going?” DEVEX (blog). https://www.devex.com/news/india-s-2015-16-foreign-aid-budget-where-the-money-is-going-85666.
Rajaram, A., T. Minh Le, K. Kaiser, J-H. Kim, and J. Frank. 2014. The Power o f Public Investment Management: Transforming Resources into Assets for Growth. Washington, DC: World Bank.
Roache, S. K. 2008. “Central America’s Regional Trends and U.S. Cycles.” IMF Working Paper 08/50, International Monetary Fund, Washington, DC.
Romalis, J. 2007. “NAFTA’s and CUSFTA’s Impact on International Trade.” The Review of Economics and Statistics 89 (3): 416–35.
Romero-Torres, J., S. Wells, and S. Selwyn-Khan. 2013. Development of Capital Markets in Member Countries of the South Asian Association for Regional
Kose, M. A., C. Otrok, and C. H. Whiteman. 2003. “International Business Cycles: World, Region, and Country-Specific Factors.” American Economic Review 93(4): 1216–39.
Kose, M. A., A. Rebucci, and A. Schipke. 2005. “Macroeconomic Implications of CAFTA-DR”. In Central America: Global Integration and Regional Cooperation, edited by M. Rodlauer and A. Schipke.Washington, DC: International Monetary Fund.
Kose, M. A., G. M. Meredith, and C. M. Towe. 2005. “How Has NAFTA Affected the Mexican Economy? Review and Evidence.” In Monetary Policy and Macroeconomic Stabilization in Latin America. Berlin: Springer.
Kumar, U. 2014. “India's Demographic Transition: Boon or Bane?” Asia & the Pacific Policy Studies 1 (1): 186–203.
Lakatos, C., M. Maliszewska, and I. Osorio-Rodarte. 2015. “China’s Slowdown and Rebalancing: Potential Growth and Poverty Impacts on Sub-Saharan Africa.” Unpublished Paper, World Bank, Washington, DC.
Lam, R., X. Liu, and A. Schipke. “China’s Labor Market in the “New Normal.” IMF Working Paper 15/151, International Monetary Fund, Washington, DC.
Lederman, D., W. F. Maloney, and L. Servén. 2005. Lessons from NAFTA for Latin America and the Caribbean. The World Bank and Stanford University Press.
Loayza, N., H. Lopez, A. Ubide. 2001. “Comovements and Sectoral Interdependence: Evidence for Latin America, East Asia, and Europe.” IMF Staff Papers 48 (2): 367–96.
Lopez, J. H., and R. Shankar. 2011. Getting the Most Out of Free Trade Agreements in Central America. Washington, DC: World Bank.
Mejía-Reyes, P. 2004. “Classical Business Cycles in America: Are National Business Cycle Synchronised?” International Journal o f Applied Econometrics and Quantitative Studies 1 (3): 75–102.
Moreira, M. M., and E. Mendoza. 2007.

REFERENCES GLOBAL ECONOMIC PROSPECTS | JANUARY 2016 175
American Journal of Economics and Finance 14 (3): 319–342.
UNCTAD. 2015. World Investment Report 2015: Reforming International Investment Governance. United Nations Conference on Trade and Development. Geneva: United Nations Publications.
United Nations Conference on Trade and Development (UNCTAD). 2013. Economic Development in Africa—Intra-African Trade: Unlocking Private Sector Dynamism. New York: United Nations.
USTR (United States Trade Representative). 2015. USTR website. https://ustr.gov/trade-agreements/free-trade-agreements/cafta-dr-dominican-republic-central-america-fta.
Villarreal, M. A. 2012. “Mexico’s Free Trade Agreements.” CRS Report for Congress 7-5700, Congressional Research Service, Washington, DC.
Vivek, A., and A. Vamvakidis. 2010. “China’s Economic Growth: International Spillovers.” IMF Working Paper 10/165, International Monetary Fund, Washington, DC.
Wilson, J. S., and T. Ostuki. 2005. “Trade Facilitation and Regional Integration in South Asia: Accelerating the Gains to Trade with Capacity Building.” South Asia Region, World Bank, Washington DC.
World Bank. 2005. Global Economic Prospects: Trade, Regionalism, and Development. Washington, DC: World Bank.
______. 2012a. “Road Freight in Central America: Five Explanations to High Costs of Service Provision.” Background Paper, World Bank, Washington, DC.
______. 2012b. “Africa Can Help Feed Africa: Removing Barriers to Regional Trade in Food Staples.” World Bank, Washington, DC.
______. 2013a. “Trends and Determinants of Foreign Direct Investment in South Asia.” World Bank, Washington, DC.
______. 2013b. “South Asia Economic Focus, Fall 2013: A Wake Up Call.” World Bank, Washington, DC.
Cooperation. Mandaluyong City, Philippines: Asian Development Bank.
Rouis, M., S. Tabor, S. Migliorisi, E. Neumayer, and K. R. Kounetsron. 2010. Arab Development Assistance: Four Decades of Cooperation. Washington, DC: World Bank.
Rouis, M. 2013. “Response of the Arab Donors to the Global Financial Crisis and the Arab Spring.” MENA Quick Note Series 112, World Bank, Washington, DC.
Scholvin, S., and A. Malamud. 2014. “Is There a Geoeconomic Node in South America? Geography, politics and Brazil’s Role in Regional Economic Integration.” Working Paper 2014/2, Instituto de Ciências Sociais da Universidade de Lisboa, Spain.
Schiffbauer, M., A. Sy, S. Hussain, H. Sahnoun, and P. Keefer. 2015. Jobs or Privileges: Unleashing the Employment Potential of the Middle East and North Africa. Washington, DC: World Bank.
Shiells, C. R., M. Pani, and E. Jafarov. 2005. “Is Russia Still Driving Regional Economic Growth?” IMF Working Paper 05/192, International Monetary Fund, Washington, DC.
Stepanyan, A., A. Roitman, G. Manasyan, D. Ostojic, and N. Epstein. 2015. “The Spillover Effects of Russia’s Economic Slowdown on Neighboring Countries.” Departmental Paper, International Monetary Fund, Washington, DC.
Swiston, A. 2010. “Spillovers to Central America in Light of the Crisis: What a Difference a Year Makes.” IMF Working Paper 10/35, International Monetary Fund, Washington, DC.
Talani, L. S. 2014. The Arab Spring in the Global Political Economy. Basingstoke, UK: Palgrave Macmillan.
Taneja, N., and S. Pohit. 2005. “Informal Trade in India, Nepal, and Sri Lanka.” In Economic Development in South Asia, edited by Mohsin Khan. Noida, India: Tata McGraw-Hill.
Torres, A., and O. Vela. 2003. “Trade Integration and Synchronization Between the Business Cycles of Mexico and the United States.” North

CHAPTER 2 GLOBAL ECONOMIC PROSPECTS | JANUARY 2016 176
______. 2015k. “Europe and Central Asia Economic Update, October 2015: Low Commodity Prices and Weak Currencies.” World Bank, Washington, DC.
______. 2015l. “Migration and Development Brief 25.” World Bank, Washington, DC.
______. 2015m. “Sustaining Recovery, Improving Living Standards.” EU Regular Economic Report (2), Fall 2015, World Bank, Washington, DC.
______. 2015n. Global Economic Prospects: Having Fiscal Space and Using It. Washington, DC: World Bank.
______. 2015o. “Commodity Markets Outlook, October 2015: Understanding El Niño.” World Bank, Washington, DC.
______. 2015p. “MENA Economic Monitor, October 2015: Inequality, Uprisings, and Conflict in the Arab World.” World Bank, Washington, DC.
______. 2015q. “MENA Economic Monitor, April 2015: Towards a New Social Contract.” World Bank, Washington, DC.
______. 2015r. “Africa’s Pulse. Volume 12.” World Bank, Washington, DC.
______. 2016. Global Economic Prospects: Spillovers amid Weak Growth. Washington, DC: World Bank.
World Economic Forum. 2015. World Travel and Tourism Competitiveness Index 2015. World Economic Forum.
World Tourism Organization (UNWTO). 2015. “UNWTO Tourism Highlights, 2015 Edition.” World Tourism Organization, Madrid.
______. 2014a. “Costa Rica: Five Years After CAFTA-DR Assessing Early Results for the Costa Rican Economy.” World Bank, Washington, DC.
______. 2014b. Over the Horizon: A New Levant. Washington, DC: World Bank.
______. 2014c. “The Republic of Benin Diagnostic Trade Integration Study (DTIS) Update: From Rents to Competitiveness.” World Bank, Washington, DC.
______. 2015a. Global Economic Prospects: The Global Economy in Transition. Washington, DC: World Bank.
______. 2015b. “China Economic Update, June 2015.” World Bank, Washington, DC.
______. 2015c. “East Asia and Pacific Economic Update, October 2015: Staying the Course.” World Bank, Washington, DC.
______. 2015d. “Malaysia Economic Monitor, June 2015: Transforming Urban Transport.” World Bank. Washington, DC.
______. 2015e. “Indonesia Economic Quarterly, October 2015: In Times of Global Volatility.” World Bank, Washington, DC.
______. 2015f. Doing Business 2016: Measuring Regulatory Quality and Efficiency. Washington, DC: World Bank.
______. 2015g. “Mongolia Economic Update, November 2015.” World Bank, Washington, DC.
______. 2015h. “Taking Stock, July 2015: An Update on Vietnam’s Recent Economic Developments.” World Bank, Washington, DC.
______. 2015i. “Philippines Economic Update, January 2015: Making Growth Work for the Poor.” World Bank, Washington, DC.
_______. 2015j. Global Monitoring Report 2015/2016: Development Goals in an Era of Demographic Change. Washington, DC: World Bank.