global economy & indo european maritime trade …...dsv air & sea pvt ltd 1073 reudan...
TRANSCRIPT
Global Economy & Indo European Maritime Trade
An Overview
Seahorse Ship Agencies Pvt Ltd compilation Sept 2019 An Indian Perspective

Seahorse Ship Agencies

Seahorse Ship Agencies

Contents
Global Economy & trade – An outlook
Economy & trade – an EU perspective
Indian Economy & trade
Indo - Eu trade
Factors influencing Indo- EU trade
Top 20 Importers/Exporters in the Indo - EU arena
Haropa in Indian Media

Global growth remains subdued US further increased tariffs on
certain Chinese imports and China retaliated.
Global technology supply chains threatened by the prospect of US sanctions, Brexit-related uncertainty continued, and rising geopolitical tensions roiled energy prices.
Accordingly, global trade, which is intensive in machinery and consumer durables, remains sluggish.
The projected growth pickup in 2020 is precarious, presuming stabilization in currently stressed emerging market and developing economies.
Global Trade & Shipping Industry- Subdued Momentum
Global Growth Still Sluggish Global growth is projected at 3.2 percent for 2019, improving to 3.5 percent in 2020.- IMF

Trading economics GDP Growth Rate in Euro Area is expected to be 0.10 percent by the end of this quarter.. Looking forward, estimate GDP Growth Rate in Euro Area to stand at 0.30 in 12 months time. In the long-term, the Euro Area GDP Growth Rate is projected to trend around 0.50 percent in 2020..
WRT Europe… Growth continues.. But slower
Source :Trading Economics

Trading economics
GDP Annual Growth Rate in India is expected to be 6.70 percent by the end of this quarter. Looking forward, estimate GDP Annual Growth Rate in India to stand at 7.10 in 12 months time. In the long-term, the India GDP Annual Growth Rate is projected to trend around 6.50 percent in 2020..
India – Global Economic Major-Stable & Positive
Source :Trading Economics

Global Trade & Shipping Industry WTO trade indicator suggests further weakening of trade growth into Q3 of 2019
VUCA Continues WTO Trade Barometer released 15th Aug 2019
The loss of momentum & below-trend expansion in merchandise trade is predicted to persist.
Sustained weakness in index was driven by below trend values in air freight ,electronic components, export orders , automobile production & sales , agricultural raw materials etc although they show some signs of having bottomed out.
Only the index for container shipping was close to the baseline value of 100.

DHL Global Trade Barometer reflects deteriorating global trade Amidst prevailing negative sentiment in private sector June, 2019
• The negative outlook is to a large extent affected by decline in China and US. • Trade conflict between US and China is leading to a shift in trade routes and supply chains,
may be responsible for softening the impact on a global level. • Furthermore, Japan , India and South Korea are expected to lose momentum in the short
term, while Germany and UK are relatively stab
UK shows improved outlook despite unresolved Brexit
Germany and India maintain a positive growth outlook
US and China reveal sharply lower trade volumes

India’s Trade Growth remains positive amidst global contraction Despite prolonged volatility, predicted to Grow in Q3 2019, albeit at a slower rate. June, 2019
India is only one of four countries in Asia tracked by the Global Trade Barometer to still register an index value of above 50. India’s historic pace of trade growth has so far cushioned it somewhat against global contractionary sentiment. Nevertheless, the country’s marked slowdown in trade growth suggests businesses remain reluctant to overexpose themselves to global trade volatility.” said Niki Frank, Managing Director for DHL Global Forwarding India.
• Robust ocean trade to continue, with imports showing strong growth
• Trade in auto & Parts, Temperature Controlled goods, Basic and Industrial Raw Materials continues to grow

A Seahorse compilation- Inputs from Drewry reports
Global Trade & Shipping Industry- Trends & Issues
Nearshoring /
regionalisation
Product
Miniaturisation
Digital
Disrupters
3D/4D Printing Geopolitical
Risk
Economic
Growth
Regulatory
Uncertainty
Tariff barriers
and trade wars
BREXIT, IMO 2020 Sulphur cap regulations , Over capacity & Depressed Global scenario continue to be the main determinants for near future
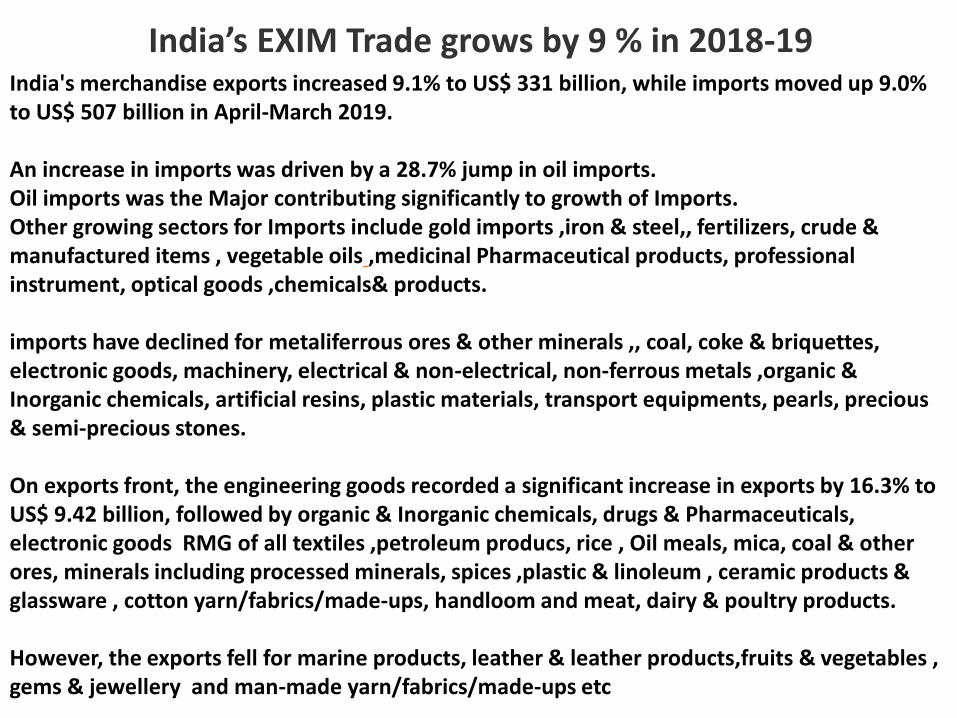
India’s EXIM Trade grows by 9 % in 2018-19 India's merchandise exports increased 9.1% to US$ 331 billion, while imports moved up 9.0% to US$ 507 billion in April-March 2019. An increase in imports was driven by a 28.7% jump in oil imports. Oil imports was the Major contributing significantly to growth of Imports. Other growing sectors for Imports include gold imports ,iron & steel,, fertilizers, crude & manufactured items , vegetable oils ,medicinal Pharmaceutical products, professional instrument, optical goods ,chemicals& products. imports have declined for metaliferrous ores & other minerals ,, coal, coke & briquettes, electronic goods, machinery, electrical & non-electrical, non-ferrous metals ,organic & Inorganic chemicals, artificial resins, plastic materials, transport equipments, pearls, precious & semi-precious stones. On exports front, the engineering goods recorded a significant increase in exports by 16.3% to US$ 9.42 billion, followed by organic & Inorganic chemicals, drugs & Pharmaceuticals, electronic goods RMG of all textiles ,petroleum producs, rice , Oil meals, mica, coal & other ores, minerals including processed minerals, spices ,plastic & linoleum , ceramic products & glassware , cotton yarn/fabrics/made-ups, handloom and meat, dairy & poultry products. However, the exports fell for marine products, leather & leather products,fruits & vegetables , gems & jewellery and man-made yarn/fabrics/made-ups etc

Cargo handled by Indian ports in April’19 rose the most in the last six months despite drop in iron ore, fertiliser and other merchandise volumes.
Volume growth at India’s ports increased by 5.7 percent in April, greater than the long-term average growth rate of 4.5 percent, according to data compiled from Indian Ports Association website and Goldman Sachs.
Ports across the country handled 60.07 Million tonnes of cargo in April, according to a Goldman Sachs report.
The higher growth rate was led by liquid cargo, coal and containers.
Liquid cargo—oil and gas related products—volumes grew nearly 15.6 percent compared with last year, or the highest in over a year, according to Goldman Sachs.
Coal volumes, too, jumped after four months of decline, rising 18 percent to 1.64 million tonnes in April.
Fertiliser volumes, however, declined as much as 36 percent to 0.74 Million tonnes over last year, the lowest in two years
VUCA continues – Indian Cargo volumes flat in Q1 (19-20)
Indian Cargo Volumes rise to a six month high in April-19

EU is India's largest trading partner, accounting for €91.5 billion worth of trade in goods in 2018 (13% of total India trade)
· India is the EU’s 9th largest trading partner, accounting for 2.3% of EU’s total trade in goods.
· Trade in goods between the EU and India almost doubled in the last decade.


India’s External Trade in Goods- FRANCE – (Ebmbassy o f India- MECR)
French Exports to India in Million €
Commodity 2017 2018 % Growth
Aircraft, spacecraft, and parts 2265.2 2633.7 16.27
Nuclear reactors, machinery etc 810.43 699 -13.75
Electrical machinery and parts 725.03 546.46 -24.63
Optical, precision parts 218.79 259.35 18.54
Organic chemicals 155.58 163.59 5.15
Plastics and articles thereof 134.93 140.19 3.9
Miscellaneous chemical products 92.52 115.67 25.02
Pharmaceutical products 114.65 114.62 -0.03
Iron and steel 106.38 114.13 7.28
Essential oils, perfumery etc 55.83 62.87 12.6
Total 5346.6 5529.3 3.42
French Imports from India in Million €
Commodity 2017 2018 % Growth
Mineral fuels, oils and products etc 549.97 1079.9 96.35
Apparel and clothing not knitted 516.32 502.96 -2.59
Apparel and clothing knitted 474.38 477.29 0.61
Nuclear reactors, machinery etc 407.41 437.03 7.27
Organic chemicals 276.88 343.28 23.98
Electrical machinery and parts etc 301.06 288.7 -4.1
Footwear and parts etc 252.04 255.74 1.47
Vehicles and parts etc 338.31 248.78 -26.46
Precious stones etc 175.03 204.1 16.61
Optical, precision parts etc 144.01 186.28 29.35
Total 5362 5993 11.77

Seahorse Ship Agencies
India’s exports to France by 11.7 %
include
• Mineral fuels & oils • Optical, medical, surgical precision parts • Gems and jewellery • Organic Chemicals • Nuclear, boilers, Machinery • Footwear
Include
• Automobile & parts • Electrical Machinery • Knitted & non knitted apparel & clothing
accessories
French exports to India by 3.42 %
include
• Miscellaneous chemical producst • Essential oils & perfumery • Optical, medical, surgical precision parts • Organic chemicals • Plastics and articles thereof • Aircraft, space craft etc • Iron & steel include
• Electrical Machinery • Nuclear, boilers, Machinery • Pharmaceutical products.
Potential for enhancement of Indian exports to France Apparel, Articles, clothing & accessories ( both knotted & non knitted) Pharma products Plastic & articles
India France bilateral trade Jan-Dec 2018, stood at € 11.52 billion (+7.6%)

Seahorse Ship Agencies
India’s exports to France by 9.06 %
include
• Mineral fuels & oils • Gems and jewellery • Organic Chemicals • Leather articles & accessories • Electrical Machinery • Automobiles & Parts • Nuclear, Boilers, Machinery etc
Include
• Footwear • Not knitted apparel & clothing accessories
French exports to India by 24.7 %
include
• Iron & steel • Pharmaceuticals & products • Organic Chemicals • Miscellaneous chemical products • Optical, medical, surgical precision parts • Plastics and articles thereof • Aircraft, space craft etc include
• Electrical Machinery • Nuclear, boilers, Machinery
Potential for enhancement of Indian exports to France Apparel, Articles, clothing & accessories ( both knotted & non knitted) Pharma products Plastic & articles
India France bilateral trade Jan-May 2019, stood at € 5.09 billion (+15.33%)
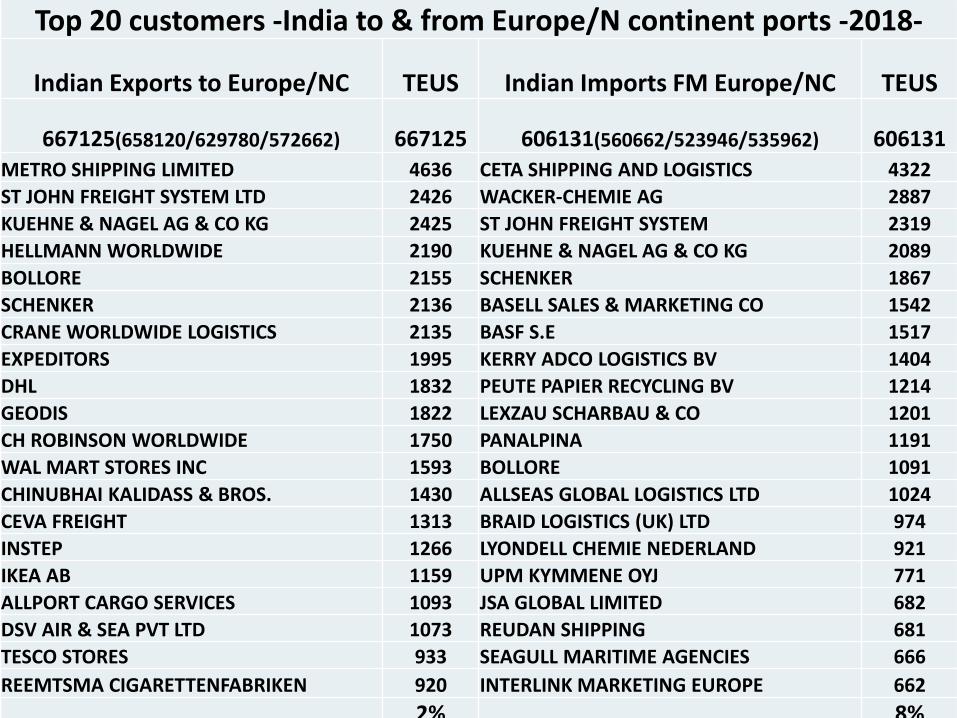
Top 20 customers -India to & from Europe/N continent ports -2018-
Indian Exports to Europe/NC TEUS Indian Imports FM Europe/NC TEUS
667125(658120/629780/572662) 667125 606131(560662/523946/535962) 606131
METRO SHIPPING LIMITED 4636 CETA SHIPPING AND LOGISTICS 4322
ST JOHN FREIGHT SYSTEM LTD 2426 WACKER-CHEMIE AG 2887
KUEHNE & NAGEL AG & CO KG 2425 ST JOHN FREIGHT SYSTEM 2319
HELLMANN WORLDWIDE 2190 KUEHNE & NAGEL AG & CO KG 2089
BOLLORE 2155 SCHENKER 1867
SCHENKER 2136 BASELL SALES & MARKETING CO 1542
CRANE WORLDWIDE LOGISTICS 2135 BASF S.E 1517
EXPEDITORS 1995 KERRY ADCO LOGISTICS BV 1404
DHL 1832 PEUTE PAPIER RECYCLING BV 1214
GEODIS 1822 LEXZAU SCHARBAU & CO 1201
CH ROBINSON WORLDWIDE 1750 PANALPINA 1191
WAL MART STORES INC 1593 BOLLORE 1091
CHINUBHAI KALIDASS & BROS. 1430 ALLSEAS GLOBAL LOGISTICS LTD 1024
CEVA FREIGHT 1313 BRAID LOGISTICS (UK) LTD 974
INSTEP 1266 LYONDELL CHEMIE NEDERLAND 921
IKEA AB 1159 UPM KYMMENE OYJ 771
ALLPORT CARGO SERVICES 1093 JSA GLOBAL LIMITED 682
DSV AIR & SEA PVT LTD 1073 REUDAN SHIPPING 681
TESCO STORES 933 SEAGULL MARITIME AGENCIES 666
REEMTSMA CIGARETTENFABRIKEN 920 INTERLINK MARKETING EUROPE 662
2% 8%

Top 20 customers -India to & from Le Havre port -2018-
Indian Exports to Le Havre TEUS Indian Imports FM Le Havre TEUS
35214(34568/28252/29579) 35214 19467(14897/16878/17316) 19467 BOLLORE 1366 UPM KYMMENE OYJ 686
EMC CASINO SNC 700 BOLLORE 335
COREP 696 SEAWAY LOGISTICS PTY LTD 302
GEODIS 626 ANTHON B NILSEN 266
CH ROBINSON WORLDWIDE 598 TOTAL SA 224
DACHSER 444 CHETAK INTERNATIONAL PVT LTD 196
TRANSFER INTERNATIONAL SA 362 LOGISTIC LINKAGE INDIA PVT LTD 191
DHL 331 IRC SUPPLY CHAIN SOLUTIONS 186
CEVA FREIGHT 316 DAMCO 170
KUEHNE & NAGEL AG & CO KG 310 KUEHNE & NAGEL AG & CO KG 159
REEMTSMA CIGARETTENFABRIKEN 280 BASF S.E 153
ST JOHN FREIGHT SYSTEM 275 ECU LINE LTD 151
SCHENKER 254 AMATRANS 146
REITZEL INDIA PVT LTD 235 STOLT TANK CONTAINERS 112
PIRAMAL GLASS LIMITED 192 ARKEMA 91
HERPORT SA 191 BDG INTERNATIONAL 86
SIPLEC 171 HOYER GLOBAL 69
RENAULT SAS 167 GKN FREIGHT SERVICES LTD 69
INSTEP 148 LANXESS EUROPE GMBH & CO KG 61
AGILITY LOGISTICS PVT LTD 127 NESTLE SA HEADQUARTERS 60
2% 30%

Top 20 customers -India to & from Ports in UK -2018- Indian Exports to UK Ports TEUS Indian Imports FM UK Ports TEUS
185638 185638 120683 120683
METRO SHIPPING 4597 CETA SHIPPING AND LOGISTICS LTD 4245
WAL MART STORES 1593 ST JOHN FREIGHT SYSTEM 2112
CRANE WORLDWIDE LOGISTICS 1478 ALLSEAS GLOBAL LOGISTICS LTD 1018
EXPEDITORS 1390 BRAID LOGISTICS (UK) LTD 730
KUEHNE & NAGEL AG & CO KG 863 JSA GLOBAL LIMITED 682
CH ROBINSON WORLDWIDE 862 INTERLINK MARKETING EUROPE LIMITED 662
ALLPORT CARGO SERVICES 838 SEAGULL MARITIME AGENCIES PVT LTD 658
HELLMANN WORLDWIDE 819 REUDAN SHIPPING 593
TESCO STORES 763 KUEHNE & NAGEL AG & CO KG 529
MIRZA INTERNATIONAL 661 BRUNEL LOGISTICS (UK) LTD 522
SCHENKER 653 IMERYS 505
DAVIES TURNER & COMPANY 632 DIAGEO GREAT BRITAIN LTD 495
DAMCO 523 CEVA FREIGHT 421
MARKS & SPENCER GROUP 517 SCHENKER 410
INSTEP 495 YUSHI LIMITED 388
IKEA AB 492 MANUFACTURE FR DE PNEUS MICHELIN 277
BOLLORE 481 DHL 225
LV SHIPPING 463 WARRANT GROUP LTD 225
FLEXPORT INTERNATIONAL 431 EXXON MOBIL CORPORATION 215
DHL 399 UNIEXPRESS LTD 210
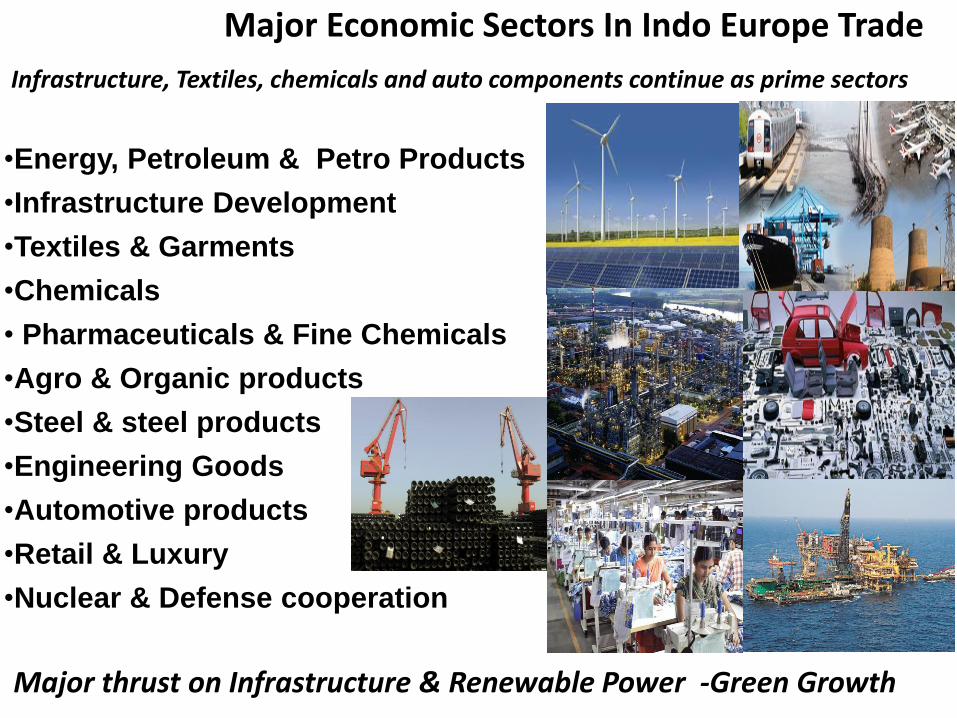
•Energy, Petroleum & Petro Products
•Infrastructure Development
•Textiles & Garments
•Chemicals
• Pharmaceuticals & Fine Chemicals
•Agro & Organic products
•Steel & steel products
•Engineering Goods
•Automotive products
•Retail & Luxury
•Nuclear & Defense cooperation
Major thrust on Infrastructure & Renewable Power -Green Growth
Major Economic Sectors In Indo Europe Trade
Infrastructure, Textiles, chemicals and auto components continue as prime sectors
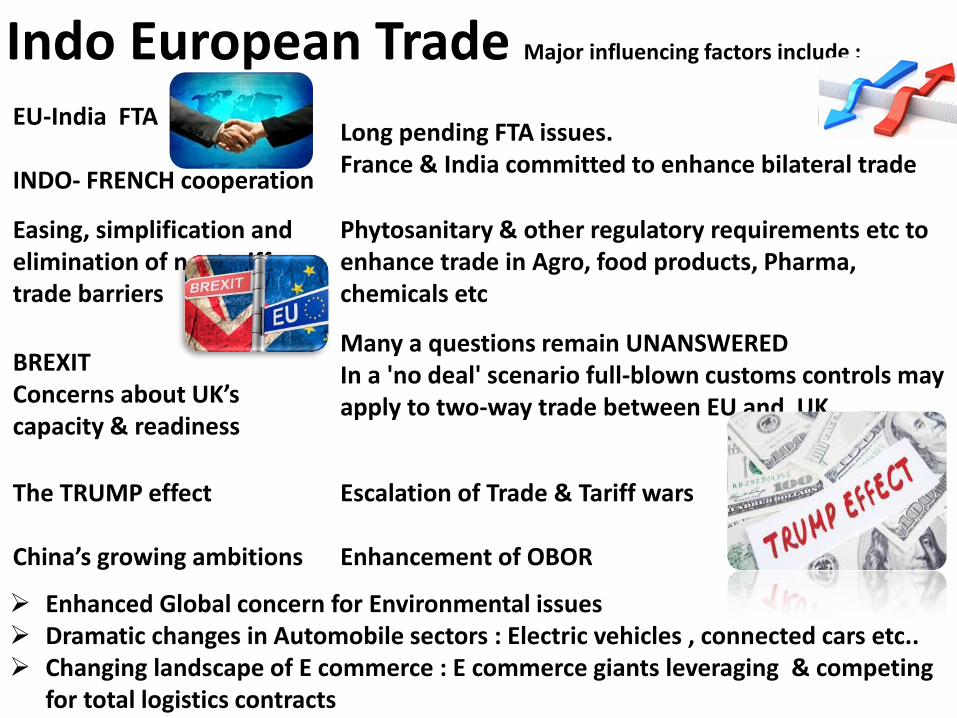
Enhanced Global concern for Environmental issues Dramatic changes in Automobile sectors : Electric vehicles , connected cars etc.. Changing landscape of E commerce : E commerce giants leveraging & competing
for total logistics contracts
EU-India FTA INDO- FRENCH cooperation
Long pending FTA issues. France & India committed to enhance bilateral trade
Easing, simplification and elimination of nontariff trade barriers
Phytosanitary & other regulatory requirements etc to enhance trade in Agro, food products, Pharma, chemicals etc
BREXIT Concerns about UK’s capacity & readiness
Many a questions remain UNANSWERED In a 'no deal' scenario full-blown customs controls may apply to two-way trade between EU and UK
The TRUMP effect China’s growing ambitions
Escalation of Trade & Tariff wars Enhancement of OBOR
Indo European Trade Major influencing factors include :
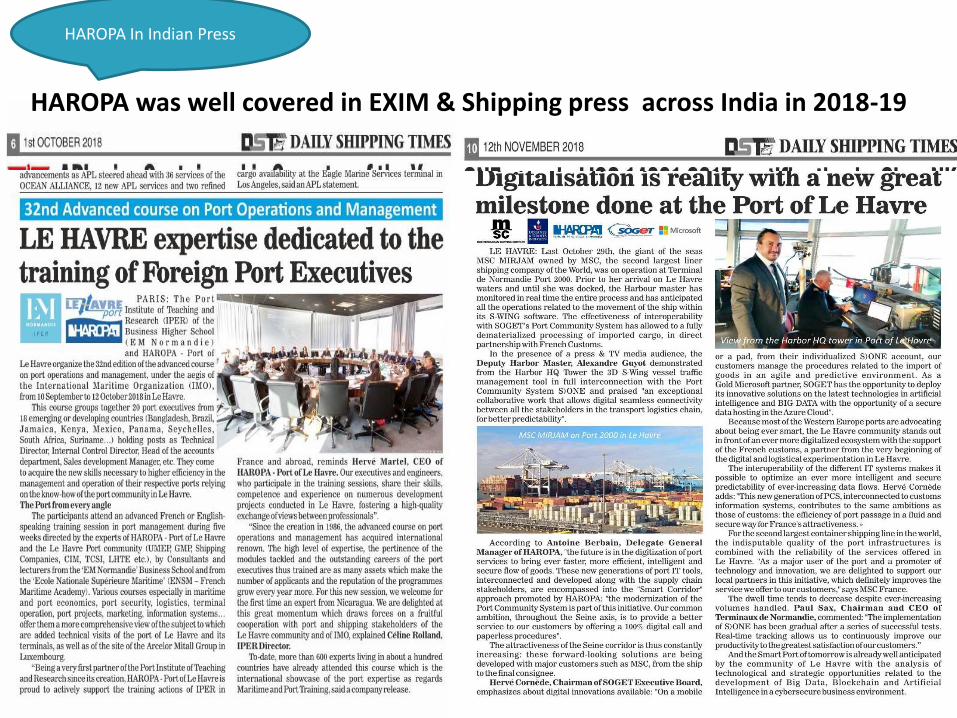
HAROPA was well covered in EXIM & Shipping press across India in 2018-19
HAROPA In Indian Press

https://www.nagpurtoday.in/indo-french-investment-conclave-aims-to-promote-industrialization-in-the-region/11022148


Maritime Gateway March’19
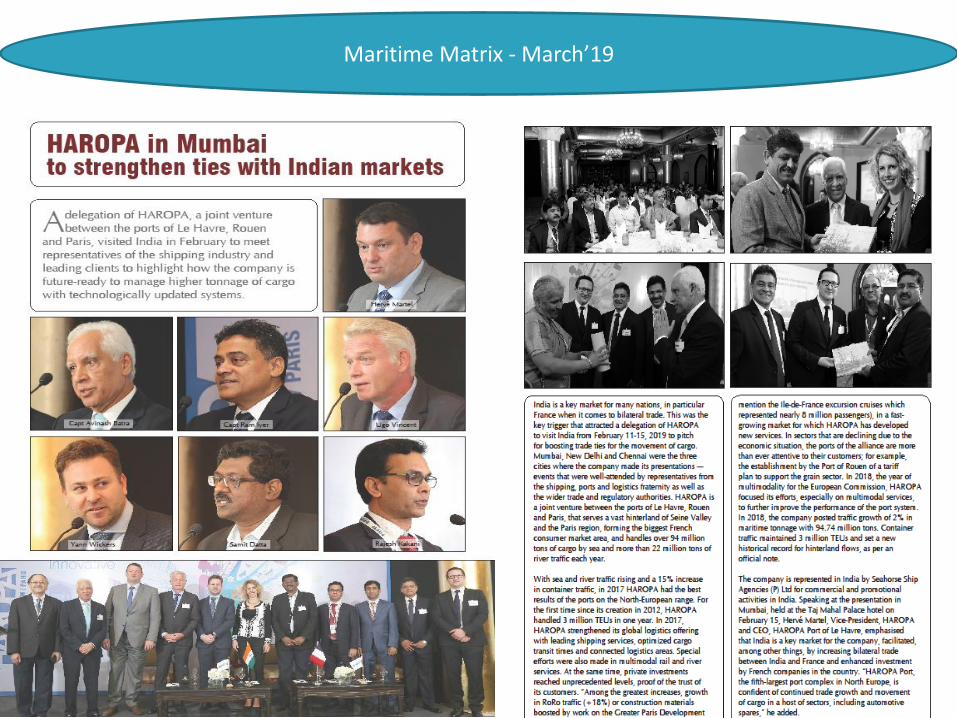
Maritime Matrix - March’19


Merci Pour
Votre aimable attention