global education in 10 charts....global education in 10 charts. everything you need to know about...
TRANSCRIPT

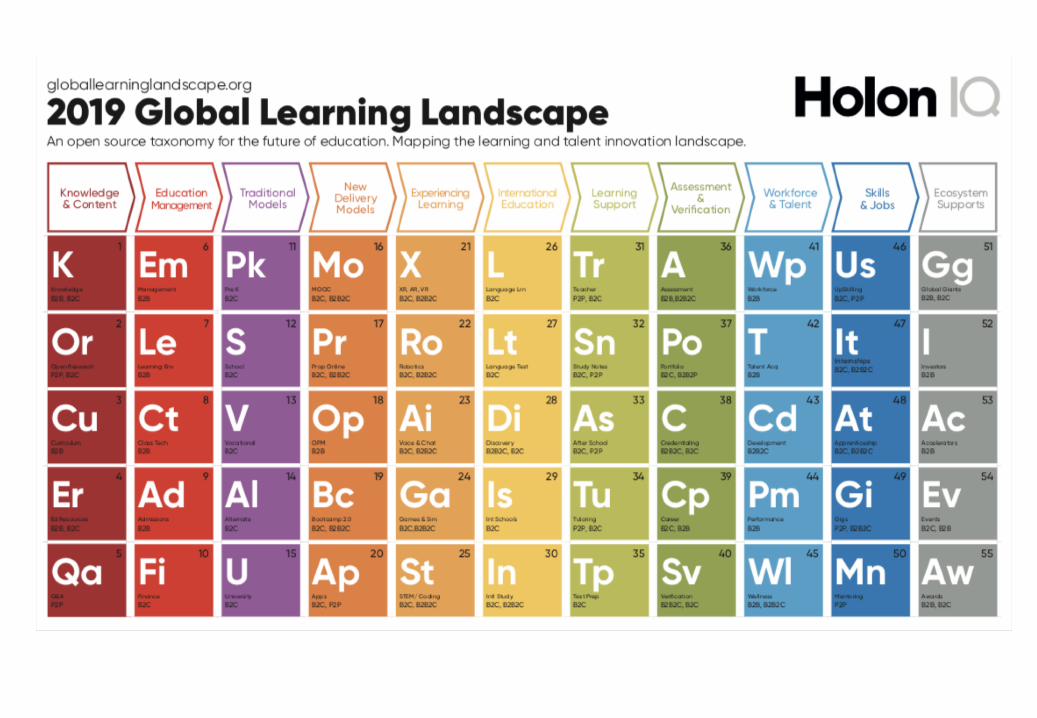
Global Education in 10 Charts. Everything you need to know about the Global Education Technology Market in 10 charts.
www.holoniq.comFebruary 2019

WHO WE ARE
We are building the world's smartest source of global education intelligence to power decisions that matter.

Global Education Market Expenditure
5% 25% 50% 75% 95%
Source: HolonIQ, Smart Estimates™ January 2019
Total Global Education Expenditure in USD trillions
$2.8T$3.5T
$4.2T$5.2T
$5.9T
$7.8T
$10.0T
0123456789
10
2000A 2005A 2010A 2015A 2018E 2025E 2030E

Global Population Growth
5% 25% 50% 75% 95%
-100
-50
0
50
100
150
200
250
300
350
400
Under 15 No Education Primary Secondary Post Secondary
2018-2025 2025-2030
Total change in global population by highest level of education attainment (millions of people)
Source: Wittgenstein Centre

Global vs Education Capital Flows
5% 25% 50% 75% 95%
Source. HolonIQ, World Health Organization, Goldman Sachs. Standard & Poors. All figures are rounded estimates based on source research.
$90T
$80T
$10T
$5T $6T
$150BGlobal GDP Global
Market CapGlobal
HealthcareMarket
GlobalHealthcareMarket Cap
GlobalEducation
Market
GlobalEducation
Market Cap
Global Markets in USD

Education is a Digitisation Outlier
5% 25% 50% 75% 95%
Education Technology vs Total Global Education Expenditure
Source: HolonIQ
<3%Digitisation
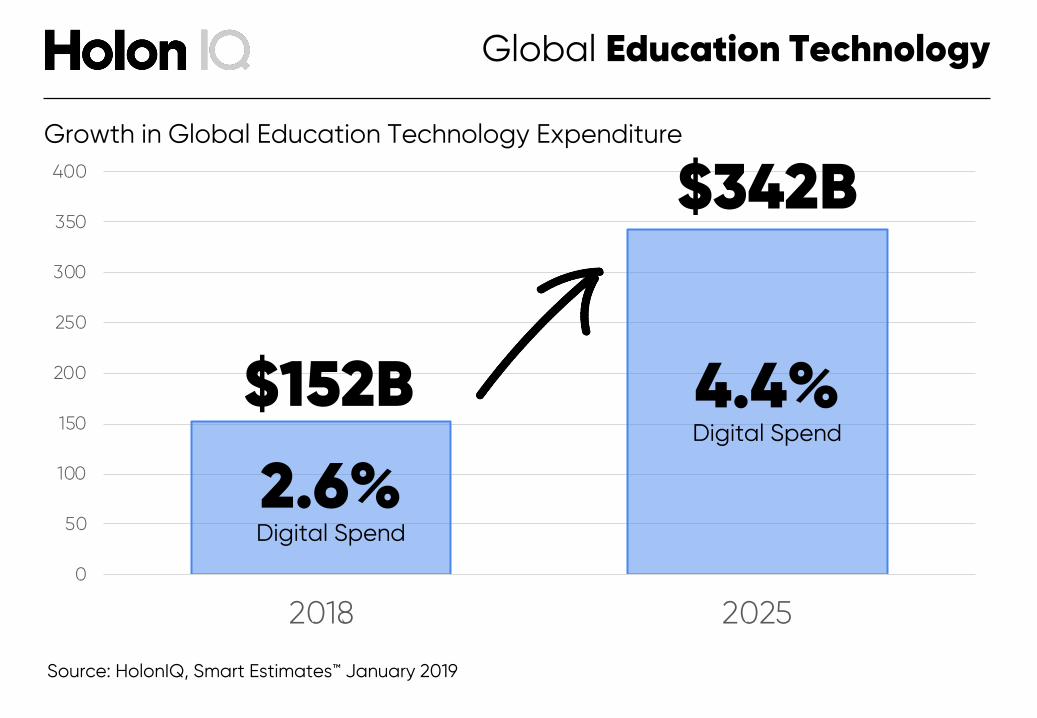
Global Education Technology
5% 25% 50% 75% 95%
Growth in Global Education Technology Expenditure
Source: HolonIQ, Smart Estimates™ January 2019
0
50
100
150
200
250
300
350
400
2018 2025
$152B
$342B
2.6% Digital Spend
4.4% Digital Spend

Global Advanced Technology
5% 25% 50% 75% 95%
Advanced Education Technology Expenditure 2018-2025, USD Billions
Source: HolonIQ, Smart Estimates™ January 2019
0
2
4
6
8
10
12
14
AR/VR AI Robotics Blockchain
2018 2025
1.8B
12.6B
0.8B
6.1B
1.3B
3.1B
0.1B 0.6B2018 2025

Global Education Venture Capital
5% 25% 50% 75% 95%
0
1
2
3
4
5
6
7
8
9
2014 2015 2016 2017 2018
Global Education Venture Capital Investment, 2014-2018 USD Billions
Source: HolonIQ, January 2019
1.8B
4.2B3.2B
4.4B
8.2B

Global Education Venture Capital
5% 25% 50% 75% 95%
Global Education Venture Capital Investment, 2014-2018 USD Billions
Source: HolonIQ, January 2019
0
1
2
3
4
5
6
2014 2015 2016 2017 2018
0
1
2
3
4
5
6
2014 2015 2016 2017 2018
0
1
2
3
4
5
6
2014 2015 2016 2017 2018
0
1
2
3
4
5
6
2014 2015 2016 2017 2018
0.6B
2.0B1.6B
2.3B
5.2B
0.05B 0.1B 0.2B 0.4B 0.7B
1.0B1.5B 1.1B 1.3B 1.6B
0.07B 0.1B 0.1B 0.3B 0.5B

Listed Education Companies > $1B
5% 25% 50% 75% 95%
0
20
40
60
80
100
120
2015 2018 2025
Listed Education Companies with Market Cap > USD $1B
Source: HolonIQ, January 2019
~10~30
>100